
Portable Sequentially Shifted Excitation Raman Spectroscopy to Examine Historic Powders Enclosed in Glass Vials


Abstract
:1. Introduction
2. Materials and Methods
2.1. Materials
2.2. Benchtop and Portable Sequentially Shifted Excitation (pSSE) Raman Spectroscopy
2.3. Optical Coherence Tomography (OCT)
3. Results
3.1. Examination of Glass Containers
3.2. Demonstration of pSSE Raman Identification of White Material Enclosed in a Glass Vial
3.3. Performance Comparison of pSSE and Bench Dispersive RS
3.3.1. White and Yellow Materials in Glass Vials
3.3.2. Orange, Red, and Brown Materials in Glass Vials
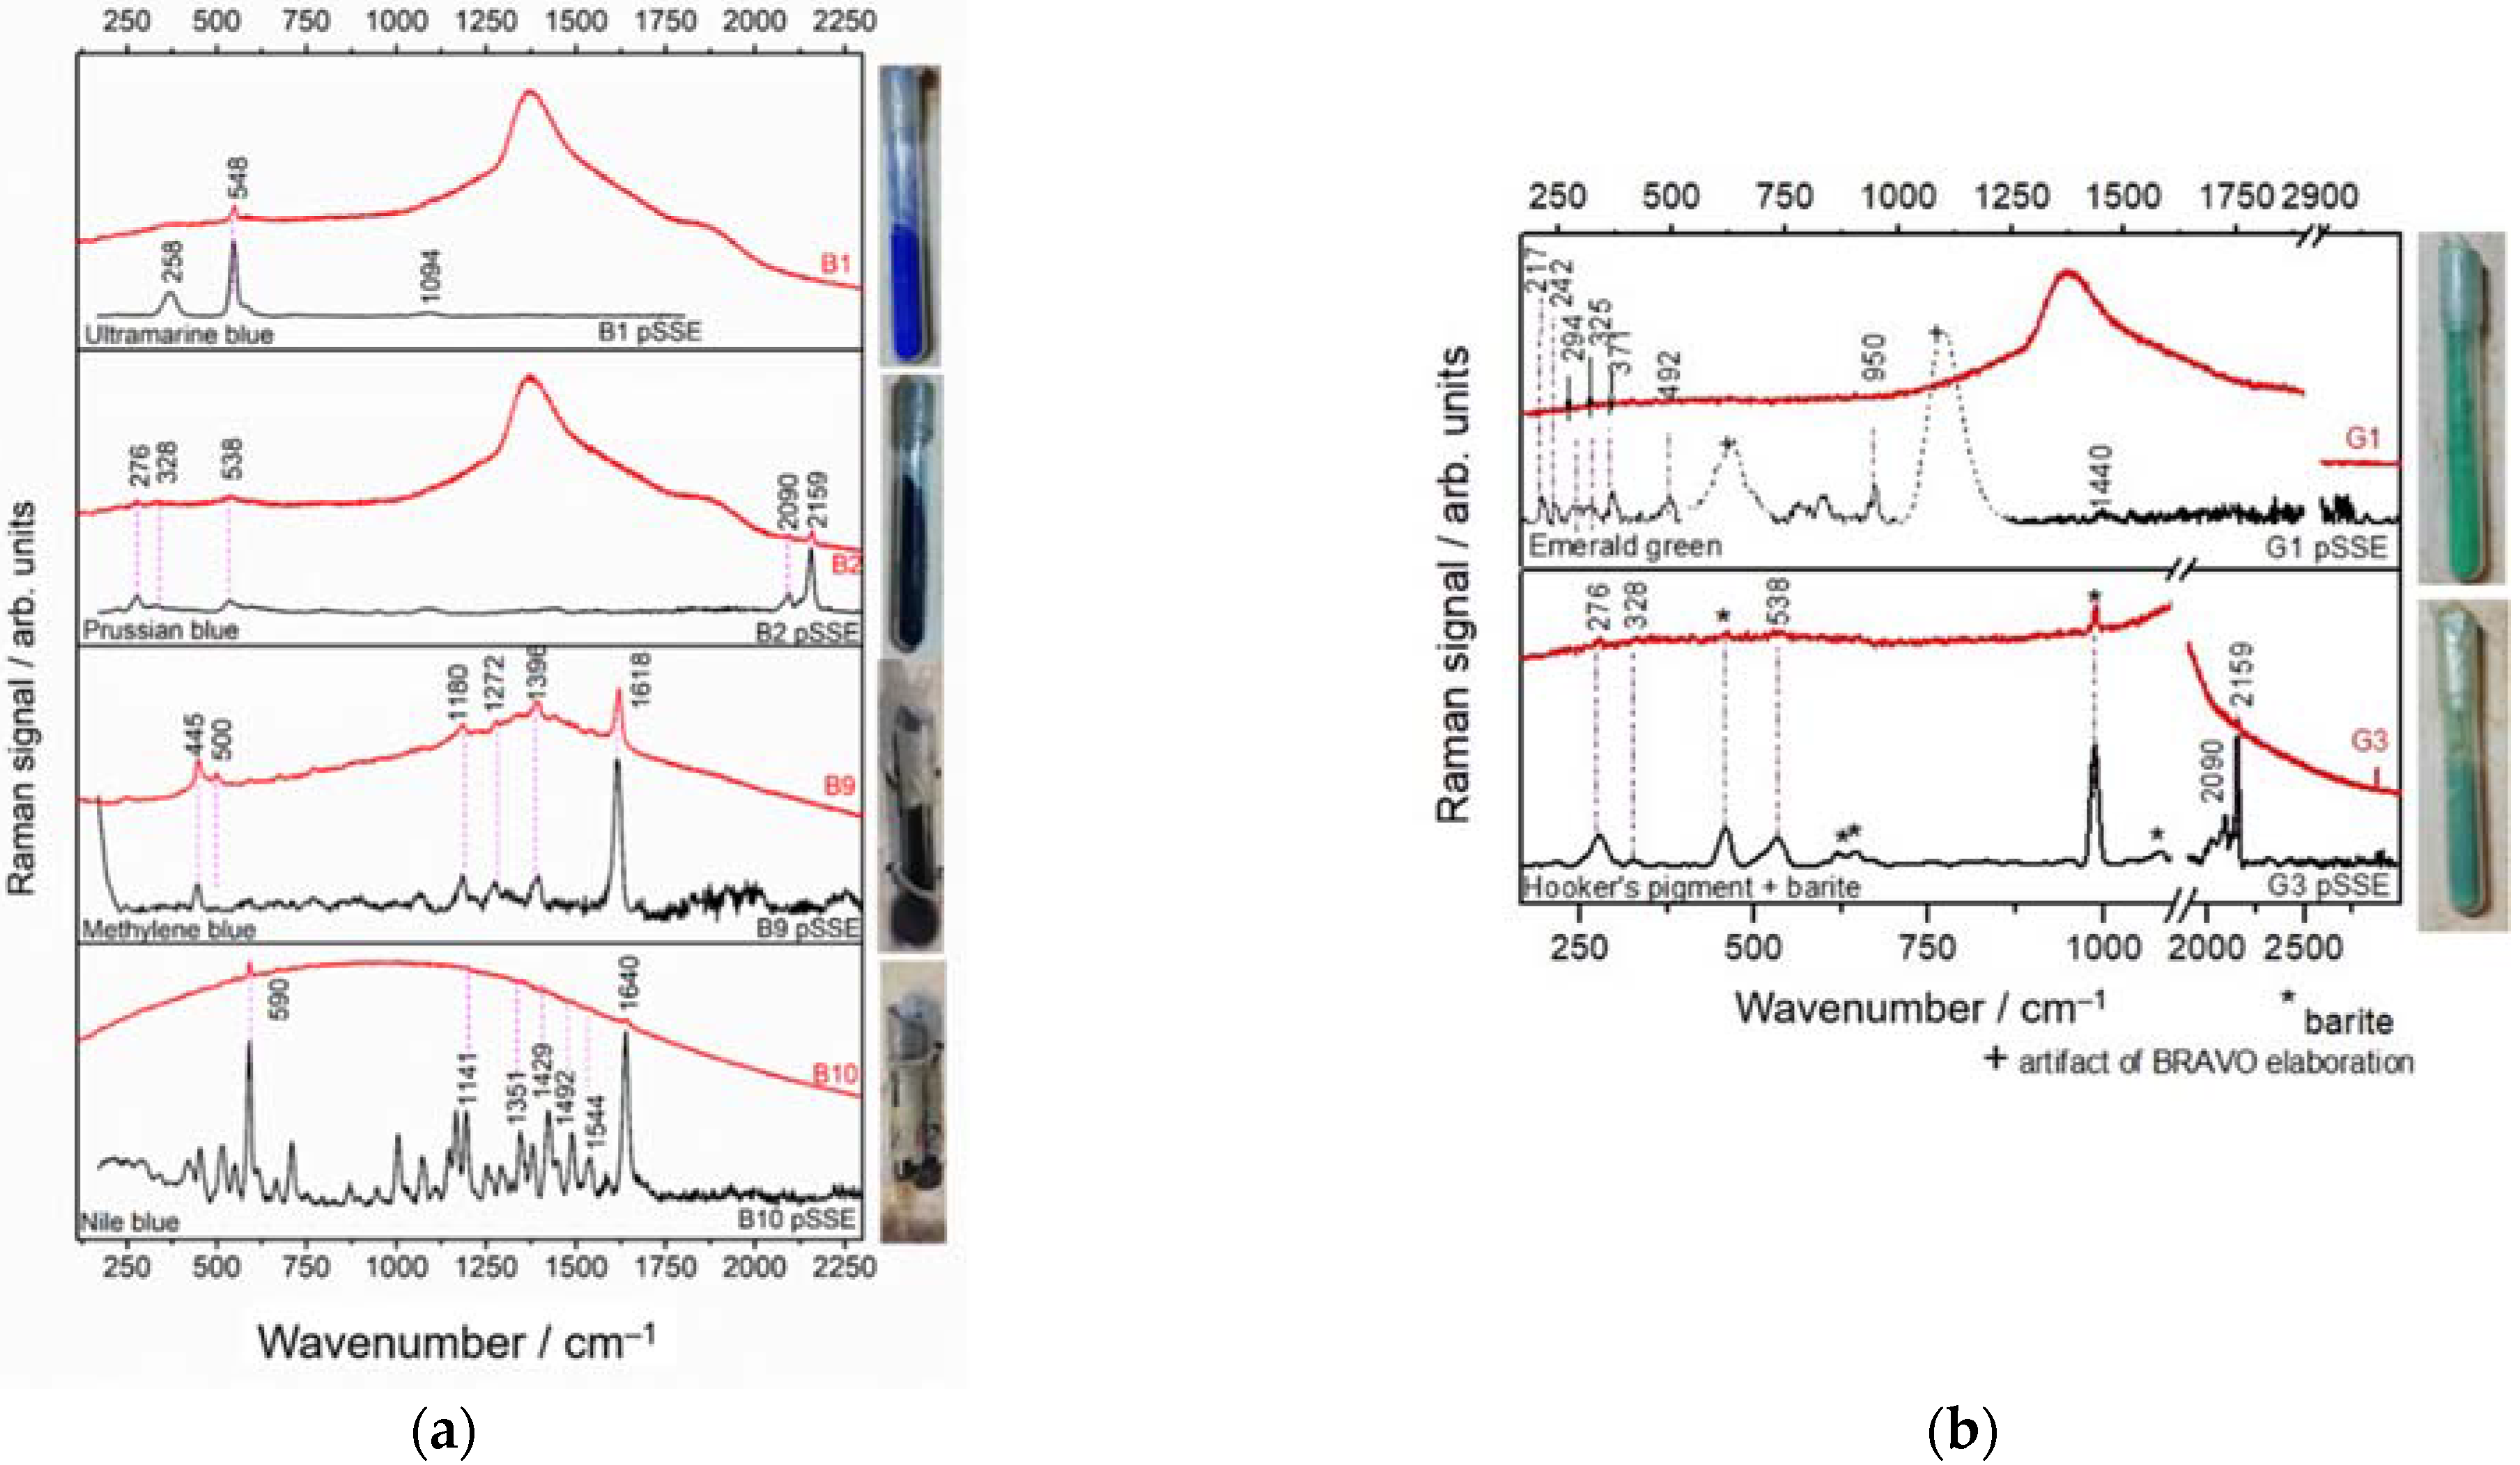
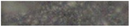
3.3.3. Blue and Green Materials in Glass Vials
3.3.4. Violet and Black Materials in Glass Vials
4. Discussion and Conclusions
Author Contributions
Funding
Institutional Review Board Statement
Informed Consent Statement
Data Availability Statement
Acknowledgments
Conflicts of Interest
Appendix A

| Sample | Bands (cm−1) | Assignment | Material |
|---|---|---|---|
| W1, W2, W3, W4, Y3, Y6, P1 | 1085 •, 1064 ▼, 1052 + | νCO32− | • CaCO3, ▼ (Zn5(OH)6(CO3)2, + 2PbCO3·Pb(OH)2 |
| 711 •, 733 ▼ | δCO32− | ||
| 151 •, 254 •, 506 • | CO32− Lattice mode | ||
| W6, W8, Y1, Y2, Y4, Y7, G3, R1, R2, R4 | 1167 ♦, 1143 ♦, 1139 *, 1085 ♦ | νasymSO42− | CaSO4·2H2O *, BaSO4 ♦ |
| 1008 *, 989 ♦, | νsymSO42− | ||
| 648 ♦, 619 ♦, 461 ♦,494 *, 420 * | δSO42− | ||
| Y3, Y6, O2, O3 | 550 †, 391 †, 312 †, 150 †, 142 ∆ | νPb-O | ∆ β-PbO, † Pb3O4 |
| 121 † | δPb-O | ||
| Y2, Y5, R3, R4, M1, M3 | 494, 222 | νFe-O | αFe2O3, |
| 612, 290, 240 | δFe-O, | FeO(OH)nH2O, αFe2O3 | |
| 407 | νsym Fe-O-Fe/-OH | ||
| O1, Y1, Y2, Y4, Y7 | 946 ⊗ | νasymCrO3 | ⊗ K2CrO, □ 4ZnCrO4·K2O·3H2O, ◊ PbCrO4, |
| 904 ⊗872 □, 841 ◊ | νsymCrO3 | ||
| 365 ⊗ | δCrO3 | ||
| 558 ⊗ | νsymCr-O-Cr | ||
| 220 ⊗ | δCr-O-Cr | ||
| G1, G2 | 950 | νC-C | Cu(C2H3O2)2·3Cu(AsO2)2 |
| 1440 | ν−CO2 | ||
| 242, 217 | arsenite moieties | ||
| B1, B4, B5, B6 | 258 | δ S3− | (Na, Ca)8(AlSiO4)6(SO4, S, Cl)2 |
| 548 | νsym S3− | ||
| 1094 | 1νsym S3− | ||
| B2, B7, B8 | 2159, 2090 | νCN | Fe4[Fe(CN)6]3 |
| 328, 276 | δFe-C-N-Fe | ||
| 538 | νFe-C | ||
| N2, N3, N4, N5, N6 | 1584-1570 | C-C D2 band | Carbon black |
| 1370-1357 | C-C D1 band |
| Sample | Bands (cm−1) | Assignment | Class | Material |
|---|---|---|---|---|
| R1, R2 | 745 | νsym(C-S) | Azo | PR 57:1 (C.I. 15850:1), ‡ Not identified |
| 1179 | νsym(C-N) | |||
| 1230 | ν (C–N) | |||
| ‡ 1445, 1364 | νsym (-N=N-) | |||
| 1491 | ν(CC) | |||
| 1603, ‡ 1595 | νsym(C=N) | |||
| ‡ 1139 | δsym(C-N) | |||
| B9 | 445, 500 | δ(C-N-C) | Triaminotriphenylmethane | AB 93 (C.I. 42780), Methylene Blue |
| 1180 | νsym(C=N) | |||
| 1272, 1396 | C-H | |||
| 1618 | ν(C–C) | |||
| B10 | 590 | Ring-breathing | Oxazine | BB 12 (C.I. 51180), Nile Blue |
| 1640 | νEthylenic- motions | |||
| P1 | 1188 | δ(CCC)/ν(CN) | triaminotriphenylmethane basic | PB14 (C.I. 42600:1) |
| 1280 | − | |||
| 1340 | − | |||
| 1380 | ν(CcenterC) | |||
| 1589 | ν(C-C)ring | |||
| 1617 | ν(C-C)ring | |||
| P2, P3 | 1179 ‡, 1176 | νsym(CCC)/δ (CCC)breathing/δrocking(CH3) | Triarylmethane | ‡ Not identified, BV3 (C.I. 42555:2), Crystal violet |
| 1330 | ν Phenyl-N | |||
| 1411 ‡ | Aromatic ring | |||
| 1589 | ν(C-C) ring | |||
| 1642 ‡, 1621 | νsym(C-C) |
References
- Smith, E.; Dent, G. Modern Raman Spectroscopy—A Practical Approach; John Wiley & Sons: Chichester, UK, 2005; pp. 1–20. [Google Scholar]
- Lahlil, S.; Lebon, M.; Beck, L.; Rousselière, H.; Vignaud, C.; Reiche, I.; Menu, M.; Paillet, P.; Plassard, F. The first in situ micro-Raman spectroscopic analysis of prehistoric cave art of Rouffignac St-Cernin, France. J. Raman Spectrosc. 2012, 43, 1637–1643. [Google Scholar] [CrossRef]
- Lauwers, D.; Hutado, A.G.; Tanevska, V.; Moens, L.; Bersani, D.; Vandenabeele, P. Characterisation of a portable Raman spectrometer for in situ analysis of art objects. Spectrochim. Acta Part A Mol. Biomol. Spectrosc. 2014, 118, 294–301. [Google Scholar] [CrossRef] [PubMed]
- Conti, C.; Botteon, A.; Bertasa, M.; Colombo, C.; Realini, M.; Sali, D. Portable Sequentially Shifted Excitation Raman spectroscopy as an innovative tool for: In situ chemical interrogation of painted surfaces. Analyst 2016, 141, 4599–4607. [Google Scholar] [CrossRef] [PubMed] [Green Version]
- Jehlička, J.; Culka, A.; Bersani, D.; Vandenabeele, P. Comparison of seven portable Raman spectrometers: Beryl as a case study. J. Raman Spectrosc. 2017, 48, 1289–1299. [Google Scholar] [CrossRef] [Green Version]
- Varetti, E.L.; Baran, E.J. Raman or Fluorescence Spectra? About the Use of FT-Raman Techniques on Inorganic Compounds. Appl. Spectrosc. 1994, 48, 1028–1029. [Google Scholar] [CrossRef]
- Handbook of Vibrational Spectroscopy; Chalmers, J.M.; Peter, R.; Griffiths, P.R. (Eds.) John Wiley & Sons: Hoboken, NJ, USA, 2006. [Google Scholar]
- Cooper, J.B.; Marshall, S.; Jones, R.; Abdelkader, M.; Wise, K.L. Spatially compressed dual-wavelength excitation Raman spectrometer. Appl. Opt. 2014, 53, 3333–3340. [Google Scholar] [CrossRef] [PubMed]
- Kostamovaara, J.; Tenhunen, J.; Kögler, M.; Nissinen, I.; Nissinen, J.; Keränen, P. Fluorescence suppression in Raman spectroscopy using a time-gated CMOS SPAD. Opt. Express 2013, 21, 31632–31645. [Google Scholar] [CrossRef]
- Zhang, D.; Ben-Amotz, D. Enhanced chemical classification of raman images in the presence of strong fluorescence interference. Appl. Spectrosc. 2000, 54, 1379–1383. [Google Scholar] [CrossRef]
- Cormack, I.G.; Mazilu, M.; Dholakia, K.; Herrington, C.S. Fluorescence suppression within Raman spectroscopy using annular beam excitation. Appl. Phys. Lett. 2007, 91, 023903. [Google Scholar] [CrossRef]
- Benniston, A.C.; Matousek, P.; McCulloch, I.E.; Parker, A.W.; Towrie, M. Detailed picosecond Kerr-gated time-resolved resonance Raman spectroscopy and time-resolved emission studies of merocyanine 540 in various solvents. J. Phys. Chem. A 2003, 107, 4347–4353. [Google Scholar] [CrossRef]
- Wolf, W.; Döring, H. Application of cheap lasers in shifted excitation Raman difference spectroscpy. In Proceedings of the Biophotonichs: Photonic Solutions for Better Health Care III, Brussels, Belgium, 8 May 2012. [Google Scholar] [CrossRef]
- Cooper, J.; Abdelkader, M.; Wise, K. Method and Apparatus for Acquiring Raman Spectra without Background Interferences. U.S. Patent 9,570,570B1, 29 October 2013. [Google Scholar]
- Bell, I.M.; Clark, R.J.H.; Gibbs, P.J. Raman spectroscopic library of natural and synthetic pigments (pre-∼1850 AD). Spectrochim. Acta Part A Mol. Biomol. Spectrosc. 1997, 53, 2159–2179. [Google Scholar] [CrossRef]
- Burgio, L.; Clark, R.J.H. Library of FT-Raman spectra of pigments, minerals, pigment media and varnishes, and supplement to existing library of Raman spectra of pigments with visible excitation. Spectrochim. Acta Part A Mol. Biomol. Spectosc. 2001, 57, 1491–1521. [Google Scholar] [CrossRef]
- Mazzoni, M.D. La donazione Bruschi-Vermehren. OPD Restauro 2008, 20, 346–348. [Google Scholar]
- Guo, C.; Li, D.; Kelly, D.P.; Li, H.; Ryle, J.P.; Sheridan, J.T. Measuring refractive index of glass by using speckle. Appl. Opt. 2018, 57, E205–E2017. [Google Scholar] [CrossRef]
- Turani, Z.; Fatemizadeh, E.; Xu, Q.; Daveluy, S.; Mehregan, D.; Nasiriavanaki, M. Refractive index correction in optical coherence tomography images of multilayer tissues. J. Biomed. Opt. 2018, 23, 070501. [Google Scholar] [CrossRef]
- Barton, S.J.; O’Dwyer, K.; Butler, M.; Dignam, A.; Byrne, H.J.; O’Neill, L.; Hennelly, B.M. Improved performance of near infrared excitation Raman spectroscopy using reflective thin-film gold on glass substrates for cytology samples. Anal. Methods 2019, 11, 6023–6032. [Google Scholar] [CrossRef] [Green Version]
- Prencipe, M.; Pascale, F.; Zicovich-Wilson, C.M.; Saunders, V.R.; Orlando, R.; Dovesi, R. The vibrational spectrum of calcite (CaCO3): An ab initio quantum-mechanical calculation. Phys. Chem. Miner. 2004, 31, 559–564. [Google Scholar] [CrossRef]
- Ghose, S. The crystal structure of hydrozincite, Zn5(OH)6(CO3)2. Acta Cryst. 1964, 17, 1051–1057. [Google Scholar] [CrossRef]
- Antao, S.M. Strictical trends for celestite SrSO4, anglesite (PbSO4), and barite (BaSO4): Confirmation of expected variations within the SO4 groups. Am. Mineral. 2012, 97, 661–665. [Google Scholar] [CrossRef]
- Karni, J.; Karni, E. Gypsum in construction: Origin and properties. Mater. Struct. 1995, 28, 92–100. [Google Scholar] [CrossRef]
- Simonsen, K.P.; Christiansen, M.B.; Vinum, M.G.; Sanyova, J.; Bendix, J. Single crystal X-ray structure of the artists’ pigment zinc yellow. J. Mol. Struct. 2017, 1141, 322–327. [Google Scholar] [CrossRef]
- Quareni, S.; de Pieri, R. A three-dimensional refinement of the structure of crocoite, PbCrO4. Acta Crystallogr. 1965, 19, 287–289. [Google Scholar] [CrossRef]
- Adams, D.M.; Christy, A.G.; Haines, J.; Clark, S.M. Second-order phase transition in PbO and SnO at high pressure: Implications for the litharge-massicot phase transformation. Phys. Rev. B Condens. Matter. 1992, 46, 11358–11367. [Google Scholar] [CrossRef] [PubMed]
- Olby, J.K. The basic lead carbonates. J. Inorg. Nucl. Chem. 1966, 28, 2507–2512. [Google Scholar] [CrossRef]
- Abdou, M.I.; El-Sayed Ahmed, H.; Wahab Gaber, M.A.; Fadl, A.M. Enhancement of anti-corrosion and mechanical properties of alkyd-based protective paints for steel petroleum structures incorporating natural limonite pigment. Cogent Eng. 2018, 5, 1427844. [Google Scholar] [CrossRef]
- McGinnety, J.A. Redetermination of the structures of potassium sulphate and potassium chromate: The effect of electrostatic crystal forces upon observed bond lengths. Acta Crystallogr. Sect. B Struct. Crystallogr. Cryst. Chem. 1972, 28, 2845–2852. [Google Scholar] [CrossRef]
- Gavarri, J.R.; Weigel, D. Oxydes de plomb. I. Structure cristalline du minium Pb3O4, à température ambiante (293 K). J. Solid State Chem. 1975, 13, 252–257. [Google Scholar] [CrossRef]
- Cudennec, Y.; Lecerf, A. The transformation of ferrihydrite into goethite or hematite, revisited. J. Solid State Chem. 2006, 179, 716–722. [Google Scholar] [CrossRef] [Green Version]
- Tarling, S.E.; Barnes, P.; Klinowski, J. The structure and Si, Al distribution of the ultramarines. Acta Crystallogr. Sect. B 1988, B44, 128–135. [Google Scholar] [CrossRef]
- Davidson, D.; Welo, L.A. The nature of prussian blue. J. Phys. Chem. 1928, 32, 1191–1196. [Google Scholar] [CrossRef]
- Rauf, M.A.; Meetani, M.A.; Khaleel, A.; Ahmed, A. Photocatalytic degradation of Methylene Blue using a mixed catalyst and product analysis by LC/MS. Chem. Eng. J. 2010, 157, 373–378. [Google Scholar] [CrossRef]
- Davis, M.M.; Hetzer, H.B. Titrimetric and Equilibrium Studies Using Indicators Related to Nile Blue A. Anal. Chem. 1966, 38, 451–461. [Google Scholar] [CrossRef]
- Keune, K.; Boon, J.J.; Boitelle, R.; Shimadzu, Y. Degradation of Emerald green in oil paint and its contribution to the rapid change in colour of the Descente des vaches (1834–1835) painted by Theédore Rousseau. Stud. Conserv. 2013, 58, 199–210. [Google Scholar] [CrossRef]
- Gabrielli, C.; Jaouhari, R.; Joiret, S.; Maurin, G. In situ Raman spectroscopy applied to electrochemical scaling. Determination of the structure of vaterite. J. Raman Spectrosc. 2000, 31, 497–501. [Google Scholar] [CrossRef]
- Hales, M.C.; Frost, R.L. Synthesis and vibrational spectroscopic characterisation of synthetic hydrozincite and smithsonite. Polyhedron 2007, 26, 4955–4962. [Google Scholar] [CrossRef] [Green Version]
- Bouchard, M.; Smith, D.C. Catalogue of 45 reference Raman spectra of minerals concerning research in art history or archaeology, especially on corroded metals and coloured glass. Spectrochim. Acta Part A Mol. Biomol. Spectrosc. 2003, 59, 2247–2266. [Google Scholar] [CrossRef]
- Kalendova, A.; Veselý, D.; Kalenda, P. A study of the effects of pigments and fillers on the properties of anticorrosive paints. Pigment Resin Technol. 2006, 35, 83–94. [Google Scholar] [CrossRef]
- Buzgar, N.; Buzatu, A.; Sanislav, I.V. The Raman study on certain sulfates. Analele Stiint. ale Univ. Al I Cuza 2009, 55, 5–23. [Google Scholar]
- Sarma, L.P.; Prasad, P.S.R.; Ravikumar, N. Raman Spectroscopic Study of Phase Transitions in Natural Gypsum. J. Raman Spectrosc. 1998, 29, 851–856. [Google Scholar] [CrossRef]
- Frost, R.L. Raman microscopy of selected chromate minerals. J. Raman Spectrosc. 2004, 35, 153–158. [Google Scholar] [CrossRef] [Green Version]
- Edwars, H.G.M. Analyticl Raman spectroscopic discimination between yellow pigments of the Renaissance. Spectrochim. Acta A Mol. Biomol. 2011, 80, 14–20. [Google Scholar] [CrossRef] [PubMed]
- Ramsey, G.D.; Xia, L.; Kendig, M.W.; McCreery, R.L. Raman spectroscopic analysis of the speciation of dilute chromate solutions. Corros. Sci. 2001, 43, 1557–1572. [Google Scholar] [CrossRef]
- Castro, M.A.; Pereira, F.J.; Aller, A.J.; Littlejohn, D. Raman spectrometry as a screening tool for solvent-extracted azo dyes from polyester-based textile fibres. Polym. Test. 2020, 91, 106765. [Google Scholar] [CrossRef]
- Chamritski, I.; Burns, G. Infrared- and raman-active phonons of magnetite, maghemite, and hematite: A computer simulation and spectroscopic study. J. Phys. Chem. B 2005, 109, 4965–4968. [Google Scholar] [CrossRef]
- Legodi, M.A.; de Waal, D. The preparation of magnetite, goethite, hematite and maghemite of pigment quality from mill scale iron waste. Dye. Pigment. 2007, 74, 161–168. [Google Scholar] [CrossRef]
- Aguayo, T.; Clavijo, E.; Eisner, F.; Ossa-Izquierdo, C.; Campos-Vallette, M.M. Raman spectroscopy in the diagnosis of the wall painting History of Concepción, Chile. J. Raman Spectrosc. 2011, 42, 2143–2148. [Google Scholar] [CrossRef]
- Osticioli, I.; Mendes, N.F.C.; Nevin, A.; Gil, F.P.S.C.; Becucci, M.; Castellucci, E. Analysis of natural and artificial ultramarine blue pigments using laser induced breakdown and pulsed Raman spectroscopy, statistical analysis and light microscopy. Spectrochim. Acta Part A Mol. Biomol. Spectrosc. 2009, 73, 525–531. [Google Scholar] [CrossRef] [Green Version]
- Barsan, M.M.; Butler, I.S.; Fitzpatrick, J.; Gilson, D.F.R. High-pressure studies of the micro-Raman spectra of iron cyanide complexes: Prussian blue (Fe4[Fe(CN)6]3), potassium ferricyanide (K3[Fe(CN)6]), and sodium nitroprusside (Na2[Fe(CN)5(NO)]·2H2O). J. Raman Spectrosc. 2011, 42, 1820–1824. [Google Scholar] [CrossRef]
- Xiao, G.-N.; Man, S.-Q. Surface-enhanced Raman scattering of methylene blue adsorbed on cap-shaped silver nanoparticles. Chem. Phys. Lett. 2007, 447, 305–309. [Google Scholar] [CrossRef]
- Lawless, M.K.; Mathies, R.A. Excited-state strcuture and electronic dephasing time of Nile blue from absolute resonance Raman intensities. J. Chem. Phys. 1992, 96, 8037–8045. [Google Scholar] [CrossRef]
- Rosi, F.; Miliani, C.; Borgia, I.; Brunetti, B.; Sgamellotti, A. Identification of nineteenth century blue and green pigments by in situ x-ray fluorescence and micro-Raman spectroscopy. J. Raman Spectrosc. 2004, 35, 610–615. [Google Scholar] [CrossRef]
- Li, Z.; Wang, L.; Chen, H.; Ma, Q. Degradation of emerald green: Scientific studies on multi-polychrome Vairocana Statue in Dazu Rock Carvings, Chongqing, China. Herit. Sci. 2020, 8, 1–13. [Google Scholar] [CrossRef]
- Doherty, B.; Vagnini, M.; Dufourmantelle, K.; Sgamellotti, A.; Brunetti, B.; Miliani, C. A vibrational spectroscopic and principal component analysis of triarylmethane dyes by comparative laboratory and portable instrumentation. Spectrochim. Acta A Mol. Biomol. 2014, 121, 292–305. [Google Scholar] [CrossRef] [PubMed]
- Persaud, I.; Grossman, W.E. Surface-Enhanced Raman Scattering of Triphenymethane Dyes on Colloidal Silver. J. Raman Spectrosc. 1993, 24, 107–112. [Google Scholar] [CrossRef]
- Coccato, A.; Jehlicka, J.; Moens, L.; Vandenabeele, P. Raman spectroscopy for the investigation of carbon-based black pigments. J. Raman Spectrosc. 2015, 46, 1003–1015. [Google Scholar] [CrossRef] [Green Version]
- Tomasini, E.P.; Halac, E.B.; Reinoso, M.; Di Liscia, E.J.; Maier, M.S. Micro-Raman spectroscopy of carbon-based black pigments. J. Raman Spectrosc. 2012, 43, 1671–1675. [Google Scholar] [CrossRef]


| Sample | Detector Integration Time (s) | Number of Coadditions | ||
|---|---|---|---|---|
| μ-Raman | pSSE | μ-Raman | pSSE | |
| W1,W6 | 10 | 0.5 | 5 | 10 |
| W3 | 10 | 1 | 5 | 7 |
| W8 | 10 | 0.5 | 5 | 5 |
| Y1, Y2,Y3 | 10 | 0.5 | 5 | 5 |
| Y5 | 10 | 0.5 | 10 | 150 |
| O1, O2 | 10 | 0.5 | 5 | 5 |
| R1 | 10 | 0.5 | 5 | 10 |
| R2, R5 | 10 | 0.5 | 5 | 20 |
| R3 | 10 | 0.5 | 5 | 15 |
| M1 | 10 | 0.5 | 10 | 150 |
| M3 | 10 | 0.5 | 10 | 100 |
| B1,B2 | 10 | 0.5 | 5 | 5 |
| B9 | 10 | 0.5 | 5 | 1 |
| B10 | 10 | 0.1 | 5 | 4 |
| G1 | 10 | 0.7 | 5 | 15 |
| G3 | 10 | 0.5 | 5 | 10 |
| N2, N3, N4 | 10 | 0.5 | 5 | 5 |
| P1 | 10 | 0.7 | 5 | 15 |
| P2, P3 | 10 | 0.5 | 5 | 5 |
| Color | Sample | Identified Material | Detectability by RS | ||
|---|---|---|---|---|---|
| pSSE | μ-Raman | ||||
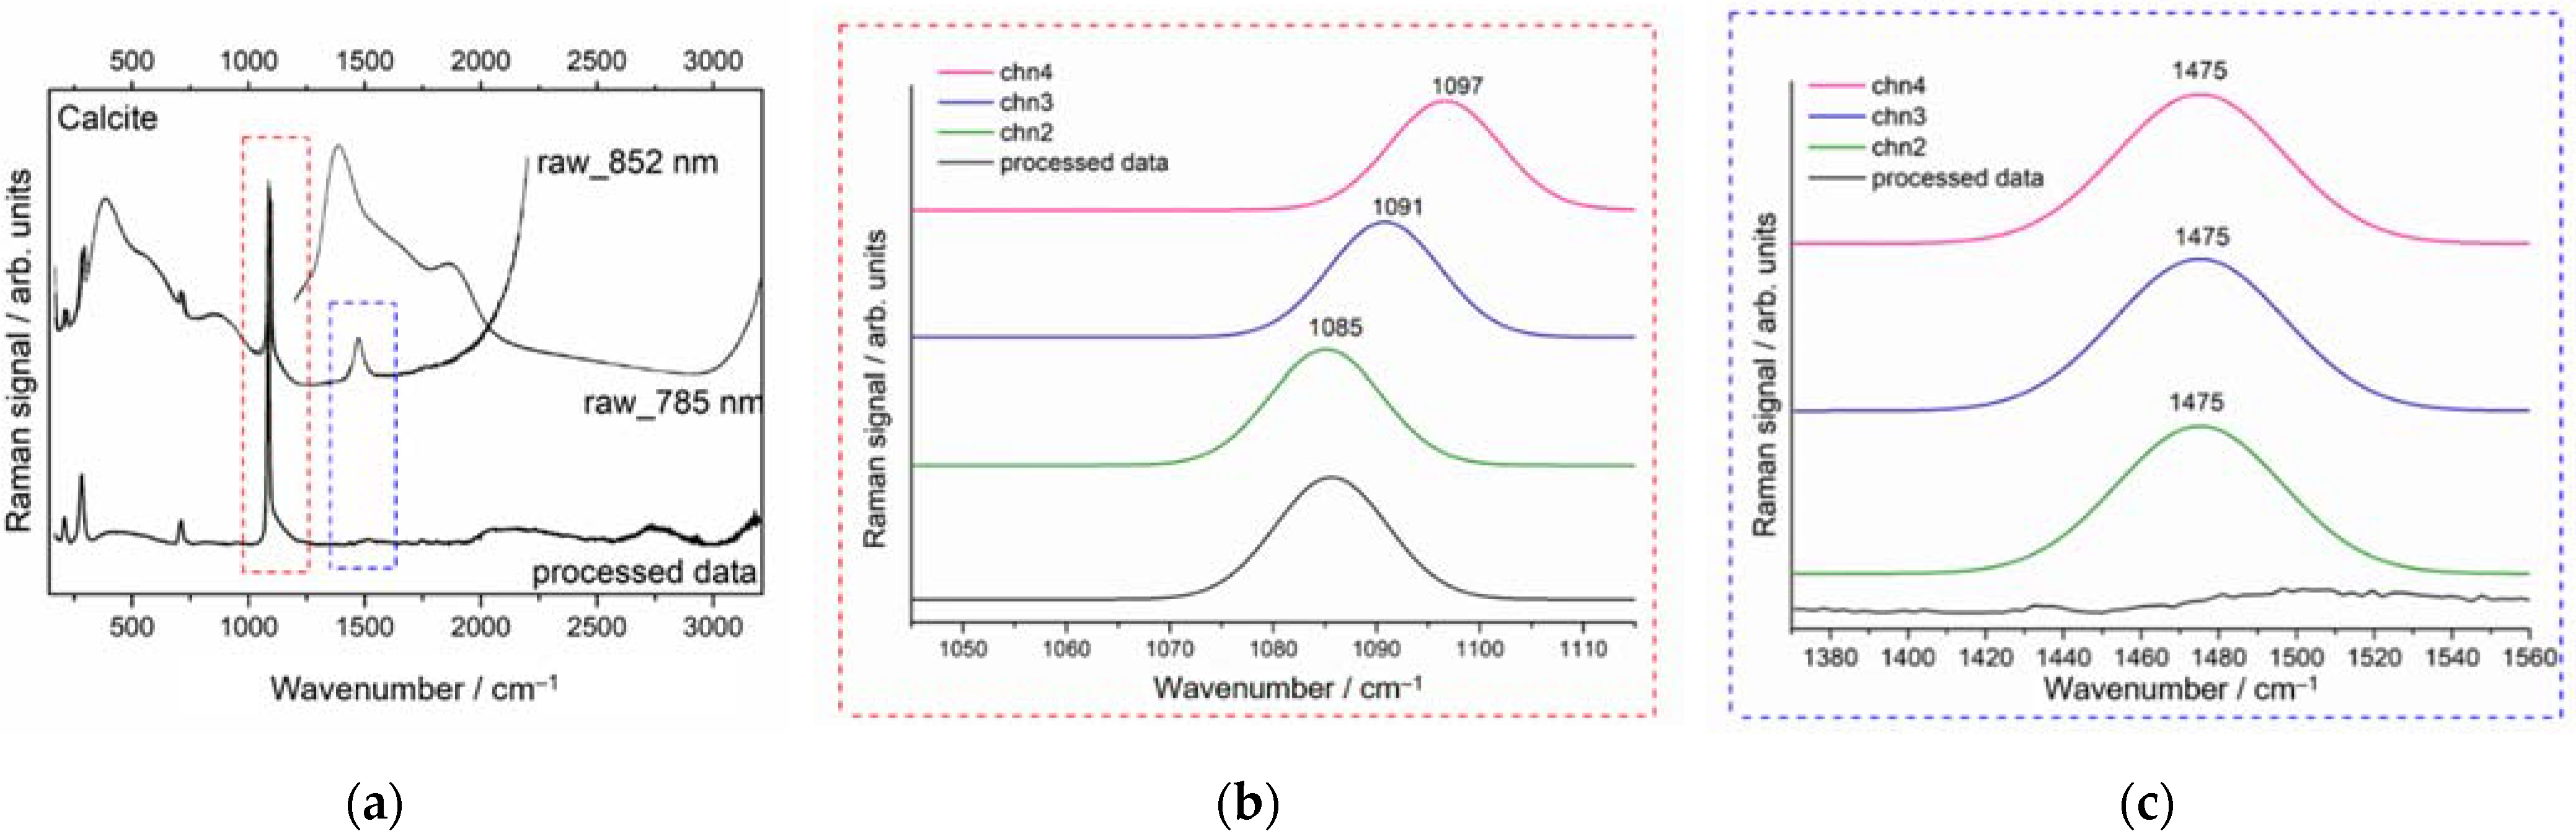
| White |  | W1, W2 | Calcite (CaCO3) [21] | Yes | Yes |
 | W3, W4 | Hydrozincite (Zn5(OH)6(CO3)2 [22] | Yes | No | |
 | W5 | Fluorescence background | No | No | |
 | W6 | Barite (BaSO4) [23] | Yes | Yes | |
 | W7 | Not identified | - | - | |
 | W8 | Gypsum (CaSO4·2H2O) [24] | Yes | Yes | |
| Yellow |  | Y1 | Zinc Yellow (4ZnCrO4·K2O·3H2O) [25] + BaSO4 | Yes | Yes |
 | Y2, Y4, Y7 | Crocoite (PbCrO4) [26] + BaSO4 | Yes | Yes | |
 | Y3, Y6 | Massicot (PbO) [27] + Lead white (2PbCO3· Pb(OH)2) [28] | Yes | Yes | |
 | Y5 | Limonite FeO(OH)nH2O [29] | Yes | No | |
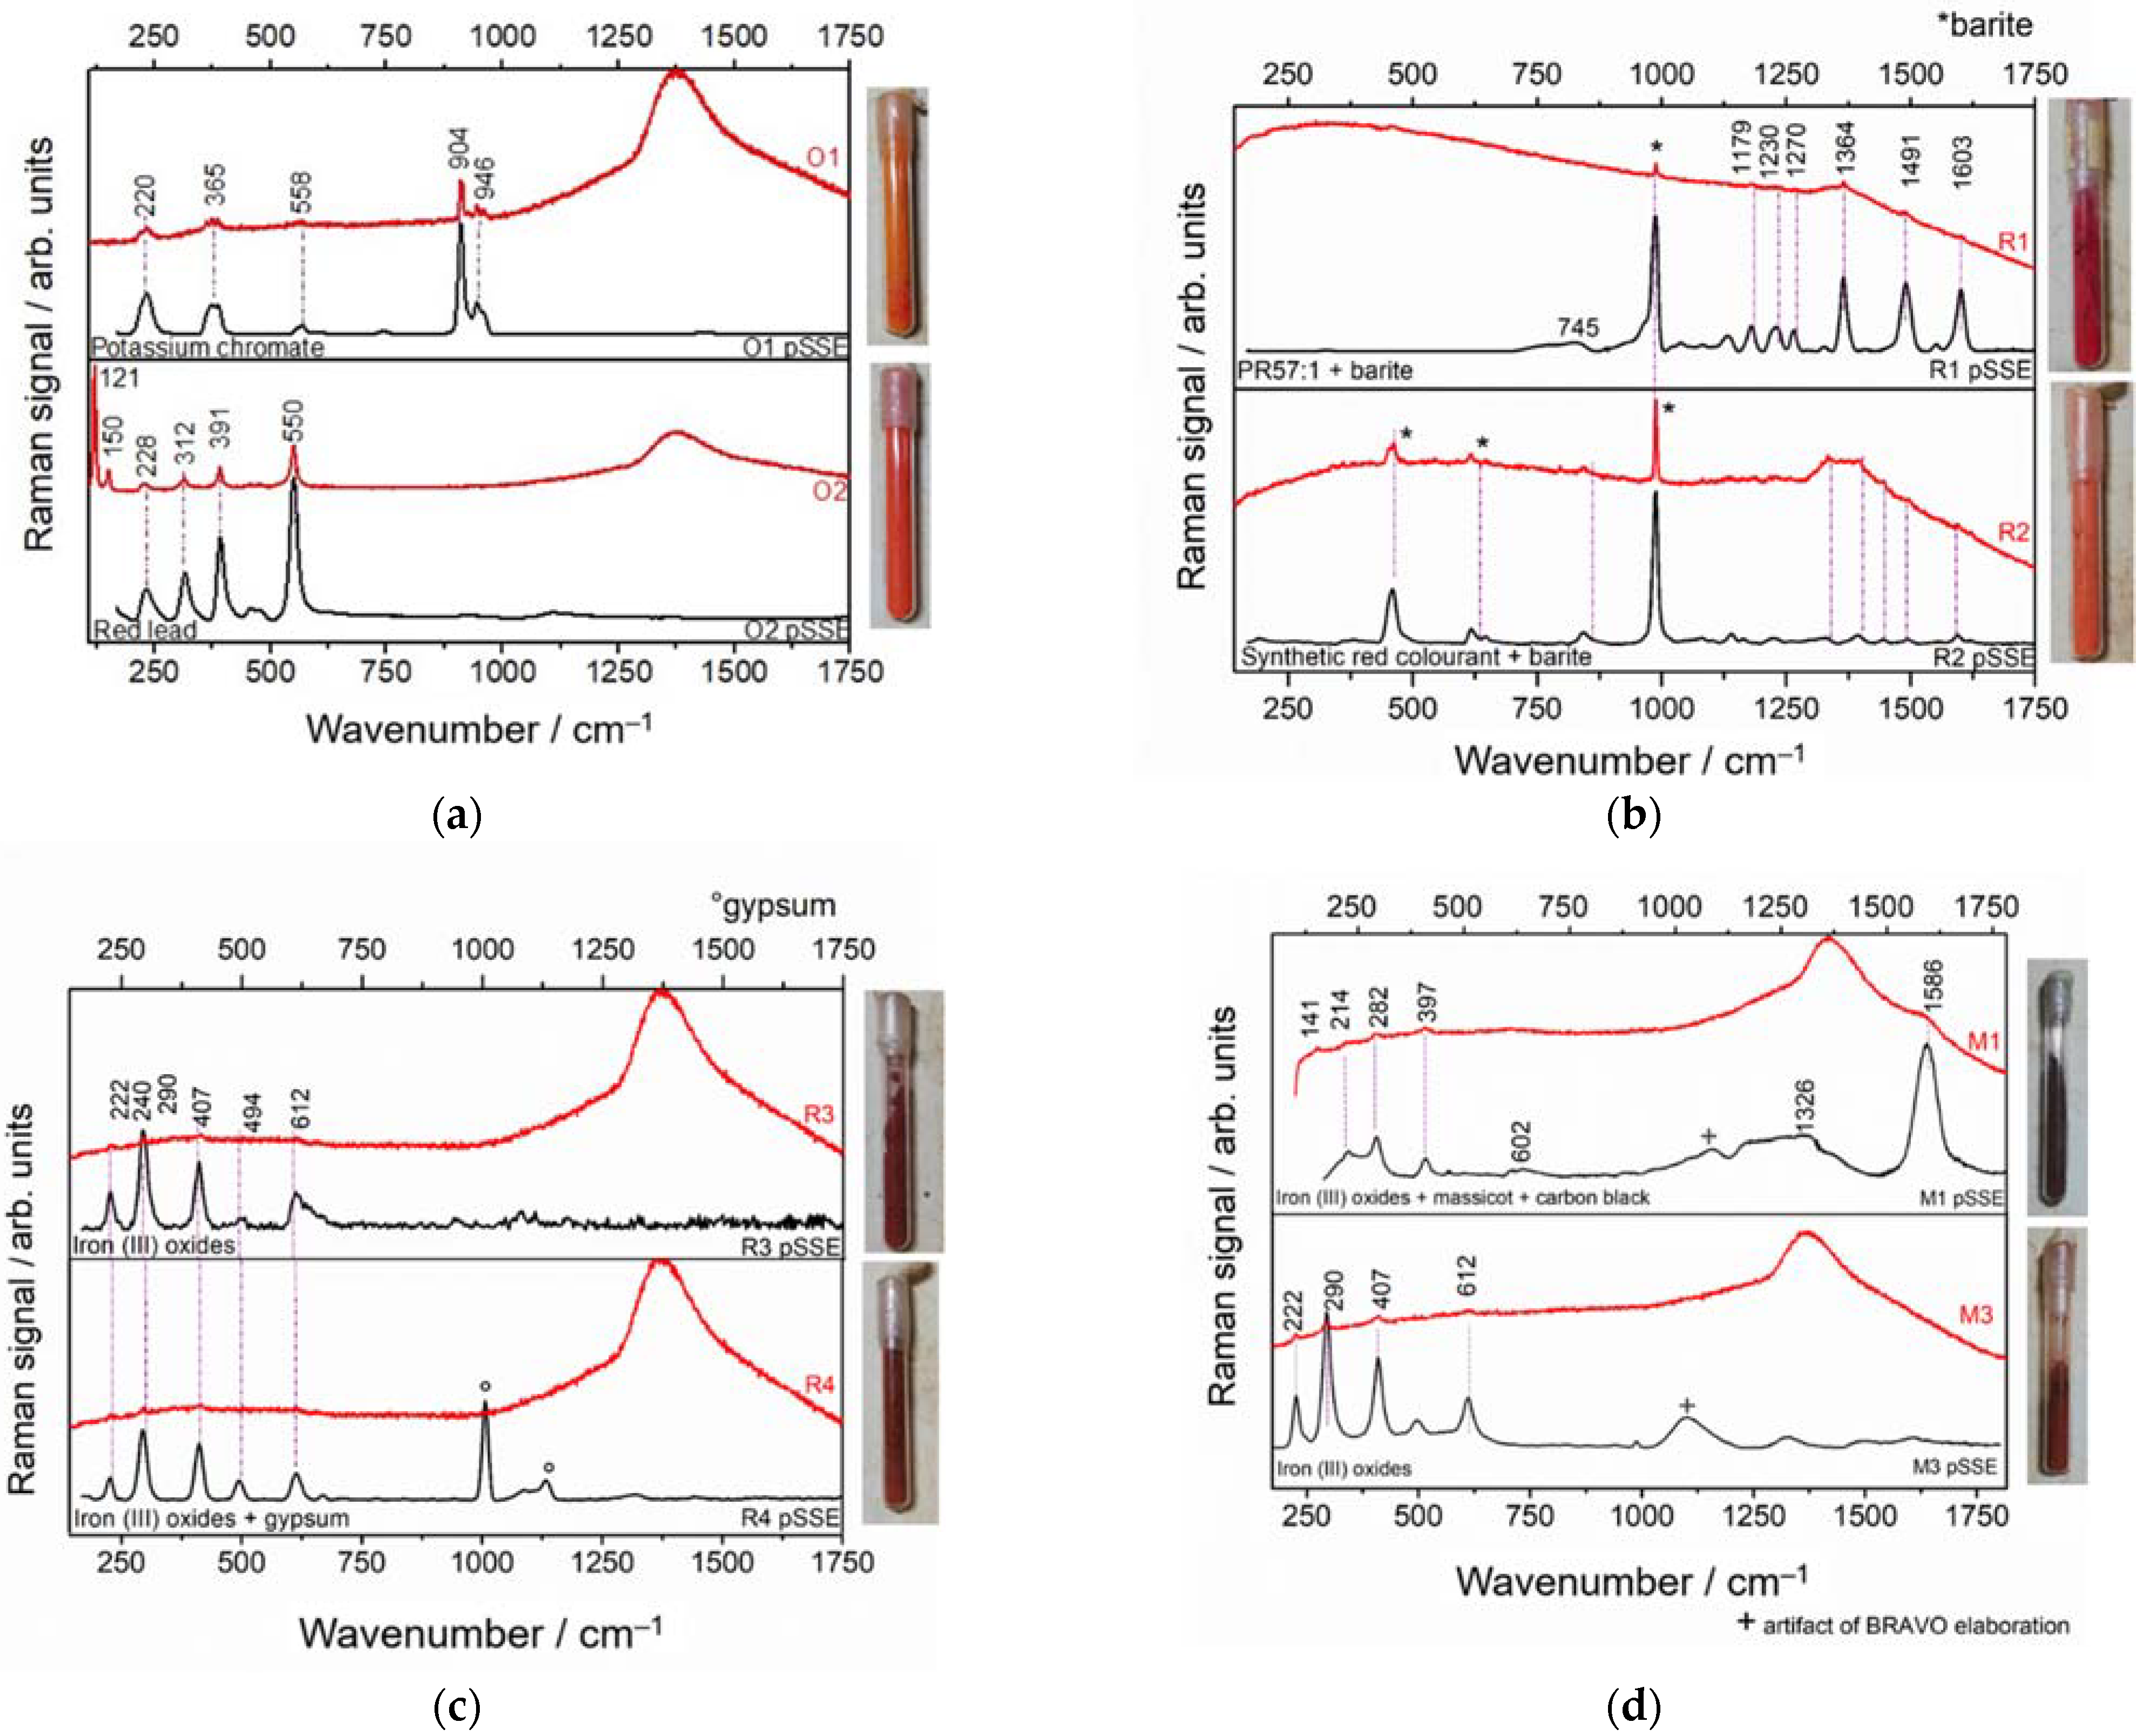
| Orange |  | O1 | Potassium Chromate (K2CrO) [30] | Yes | Yes |
 | O2, O3 | Red Lead (inimum) (Pb3O4) [31] | Yes | Yes | |
| Red |  | R1 | PR 57:1 (C18H14CaN2O6S) + BaSO4 | Yes | Yes |
 | R2 | BaSO4 + azo-colourant | Yes | Yes | |
 | R3 | Hematite (αFe2O3) [32] | Yes | Yes | |
 | R4 | Hematite + gypsum | Yes | Yes | |
| Brown |  | M1 | Fe oxides + Massicot + carbon black | Yes | Yes |
 | M2 | Fluorescence background | No | No | |
 | M3 | Fe (III) oxides (Hematite) | Yes | Yes | |
 | M4 | Fluorescence background | No | No | |
| Blue |  | B1, B4, B5, B6 | Ultramarine blue (Na8−x[SiAlO4]6·S2,S3,SO4,Cl)2−x) [33] | Yes | Yes |
 | B2, B7, B8 | Prussian blue (Fe4[Fe(CN)6]3) [34] | Yes | Yes | |
 | B9 | Methylene blue (C16H18N3SCl) [35] | Yes | Yes | |
 | B10 | Nile blue (C20H20ClN3O) [36] | Yes | Yes | |
| Green |  | G1, G2 | Emerald Green (Cu(C2H3O2)2·3Cu(AsO2)2) [37] | Yes | No |
 | G3 | Prussian Blue + BaSO4 + yellow pigment? (Hooker’s green?) | Yes | Yes | |
| Black |  | N2 | Carbon black pigment | No | Yes |
 | N3, N6 | Carbon black pigment | No | No | |
 | N4, N5 | Carbon black pigment | No | Yes | |
| Purple |  | P1 | PB14 (C25H43N3) + Calcite | Yes | No |
 | P2 | Triarylmethane dye | Yes | No | |
 | P3 | Crystal Violet, BV3 (C25N3H30Cl) | Yes | No | |
Publisher’s Note: MDPI stays neutral with regard to jurisdictional claims in published maps and institutional affiliations. |
© 2022 by the authors. Licensee MDPI, Basel, Switzerland. This article is an open access article distributed under the terms and conditions of the Creative Commons Attribution (CC BY) license (https://creativecommons.org/licenses/by/4.0/).
Share and Cite
Innocenti, S.; Quintero Balbas, D.; Pezzati, L.; Fontana, R.; Striova, J. Portable Sequentially Shifted Excitation Raman Spectroscopy to Examine Historic Powders Enclosed in Glass Vials. Sensors 2022, 22, 3560. https://doi.org/10.3390/s22093560
Innocenti S, Quintero Balbas D, Pezzati L, Fontana R, Striova J. Portable Sequentially Shifted Excitation Raman Spectroscopy to Examine Historic Powders Enclosed in Glass Vials. Sensors. 2022; 22(9):3560. https://doi.org/10.3390/s22093560
Chicago/Turabian StyleInnocenti, Silvia, Diego Quintero Balbas, Luca Pezzati, Raffaella Fontana, and Jana Striova. 2022. "Portable Sequentially Shifted Excitation Raman Spectroscopy to Examine Historic Powders Enclosed in Glass Vials" Sensors 22, no. 9: 3560. https://doi.org/10.3390/s22093560
APA StyleInnocenti, S., Quintero Balbas, D., Pezzati, L., Fontana, R., & Striova, J. (2022). Portable Sequentially Shifted Excitation Raman Spectroscopy to Examine Historic Powders Enclosed in Glass Vials. Sensors, 22(9), 3560. https://doi.org/10.3390/s22093560