
Towards Personalization of Indoor Air Quality: Review of Sensing Requirements and Field Deployments

 ,
, 
Abstract
:1. Introduction
2. Physical Environmental Factors Based on IAQ Standards’ Requirements
2.1. IAQ Requirements on Air Pollutants
- Particulate Matter (PM)
- Formaldehyde
- Carbon Dioxide (CO2)
- Carbon Monoxide (CO)
- Nitrogen Dioxide (NO2)
- Total Volatile Organic Compounds (TVOCs)
- Ozone
2.2. Odor
2.3. Humidity
2.4. Microbes
3. Requirements of Prominent IAQ Sensing Standards
4. Research Methodology
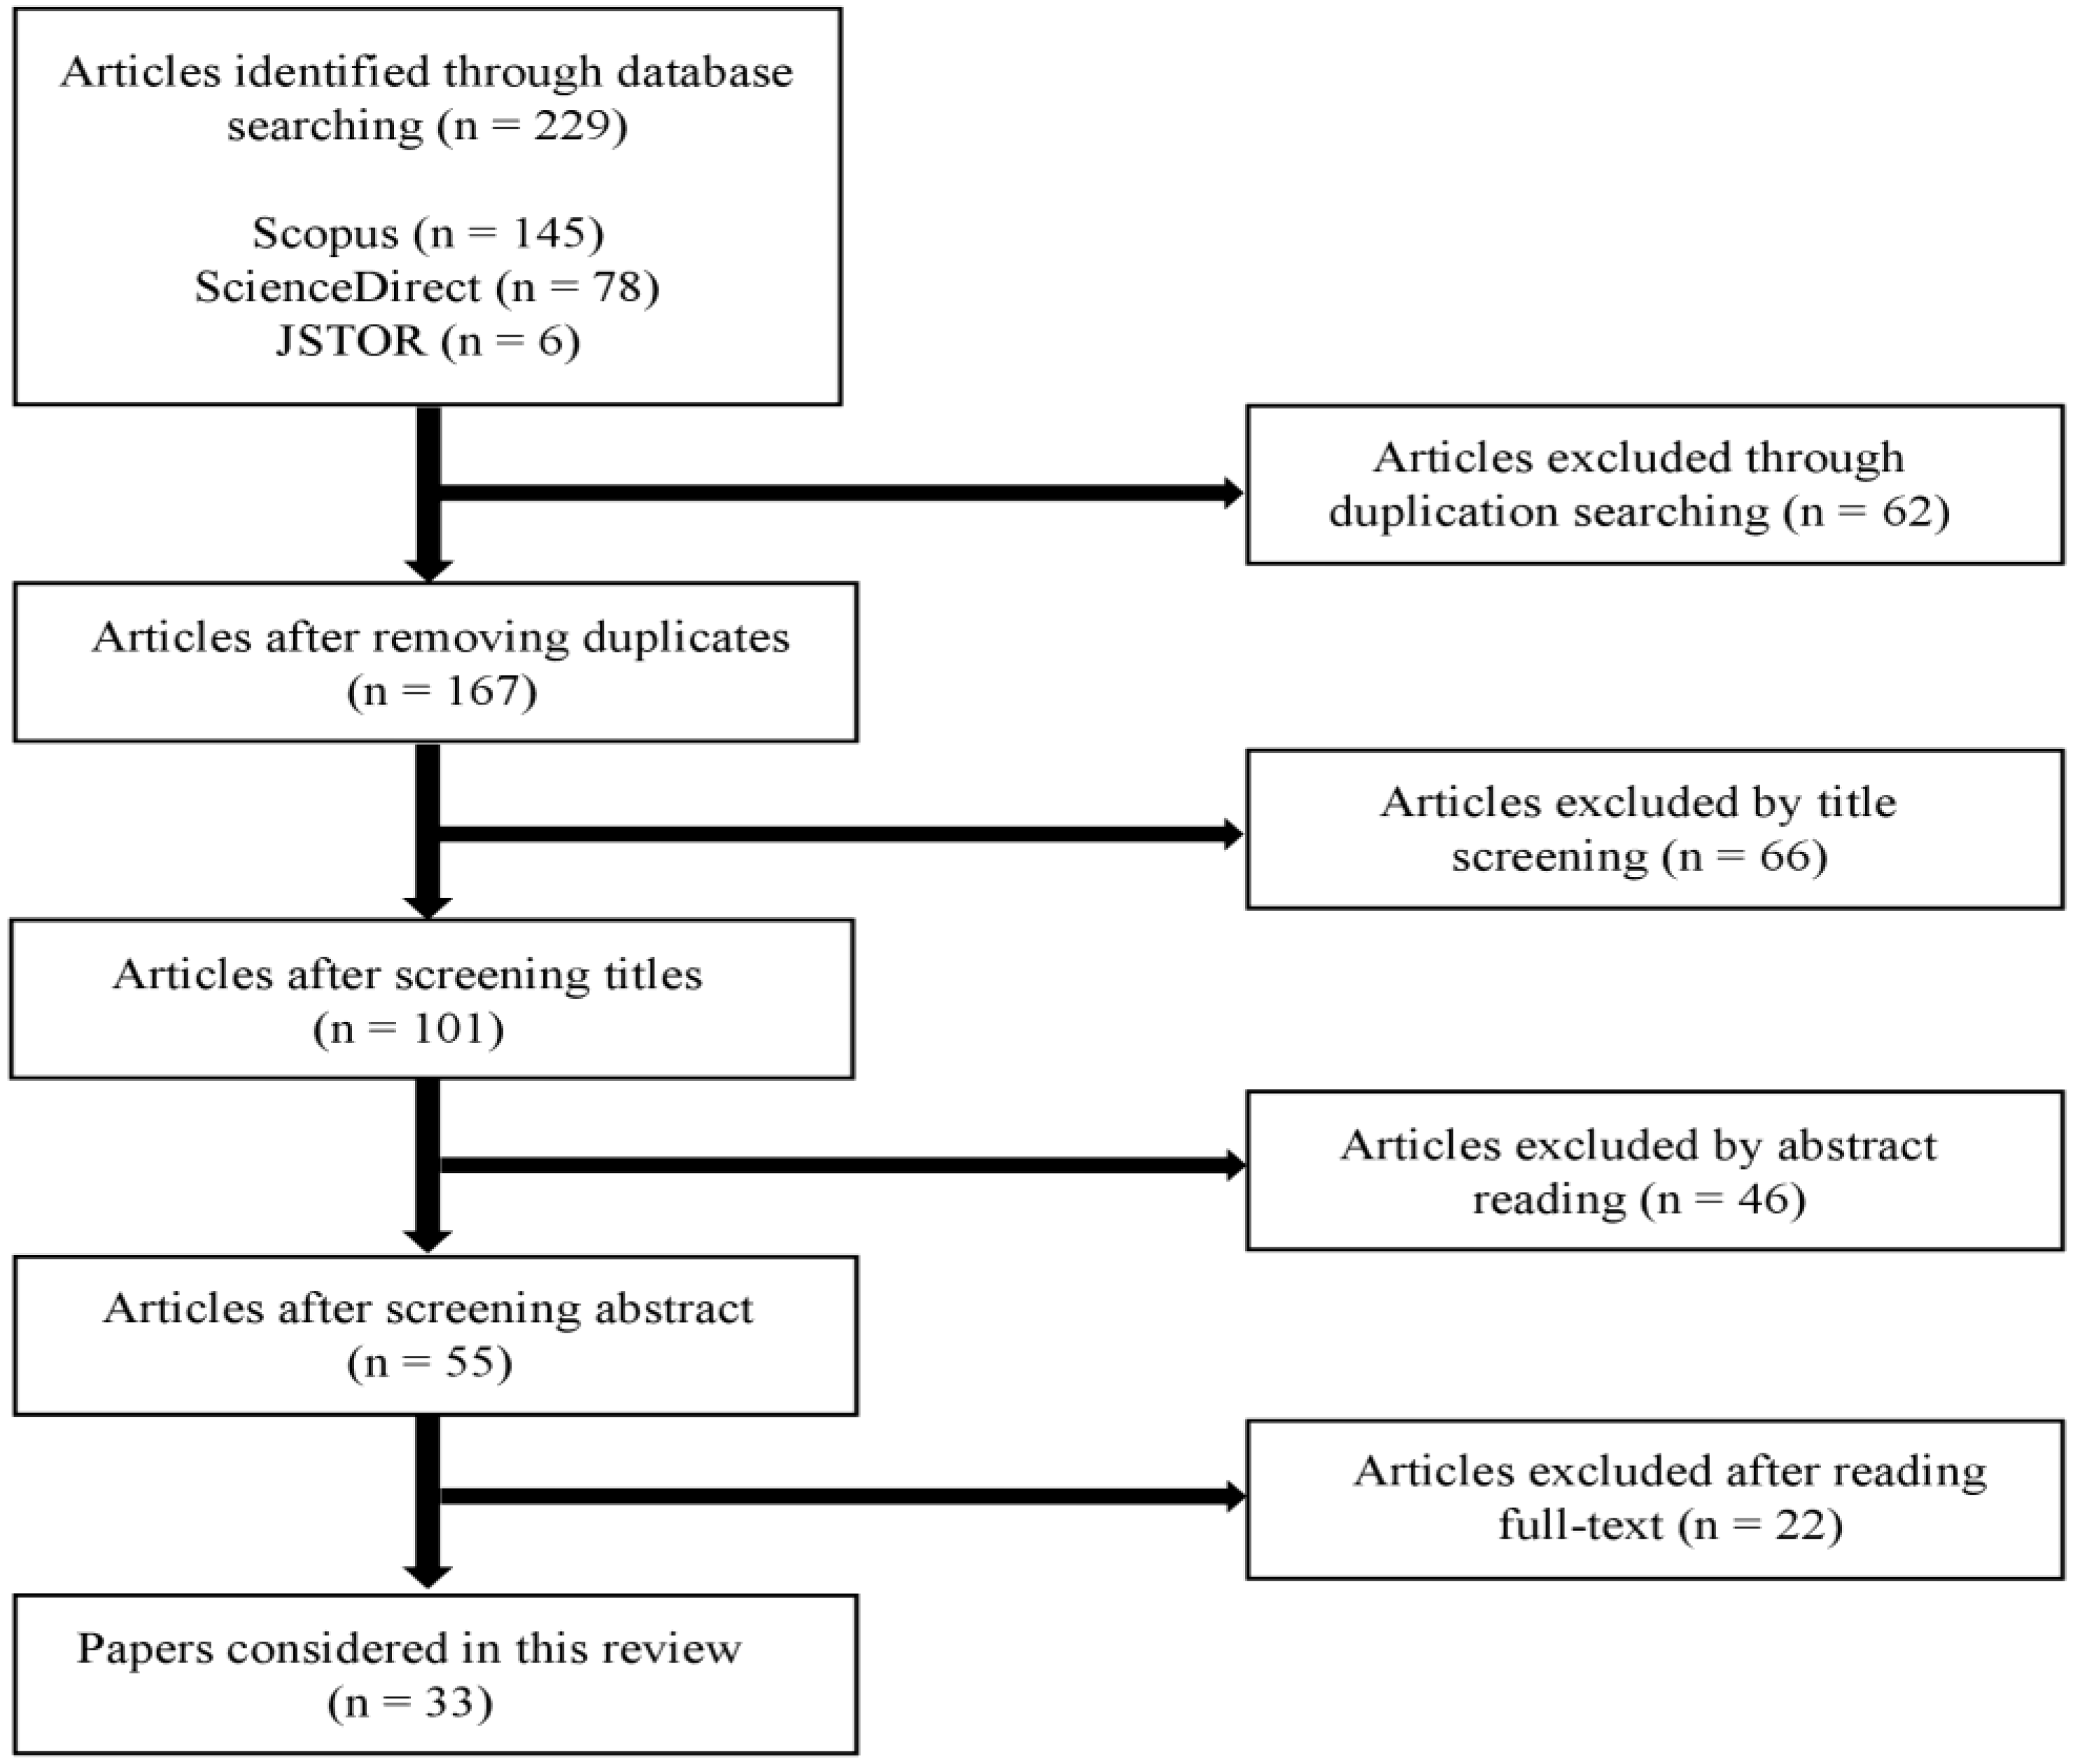
4.1. Selection of Academic Publications
4.2. Categorization of UIAQS Technologies
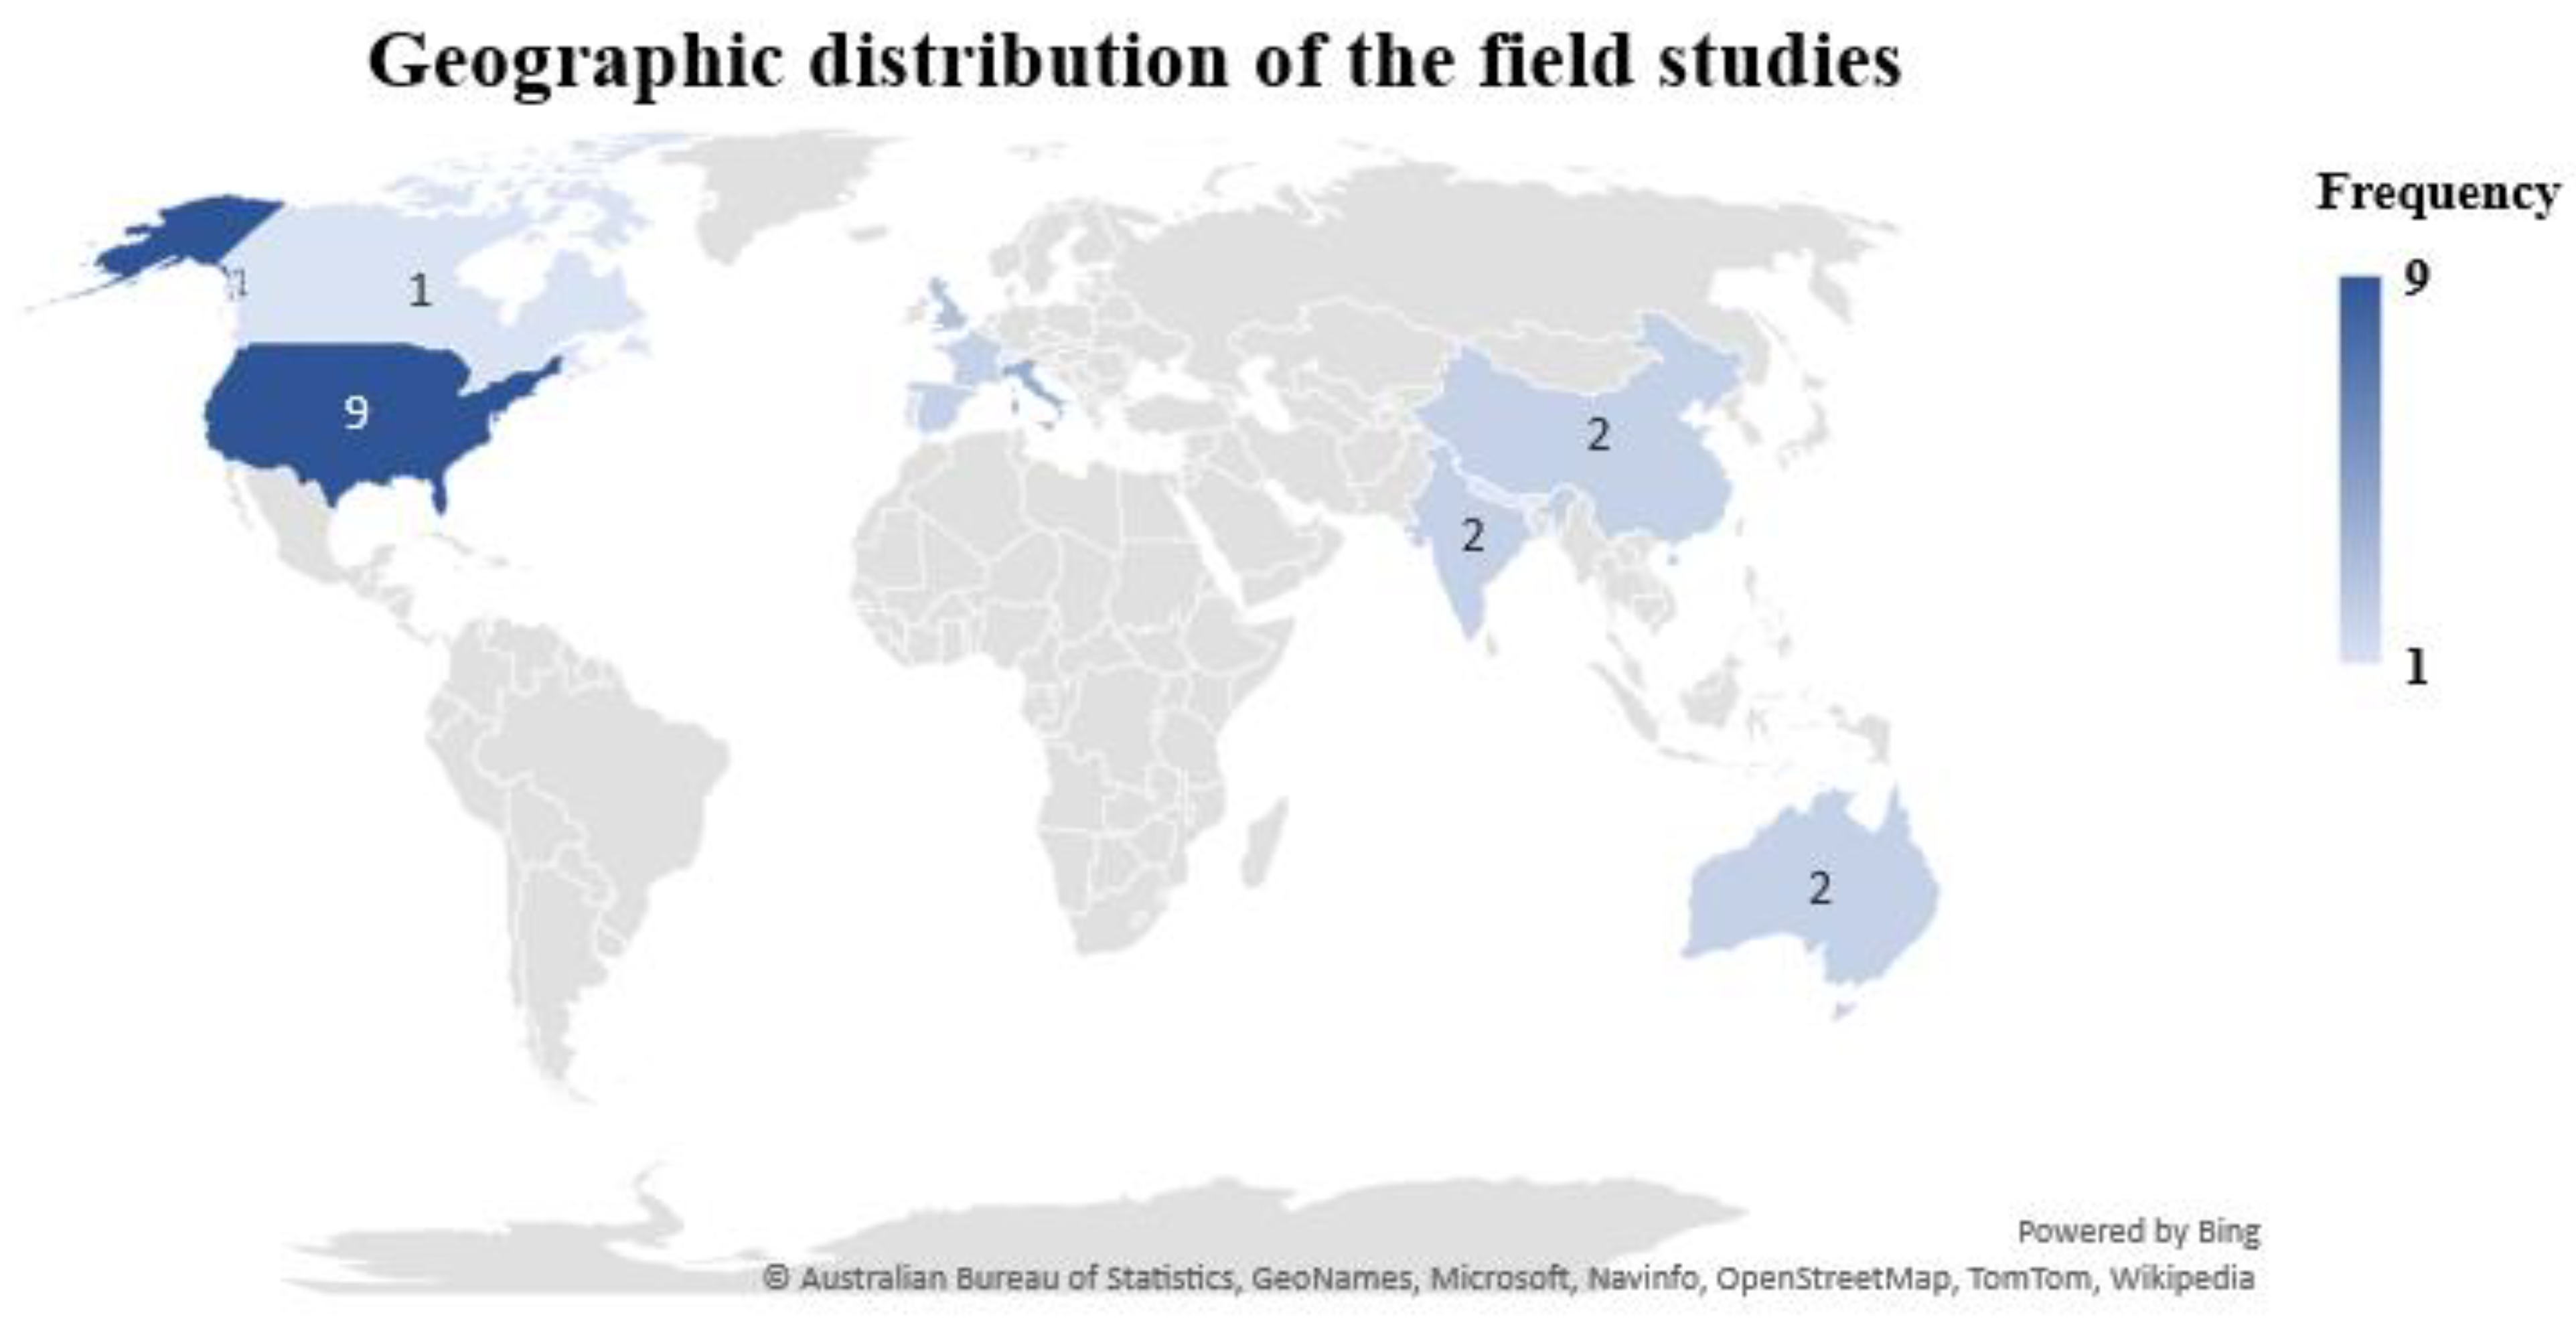
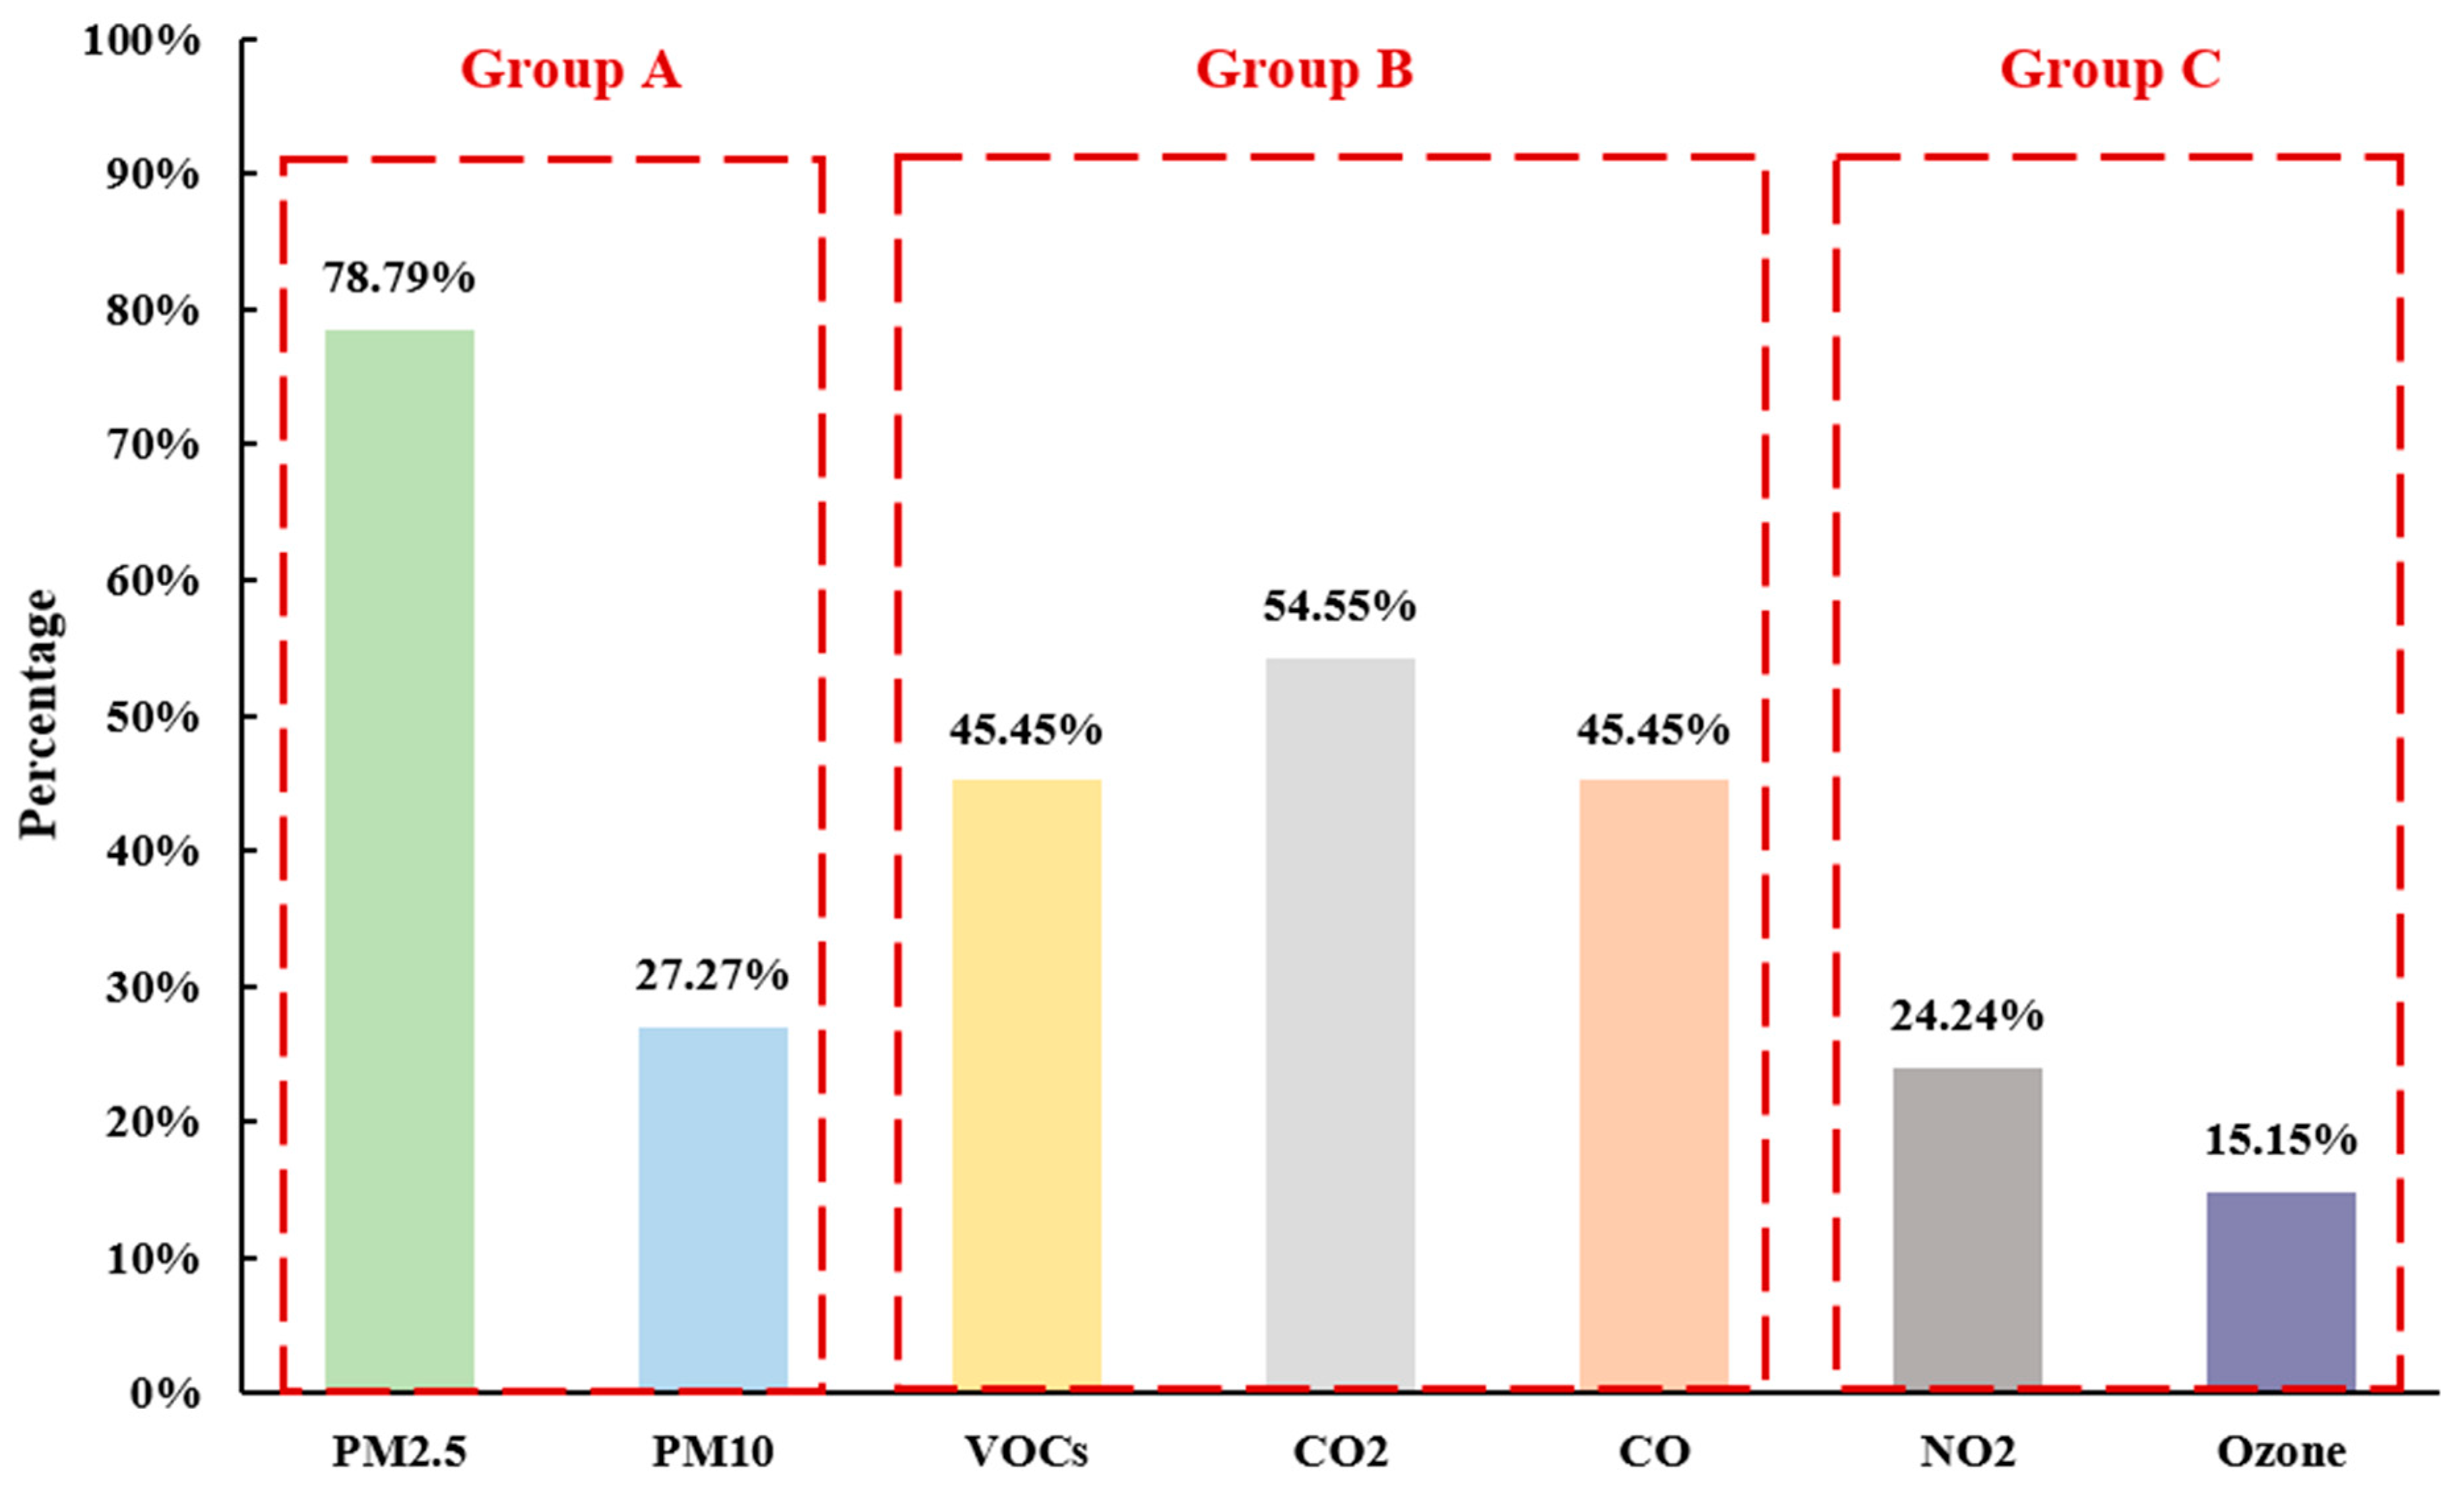
5. Findings from Ubiquitous Sensing Technologies in the Field Studies Literature
6. Research Gaps and Suggestions
6.1. Research Gaps of Current UIAQS Technologies
- Sensing IAQ factors
- Lack of standardization
- Applicability of UIAQS systems in extreme climates
- Inadequate study duration
6.2. Future Research
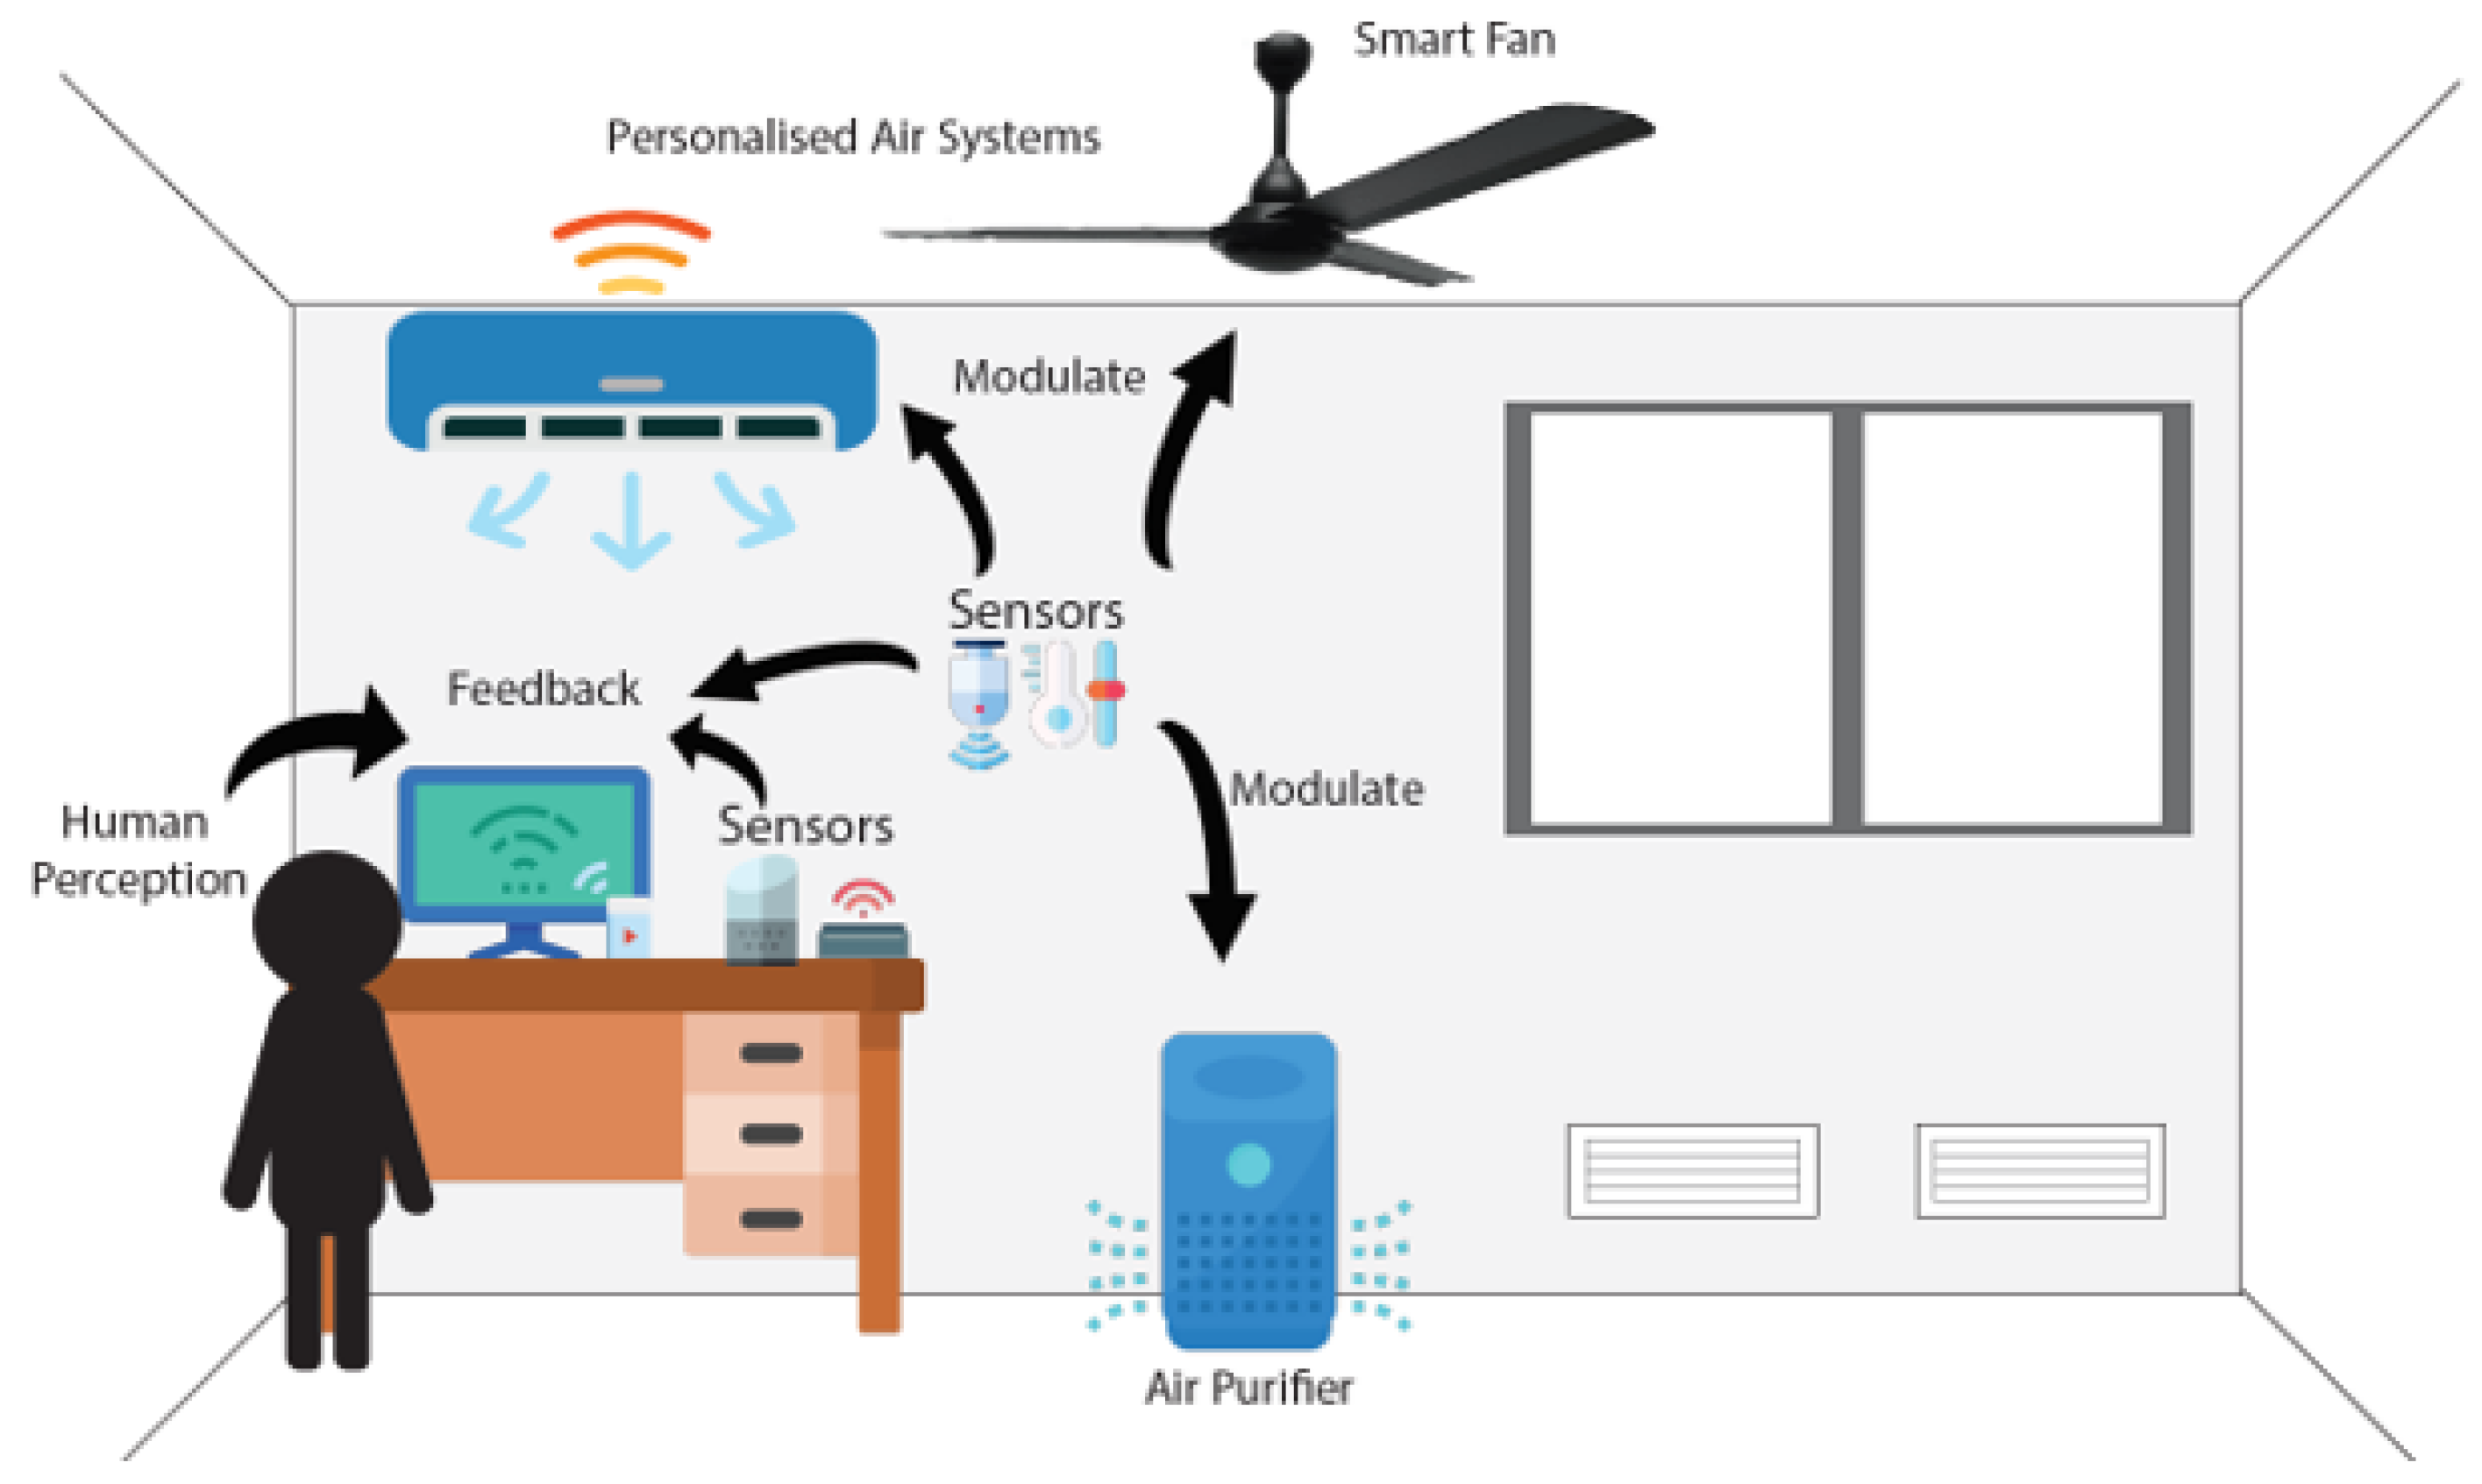
7. Integrating Air Quality Sensing and Controls with Human Perceptions
8. Conclusions
Author Contributions
Funding
Institutional Review Board Statement
Informed Consent Statement
Data Availability Statement
Acknowledgments
Conflicts of Interest
References
- Caron, A.; Redon, N.; Thevenet, F.; Hanoune, B.; Coddeville, P. Performances and limitations of electronic gas sensors to investigate an indoor air quality event. Build. Environ. 2016, 107, 19–28. [Google Scholar] [CrossRef]
- Joshi, S.M. The sick building syndrome. Indian J. Occup. Environ. Med. 2008, 12, 61–64. [Google Scholar] [CrossRef] [PubMed]
- Al Horr, Y.; Arif, M.; Kaushik, A.; Mazroei, A.; Katafygiotou, M.; Elsarrag, E. Occupant productivity and office indoor environment quality: A review of the literature. Build. Environ. 2016, 105, 369–389. [Google Scholar] [CrossRef] [Green Version]
- Khovalyg, D.; Kazanci, O.B.; Halvorsen, H.; Gundlach, I.; Bahnfleth, W.P.; Toftum, J.; Olesen, B.W. Critical review of standards for indoor thermal environment and air quality. Energy Build. 2020, 213, 109819. [Google Scholar] [CrossRef]
- Abdul-Wahab, S.A.; Chin Fah En, S.; Elkamel, A.; Ahmadi, L.; Yetilmezsoy, K. A review of standards and guidelines set by international bodies for the parameters of indoor air quality. Atmos. Pollut. Res. 2015, 6, 751–767. [Google Scholar] [CrossRef]
- Johnson, A.J. Cognitive facilitation following intentional odor exposure. Sensors 2011, 11, 5469–5488. [Google Scholar] [CrossRef] [Green Version]
- Wolkoff, P. Indoor air humidity, air quality, and health—An overview. Int. J. Hyg. Environ. Health 2018, 221, 376–390. [Google Scholar] [CrossRef]
- Wu, F.; Jacobs, D.; Mitchell, C.; Miller, D.; Karol, M.H. Improving indoor environmental quality for public health: Impediments and policy recommendations. Environ. Health Perspect. 2007, 115, 953–957. [Google Scholar] [CrossRef] [Green Version]
- Bhattacharya, A.; Ghahramani, A.; Mousavi, E. The effect of door opening on air-mixing in a positively pressurized room: Implications for operating room air management during the COVID outbreak. J. Build. Eng. 2021, 44, 102900. [Google Scholar] [CrossRef]
- Zhang, H.; Srinivasan, R. A systematic review of air quality sensors, guidelines, and measurement studies for indoor air quality management. Sustainability 2020, 12, 9045. [Google Scholar] [CrossRef]
- Coulby, G.; Clear, A.; Jones, O.; Godfrey, A. A scoping review of technological approaches to environmental monitoring. Int. J. Environ. Res. Public Health 2020, 17, 3995. [Google Scholar] [CrossRef] [PubMed]
- Saini, J.; Dutta, M.; Marques, G. A comprehensive review on indoor air quality monitoring systems for enhanced public health. Sustain. Environ. Res. 2020, 30, 6. [Google Scholar] [CrossRef] [Green Version]
- Chojer, H.; Branco, P.T.B.S.; Martins, F.G.; Alvim-Ferraz, M.C.M.; Sousa, S.I.V. Development of low-cost indoor air quality monitoring devices: Recent advancements. Sci. Total Environ. 2020, 727, 138385. [Google Scholar] [CrossRef] [PubMed]
- Morawska, L.; Thai, P.K.; Liu, X.; Asumadu-Sakyi, A.; Ayoko, G.; Bartonova, A.; Bedini, A.; Chai, F.; Christensen, B.; Dunbabin, M.; et al. Applications of low-cost sensing technologies for air quality monitoring and exposure assessment: How far have they gone? Environ. Int. 2018, 116, 286–299. [Google Scholar] [CrossRef]
- Vahlsing, C.; Smith, K.R. Global review of national ambient air quality standards for PM10 and SO2 (24 h). Air Qual. Atmos. Health 2012, 5, 393–399. [Google Scholar] [CrossRef] [Green Version]
- Davidson, C.I.; Phalen, R.F.; Solomon, P.A. Airborne Particulate Matter and Human Health: A Review. Aerosol Sci. Technol. 2005, 39, 737–749. [Google Scholar] [CrossRef]
- United States Environmental Protection Agency Particulate Matter (PM) Basics. Available online: https://www.epa.gov/pm-pollution/particulate-matter-pm-basics (accessed on 20 December 2021).
- Li, Z.; Wen, Q.; Zhang, R. Sources, health effects and control strategies of indoor fine particulate matter (PM2.5): A review. Sci. Total Environ. 2017, 586, 610–622. [Google Scholar] [CrossRef]
- Logue, J.M.; Price, P.N.; Sherman, M.H.; Singer, B.C. A method to estimate the chronic health impact of air pollutants in U.S. residences. Environ. Health Perspect. 2012, 120, 216–222. [Google Scholar] [CrossRef] [Green Version]
- Yang, B.-Y.; Guo, Y.; Morawska, L.; Bloom, M.S.; Markevych, I.; Heinrich, J.; Dharmage, S.C.; Knibbs, L.D.; Lin, S.; Yim, S.H.-L.; et al. Ambient PM1 air pollution and cardiovascular disease prevalence: Insights from the 33 Communities Chinese Health Study. Environ. Int. 2019, 123, 310–317. [Google Scholar] [CrossRef]
- World Health Organization (WHO). Air Quality Guidelines for Particulate Matter, Ozone, Nitrogen Dioxide and Sulphur Dioxide; Global Update 2005; World Health Organization: Geneva, Switzerland, 2006; Volume 38, p. E90038. [Google Scholar]
- World Health Organization; Regional Office for Europe. WHO Guidelines for Indoor Air Quality: Selected Pollutants; World Health Organization: Geneva, Switzerland; Regional Office for Europe: Copenhagen, Denmark, 2010; ISBN 978-92-890-0213-4. [Google Scholar]
- Chen, W.; Mendell, M.; Li, N.; Kumagai, K. Formaldehyde emissions from seams and cut edges of laminate flooring: Implications for emission testing protocols and exposure estimation. Build. Environ. 2018, 143, 652–660. [Google Scholar] [CrossRef]
- World Health Organization. Air Quality Guidelines for Europe; WHO Regional Office for Europe: Copenhagen, Denmark, 1987; ISBN 92-890-1114-9. [Google Scholar]
- Salthammer, T. Formaldehyde in the Ambient Atmosphere: From an Indoor Pollutant to an Outdoor Pollutant? Angew. Chem. Int. Ed. 2013, 52, 3320–3327. [Google Scholar] [CrossRef] [PubMed]
- Marzuki, P.F.; Abduh, M.; Driejana, R. Identification of source factors of carbon dioxide (CO2) emissions in concreting of reinforced concrete. Procedia Eng. 2015, 125, 692–698. [Google Scholar]
- Ghahramani, A.; Pantelic, J.; Vannucci, M.; Pistore, L.; Liu, S.; Gilligan, B.; Alyasin, S.; Arens, E.; Kampshire, K.; Sternberg, E. Personal CO2 bubble: Context-dependent variations and wearable sensors usability. J. Build. Eng. 2019, 22, 295–304. [Google Scholar] [CrossRef] [Green Version]
- Tran, V.V.; Park, D.; Lee, Y.-C. Indoor air pollution, related human diseases, and recent trends in the control and improvement of indoor air quality. Int. J. Environ. Res. Public. Health 2020, 17, 2927. [Google Scholar] [CrossRef] [Green Version]
- Bakó-Biró, Z.; Clements-Croome, D.J.; Kochhar, N.; Awbi, H.B.; Williams, M.J. Ventilation rates in schools and pupils’ performance. Build. Environ. 2012, 48, 215–223. [Google Scholar] [CrossRef]
- Jacobson, T.A.; Kler, J.S.; Hernke, M.T.; Braun, R.K.; Meyer, K.C.; Funk, W.E. Direct human health risks of increased atmospheric carbon dioxide. Nat. Sustain. 2019, 2, 691–701. [Google Scholar] [CrossRef]
- AirTest. A White Paper: CO2 Ventilation Control and Measurement of Outside Air; AirTest: Delta, BC, Canada, 2008; p. 5. [Google Scholar]
- Code of Practice for Indoor Air Quality for Air-Conditioned Buildings; Spring: Singapore, 2021.
- Ashrae, A. Standard 62.1-2019, Ventilation for Acceptable Indoor Air Quality; American Society of Heating, Refrigerating, and Air-Conditioning Engineers: Atlanta, GA, USA, 2019. [Google Scholar]
- Weaver, L.K. Carbon Monoxide Poisoning. N. Engl. J. Med. 2009, 360, 1217–1225. [Google Scholar] [CrossRef] [Green Version]
- National Research Council. Acute Exposure Guideline Levels for Selected Airborne Chemicals: Volume 8; National Academies Press: Washington, DC, USA, 2010; ISBN 0-309-14515-5. [Google Scholar]
- Environmental Protection Agency. Health Effects Associated with Nitrogen Dioxide. In Nitrogen Dioxide’s Impact on Indoor Air Quality; Environmental Protection Agency: Washington, DC, USA, 2021. [Google Scholar]
- Shuai, J.; Kim, S.; Ryu, H.; Park, J.; Lee, C.K.; Kim, G.-B.; Ultra, V.U.; Yang, W. Health risk assessment of volatile organic compounds exposure near Daegu dyeing industrial complex in South Korea. BMC Public Health 2018, 18, 528. [Google Scholar] [CrossRef] [Green Version]
- Zhai, S.; Jacob, D.J.; Wang, X.; Shen, L.; Li, K.; Zhang, Y.; Gui, K.; Zhao, T.; Liao, H. Fine particulate matter (PM2.5) trends in China, 2013–2018: Separating contributions from anthropogenic emissions and meteorology. Atmos. Chem. Phys. 2019, 19, 11031–11041. [Google Scholar] [CrossRef] [Green Version]
- Hoek, G.; Fischer, P.; van den Brandt, P.; Goldbohm, S.; Brunekreef, B. Estimation of long-term average exposure to outdoor air pollution for a cohort study on mortality. J. Expo. Sci. Environ. Epidemiol. 2001, 11, 459–469. [Google Scholar] [CrossRef] [Green Version]
- Hong, Y.-C.; Lee, J.-T.; Kim, H.; Kwon, H.-J. Air pollution: A new risk factor in ischemic stroke mortality. Stroke 2002, 33, 2165–2169. [Google Scholar] [CrossRef] [PubMed] [Green Version]
- Turner, M.C.; Jerrett, M.; Pope, C.A., 3rd; Krewski, D.; Gapstur, S.M.; Diver, W.R.; Beckerman, B.S.; Marshall, J.D.; Su, J.; Crouse, D.L.; et al. Long-Term Ozone Exposure and Mortality in a Large Prospective Study. Am. J. Respir. Crit. Care Med. 2016, 193, 1134–1142. [Google Scholar] [CrossRef] [PubMed] [Green Version]
- Silva, M.F.; Maas, S.; de Souza, H.A.; Gomes, A.P. Post-occupancy evaluation of residential buildings in Luxembourg with centralized and decentralized ventilation systems, focusing on indoor air quality (IAQ). Assessment by questionnaires and physical measurements. Energy Build. 2017, 148, 119–127. [Google Scholar] [CrossRef]
- Nagda, N.; Hodgson, M. Low relative humidity and aircraft cabin air quality. Indoor Air 2001, 11, 200–214. [Google Scholar] [CrossRef]
- Wolkoff, P.; Kjærgaard, S.K. The dichotomy of relative humidity on indoor air quality. Environ. Int. 2007, 33, 850–857. [Google Scholar] [CrossRef]
- Kim, M.; Chun, C.; Han, J. A Study on Bedroom Environment and Sleep Quality in Korea. Indoor Built Environ. 2010, 19, 123–128. [Google Scholar] [CrossRef]
- Okamoto-Mizuno, K.; Mizuno, K.; Michie, S.; Maeda, A.; Lizuka, S. Effects of Humid Heat Exposure on Human Sleep Stages and Body Temperature. Sleep 1999, 22, 767–773. [Google Scholar] [CrossRef] [Green Version]
- Sun, Y.; Zhang, Y.; Sundell, J.; Fan, Z.; Bao, L. Dampness in dorm rooms and its associations with allergy and airways infections among college students in China: A cross-sectional study. Indoor Air 2009, 19, 348. [Google Scholar] [CrossRef]
- Melikov, A.K.; Skwarczynski, M.A.; Kaczmarczyk, J.; Zabecky, J. Use of personalized ventilation for improving health, comfort, and performance at high room temperature and humidity. Indoor Air 2013, 23, 250–263. [Google Scholar] [CrossRef]
- Memarzadeh, F. Literature Review of the Effect of Temperature and Humidity on Viruses. ASHRAE Trans. 2012, 118, 1049–1060. [Google Scholar]
- Lax, S.; Smith, D.; Sangwan, N.; Handley, K.; Larsen, P.; Richardson, M.; Taylor, S.; Landon, E.; Alverdy, J.; Siegel, J. Colonization and succession of hospital-associated microbiota. Sci. Transl. Med. 2017, 9, eaah6500. [Google Scholar] [CrossRef] [PubMed] [Green Version]
- Moelling, K.; Broecker, F. Air Microbiome and Pollution: Composition and Potential Effects on Human Health, Including SARS Coronavirus Infection. J. Environ. Public Health 2020, 2020, 1646943. [Google Scholar] [CrossRef] [PubMed]
- Bourdrel, T.; Annesi-Maesano, I.; Alahmad, B.; Maesano, C.N.; Bind, M.-A. The impact of outdoor air pollution on COVID-19: A review of evidence from in vitro, animal, and human studies. Eur. Respir. Rev. 2021, 30, 200242. [Google Scholar] [CrossRef] [PubMed]
- Williams, R.; Kilaru, V.; Snyder, E.; Kaufman, A.; Dye, T.; Rutter, A.; Russell, A.; Hafner, H. Air Sensor Guidebook; U.S. Environmental Protection Agency: Washington, DC, USA, 2014.
- WELL v2.0 Air Quality Monitoring and Awareness Part 1. 2018. Available online: https:/v2.wellcertified.com/v2.1/en/air/feature (accessed on 20 December 2021).
- Air Standards for Accredited Monitors v2.0. 2017. Available online: https://www.reset.build/standard/air (accessed on 20 December 2021).
- Curto, A.; Donaire-Gonzalez, D.; Barrera-Gómez, J.; Marshall, J.D.; Nieuwenhuijsen, M.J.; Wellenius, G.A.; Tonne, C. Performance of low-cost monitors to assess household air pollution. Environ. Res. 2018, 163, 53–63. [Google Scholar] [CrossRef] [PubMed] [Green Version]
- Abraham, S.; Li, X. A cost-effective wireless sensor network system for indoor air quality monitoring applications. Procedia Comput. Sci. 2014, 34, 165–171. [Google Scholar] [CrossRef] [Green Version]
- Baldelli, A. Evaluation of a low-cost multi-channel monitor for indoor air quality through a novel, low-cost, and reproducible platform. Meas. Sens. 2021, 17, 100059. [Google Scholar] [CrossRef]
- Barkjohn, K.K.; Bergin, M.H.; Norris, C.; Schauer, J.J.; Zhang, Y.; Black, M.; Hu, M.; Zhang, J. Using Low-cost sensors to Quantify the Effects of Air Filtration on Indoor and Personal Exposure Relevant PM2.5 Concentrations in Beijing, China. Aerosol Air Qual. Res. 2020, 20, 297–313. [Google Scholar] [CrossRef]
- Casey, J.G.; Ortega, J.; Coffey, E.; Hannigan, M. Low-cost measurement techniques to characterize the influence of home heating fuel on carbon monoxide in Navajo homes. Sci. Total Environ. 2018, 625, 608–618. [Google Scholar] [CrossRef]
- Coleman, J.; Teitelbaum, E.; Guo, H.; Read, J.; Meggers, F. Examining Architectural Air and Temperature with Novel Sensing Techniques. CISBAT 2017 Int. Conf. Build. Dist.-Energy Effic. Nano Urban Scale 2017, 122, 1135–1140. [Google Scholar] [CrossRef]
- Coulby, G.; Clear, A.K.; Jones, O.; Godfrey, A. Low-cost, multimodal environmental monitoring based on the Internet of Things. Build. Environ. 2021, 203, 108014. [Google Scholar] [CrossRef]
- Demanega, I.; Mujan, I.; Singer, B.C.; Anđelković, A.S.; Babich, F.; Licina, D. Performance assessment of low-cost environmental monitors and single sensors under variable indoor air quality and thermal conditions. Build. Environ. 2021, 187, 107415. [Google Scholar] [CrossRef]
- Gillooly, S.E.; Zhou, Y.; Vallarino, J.; Chu, M.T.; Michanowicz, D.R.; Levy, J.I.; Adamkiewicz, G. Development of an in-home, real-time air pollutant sensor platform and implications for community use. Environ. Pollut. 2019, 244, 440–450. [Google Scholar] [CrossRef] [PubMed]
- Kim, J.; Chu, C.; Shin, S. ISSAQ: An Integrated Sensing Systems for Real-Time Indoor Air Quality Monitoring. IEEE Sens. J. 2014, 14, 4230–4244. [Google Scholar] [CrossRef]
- Karami, M.; McMorrow, G.V.; Wang, L. Continuous monitoring of indoor environmental quality using an Arduino-based data acquisition system. J. Build. Eng. 2018, 19, 412–419. [Google Scholar] [CrossRef]
- Marinov, M.B.; Ganev, B.T.; Nikolov, D.N. Indoor Air Quality Assessment Using Low-cost Commercial Off-the-Shelf Sensors. In Proceedings of the 2021 6th International Symposium on Environment-Friendly Energies and Applications (EFEA), Sofia, Bulgaria, 24–26 March 2021; pp. 1–4. [Google Scholar]
- Manibusan, S.; Mainelis, G. Performance of Four Consumer-grade Air Pollution Measurement Devices in Different Residences. Aerosol Air Qual. Res. 2020, 20, 217–230. [Google Scholar] [CrossRef] [Green Version]
- Marques, G.; Pitarma, R. A Cost-Effective Air Quality Supervision Solution for Enhanced Living Environments through the Internet of Things. Electronics 2019, 8, 170. [Google Scholar] [CrossRef] [Green Version]
- Mazaheri, M.; Clifford, S.; Yeganeh, B.; Viana, M.; Rizza, V.; Flament, R.; Buonanno, G.; Morawska, L. Investigations into factors affecting personal exposure to particles in urban microenvironments using low-cost sensors. Environ. Int. 2018, 120, 496–504. [Google Scholar] [CrossRef] [PubMed]
- Moreno-Rangel, A.; Sharpe, T.; Musau, F.; McGill, G. Field evaluation of a low-cost indoor air quality monitor to quantify exposure to pollutants in residential environments. J. Sens. Sens. Syst. 2018, 7, 373–388. [Google Scholar] [CrossRef] [Green Version]
- Palmisani, J.; Di Gilio, A.; Viana, M.; de Gennaro, G.; Ferro, A. Indoor air quality evaluation in oncology units at two European hospitals: Low-cost sensors for TVOCs, PM2.5 and CO2 real-time monitoring. Build. Environ. 2021, 205, 108237. [Google Scholar] [CrossRef]
- Parkinson, T.; Parkinson, A.; de Dear, R. Continuous IEQ monitoring system: Performance specifications and thermal comfort classification. Build. Environ. 2019, 149, 241–252. [Google Scholar] [CrossRef] [Green Version]
- Patel, S.; Li, J.; Pandey, A.; Pervez, S.; Chakrabarty, R.K.; Biswas, P. Spatio-temporal measurement of indoor particulate matter concentrations using a wireless network of low-cost sensors in households using solid fuels. Environ. Res. 2017, 152, 59–65. [Google Scholar] [CrossRef] [PubMed] [Green Version]
- Peladarinos, N.; Cheimaras, V.; Piromalis, D.; Arvanitis, K.G.; Papageorgas, P.; Monios, N.; Dogas, I.; Stojmenovic, M.; Tsaramirsis, G. Early Warning Systems for COVID-19 Infections Based on Low-Cost Indoor Air-Quality Sensors and LPWANs. Sensors 2021, 21, 6183. [Google Scholar] [CrossRef] [PubMed]
- Pokhrel, A.K.; Bates, M.N.; Acharya, J.; Valentiner-Branth, P.; Chandyo, R.K.; Shrestha, P.S.; Raut, A.K.; Smith, K.R. PM2.5 in household kitchens of Bhaktapur, Nepal, using four different cooking fuels. Atmos. Environ. 2015, 113, 159–168. [Google Scholar] [CrossRef]
- Qabbal, L.; Younsi, Z.; Naji, H. An indoor air quality and thermal comfort appraisal in a retrofitted university building via low-cost smart sensor. Indoor Built Environ. 2021, 31, 586–606. [Google Scholar] [CrossRef]
- Semple, S.; Ibrahim, A.E.; Apsley, A.; Steiner, M.; Turner, S. Using a new, low-cost air quality sensor to quantify second-hand smoke (SHS) levels in homes. Tob. Control 2015, 24, 153–158. [Google Scholar] [CrossRef]
- Spinelle, L.; Gerboles, M.; Villani, M.G.; Aleixandre, M.; Bonavitacola, F. Field calibration of a cluster of low-cost available sensors for air quality monitoring. Part A: Ozone and nitrogen dioxide. Sens. Actuators B Chem. 2015, 215, 249–257. [Google Scholar] [CrossRef]
- Spinelle, L.; Gerboles, M.; Villani, M.G.; Aleixandre, M.; Bonavitacola, F. Field calibration of a cluster of low-cost commercially available sensors for air quality monitoring. Part B: NO, CO and CO2. Sens. Actuators B Chem. 2017, 238, 706–715. [Google Scholar] [CrossRef]
- Steinle, S.; Reis, S.; Sabel, C.E.; Semple, S.; Twigg, M.M.; Braban, C.F.; Leeson, S.R.; Heal, M.R.; Harrison, D.; Lin, C.; et al. Personal exposure monitoring of PM2.5 in indoor and outdoor microenvironments. Sci. Total Environ. 2015, 508, 383–394. [Google Scholar] [CrossRef] [Green Version]
- Tiele, A.; Esfahani, S.; Covington, J. Design and Development of a Low-Cost, Portable Monitoring Device for Indoor Environment Quality. J. Sens. 2018, 2018, 5353816. [Google Scholar] [CrossRef]
- Trilles, S.; Vicente, A.B.; Juan, P.; Ramos, F.; Meseguer, S.; Serra, L. Reliability Validation of a Low-Cost Particulate Matter IoT Sensor in Indoor and Outdoor Environments Using a Reference Sampler. Sustainability 2019, 11, 7220. [Google Scholar] [CrossRef] [Green Version]
- Wang, Z.; Delp, W.W.; Singer, B.C. Performance of low-cost indoor air quality monitors for PM2.5 and PM10 from residential sources. Build. Environ. 2020, 171, 106654. [Google Scholar] [CrossRef]
- Zamora, M.L.; Rice, J.; Koehler, K. One year evaluation of three low-cost PM2.5 monitors. Atmos. Environ. 2020, 235, 117615. [Google Scholar] [CrossRef] [PubMed]
- Zhang, H.; Srinivasan, R.; Ganesan, V. Low Cost, Multi-Pollutant Sensing System Using Raspberry Pi for Indoor Air Quality Monitoring. Sustainability 2021, 13, 370. [Google Scholar] [CrossRef]
- Zhao, Y.; Zhao, B. Reducing human exposure to PM2.5 generated while cooking typical Chinese cuisine. Build. Environ. 2020, 168, 106522. [Google Scholar] [CrossRef]
- Tryner, J.; L’Orange, C.; Mehaffy, J.; Miller-Lionberg, D.; Hofstetter, J.C.; Wilson, A.; Volckens, J. Laboratory evaluation of low-cost PurpleAir PM monitors and in-field correction using co-located portable filter samplers. Atmos. Environ. 2020, 220, 117067. [Google Scholar] [CrossRef]
- Zou, Y.; Young, M.; Chen, J.; Liu, J.; May, A.; Clark, J.D. Examining the functional range of commercially available low-cost airborne particle sensors and consequences for monitoring of indoor air quality in residences. Indoor Air 2020, 30, 213–234. [Google Scholar] [CrossRef] [PubMed]
- Nguyen, J.L.; Schwartz, J.; Dockery, D.W. The relationship between indoor and outdoor temperature, apparent temperature, relative humidity, and absolute humidity. Indoor Air 2014, 24, 103–112. [Google Scholar] [CrossRef] [PubMed] [Green Version]
- Arens, E.; Ghahramani, A.; Przybyla, R.; Andersen, M.; Min, S.; Peffer, T.; Raftery, P.; Zhu, M.; Luu, V.; Zhang, H. Measuring 3D indoor air velocity via an inexpensive low-power ultrasonic anemometer. Energy Build. 2020, 211, 109805. [Google Scholar] [CrossRef] [Green Version]
- Bhattacharya, A.; Pantelic, J.; Ghahramani, A.; Mousavi, E.S. Three-dimensional analysis of the effect of human movement on indoor airflow patterns. Indoor Air 2021, 31, 587–601. [Google Scholar] [CrossRef]
- Ghahramani, A.; Zhu, M.; Przybyla, R.; Andersen, M.; Min, S.; Zhang, H.; Peffer, T.; Arens, E. An Inexpensive Low-Power Ultrasonic 3-Dimensional Air Velocity Sensor. In Proceedings of the 2019 IEEE Sensors, Montreal, QC, Canada, 27–30 October 2019; pp. 1–4. [Google Scholar]
- Ghahramani, A.; Zhang, K.; Dutta, K.; Yang, Z.; Becerik-Gerber, B. Energy savings from temperature setpoints and deadband: Quantifying the influence of building and system properties on savings. Appl. Energy 2016, 165, 930–942. [Google Scholar] [CrossRef] [Green Version]
- Ghahramani, A.; Galicia, P.; Lehrer, D.; Varghese, Z.; Wang, Z.; Pandit, Y. Artificial intelligence for efficient thermal comfort systems: Requirements, current applications and future directions. Front. Built Environ. 2020, 6, 49. [Google Scholar] [CrossRef]
- Ghahramani, A.; Tang, C.; Becerik-Gerber, B. An online learning approach for quantifying personalized thermal comfort via adaptive stochastic modeling. Build. Environ. 2015, 92, 86–96. [Google Scholar] [CrossRef] [Green Version]
- Kim, J.-H.; Kim, H.-G.; Yeo, M.-S. Ventilation and Filtration Control Strategy Considering PM2.5, IAQ, and System Energy. Atmosphere 2020, 11, 1140. [Google Scholar] [CrossRef]
- Rodgers, K.; Handy, R.; Hutzel, W. Indoor air quality (IAQ) improvements using biofiltration in a highly efficient residential home. J. Green Build. 2013, 8, 22–27. [Google Scholar] [CrossRef]
- Zhong, L.; Haghighat, F.; Lee, C.-S.; Lakdawala, N. Performance of ultraviolet photocatalytic oxidation for indoor air applications: Systematic experimental evaluation. J. Hazard. Mater. 2013, 261, 130–138. [Google Scholar] [CrossRef]
- Seraj, M. Managing and Monitoring IndoorAir Quality Using bi-polarAir Ionizer. Invertis J. Sci. Technol. 2019, 12, 95–109. [Google Scholar]
- Zhong, L.; Haghighat, F.; Lee, C.-S. Ultraviolet photocatalytic oxidation for indoor environment applications: Experimental validation of the model. Build. Environ. 2013, 62, 155–166. [Google Scholar] [CrossRef]
- Schurk, D.N. A Bipolar Ionization Primer for HVAC Professionals. ASHRAE J. 2021, 63, 40–46. [Google Scholar]
- Environmental Protection Agency. What are ionizers and other ozone generating air cleaners? In Indoor Air Pollution: An Introduction for Health Professionals; Environmental Protection Agency: Washington, DC, USA, 2021. [Google Scholar]
- Xue, Q.; Wang, Z.; Liu, J.; Dong, J. Indoor PM2. 5 concentrations during winter in a severe cold region of China: A comparison of passive and conventional residential buildings. Build. Environ. 2020, 180, 106857. [Google Scholar] [CrossRef]
- Bolashikov, Z.D.; Melikov, A.K. Methods for air cleaning and protection of building occupants from airborne pathogens. Build. Environ. 2009, 44, 1378–1385. [Google Scholar] [CrossRef]
- Ghahramani, A.; Zhu, M.; Przybyla, R.J.; Andersen, M.P.; Galicia, P.J.; Peffer, T.E.; Zhang, H.; Arens, E. Measuring Air Speed With a Low-Power MEMS Ultrasonic Anemometer via Adaptive Phase Tracking. IEEE Sens. J. 2019, 19, 8136–8145. [Google Scholar] [CrossRef] [Green Version]
- Li, Y.; Delsante, A. Natural ventilation induced by combined wind and thermal forces. Build. Environ. 2001, 36, 59–71. [Google Scholar] [CrossRef]
- Chartier, Y.; Pessoa-Silva, C.L. Natural Ventilation for Infection Control in Health-Care Settings; WHO: Geneva, Switzerland, 2009. [Google Scholar]


| Air Pollutant | Potential Health Effects | IAQ Code of Practice | ||
|---|---|---|---|---|
| ASHRAE | Singapore Standard SS 554 | WHO 2006 Guidelines | ||
| Carbon Dioxide | Headache/Fatigue/Nausea/Dizziness | 1000 ppm | 700 ppm above outdoor | N/A |
| Carbon Monoxide | Fatigue/Impaired vision/Reduced brain function/Nausea/Headaches/Dizziness/Flu-like symptoms/Fatal | 9 ppm | 9 ppm | 6 ppm |
| Formaldehyde | Asthma/microvascular leakage/cancer | 0.1 ppm (office) | 0.1 ppm | 0.1 ppm |
| 0.04 ppm (home) | ||||
| Nitrogen Dioxide | Eye, nose, throat irritation/Acute or chronic bronchitis/Respiratory infections | N/A | N/A | 200 μg/m3 |
| Ozone | Respiratory illness, such as cardiovascular mortality | N/A | 50 ppb | 60 ppb |
| TVOCs | Eye, nose and throat irritation/Nausea/Headaches, loss of coordination/Damage to liver, kidney, and central nervous system/Skin irritation | N/A | 3000 ppb | N/A |
| Particulate Matter | Eye, nose, and throat irritation/Aggravation of respiratory tract related ailments | 50 μg/m3 (PM10PM10) | 50 μg/m3 (PM10PM10) | 50 μg/m3 (PM10PM10) |
| 25 μg/m3 (PM2.5PM2.5) | ||||
| Category | Description |
|---|---|
| Study location | Study location revealed the country, the location where the study was conducted (e.g., kitchen, living room, etc.). The rationale behind identifying the country is to grasp a better sense of the country’s climate. |
| Deployment | The deployment column recorded the specific locations where the sensors were installed (e.g., on the desk, near fans, etc.). This information helps identify the various tested factors and the sensors’ suitability for different scenarios. |
| Duration | Duration revealed the time length of the studies, such as seven days or one year. |
| Measured factors | The measured factors recorded the type of indoor environmental factors that affect IAQ. |
| Sensor Modules | The sensor modules column kept track of the sensor brand and model name. |
| Measurement range | The measurement range documented the measuring range of each environmental factor |
| Accuracy | The accuracy information was extracted from the specifications of the sensors, which helps in evaluating the suitability of the sensors when deployed in various settings. |
| Sensor type | Sensor type indicated whether this UIAQ sensor is a stationary or a mobile sensor. |
| Occupant information and feedback | Occupant information and feedback took a record of the contextual information and feedback from the occupants via online feedback, questionnaires, and interviews. |
| (a) | ||||||||
|---|---|---|---|---|---|---|---|---|
| Study | Study Location | Deployment | Duration | Measured Factors | Sensor Modules | Measurement Range | Accuracy | Sensor Type |
| [1] | Laboratory France | Sensor 1: in front of green wall, 0.7 m above floor Sensor 2 and 3: Near fans Sensor 4: in a corner of room | - | CO | Figaro TGS2442 | 30–1000 ppm | - | S |
| CO2 | Figaro TGS4161 | 350–10,000 ppm | ±20% | |||||
| TVOCs | Figaro TGS 2602 | 1–30 ppm | - | |||||
| O3 | E2v MICS 2610 | 10–10,000 ppb | ||||||
| NO2 | E2v MICS 2714 | 0.05–5 ppm | ||||||
| [56] | Residential Spain and India | Spain: 1 m from an indoor fireplace and 0.6 m above the ground India: main living area at least 1 m above the ground | Spain: 5 days India: 7 days | CO | EL-USB-CO | 3–1000 ppm | ±7 ppm | S |
| HAPEx Nano | - | |||||||
| [57] | Laboratory USA | - | - | CO2 | MG811 | 350–10,000 ppm | - | S |
| TVOCs | TGS2602 | 1–30 ppm | ||||||
| CO | MQ7 | 20–2000 ppm | ||||||
| O3 | MQ131 | 10–1000 ppb | ||||||
| [58] | Residential Canada | 1 m above a drawer at the center of a room | 7 days | Shinyei Kaisha PPD42-60 | ±20 μg/m3 or 10% | S | ||
| CO2 | ELT Sensor T-110-3V | 400 to 10,000 ppm | ±50 ppm or 3% | |||||
| CO | Figaro Engineering TGS5342 | 0–1000 ppm | ±10 ppm | |||||
| TVOCs | Cambridge CMOS CC881B | 0–1000 ppb | ±10 ppb or 5% | |||||
| O3 | SGX Sensortech MICS-2714 | 0–1000 ppb | ±10 ppb or 5% | |||||
| NO2 | SGX Sensortech MICS-2714 | 0–1000 ppb | ±10 ppb or 5% | |||||
| [59] | Residential China | 1 m above the ground | 4 days | PMS 3003 | S | |||
| [60] | Residential USA | 1 to 5 m from stove or furnace | 2 months | CO | Alphasense COB4 | 0–45 ppm | ±10 ppm | S |
| [61] | Laboratory USA | - | - | CO2 | Telaire T6713 | 0–5000 ppm | ±30 ppm +3% | S |
| TVOCs | MiCS-5524 | 1–1000 ppm | - | |||||
| CO | MiCS-5524 | 1–1000 ppm | ||||||
| Itead DSM501A | - | |||||||
| Itead DSM501A | - | |||||||
| Formaldehyde | WSP2110 | 1–50 ppm | ||||||
| NO2 | MiCS-2714 | 0.05–10 ppm | ||||||
| [62] | Office UK | On a shelf (1.65 m high) above a computer desk | 1 month | TVOCs | CCS-811 | 0–1187 ppb | - | S |
| CO2 | MH-Z19B | 0–2000 ppm | ||||||
| PMSA003i | ||||||||
| Humidity | BME280 | 0–100% | ||||||
| [63] | Laboratory Switzerland | On the table at 0.75 m above the ground | 1 h | CO2 | Sensirion SCD40 | 0–40000 ppm | ±50 ppm ±5% | S |
| CO2meter K30 | 0–10,000 ppm | ±30 ppm ±3% | ||||||
| NovaFitness SDS018 | & ± 10 μg/m3 | |||||||
| [64] | Residential USA | On a table in the main living space | 7 days | CO | Alphasense COB4 | 0–1000 ppm | ±10 ppm | S |
| CO2 | Netatmo | 0–5000 ppm | ±50 ppm, ±5% | |||||
| NO | Alphasense NOB4 | 0–20 ppm | ±10 ppb | |||||
| NO2 | Alphasense NO2B43F | 0–20 ppm | ±50 ppb | |||||
| Alphasense OPC-N2 | 0.38–17 μm | - | ||||||
| [65] | Residential, campus and church USA | Living room, Classroom, and Church | - | TVOCs | TGS2602 | 1–30 ppm | - | S |
| NO2 | GSNT11 | 0–200 ppm | ±10% | |||||
| CO | TGS5042 | 0–10,000 ppm | - | |||||
| SO2 | SO2-AF | 400–700 ppm | ||||||
| GP2Y1010AUF | - | |||||||
| GP2Y1010AUF | ||||||||
| [66] | Laboratory USA | - | 10 days | CO2 | CO2Meter K-30 | 0–10,000 ppm | ±30 ppm ± 3% | S |
| GP2Y1010AU0F | - | |||||||
| TVOCs | CO2Meter IAQ-2000 | 350–2000 ppm | ||||||
| [67] | - | Test chamber | - | CO2 | SenseAir K30 | 0–10,000 ppm | ±30 ppm +3% | S |
| TVOCs | AMS CCS811 | 0–1200 ppb | - | |||||
| SGX Sensortech MICS-VZ89TE | 0–2000 | |||||||
| Bosch BME680 | - | |||||||
| Bosch BME688 | ||||||||
| [68] | Residential USA | Near the edge of a stable surface in the center of the living room | 2 months | AQE2 | - | - | S | |
| BlueAir Aware | ||||||||
| Foobot | ±4 µg or ±20% | |||||||
| Speck (DSM501A) | - | - | ||||||
| [69] | Laboratory Portugal | - | - | CO | MICS-6814 | 1–1000 ppm | - | S |
| NO2 | MICS-6815 | 0.05–10 ppm | ||||||
| C2H5OH | MICS-6816 | 10–500 ppm | ||||||
| H2 | MICS-6817 | 1–1000 ppm | ||||||
| NH3 | MICS-6818 | 1–500 ppm | ||||||
| CH4 | MICS-6819 | >1000 ppm | ||||||
| C3H8 | MICS-6820 | >1000 ppm | ||||||
| C4H10 | MICS-6821 | >1000 ppm | ||||||
| [70] | Residential and commercial Australia | Personal monitor carried by people | 1 week | Shinyei PPD60PV-T2 | - | - | M | |
| [71] | Residential UK | 0.9 m above a drawer | 4 days | SHARP GP2Y1010AU0F | S | |||
| TVOCs | AMS iAQ-CORE-C | 125–1000 ppb | ±1.0 ppm | |||||
| CO2 | AMS iAQ-CORE-C | 400–600 ppm | ±1.0 ppm | |||||
| [72] | Hospital Italy and Spain | 2.5 m and 1 m above the ground | Multiple months | Syhitech DSM501A | - | - | S | |
| Model 3321 Aerodynamic Particle Sizer | ||||||||
| SPK202 | ||||||||
| SPK201 | ||||||||
| TVOCs | Corvus | 0–50 ppm | ±5 ppb | |||||
| CO2 | ZyAura | 0–3000 ppm | ±75 ppm or ±5% | |||||
| [73] | Commercial Australia | In Office buildings | - | CO | TSI Q-Trak 7575 | 500–2000 ppm | ±3% or ±50 ppm | S |
| CO2 | Fieldpiece SCM4 | 0–15 ppm | ±5% or ±1 ppm | |||||
| TSI DustTrak II 8532 | - | |||||||
| TSI DustTrak II 8532 | ||||||||
| Formaldehyde | HalTech HFX205 | 0–500 ppb | ||||||
| [74] | Residential India | Integrated in the kitchen (areas around the cookstove) and room | Multiple days | GP2Y1010AU0F | - | - | S | |
| [75] | Hospital | 1.2 m above the ground at the center of each room | 24 h | TVOCs | Sensirion SVM30 | 0–60,000 ppb | 1.3% | S |
| Renesas ZMOD4410 | 0–1,000,000 ppb | ±25% | ||||||
| CO2 | Sensirion SVM30 | 400–60,000 ppm | 1.3% | |||||
| Renesas ZMOD4410 | 400–5000 ppm | ±25% | ||||||
| Sensirion SPS30 | ||||||||
| Sensirion SPS30 | ± 25% | |||||||
| [76] | Residential Nepal | 1.5 m height and about 1 m from the edge of the main stove and ≥1 m from any doors or other openings in the walls | 13 months | UCB-PATS | - | S | ||
| [77] | Laboratory France | 1.4 m above the ground on the wall behind occupants | 8 months | CO2 | NDIR | 0–5000 ppm | 50 ppm | S |
| IQ 610 | 0–10,000 ppm | 50 ppm | ||||||
| C6H6 andCO | MQ135 | 10–1000 ppm | ±5% | |||||
| Formaldehyde | MS1100 | 0–1000 ppm | ±3% | |||||
| GP2Y1010AU0F | ||||||||
| [78] | Residential Scotland | 1 m above the ground in living area, away from possible PM sources | 2 months | Dylos DC1700 | - | - | S | |
| [79] | Laboratory Italy | On an evaluation board | 5 months | CO | TGS-5042 | 0–10,000 ppm | - | S |
| MICS-4514-CO | 0–1000 ppm | |||||||
| CO2 | Gascard NG | 0–2000/3000/5000 ppm | ±2% of range ±<0.015% of range per mbar | |||||
| S-100 | 0–2000/3000/5000/10,000 ppm | ±30 ppm ±5% | ||||||
| NO2 | NO2B4 | 0–20 ppm | - | |||||
| NO2_3E50 | 0.3–50 ppm | |||||||
| MICS-2710 | 0.05–5 ppm | |||||||
| MICS-4514-NO2 | 0.05–10 ppm | |||||||
| CairClip NO2 | 0–250 ppb | |||||||
| O3 | O3B4 | 0–5 ppm | ||||||
| O3_3E1F | 0.1–1 ppm | |||||||
| NO | NO_3E100 | 0–100/200 ppm | 45 nA/ ppm ± 15 nA/ ppm | |||||
| [80] | Laboratory Italy | - | - | NO | Citytech NO_3E100 | 0–1000 ppm | 45 ± 15 nA/ppm | S |
| CO | Figaro TGS-5042 | 0–10,000 ppm | 1.2–2.4 nA/ppm | |||||
| e2V MICS-4514 | 0–1000 ppm | −0.0051(Rs/R0) /ppm | ||||||
| CO2 | Edinburgh Gascard | 0–1000 ppm | 1 V/100 ppm | |||||
| ELT S-100H | 0–5000 ppm | 1 V/1000 ppm | ||||||
| [81] | Residential and commercial Scotland | Integrated in a backpack worn by subjects | 2 months | Dylos 1700 | - | - | S | |
| [82] | Laboratory UK | On a 0.75–1.2 m height desk in front of occupant’s work areas | - | Humidity | SHT31 | 0–100% | ±2% RH | S |
| HPMA115S0 | ±15% | |||||||
| TVOC1 | CCS811 | 0–1200 ppb | - | |||||
| TVOC2 | iAQ-CoreC | 125–600 ppb | ||||||
| TVOC3 | MiCS-VZ-89TE | 0–1000 ppb | ||||||
| CO2 | T6713 | 0–5000 ppm | ±25 ppm | |||||
| CO | LLC110-102 | 0–1000 ppm | ±2 ppm | |||||
| [83] | Office Spain | Inside an office with no human presence | - | HM-3301 | - | S | ||
| HM-3301 | ||||||||
| [84] | Laboratory | On or adjacent to a wire shelving unit in the central area, several meters from source activities | - | Air Quality Egg 2018 (AQE) | m3 100–500 μg/m3: ±10% | S | ||
| IQAir AirVisual Pro (AVP) | - | |||||||
| Awair 2nd Edition (AW2) | - | : : ±15% | ||||||
| Kaiterra Laser Egg 2 (LE2) | : 100–500 μg/m3: ±10% | |||||||
| PurpleAir Indoor (PAI) | : : ±10% | |||||||
| Ikair (IKA) | : : ±10% | |||||||
| [85] | Residential USA | On a table in the living room, 3 m from the main entrance and 10 m from the kitchen | 12 months | AirVisual Pro | - | ±8% | S | |
| [86] | Laboratory and residential USA | 1.1 m above the ground, 0.5 m away from a wall, and at least a 1.5 m away from any corner | 7 days | Nova Fitness SDS011 | S | |||
| NO2 | SPEC Sensors DGS-NO2 968-043 | 0–10 ppm | ±15% | |||||
| SO2 | SPEC Sensors DGS-SO2 968-038 | 0–20 ppm | ±15% | |||||
| CO2 | CO2Meter K-30 | 0–5000 ppm | ±30% | |||||
| CO | SPEC Sensors DGS-CO 968-034 | 0–1000 ppm | ±15% | |||||
| O3 | SPEC Sensors DGS-O3 968-042 | 0–5 ppm | ±15% | |||||
| TVOCs | Ohmetech.io uThing:VOC™ | 0–500 IAQ index | ±15% | |||||
| [87] | Residential China | Sensor 1: 1.2 m above the ground in adjacent room Sensor 2: in a shoulder brace 0.15 m away from cook’s nose | 1 month and 5 days | AM510 | - | - | S | |
| (b) | ||||||||
| Study | Occupant Information and Feedback | |||||||
| [59] | A brief survey about each home, its residents, and general behavior patterns, such as home parameters, cooking days, other potential indoor PM sources. | |||||||
| [70] | Questionnaires on participants’ age and gender, socio-economic status (highest qualification) and characteristics of the indoor and outdoor environments during weekdays and weekend, such as age for their residence, ventilation conditions at home and work, type of cooktop at home and commuting preferences. | |||||||
| [76] | Questionnaires about three groups of variables: (1) Variables for the day of monitoring, such as type of primary and secondary stoves used in the house, unusual stove use pattern during the HAP monitoring period, weather conditions during the monitoring period, ventilation in the kitchen (e.g., open doors and windows) and other smoke exposure sources, such as number of smokers in the house, use of incense or mosquito coils. (2) Fixed variables, such as kitchen size or the presence of roads within 100 m. (3) Variables describing usual practices, such as types of non-electric lamp used when power is unavailable, and type of space heating used during the winter. Interviews about participants’ caregivers or parents about their occupations and household characteristics, such as construction materials. | |||||||
| [78] | Questionnaires on occupant attitudes towards smoking and interest in having a device placed at home to measure air quality. | |||||||
| [81] | Interviews and online questionnaires on personal data, such as individual’s living conditions, the household size and accommodation details, building and neighborhood characteristics and other contextual factors. | |||||||
| [82] | Feedback through an online IEQ scoring system. | |||||||
Publisher’s Note: MDPI stays neutral with regard to jurisdictional claims in published maps and institutional affiliations. |
© 2022 by the authors. Licensee MDPI, Basel, Switzerland. This article is an open access article distributed under the terms and conditions of the Creative Commons Attribution (CC BY) license (https://creativecommons.org/licenses/by/4.0/).
Share and Cite
Xu, Q.; Goh, H.C.; Mousavi, E.; Nabizadeh Rafsanjani, H.; Varghese, Z.; Pandit, Y.; Ghahramani, A. Towards Personalization of Indoor Air Quality: Review of Sensing Requirements and Field Deployments. Sensors 2022, 22, 3444. https://doi.org/10.3390/s22093444
Xu Q, Goh HC, Mousavi E, Nabizadeh Rafsanjani H, Varghese Z, Pandit Y, Ghahramani A. Towards Personalization of Indoor Air Quality: Review of Sensing Requirements and Field Deployments. Sensors. 2022; 22(9):3444. https://doi.org/10.3390/s22093444
Chicago/Turabian StyleXu, Qian, Hui Ci Goh, Ehsan Mousavi, Hamed Nabizadeh Rafsanjani, Zubin Varghese, Yogesh Pandit, and Ali Ghahramani. 2022. "Towards Personalization of Indoor Air Quality: Review of Sensing Requirements and Field Deployments" Sensors 22, no. 9: 3444. https://doi.org/10.3390/s22093444
APA StyleXu, Q., Goh, H. C., Mousavi, E., Nabizadeh Rafsanjani, H., Varghese, Z., Pandit, Y., & Ghahramani, A. (2022). Towards Personalization of Indoor Air Quality: Review of Sensing Requirements and Field Deployments. Sensors, 22(9), 3444. https://doi.org/10.3390/s22093444