
Comprehensive Performance Analysis of Zigbee Communication: An Experimental Approach with XBee S2C Module


Abstract
:1. Introduction
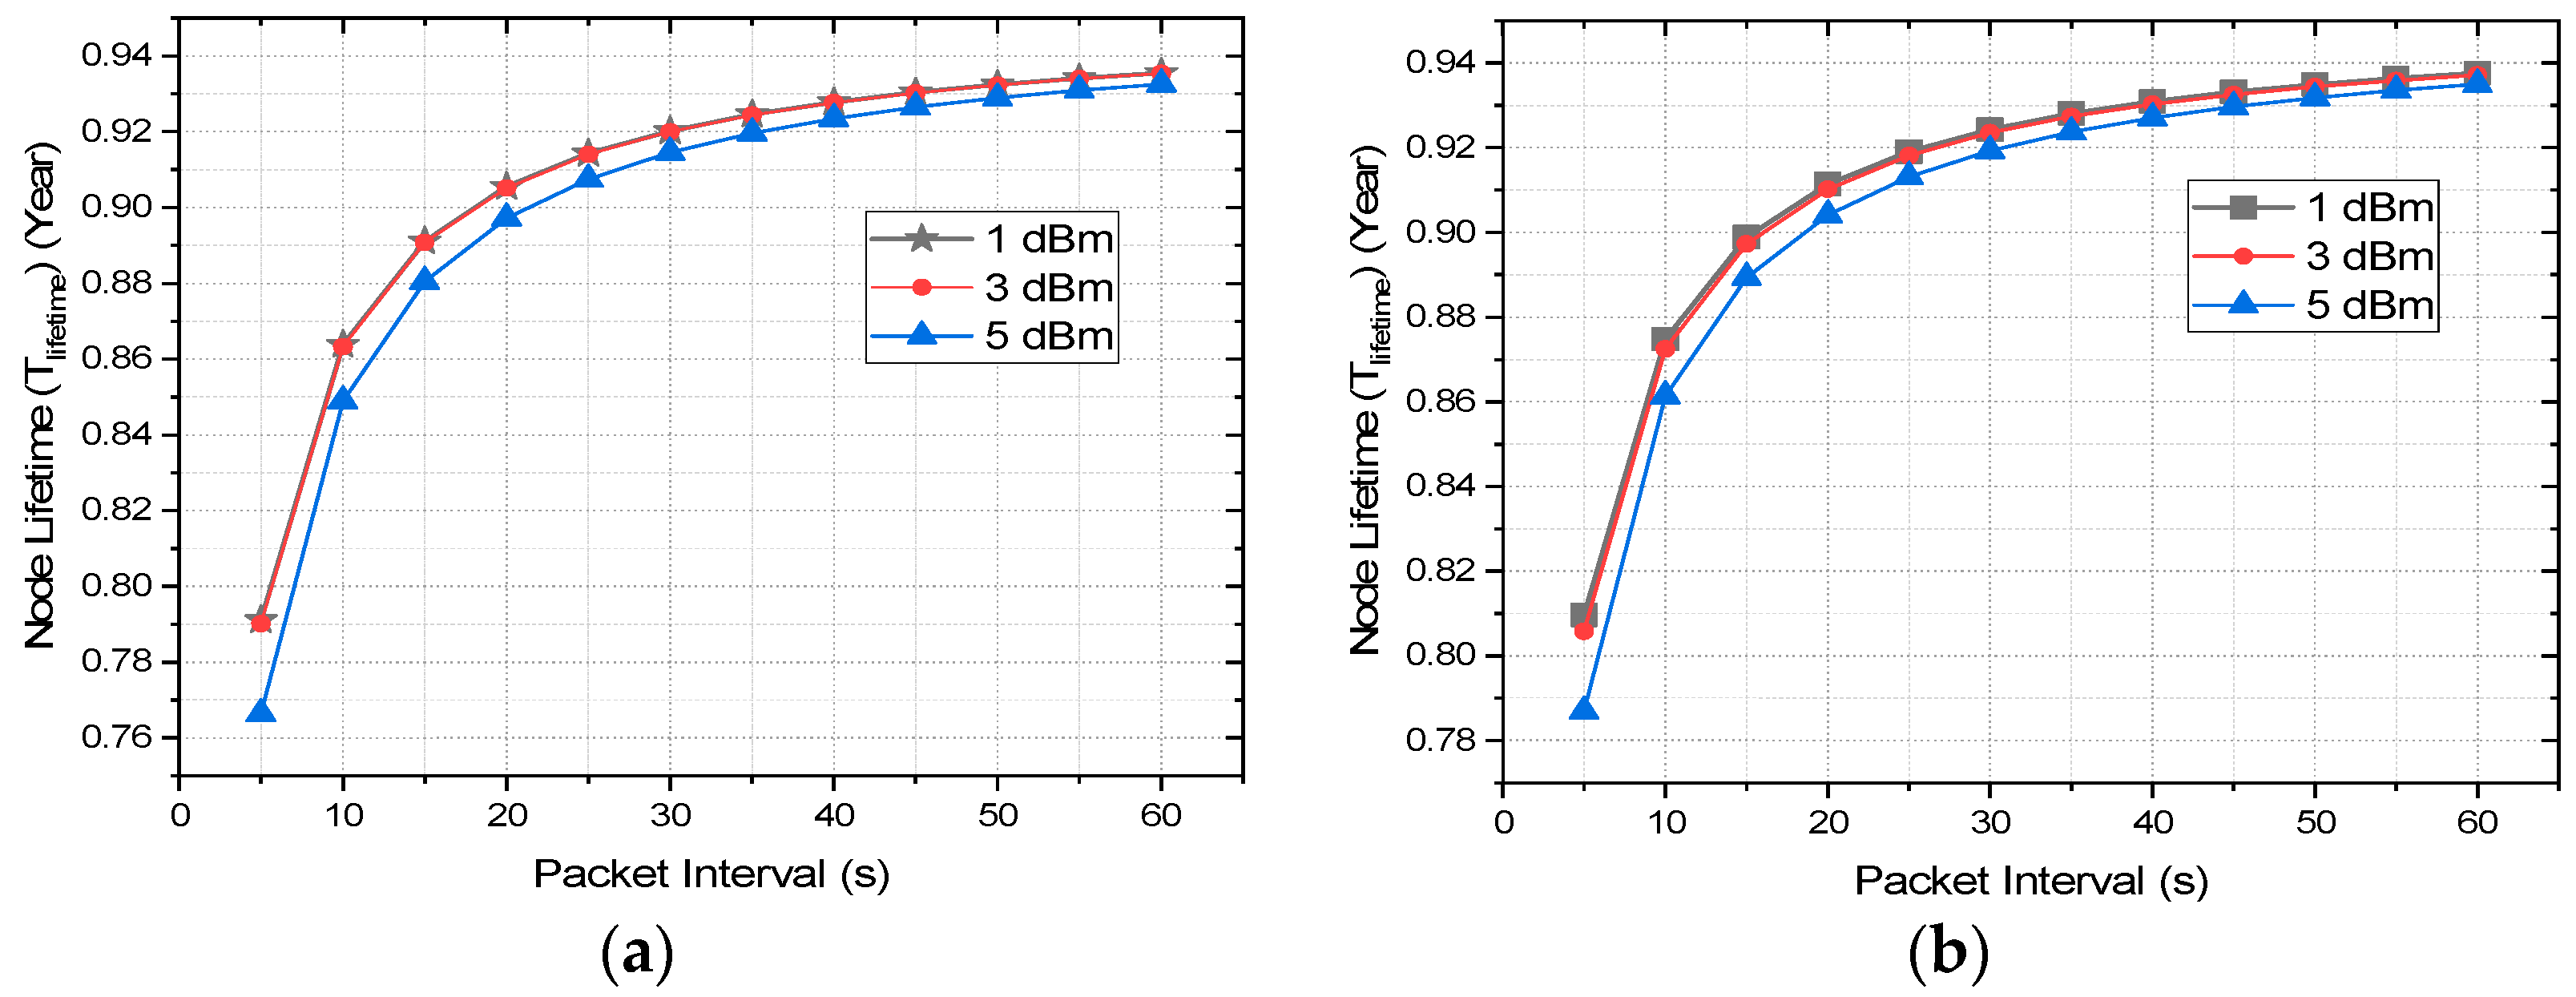
- We analyzed the PDR, energy consumption, and network lifetime for the different transmission power levels of the XBee S2C module; evaluated the optimized power level based on the performance and trade-offs.
- We developed an algorithm to measure the node lifetime and we verified the current consumption through an experimental testbed.
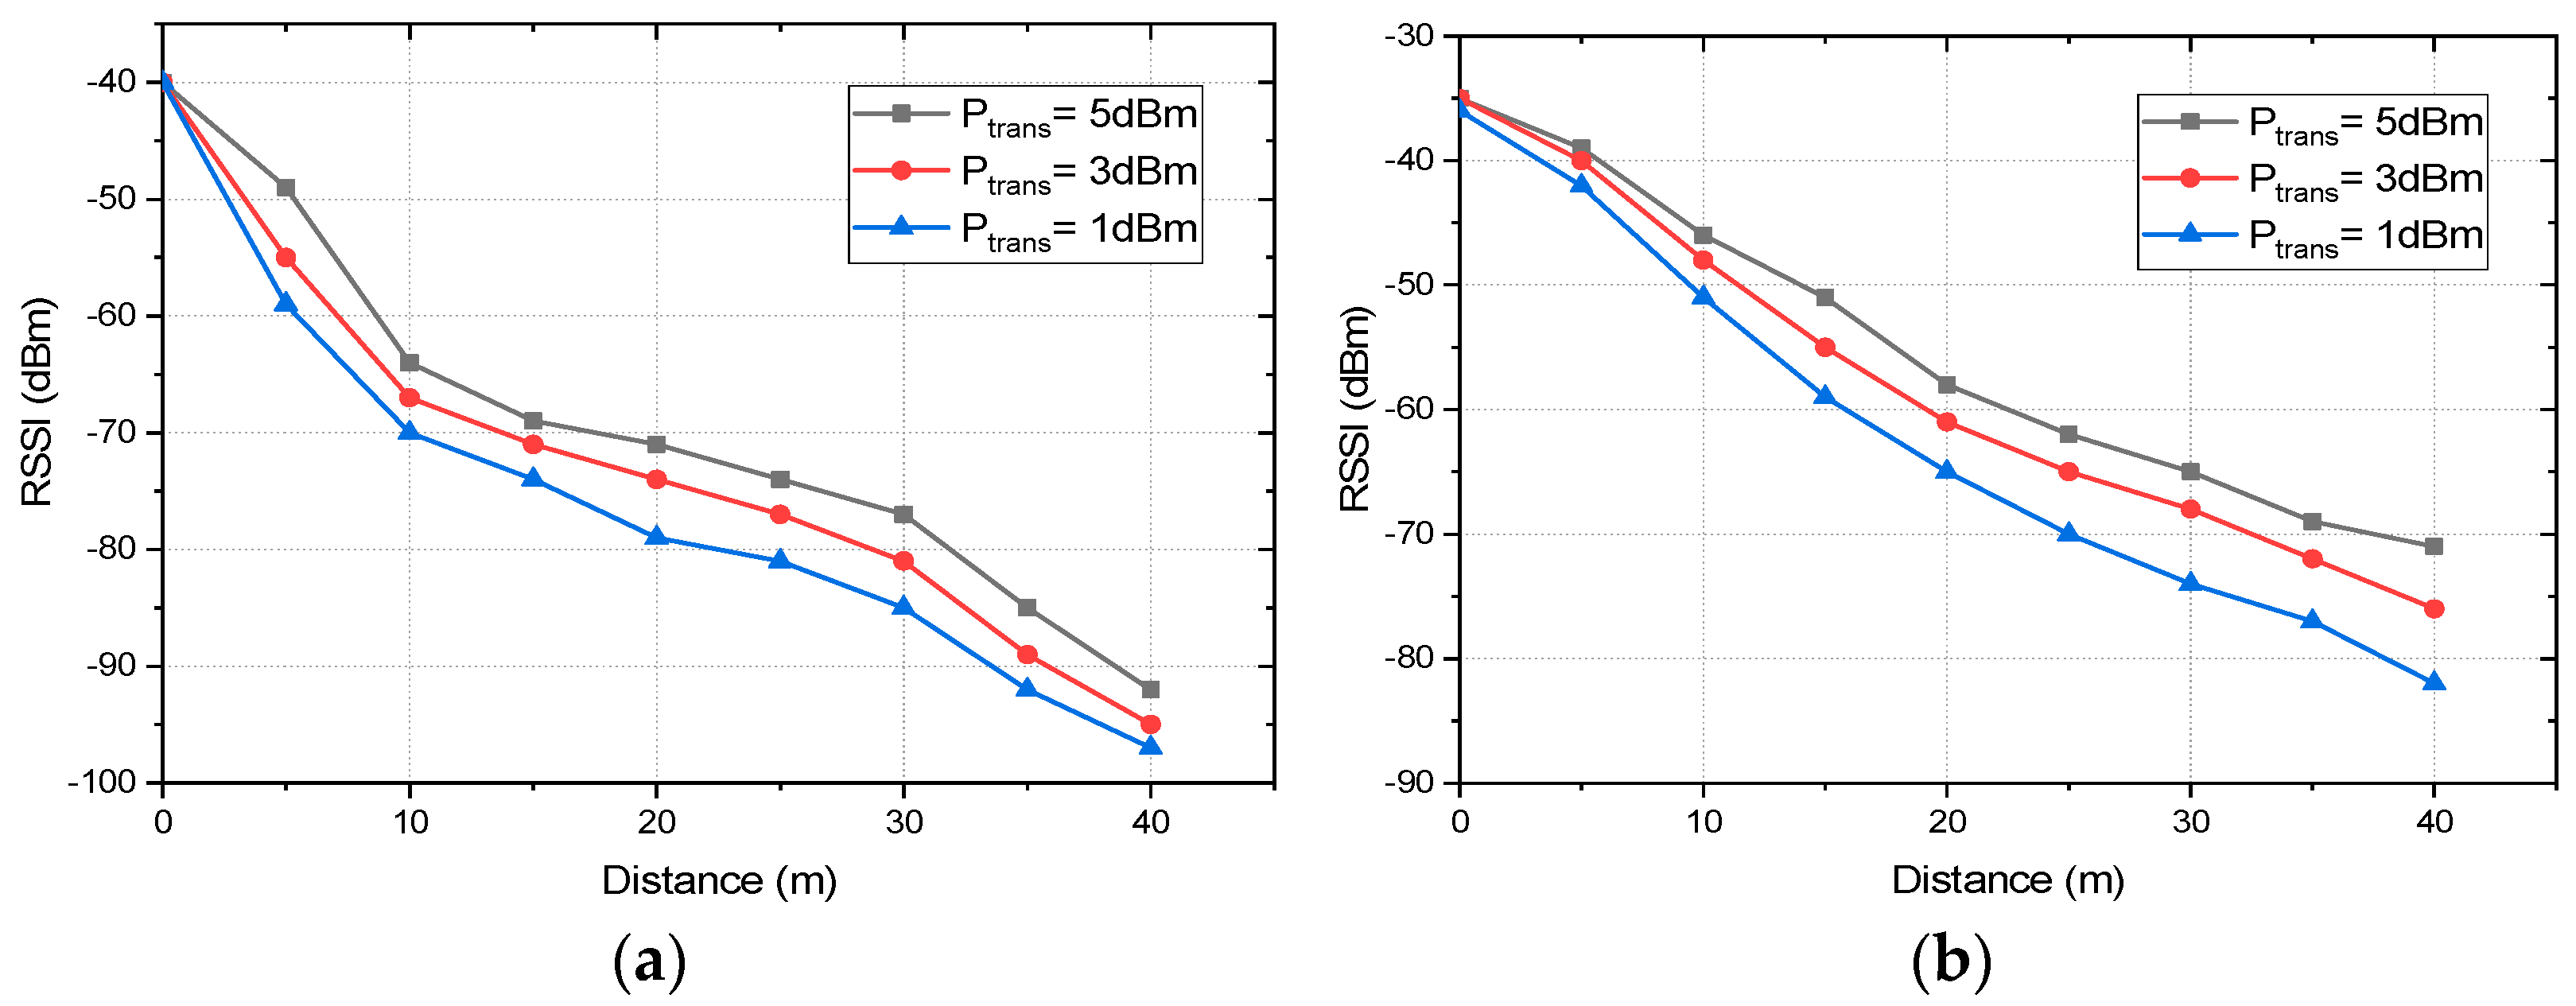
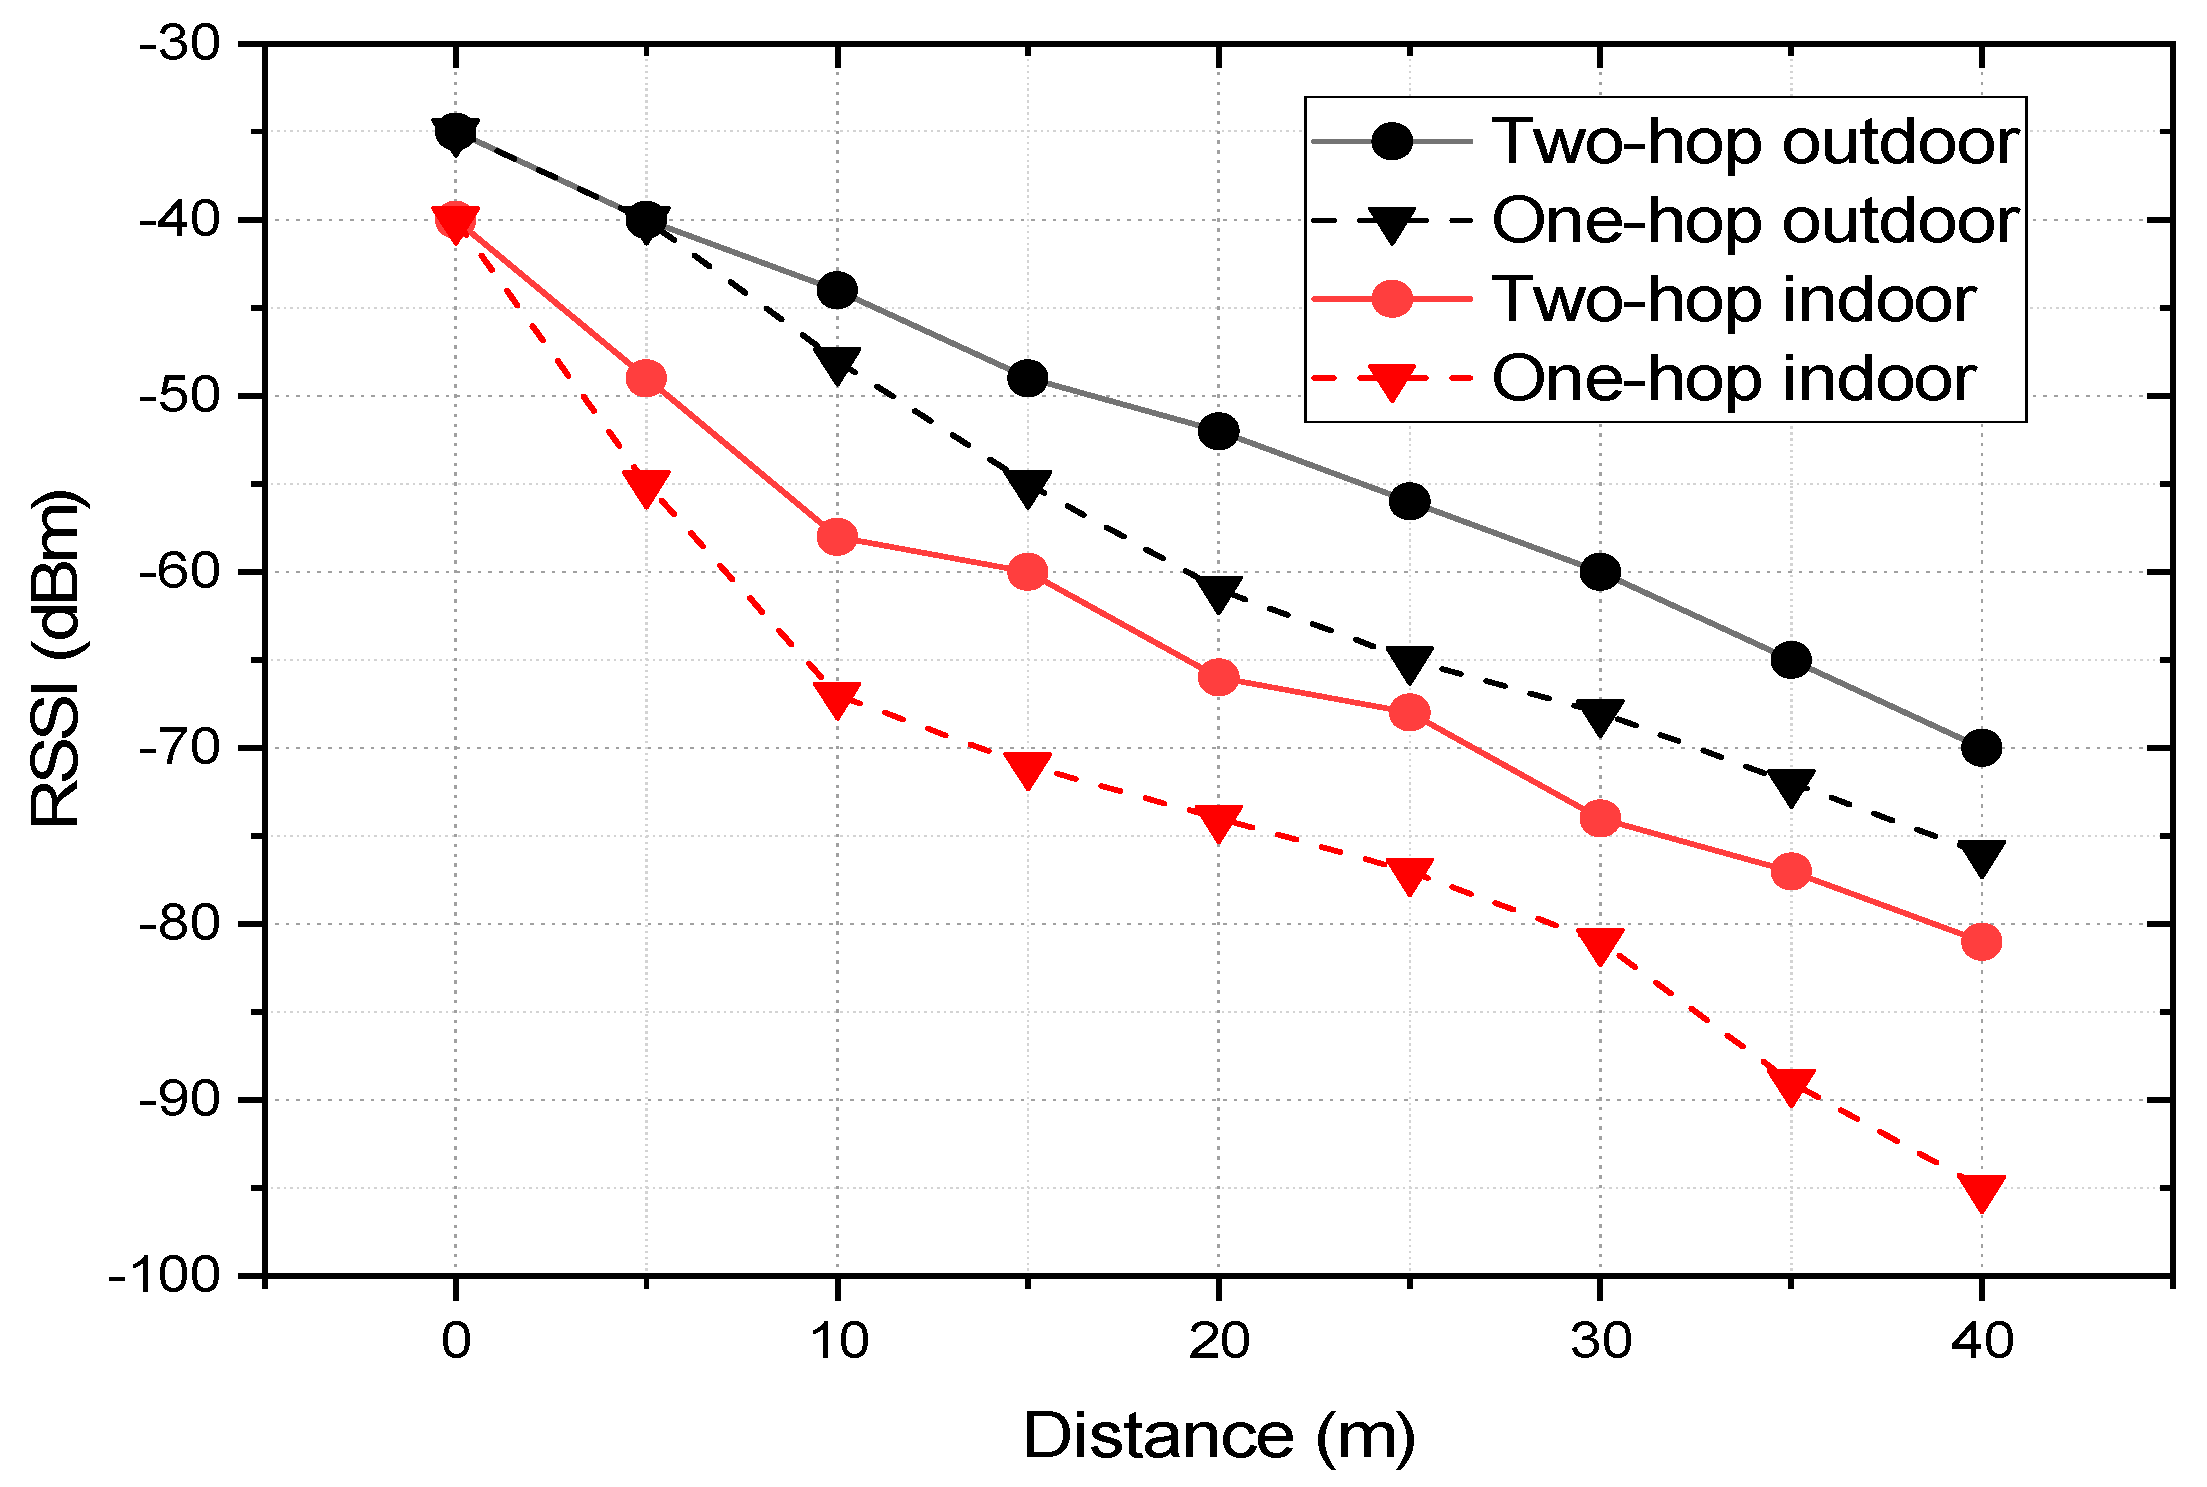
- We analyzed link quality in terms of the received signal strength indicator (RSSI) for both indoor and outdoor environments with different transmission power levels and the number of hops. This presents a detailed study of how the tx power, network environment, and hopping impact the link quality.
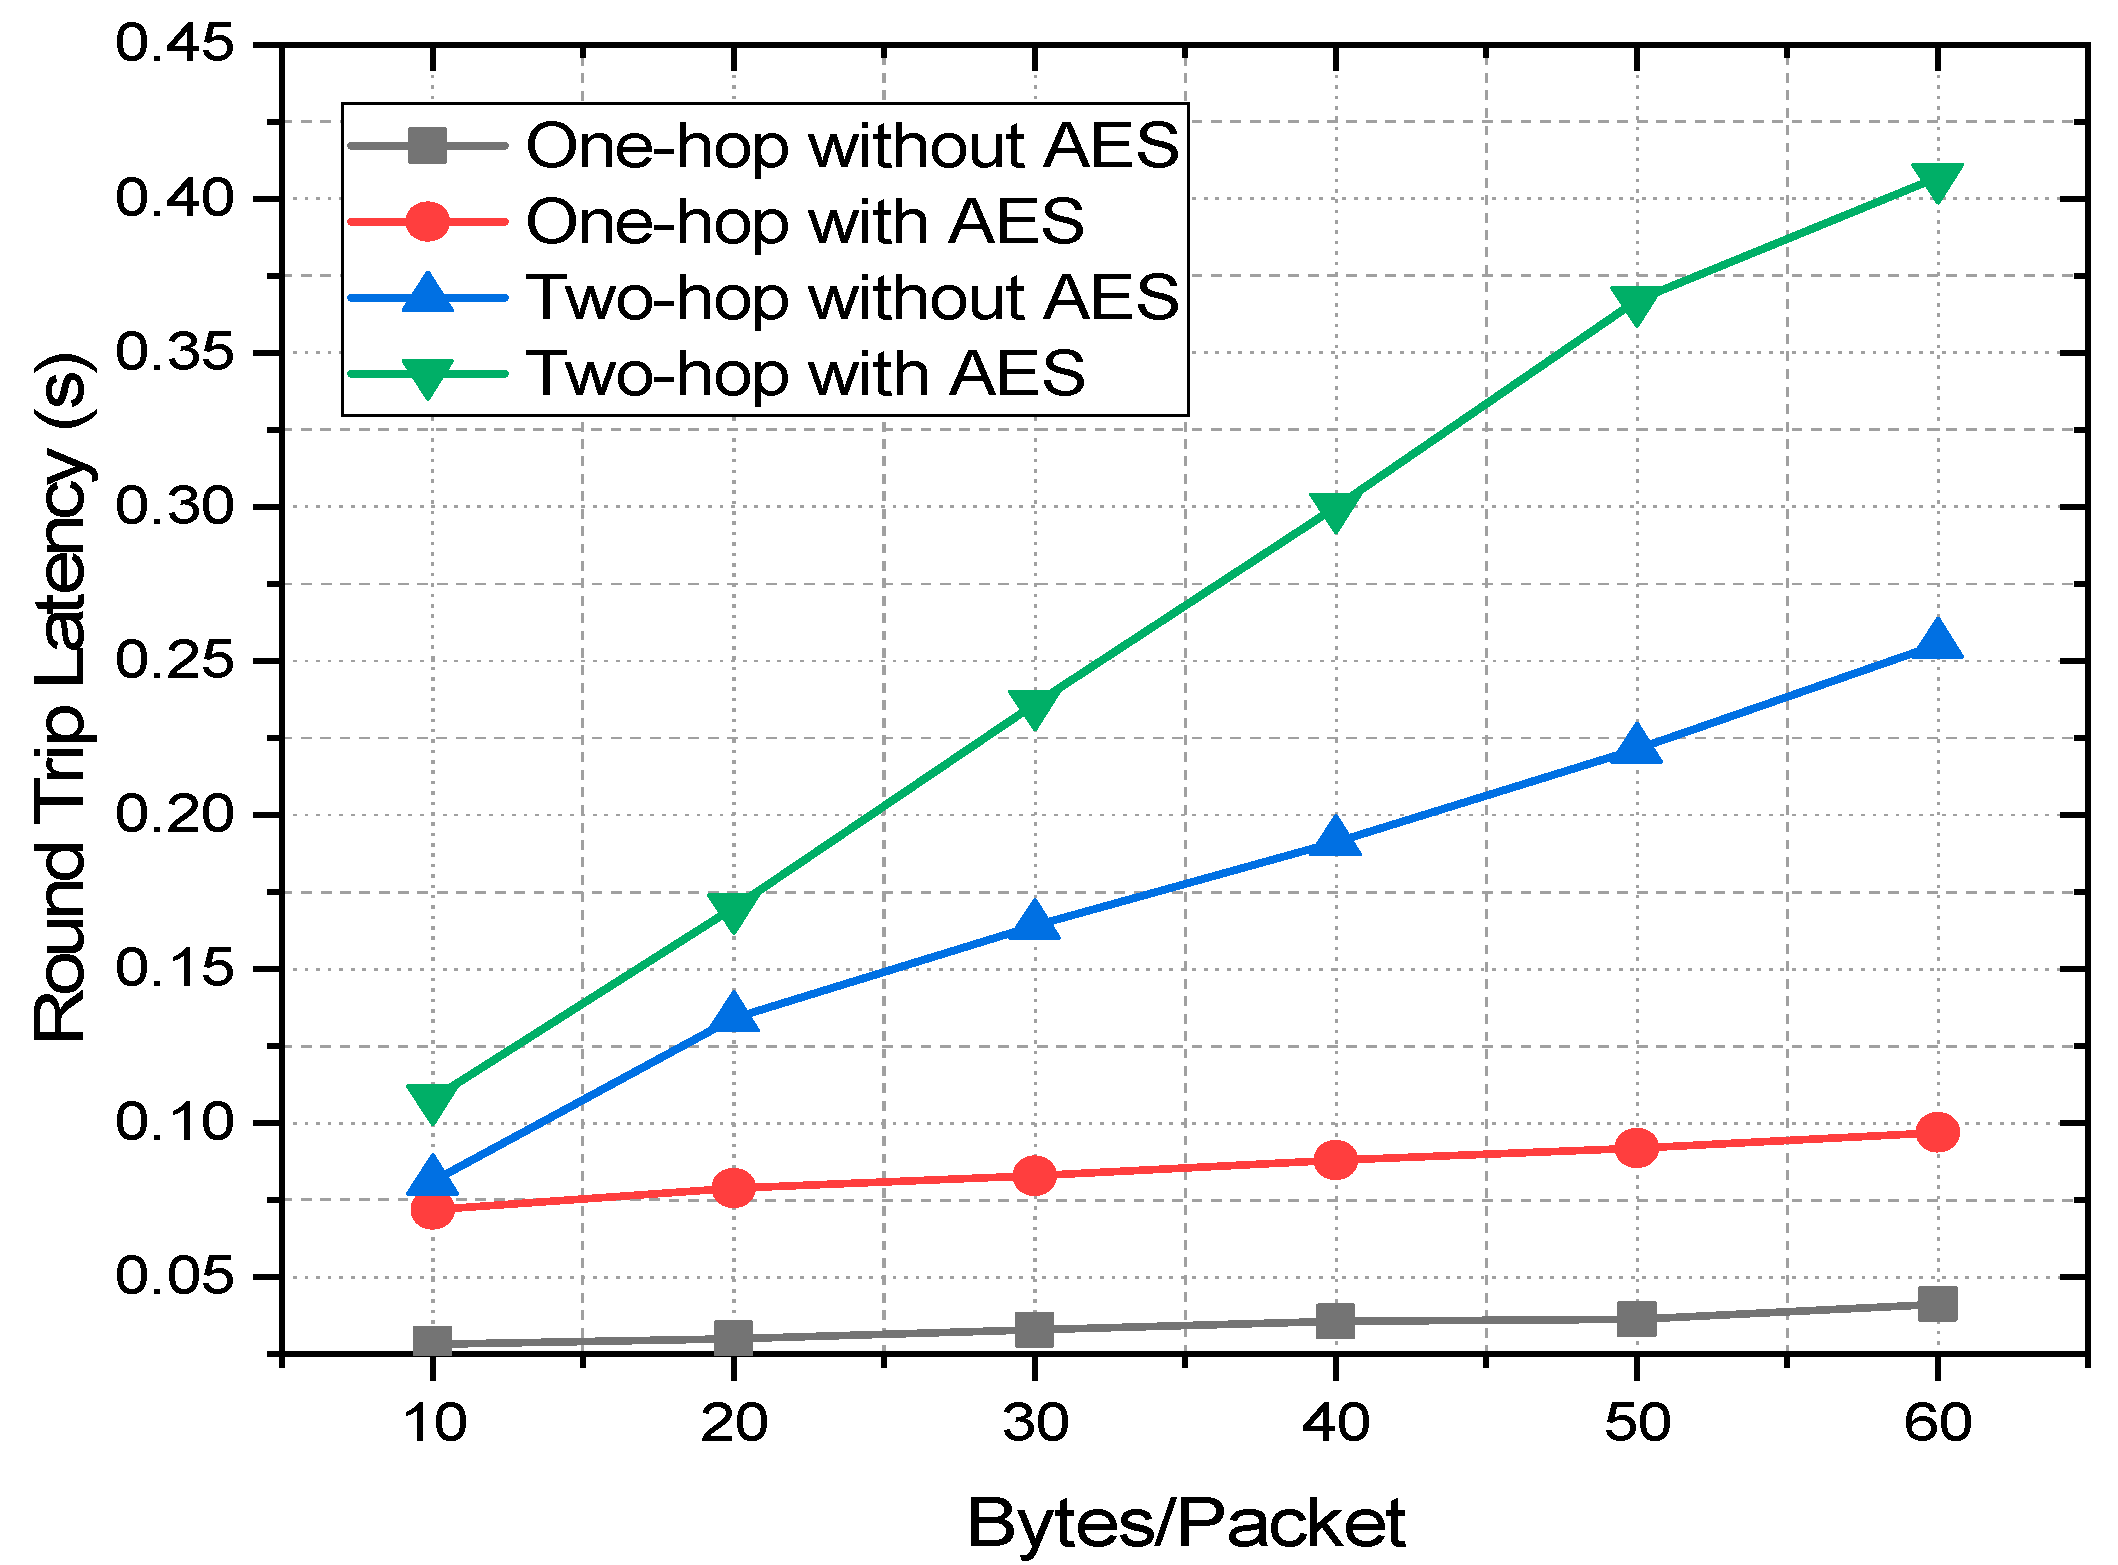
- Latency was analyzed for different baud rates and packet sizes in both indoor and outdoor environments with encrypted and unencrypted communication. This depicts the trade-offs among latency, encryption, multi-hopping, and packet sizes.
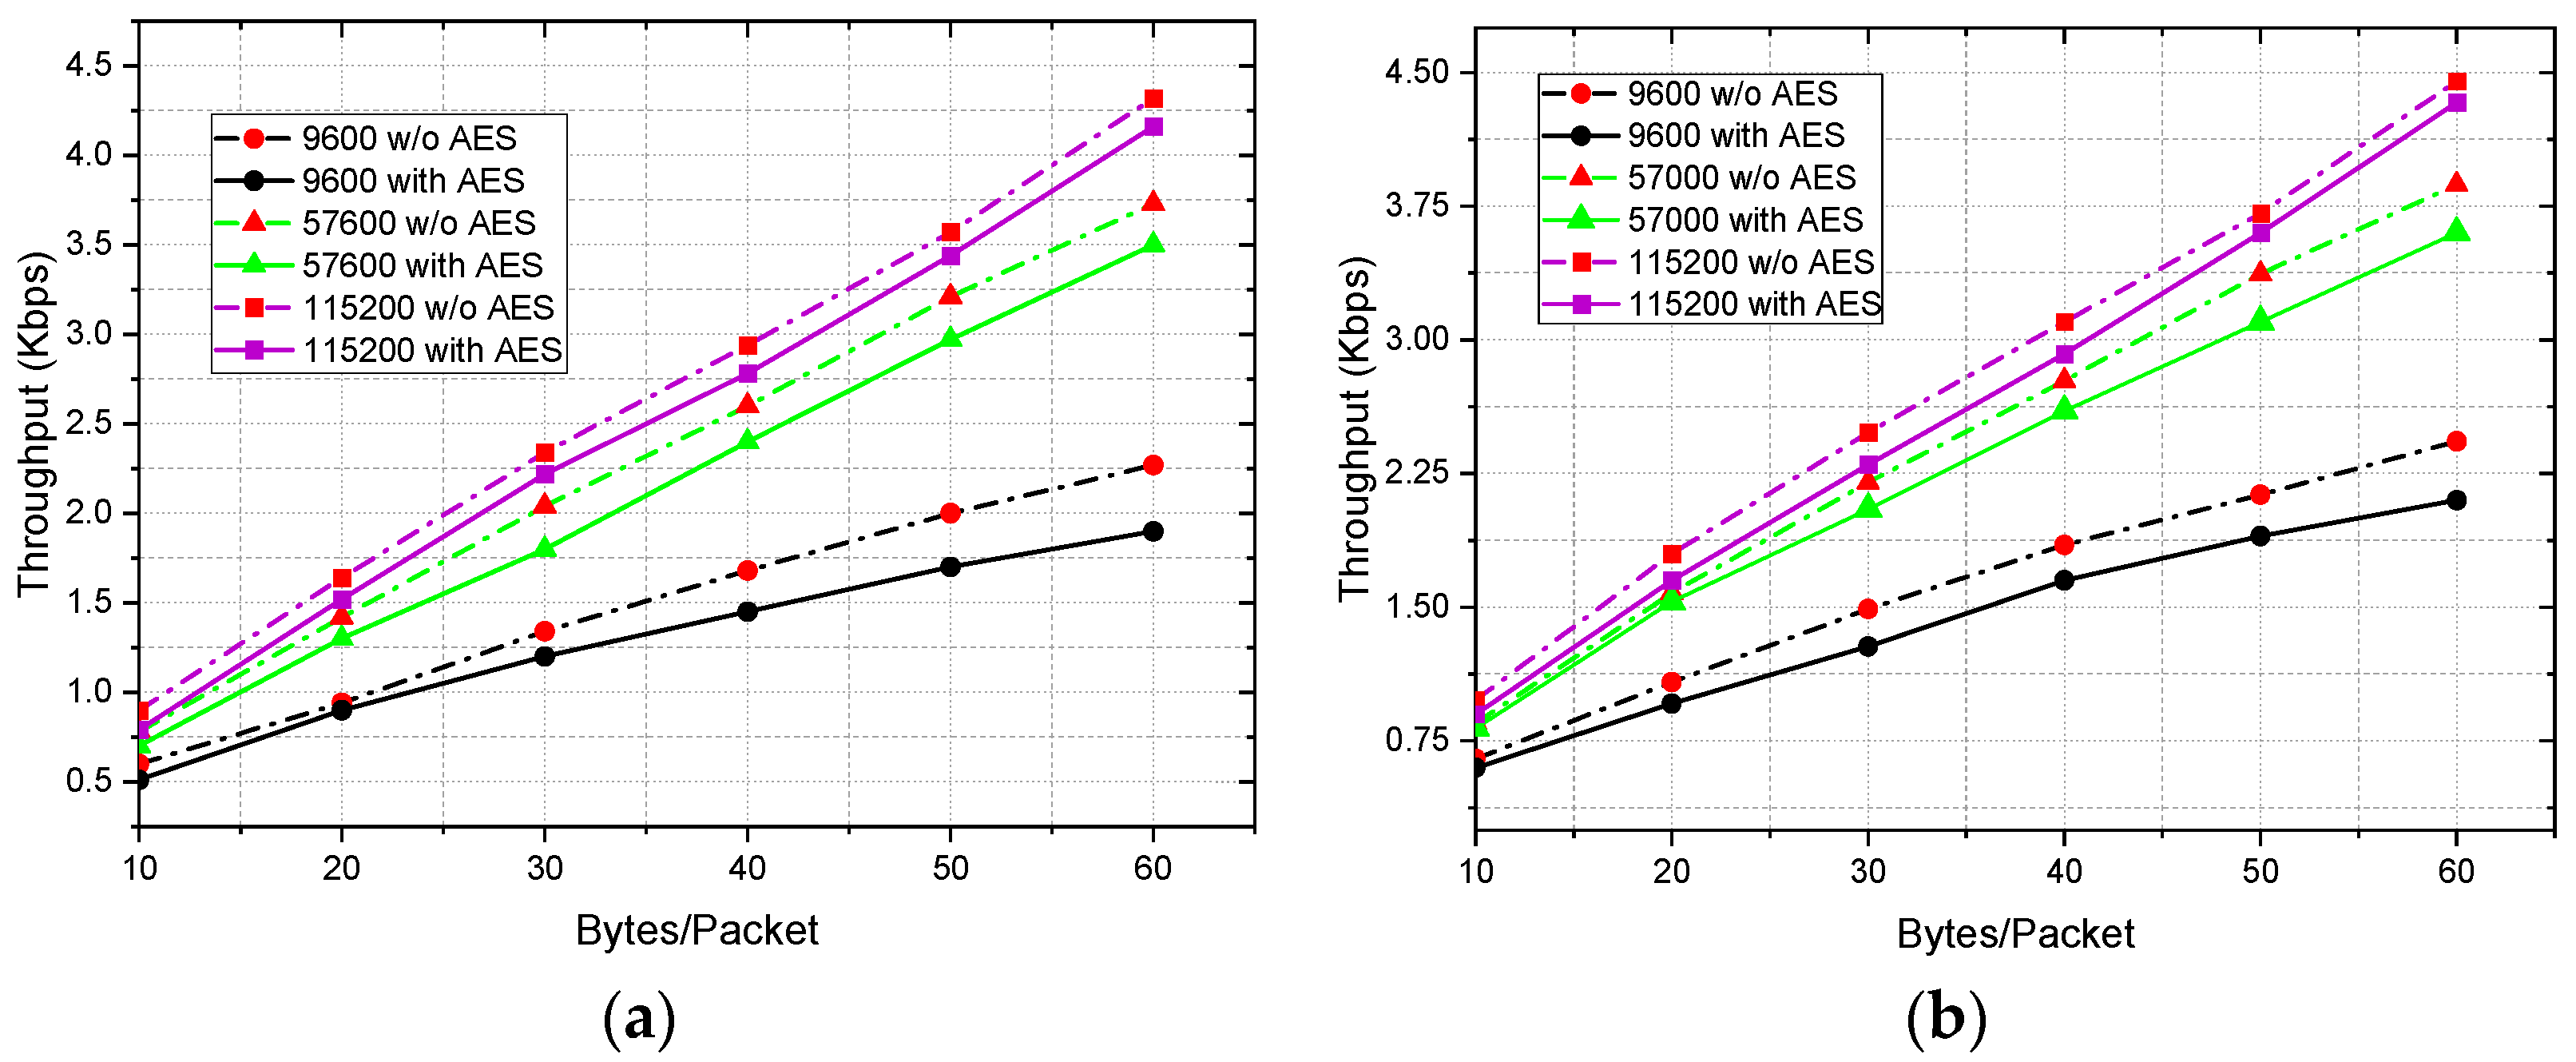
- Throughput evaluation was performed via an experimental testbed at various baud rates to identify the trade-offs between packet size, encryption, and throughput at various indoor and outdoor scenarios.
2. Background and Related Works
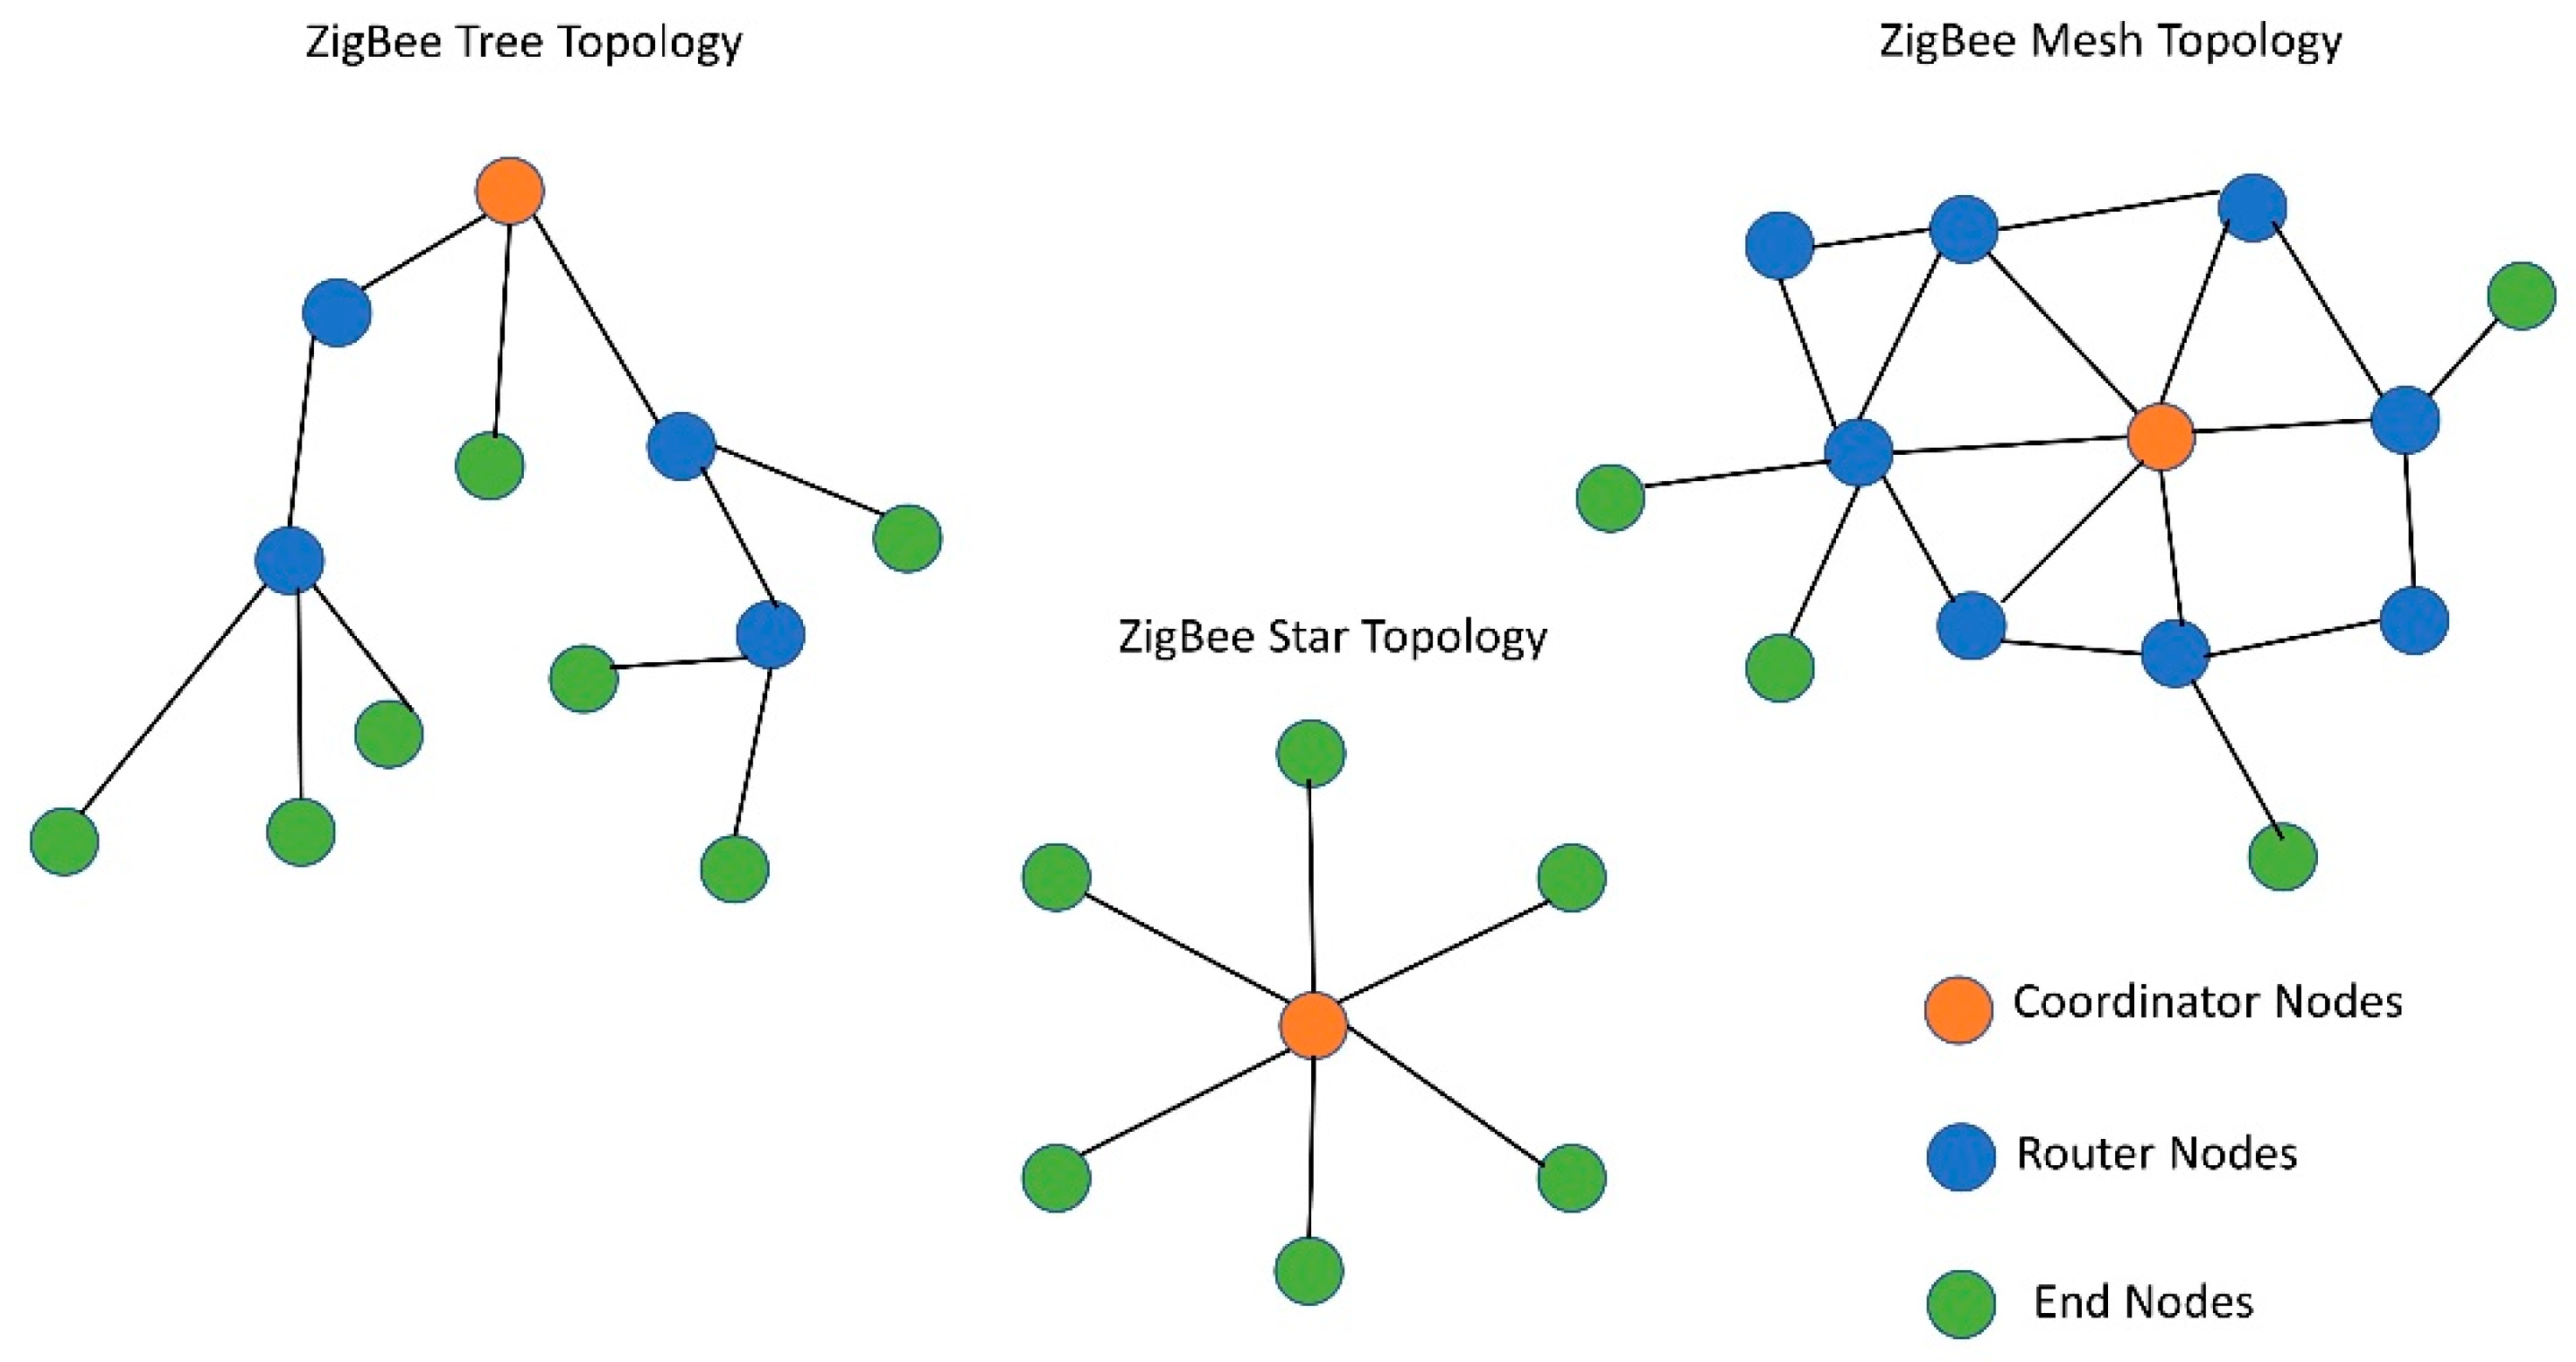
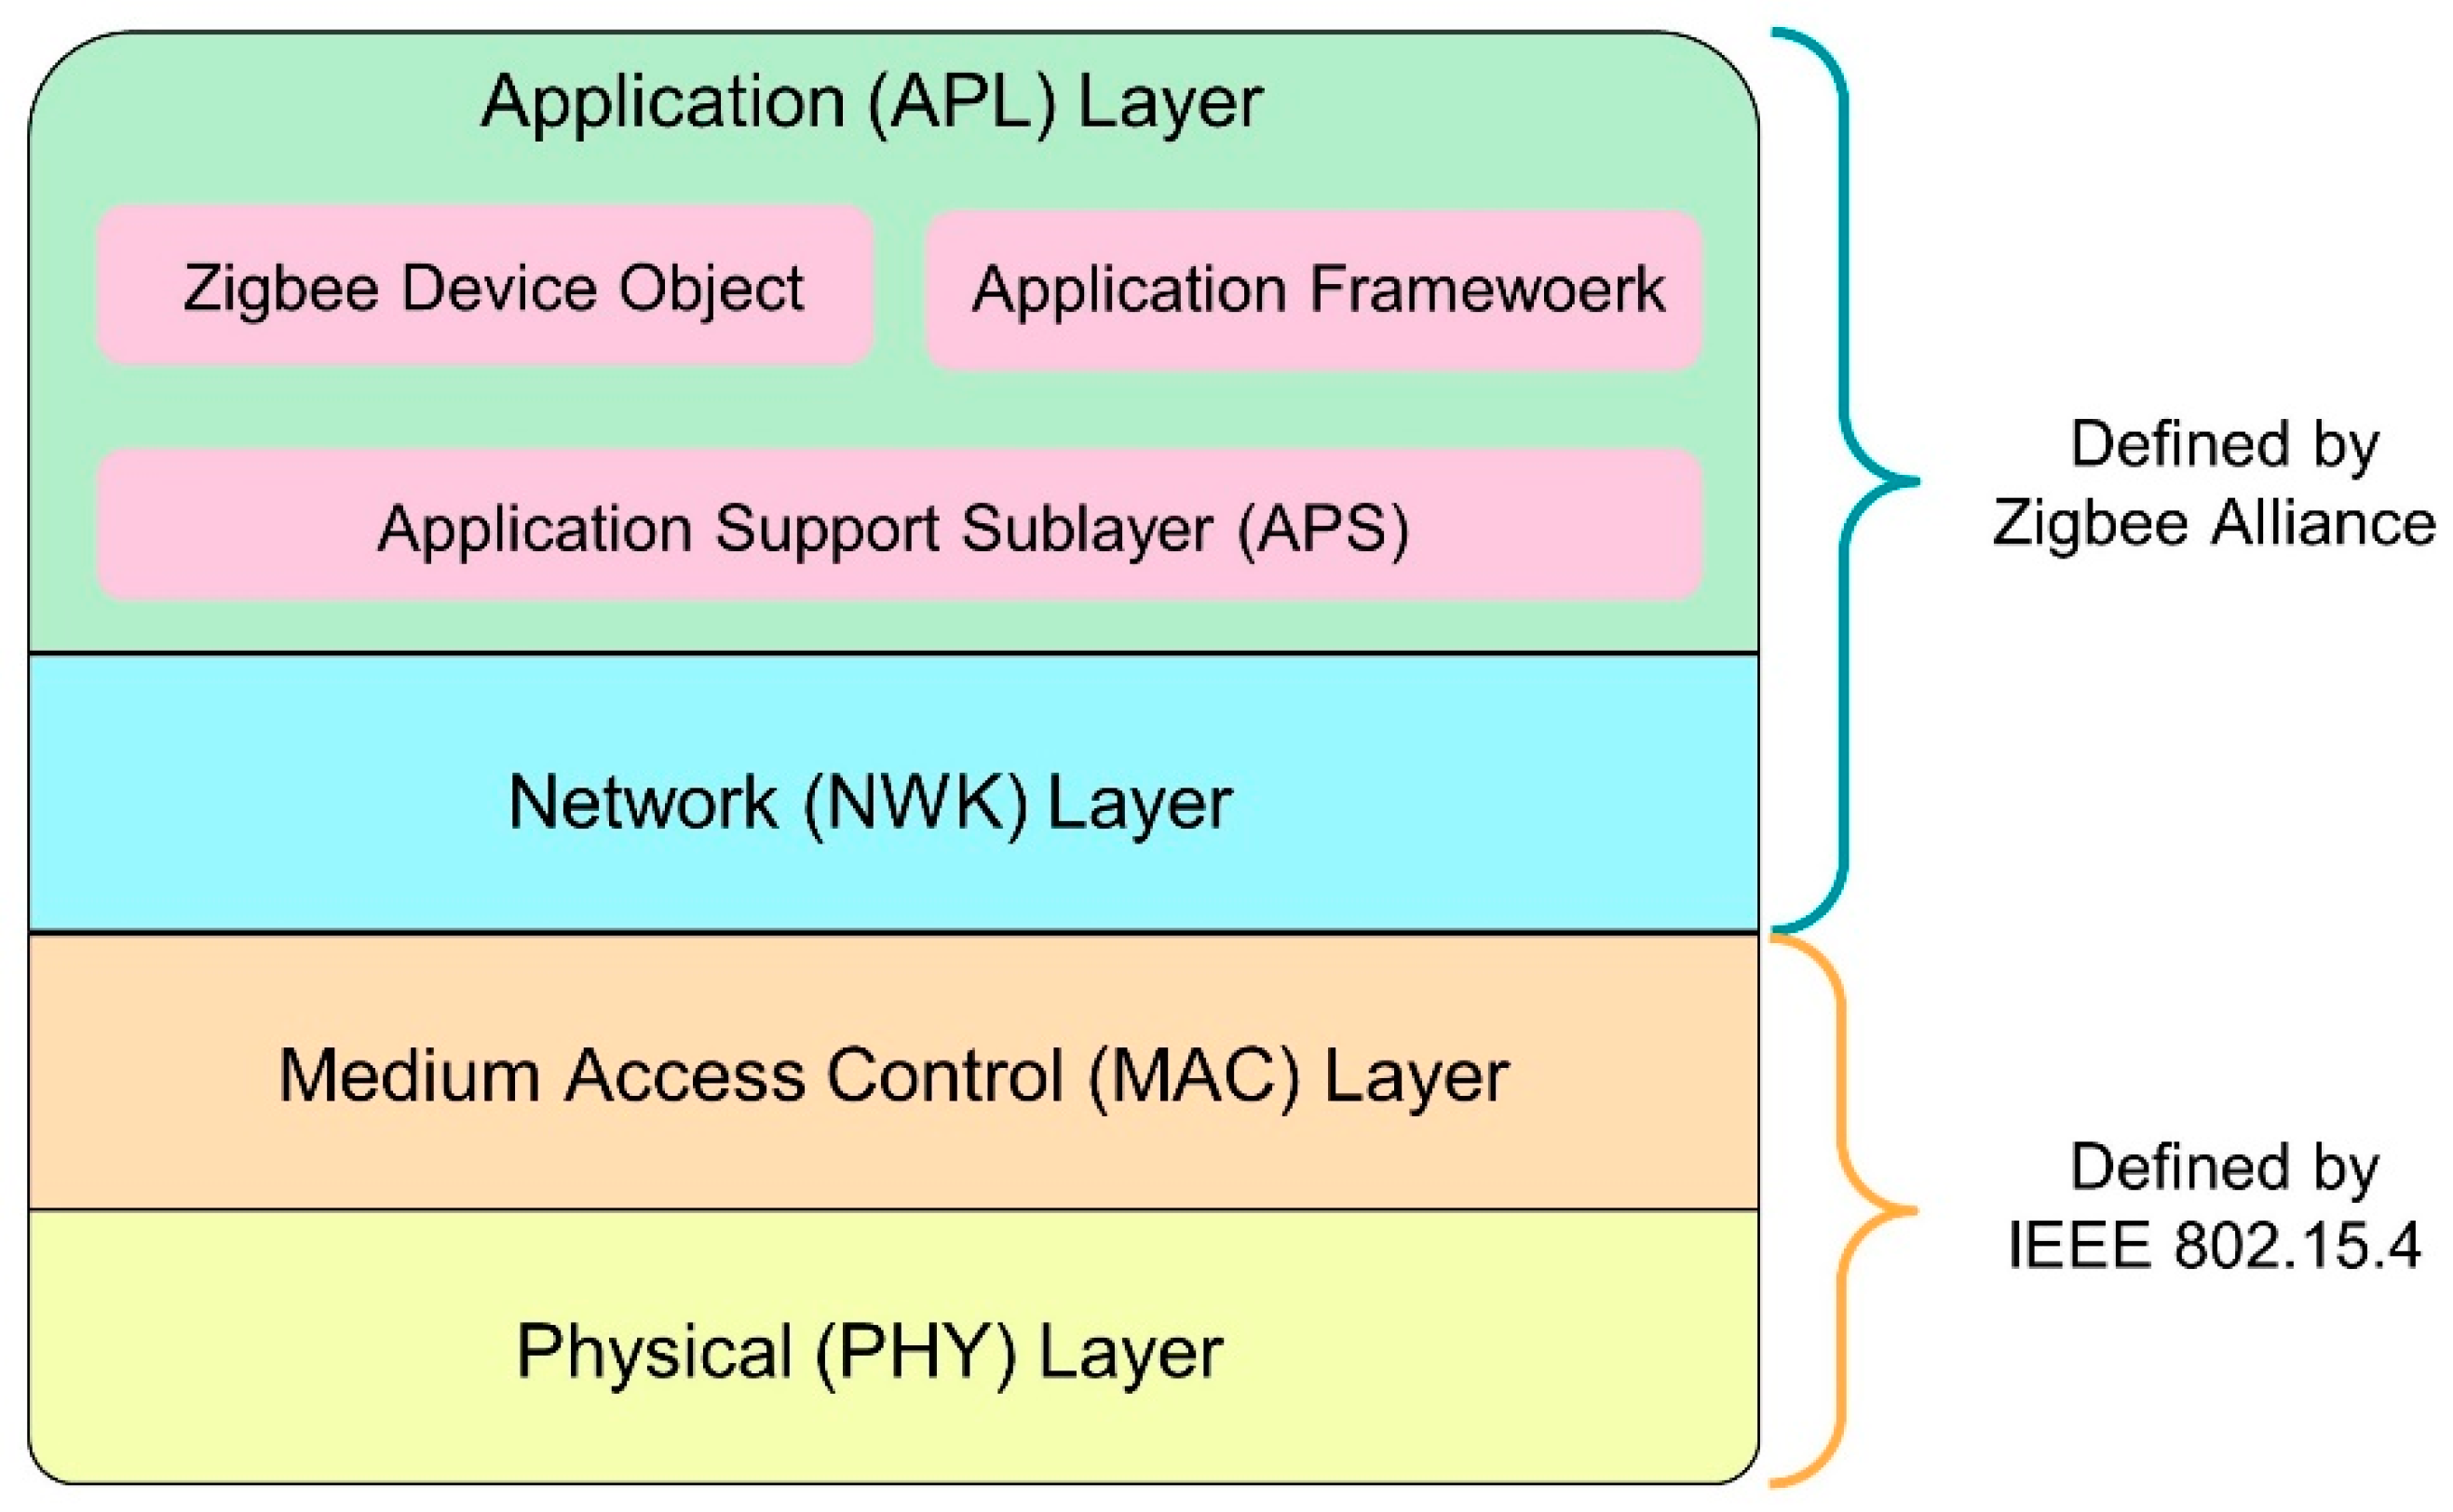
2.1. Background on Zigbee Communication
2.2. Related Works
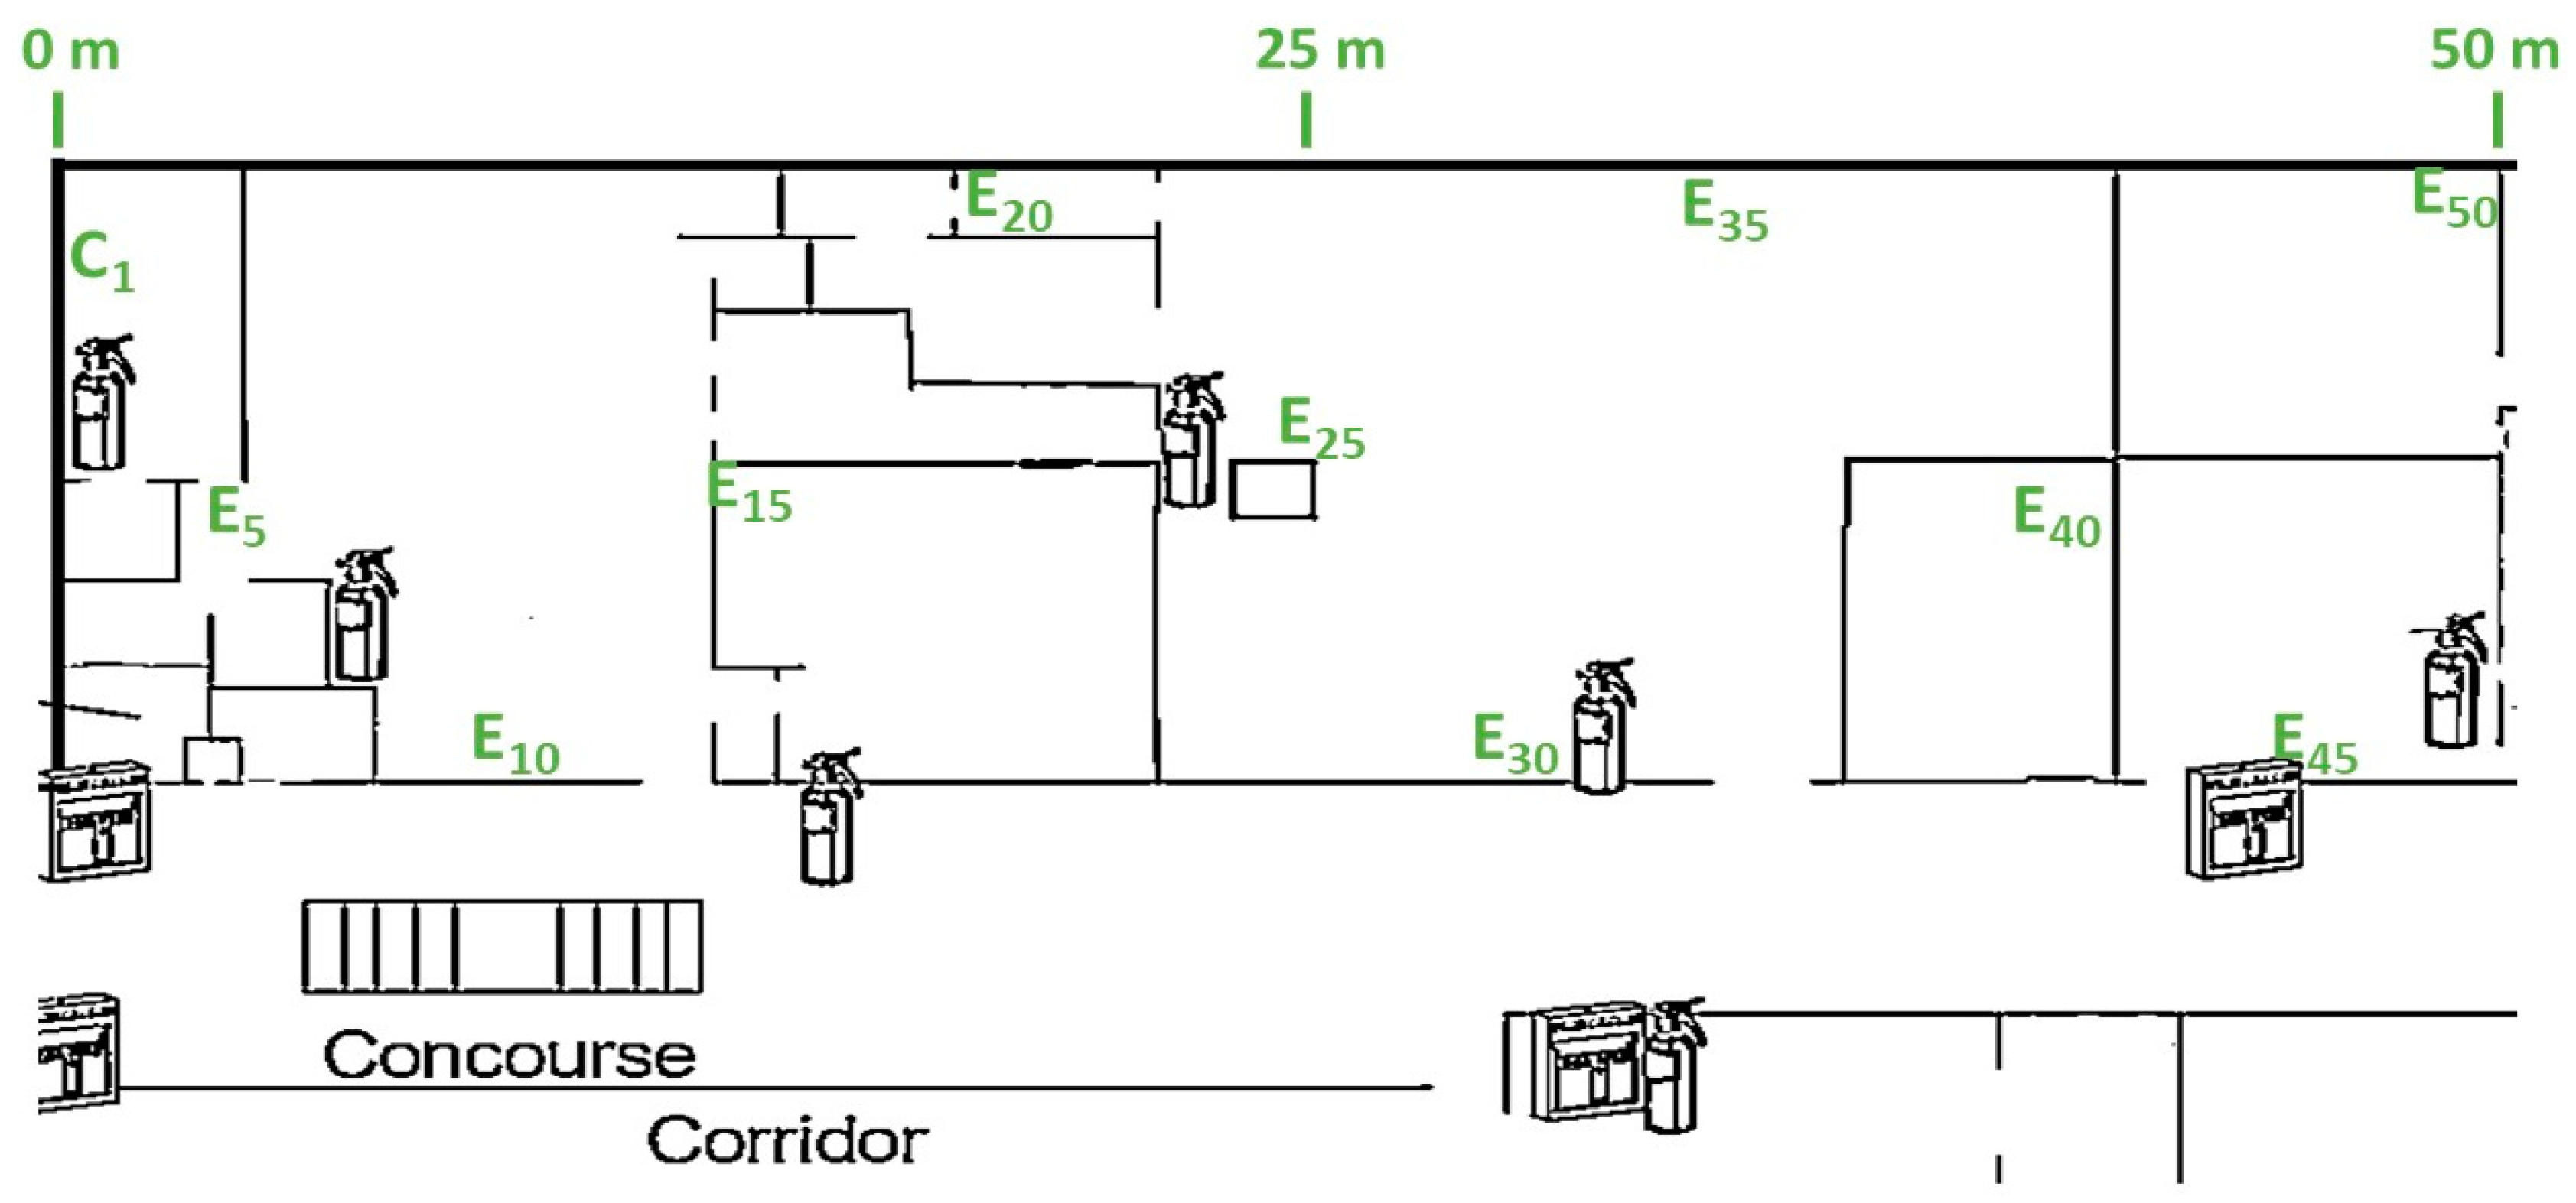
3. Experimental Setup
4. Performance Analysis of QoS Metrics
4.1. Evaluation of PDR for the Transmission Power Level (PTrans) and Energy Consumption
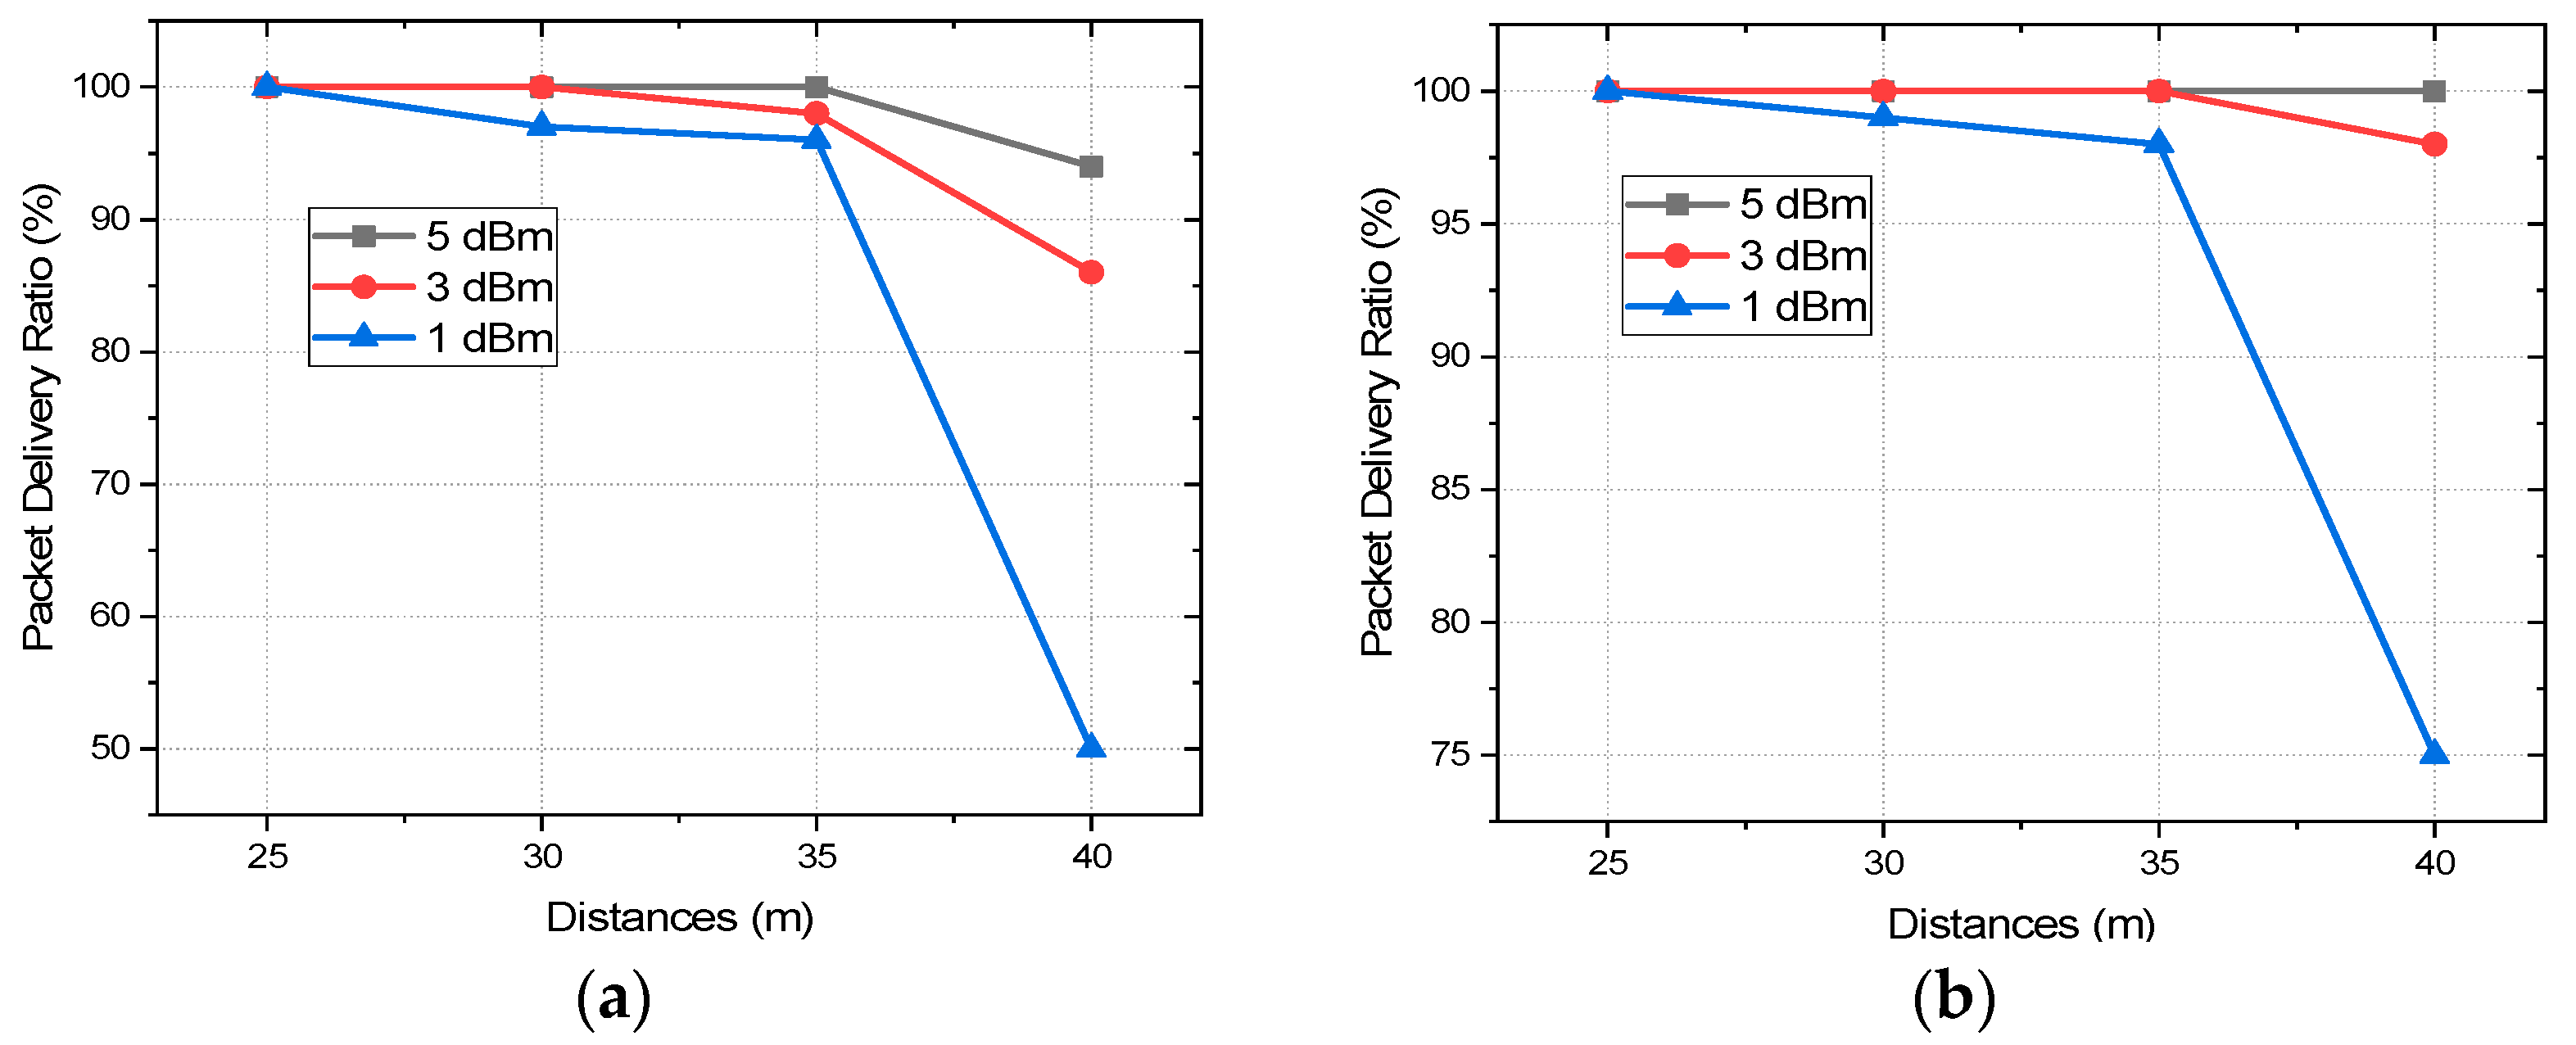
4.1.1. PDR Performance at Different PTrans
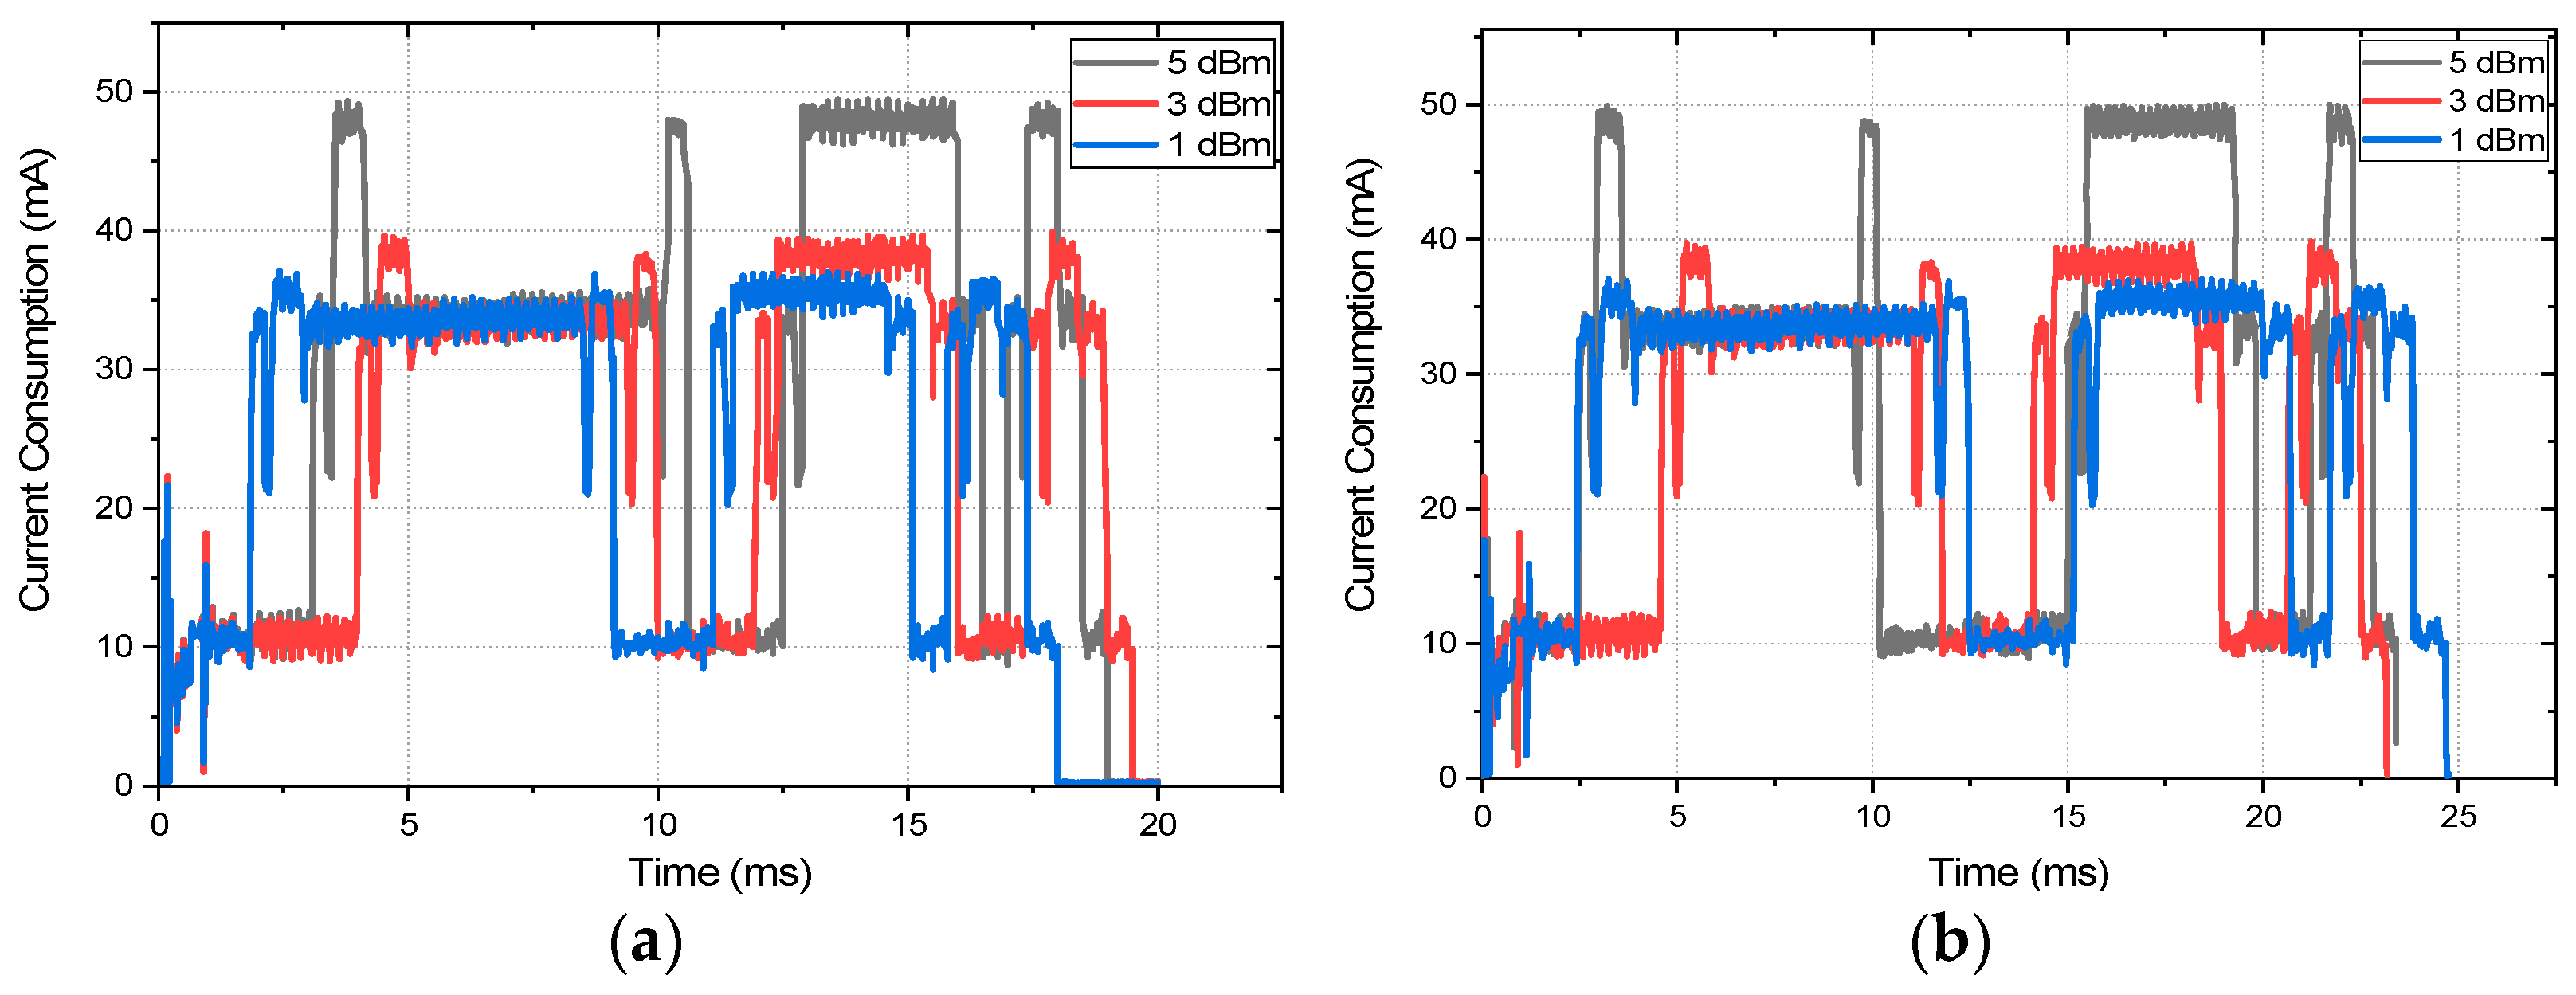
4.1.2. Energy Consumption and Network Life at Different PTrans Levels
4.2. RSSI Analysis for Indoor and Outdoor Multi-Hop Communication
4.3. Latency Analysis of Zigbee with Multi-Hop AES Encrypted Communication
4.4. Analysis of Throughput Considering Data Encryption and Deployment Scenario
5. Conclusions
Author Contributions
Funding
Institutional Review Board Statement
Informed Consent Statement
Data Availability Statement
Conflicts of Interest
References
- Haque, K.F.; Kabir, K.H.; Abdelgawad, A. Advancement of Routing Protocols and Applications of Underwater Wireless Sensor Network (UWSN)—A Survey. J. Sens. Actuator Netw. 2020, 9, 19. [Google Scholar] [CrossRef] [Green Version]
- Haque, K.F.; Abdelgawad, A.; Yanambaka, V.P.; Yelamarthi, K. Lora Architecture for V2x Communication: An Experimental Evaluation with Vehicles on the Move. Sensors 2020, 20, 6876. [Google Scholar] [CrossRef] [PubMed]
- Haque, K.F.; Zabin, R.; Yelamarthi, K.; Yanambaka, P.; Abdelgawad, A. An IoT Based Efficient Waste Collection System with Smart Bins. In Proceedings of the 2020 IEEE 6th World Forum on Internet of Things (WF-IoT), New Orleans, LA, USA, 2–16 June 2020; pp. 1–5. [Google Scholar]
- Ergen, S.C. ZigBee/IEEE 802.15.4 Summary; IEEE: Piscataway, NJ, USA, 2004. [Google Scholar]
- Fraile, L.P.; Tsampas, S.; Mylonas, G.; Amaxilatis, D. A Comparative Study of LoRa and IEEE 802.15.4-Based IoT Deployments Inside School Buildings. IEEE Access 2020, 8, 160957–160981. [Google Scholar] [CrossRef]
- The ZigBee Alliance. Available online: https://csa-iot.org/all-solutions/zigbee/ (accessed on 27 March 2021).
- Zigbee Communication in Depth. Available online: https://www.digi.com/resources/documentation/Digidocs/90001942-13/containers/cont_zigbee_communication_in_depth.htm (accessed on 27 March 2021).
- Li, P.; Yan, Y.; Yang, P.; Li, X.Y.; Lin, Q. Coexist Wifi for Zigbee Networks with Fine-Grained Frequency Approach. IEEE Access 2019, 7, 135363–135376. [Google Scholar] [CrossRef]
- Ghamari, M.; Janko, B.; Sherratt, R.; Harwin, W.; Piechockic, R.; Soltanpur, C. A Survey on Wireless Body Area Networks for EHealthcare Systems in Residential Environments. Sensors 2016, 16, 831. [Google Scholar] [CrossRef] [Green Version]
- Rasovic, I.; Mijanovic, Z. Proposal of an Industrial Communication System Based on ZigBee Technology. In Proceedings of the 2020 24th International Conference on Information Technology, IT 2020, Zabljak, Montenegro, 18–22 February 2020; Institute of Electrical and Electronics Engineers Inc.: New York, NY, USA, 2020. [Google Scholar]
- di Nardo, M.; Yu, H. Intelligent Ventilation Systems in Mining Engineering: Is ZigBee WSN Technology the Best Choice? Appl. Syst. Innov. 2021, 4, 42. [Google Scholar] [CrossRef]
- Chen, R.; He, Z.; Qiu, J.; He, L.; Cai, Z. Distributed Data Acquisition Unit Based on GPS and ZigBee for Electromagnetic Exploration. In Proceedings of the 2010 IEEE International Instrumentation and Measurement Technology Conference, I2MTC 2010—Proceedings, Austin, TX, USA, 3–6 May 2010; pp. 981–985. [Google Scholar] [CrossRef]
- Liu, K.; You, Q.; Wang, J.; Xu, X.; Shi, P.; Dai, K.; Huang, Z.; Wang, S.; Shi, Y.; Ding, Z. A New Cable-Less Seismograph with Functions of Real-Time Data Transmitting and High-Precision Differential Self-Positioning. Sensors 2020, 20, 4015. [Google Scholar] [CrossRef]
- del Arroyo, G.; Borghetti, J.A.; Temple, B.J.; Headley, W.C.; Michaels, A.; Gutierrez Del Arroyo, J.A.; Borghetti, B.J.; Temple, M.A. Considerations for Radio Frequency Fingerprinting across Multiple Frequency Channels. Sensors 2022, 22, 2111. [Google Scholar] [CrossRef]
- Katzis, K.; Berbakov, L.; Gardašević, G.; Šveljo, O. Breaking Barriers in Emerging Biomedical Applications. Entropy 2022, 24, 226. [Google Scholar] [CrossRef]
- Georghiades, C.N.; Parlos, A.G. Ultra Low Power IEEE 802.15.4/Zigbee Compliant Transceiver; Texas Instruments: Dallas, TX, USA, 2009. [Google Scholar]
- Hamdy, Y.R.; Alghannam, A.I. Evaluation of ZigBee Topology Effect on Throughput and End to End Delay Due to Different Transmission Bands for IoT Applications. J. Commun. Softw. Syst. 2020, 16, 254–259. [Google Scholar] [CrossRef]
- Marrero, D.; Suárez, A.; Macías, E.; Mena, V. Extending the Battery Life of the ZigBee Routers and Coordinator by Modifying Their Mode of Operation. Sensors 2019, 20, 30. [Google Scholar] [CrossRef] [PubMed] [Green Version]
- Fitriawan, H.; Susanto, M.; Arifin, A.S.; Mausa, D.; Trisanto, A. ZigBee Based Wireless Sensor Networks and Performance Analysis in Various Environments. In Proceedings of the QiR 2017—2017 15th International Conference on Quality in Research (QiR): International Symposium on Electrical and Computer Engineering, Bali, Indonesia, 24–27 July 2017; Institute of Electrical and Electronics Engineers Inc.: New York, NY, USA, 2017; Volume 2017, pp. 272–275. [Google Scholar]
- Akestoridis, D.G.; Harishankar, M.; Weber, M.; Tague, P. Zigator: Analyzing the Security of Zigbee-Enabled Smart Homes. In Proceedings of the WiSec 2020—Proceedings of the 13th ACM Conference on Security and Privacy in Wireless and Mobile Networks, Linz, Austria, 8–10 July 2020; Association for Computing Machinery: New York, NY, USA, 2020; Volume 12, pp. 77–88. [Google Scholar]
- Khashan, O.A.; Ahmad, R.; Khafajah, N.M. An Automated Lightweight Encryption Scheme for Secure and Energy-Efficient Communication in Wireless Sensor Networks. Ad Hoc Netw. 2021, 115, 102448. [Google Scholar] [CrossRef]
- Alobaidy, H.A.H.; Mandeep, J.S.; Nordin, R.; Abdullah, N.F. A Review on ZigBee Based WSNs: Concepts, Infrastructure, Applications, and Challenges. Int. J. Electr. Electron. Eng. Telecommun. 2020, 189–198. [Google Scholar] [CrossRef]
- Liu, Y.; Wei, Y.; Wang, H.; Tsang, K.F.; Zhu, H.; Chow, Y.T. An Optimal ZigBee Wireless Sensor Network Design for Energy Storage System. In Proceedings of the IEEE International Symposium on Industrial Electronics, Delft, The Netherlands, 17–19 June 2020; Institute of Electrical and Electronics Engineers Inc.: New York, NY, USA, 2020; Volume 2020, pp. 1313–1317. [Google Scholar]
- Ünal, İ. Integration of ZigBee Based GPS Receiver to CAN Network for Precision Farming Applications. Peer-to-Peer Netw. Appl. 2020, 13, 1394–1405. [Google Scholar] [CrossRef]
- Zeng, Z.; Zeng, F.; Han, X.; Elkhouchlaa, H.; Yu, Q.; Lü, E. Real-Time Monitoring of Environmental Parameters in a Commercial Gestating Sow House Using a ZigBee-Based Wireless Sensor Network. Appl. Sci. 2021, 11, 972. [Google Scholar] [CrossRef]
- Taiwo, O.; Ezugwu, A.E.; Rana, N.; Abdulhamid, S.M. Smart Home Automation System Using ZigBee, Bluetooth and Arduino Technologies. In Lecture Notes in Computer Science (Including Subseries Lecture Notes in Artificial Intelligence and Lecture Notes in Bioinformatics), Proceedings of the Computational Science and Its Applications—ICCSA 2020, Cagliari, Italy, 1–4 July 2020; Springer Science and Business Media Deutschland GmbH: Cham, Switzerland, 2020; Volume 12254 LNCS, pp. 587–597. [Google Scholar]
- Ciffee, R.; Sudha, G.; Saranya, S.; Thyagesh, G.K. Zigbee Based Automation Systems for Homes with the Deployment of Smart Sensors. Mater. Today Proc. 2021. [Google Scholar] [CrossRef]
- Liang, C.B.; Tabassum, M.; Kashem, S.B.A.; Zama, Z.; Suresh, P.; Saravanakumar, U. Smart Home Security System Based on Zigbee; Advances in Intelligent Systems and Computing; Springer Science and Business Media Deutschland GmbH: Singapore, 2021; Volume 1163, pp. 827–836. [Google Scholar]
- Han, Z.; Mingxia, C.; Shunyan, L. Research on Node Location Algorithm of Zigbee Based on Optimized Neural Network. In Proceedings of the 2020 International Conference on Computer Engineering and Application, ICCEA 2020, Guangzhou, China, 18–20 March 2020; Institute of Electrical and Electronics Engineers Inc.: New York, NY, USA, 2020; pp. 693–698. [Google Scholar]
- Qin, Z.; Sun, Y.; Hu, J.; Zhou, W.; Liu, J. Enhancing Efficient Link Performance in ZigBee Under Cross-Technology Interference. Mob. Netw. Appl. 2020, 25, 68–81. [Google Scholar] [CrossRef]
- Shao, C.; Park, H.; Roh, H.; Lee, W.; Kim, H. PolarScout: Wi-Fi Interference-Resilient ZigBee Communication via Shell-Shaping. IEEE/ACM Trans. Netw. 2020, 28, 1587–1600. [Google Scholar] [CrossRef]
- Desnanjaya, I.G.M.N.; Hartawan, I.N.B.; Parwita, W.G.S.; Iswara, I.B.A.I. Performance Analysis of Data Transmission on a Wireless Sensor Network Using the XBee Pro Series 2B RF Module. IJEIS Indones. J. Electron. Instrum. Syst. 2020, 10, 211. [Google Scholar] [CrossRef]
- Moulik, S.; Misra, S.; Chakraborty, C. Performance Evaluation and Delay-Power Trade-off Analysis of ZigBee Protocol. IEEE Trans. Mob. Comput. 2019, 18, 404–416. [Google Scholar] [CrossRef]
- Soijoyo, S.; Ashari, A. Analysis of Zigbee Data Transmission on Wireless Sensor Network Topology. Int. J. Adv. Comput. Sci. Appl. 2017, 8. [Google Scholar] [CrossRef] [Green Version]
- Khalifeh, A.; Salah, H.; Alouneh, S.; Al-Assaf, A.; Darabkh, K. Performance Evaluation of DigiMesh and ZigBee Wireless Mesh Networks. In Proceedings of the 2018 International Conference on Wireless Communications, Signal Processing and Networking, WiSPNET 2018, Chennai, India, 22–24 March 2018; Institute of Electrical and Electronics Engineers Inc.: New York, NY, USA, 2018. [Google Scholar]
- Mounika, P. Performance Analysis of Wireless Sensor Network Topologies for Zigbee Using Riverbed Modeler. In Proceedings of the 2nd International Conference on Inventive Systems and Control, ICISC 2018, Coimbatore, India, 19–20 January 2018; Institute of Electrical and Electronics Engineers Inc.: New York, NY, USA, 2018; pp. 1456–1459. [Google Scholar]
- Rao, P.M.; Chalapathi Rao, Y.; Kumar, M.A. Performance Analysis of ZigBee Wireless Sensor Networks Using Riverbed Simulation Modeler. In Proceedings of the 2nd International Conference on Inventive Systems and Control, ICISC 2018, Coimbatore, India, 19–20 January 2018; Institute of Electrical and Electronics Engineers Inc.: New York, NY, USA, 2018; pp. 1272–1277. [Google Scholar]
- Rahmadya, B.; Umehira, M.; Wang, X. Experimental Performance Evaluation of Drone-Based Wireless Sensor Network Using 2.4 GHz Zigbee Devices. In Proceedings of the Institute of Electronic, Information and Communication Engineers (IEICE) General Conference 2020, Tokyo, Japan, 3 March 2020. [Google Scholar]
- ben Ali, B.; Fraj, C.; Oueslati, O.; Dugas, É. Environmental Impact and Performance Assessment of a New Zigbee-based Shotgun Training System. Eng. Rep. 2020, 2, e12309. [Google Scholar] [CrossRef]
- Essa, E.I.; Asker, M.A.; Sedeeq, F.T. Investigation and Performance Optimization of Mesh Networking in Zigbee. Period. Eng. Nat. Sci. PEN 2020, 8, 790–801. [Google Scholar]
- Varghese, S.G.; Kurian, C.P.; George, V.I.; John, A.; Nayak, V.; Upadhyay, A. Comparative Study of ZigBee Topologies for IoT-Based Lighting Automation. IET Wirel. Sens. Syst. 2019, 9, 201–207. [Google Scholar] [CrossRef]
- Moridi, M.A.; Kawamura, Y.; Sharifzadeh, M.; Chanda, E.K.; Wagner, M.; Okawa, H. Performance Analysis of ZigBee Network Topologies for Underground Space Monitoring and Communication Systems. Tunn. Undergr. Space Technol. 2018, 71, 201–209. [Google Scholar] [CrossRef]
- XBee S2C Module Pinout, Features & Datasheet. Available online: https://components101.com/wireless/xbee-s2c-module-pinout-datasheet (accessed on 21 April 2022).
- Shue, S.; Johnson, L. Utilization of XBee ZigBee Modules and MATLAB for RSSI Localization Applications. In Proceedings of the SoutheastCon 2017, Concord, NC, USA, 30 March–2 April 2017; Available online: ieeexplore.ieee.org (accessed on 18 April 2022).
- Kuzminykh, I.; Snihurov, A.; Carlsson, A. Testing of Communication Range in ZigBee Technology. In Proceedings of the 2017 14th International Conference the Experience of Designing and Application of CAD Systems in Microelectronics (CADSM), Lviv, Ukraine, 21–25 February 2017; pp. 21–25. Available online: ieeexplore.ieee.org (accessed on 18 April 2022). [CrossRef] [Green Version]
- Veerasingam, S.; Karodi, S.; Shukla, S.; Yeleti, M.C. Design of Wireless Sensor Network Node on ZigBee for Temperature Monitoring. In Proceedings of the 2009 International Conference on Advances in Computing, Control, and Telecommunication Technologies, Bangalore, India, 28–29 December 2009; Available online: ieeexplore.ieee.org (accessed on 18 April 2022).
- RF Modules|Wireless Connectivity Solutions for Remote, Low-Power, Secure IoT Product Designs|Digi International. Available online: https://www.digi.com/products/embedded-systems/digi-xbee/rf-modules (accessed on 29 March 2022).
- Nefzi, B.; Song, Y.Q. Performance analysis and improvement of ZigBee routing protocol. IFAC Proc. Vol. 2007, 40, 199–206. [Google Scholar] [CrossRef] [Green Version]
- Sun, J.; Wang, Z.; Wang, H.; Zhang, X. Research on Routing Protocols Based on ZigBee Network. In Proceedings of the 3rd International Conference on Intelligent Information Hiding and Multimedia Signal Processing, IIHMSP, Kaohsiung, Taiwan, 26–28 November 2007; Volume 1, pp. 639–642. [Google Scholar] [CrossRef]
- Kim, S.H.; Chong, P.K.; Kim, T. Performance Study of Routing Protocols in ZigBee Wireless Mesh Networks. Wirel. Pers. Commun. 2017, 95, 1829–1853. [Google Scholar] [CrossRef]
- Foysal Haque, K.; Abdelgawad, A.; Haque, K.F.; Abdelgawad, A. Prospects of Internet of Things (IoT) and Machine Learning to Fight Against COVID-19. Smart Sens. Meas. Instrum. 2021, 39, 93–109. [Google Scholar] [CrossRef]
- Tseng, H.W.; Pang, A.C.; Chen, J.; Kuo, C.F. An Adaptive Contention Control Strategy for IEEE 802.15.4-Based Wireless Sensor Networks. IEEE Trans. Veh. Technol. 2009, 58, 5164–5173. [Google Scholar] [CrossRef]
- Wijetunge, S. Performance Analysis of IEEE 802.15.4 Based Wireless Sensor Networks. Int. J. Eng. Res. Technol. 2014, 2, IJERTCONV2IS01044. [Google Scholar]
- Farahani, S. ZigBee/IEEE 802.15.4 Networking Examples. ZigBee Wirel. Netw. Transceivers 2008, 25–32. [Google Scholar] [CrossRef]
- Piyare, R.; Lee, S.R. Performance Analysis of XBee ZB Module Based Wireless Sensor Networks. J. Sci. Eng. Res. 2013, 4, 1615–1621. [Google Scholar]
- Pinto, A.; Fouchal, H.; Dash, L.; Kumar Pattanayak, B.; Kumar Mishra, S.; Sahoo, K.S.; Zaman Jhanjhi, N.; Baz, M.; Masud, M. A Data Aggregation Approach Exploiting Spatial and Temporal Correlation among Sensor Data in Wireless Sensor Networks. Electronics 2022, 11, 989. [Google Scholar] [CrossRef]
- Jasim, A.A.; Idris, M.Y.I.; bin Azzuhri, S.R.; Issa, N.R.; Rahman, M.T.; Khyasudeen, M.F.b. Energy-Efficient Wireless Sensor Network with an Unequal Clustering Protocol Based on a Balanced Energy Method (EEUCB). Sensors 2021, 21, 784. [Google Scholar] [CrossRef]
- Zhao, B.; Liu, J.; Wei, Z.; You, I. A Deep Reinforcement Learning Based Approach for Energy-Efficient Channel Allocation in Satellite Internet of Things. IEEE Access 2020, 8, 62197–62206. [Google Scholar] [CrossRef]
- Azoulay, R.; Danilchenko, K.; Haddad, Y.; Reches, S. Transmission Power Control Using Deep Neural Networks in TDMA-Based Ad-Hoc Network Clusters. In Proceedings of the 2021 International Wireless Communications and Mobile Computing (IWCMC), Harbin, China, 28 June–2 July 2021; pp. 406–411. [Google Scholar] [CrossRef]
- Papachary, B.; Venkatanaga, A.M.; Kalpana, G. A TDMA Based Energy Efficient Unequal Clustering Protocol for Wireless Sensor Network Using PSO. Intell. Syst. Ref. Libr. 2020, 172, 119–124. [Google Scholar] [CrossRef]
- Abbas, G.; Abbas, Z.H.; Haider, S.; Baker, T.; Boudjit, S.; Muhammad, F. PDMAC: A Priority-Based Enhanced TDMA Protocol for Warning Message Dissemination in VANETs. Sensors 2019, 20, 45. [Google Scholar] [CrossRef] [Green Version]


| Networking Layer | Parameters | Zigbee Characterization |
|---|---|---|
| PHY Layer | Frequency Band | 2.4 GHz, 915 MHz, 868 MHz, |
| Throughput | 250 Kbps for 2.4 GHz | |
| 40 Kbps for 915 MHz | ||
| 20 Kbps for 868 MHz | ||
| Modulation | BPSK, O-QPSK | |
| Tx Power [16] | −3 to 10 dBm | |
| Minimum receiver Sensitivity | −85 dBm | |
| Physical Channels | 16 channels: 2.4 GHz | |
| 10 Channels: 915 MHz | ||
| 1 Channel: 868 MHz | ||
| Channel Bandwidth | 2 MHz | |
| MAC Layer | Multiple Access Scheme | CSMA-CA, Slotted CSMA-CA |
| CRC length | 2 bytes | |
| Identifiers | 16-bit short address | |
| 64-bit long address | ||
| NWK Layer | Network Topology | Star, Tree, Mesh, Point-to-Point |
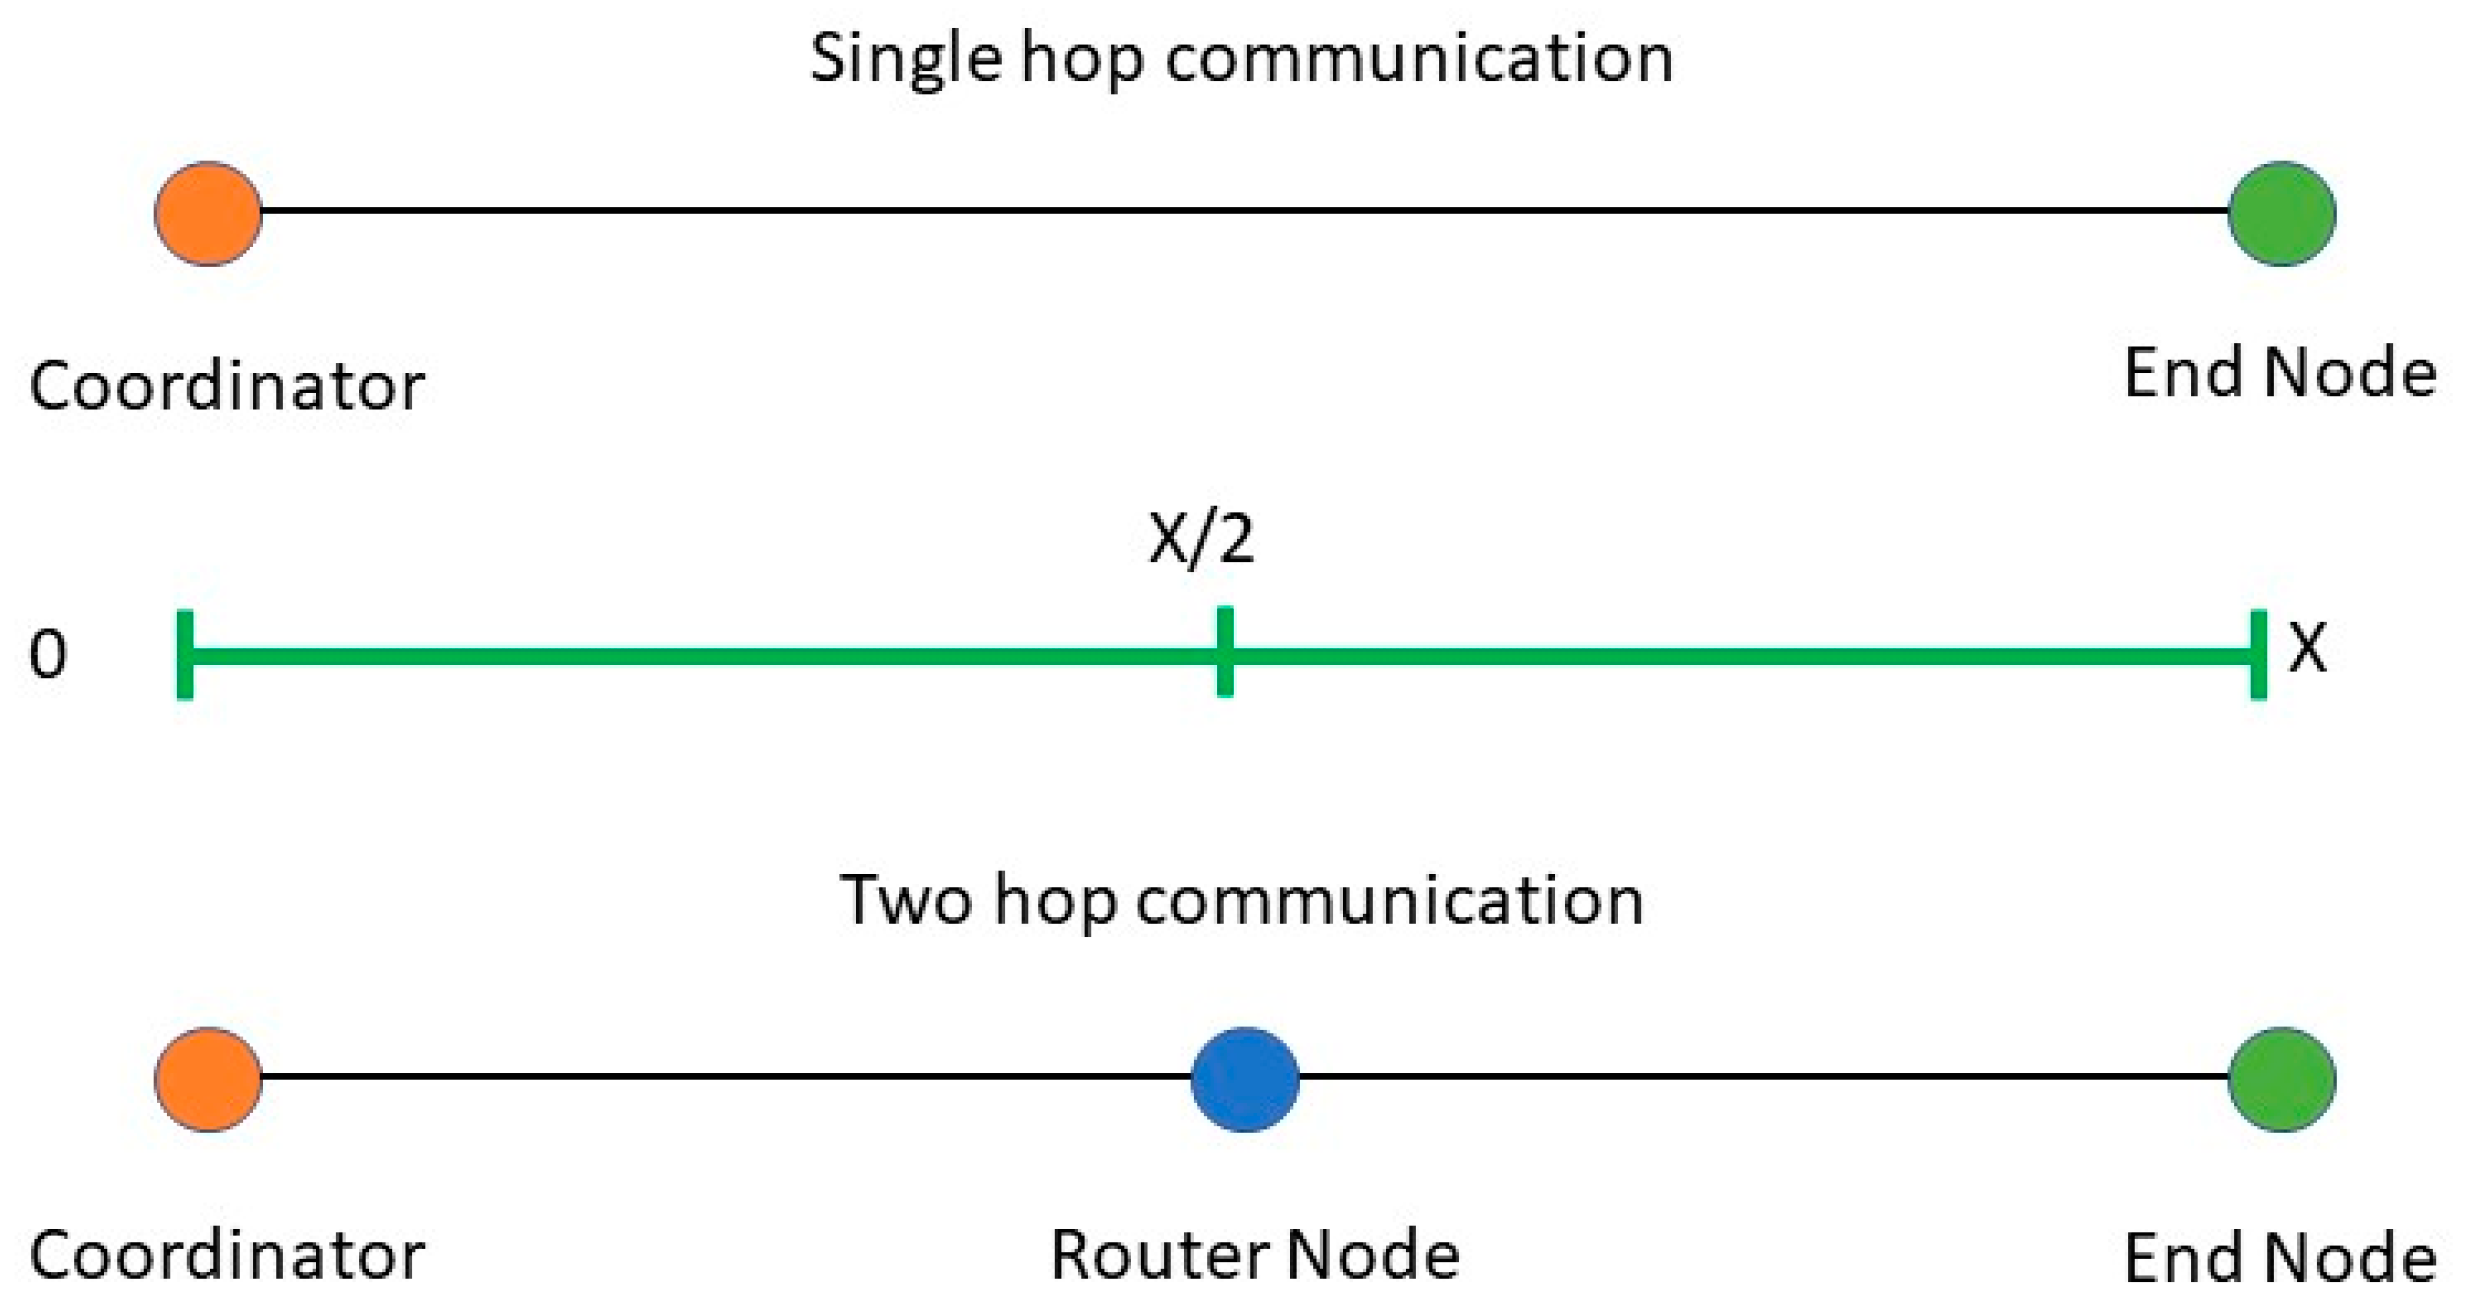
| Hopping | Single and Multi-hop | |
| Device Type/Mode | Coordinator, Router, End Device | |
| Networking Technology | PAN |
| Research | Deployment Scenario | QoS Parameters | Limitation |
|---|---|---|---|
| Evaluation of Zigbee topology [17] | Simulation | Throughput, end-to-end delay | Only focused on throughput and delay; real-world networking performance might vary from simulation; encrypted communication is not considered. |
| Data transmission performance analysis with XBee Pro 2B [32] | Indoor and outdoor | Transmission range | Other QoS parameters, such as throughput, link quality, latency, and power consumption were not considered; encrypted communication was not considered. |
| Zigbee performance analysis in Various Environments [19] | Indoor LOS and NLOS | Delay, throughput, packet loss | Comparative performance of encrypted communication and variations of deployment scenarios were not addressed. |
| Comparative study of Zigbee topologies [41] | Simulation | Latency, throughput, packet loss, and energy consumption | Did not consider encrypted communication. |
| Performance Evaluation of Zigbee [33] | Simulation | Delay, power consumption | Parameters, such as throughput, link quality, and data encryption were not considered. |
| Analysis of Zigbee data transmission [34] | - | Latency, packet loss, throughput | RSSI, energy consumption, data encryption, and NLoS scenario were not considered. |
| Performance evaluation of Digi Mesh and Zigbee mesh [35] | - | Throughput, round trip time, RSSI, routing recovery time | Energy consumption, data encryption, and different deployment scenarios were not considered. |
| Performance of Zigbee network topologies [42] | Simulation | Throughput, PDR, latency, energy consumption, security | Based on simulation, which might differ from the deployed network performance. |
| Performance analysis of Zigbee large scale network [36] | Simulation | Latency, throughput | Did not consider data encryption and other QoS parameters. |
| Performance analysis of Zigbee WSN [37] | Simulation | Throughput, delay, data traffic | Did not consider other performance metrics, such as RSSI and power consumption. |
| Zigbee Module | Transceiver | Programmable Memory | Programmable CPU Clock | No. of Channels | Receiver Sensitivity | Tx Power | Tx and Rx Current |
|---|---|---|---|---|---|---|---|
| XBee S2C | Silicon Labs EM357 SoC | 32 KB Flash/2 KB RAM | Up to 50.33 MHz | 16 | −100 dBm/−102 dBm (boost mode) | 3.1 mW (+5 dBm)/6.3 mW (+8 dBm) boost mode | Tx: 33 mA @ 3.3 VDC/45 mA boost mode Rx: 28 mA @ 3.3 VDC/31 mA boost mode |
| XBee-Pro S2C | Silicon Labs EM357 SoC | 32 KB Flash/2 KB RAM | Up to 50.33 MHz | 15 | −101 dBm | 63 mW (+18 dBm) | Tx: 120 mA @ 3.3 VDC Rx: 31 mA @ 3.3 VDC |
| XBee S2D | Silicon Labs EM3587 Soc | N/A | N/A | 15 | −100 dBm/−102 dBm (boost mode) | 3.1 mW (+5 dBm)/6.3 mW (+8 dBm) boost mode | Tx: 33 mA @ 3.3 VDC/45 mA boost mode Rx: 28 mA @ 3.3 VDC/31 mA boost mode |
| XBee 3 | Silicon Labs EFR32MG SoC | 1 MB/128 KB RAM | - | 16 | −103 dBm normal mode | +8 dBm | Tx: 40 mA @ 8 dBm Rx: 17 mA |
| XBee 3 Pro | Silicon Labs EFR32MG SoC | 1 MB/128 KB RAM | - | 16 | −103 dBm normal mode | +19 dBm | Tx: 135 mA @ 19 dBm Rx: 17 mA |
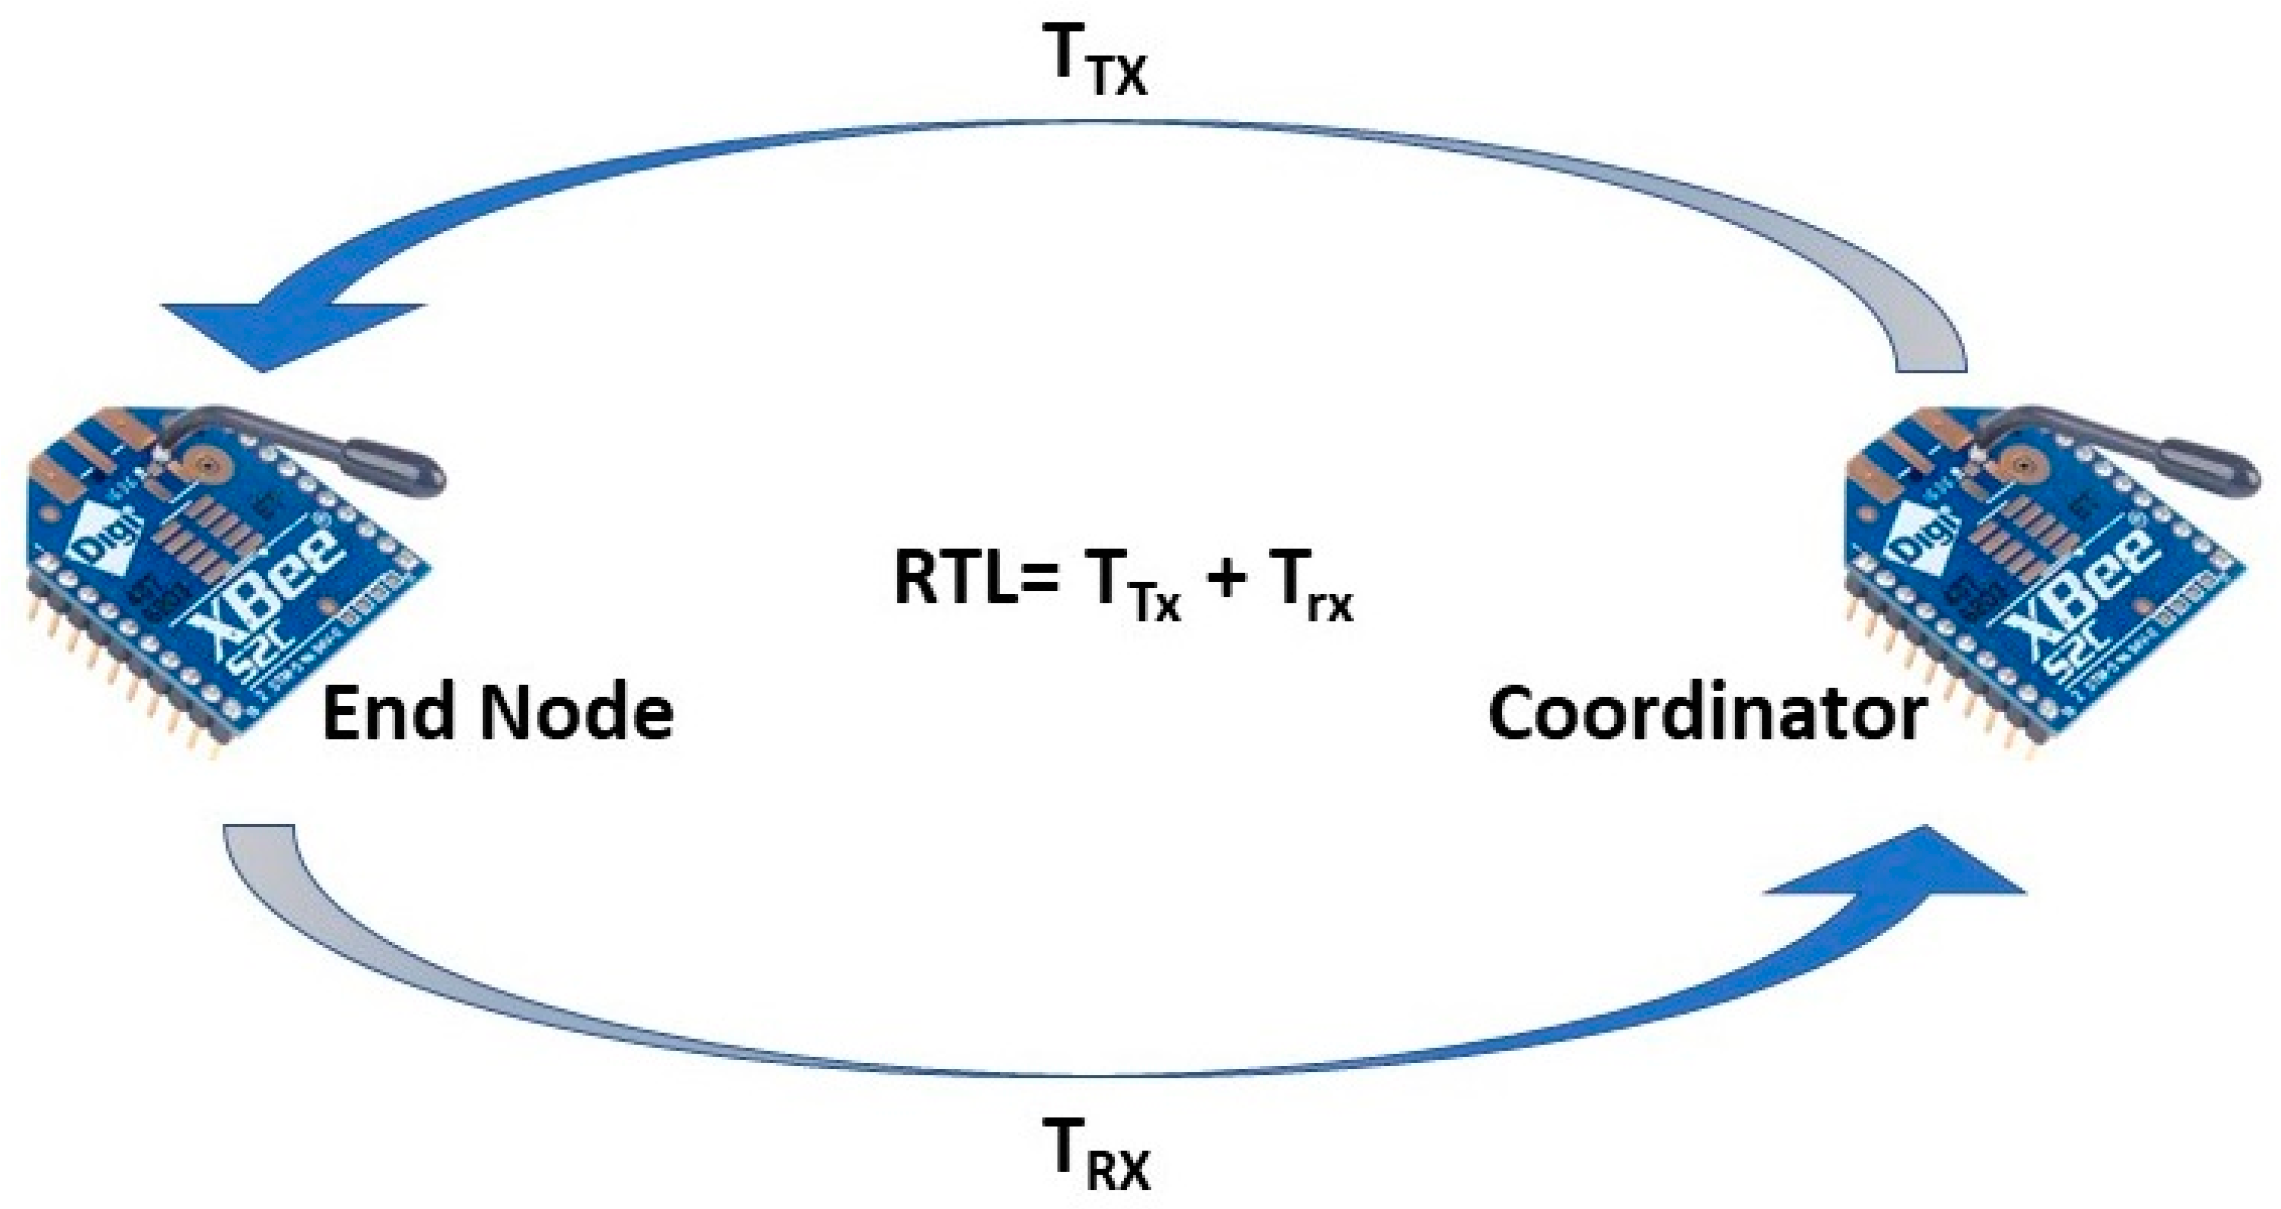
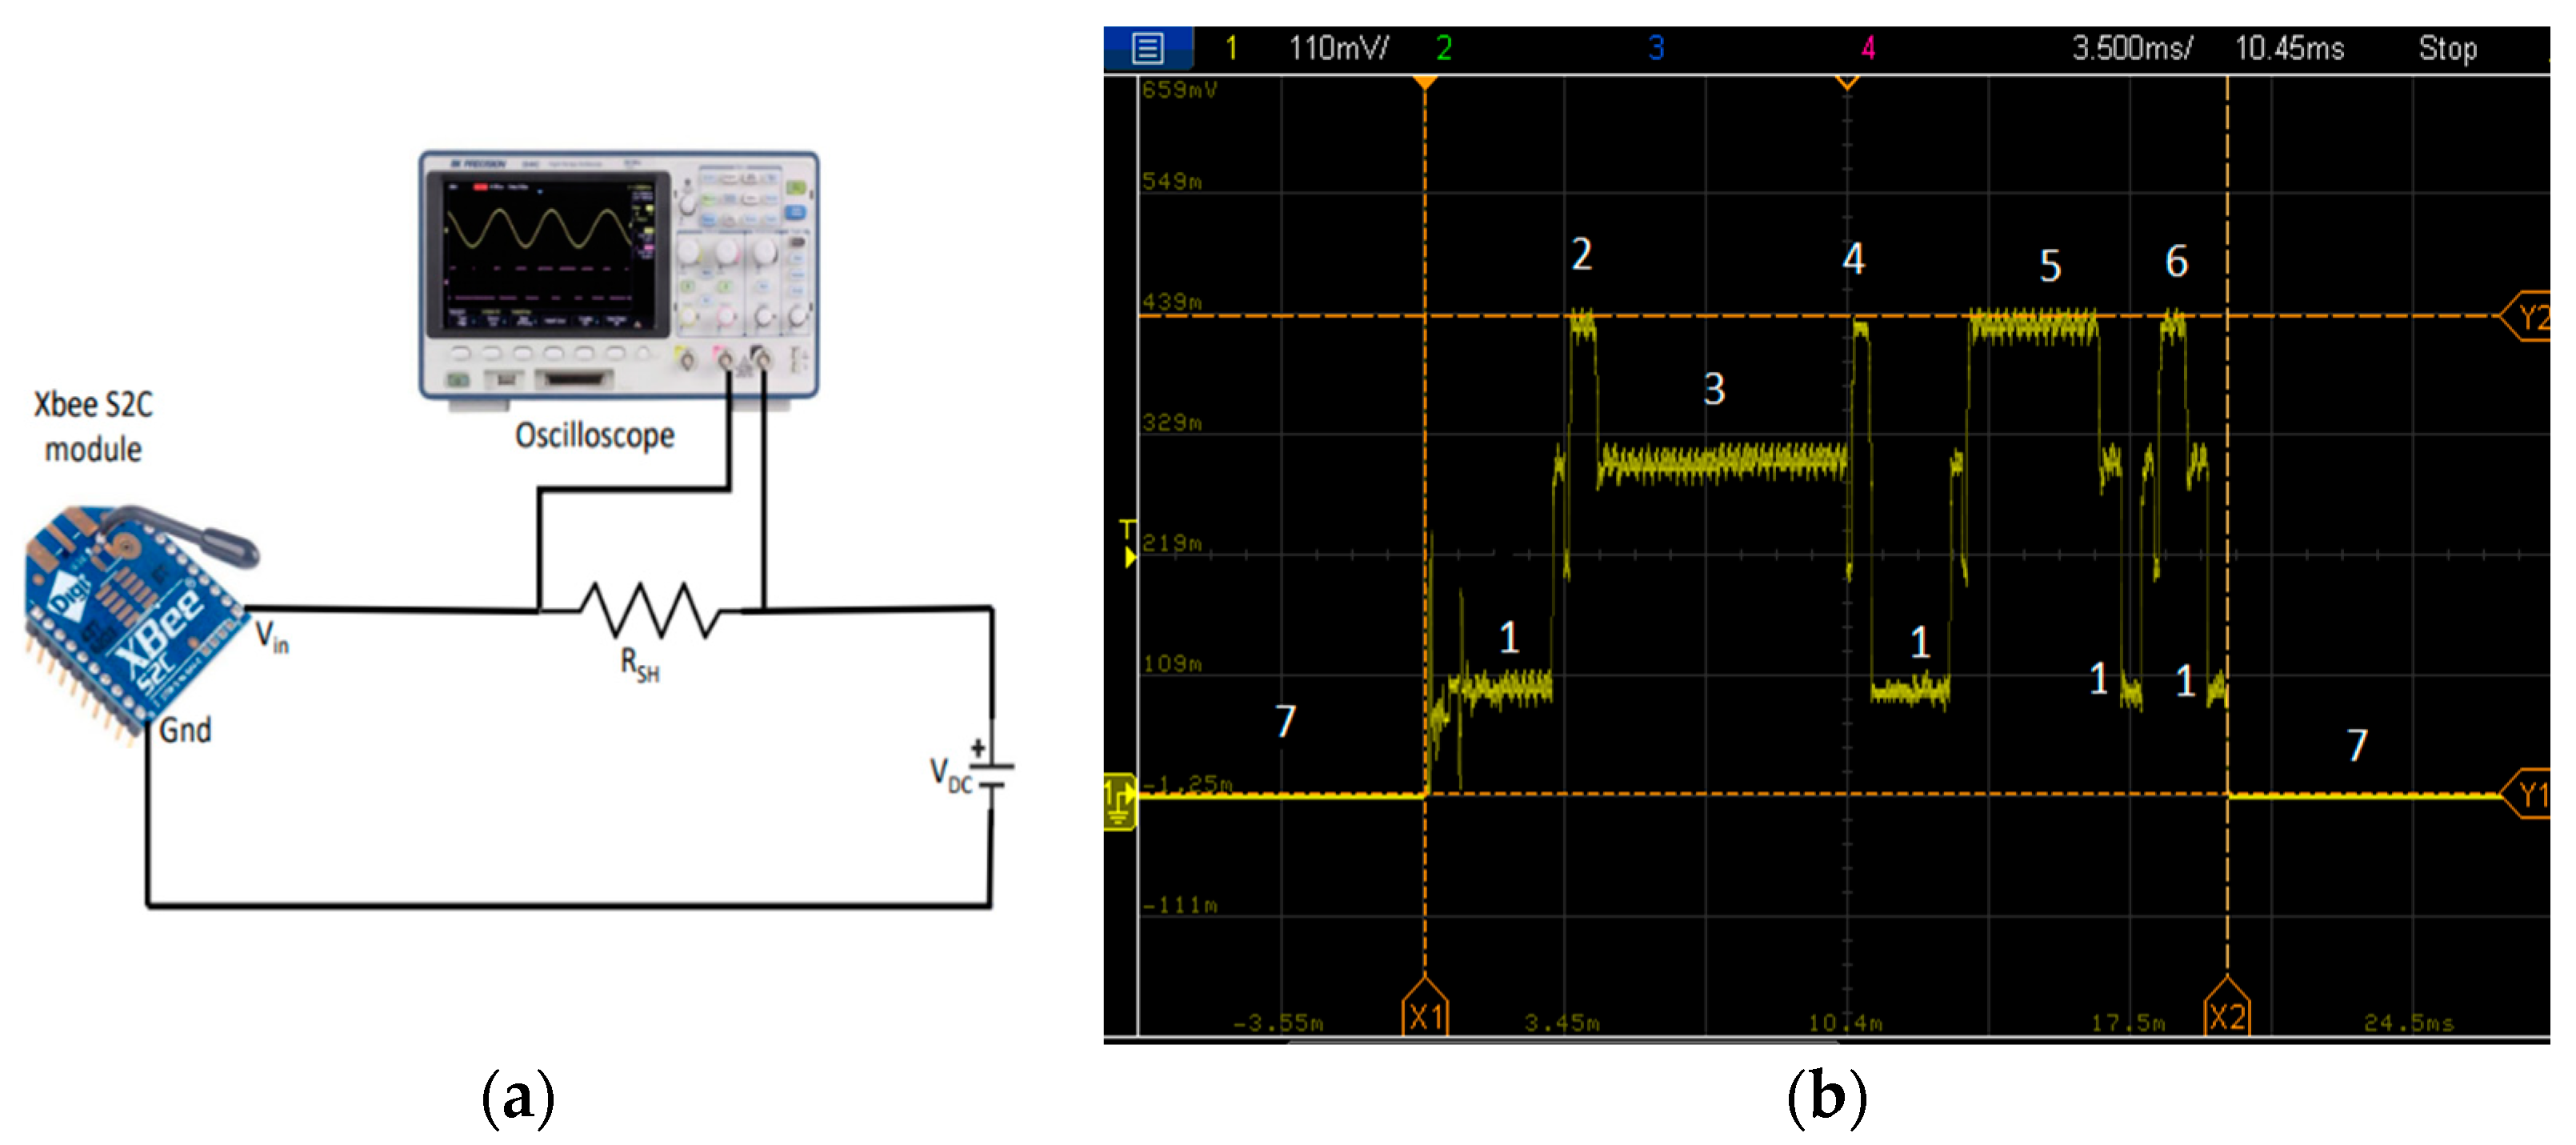
| Annotation of Figure 6b | Stages of Data Transmission/Reception | Brief Explanation |
|---|---|---|
| 1 | Idle time (Tidle) | Node is active, but the radio is not active. The nodes tend to stay in idle mode to save energy. |
| 2 | Data reception time (Trx) | Reception of the beacon message broadcasted from a coordinator. |
| 3 | Radio standby time (Tsb) | Radio stays in standby mode before sending a data request to a coordinator or any sender as it waits for backoff time and performs CCA. |
| 4 | Data transmit time (Ttx) | End node sends the data request to the coordinator/sender |
| 5 | Data reception time (Trx) | End node receives the ACK of the data request and goes to receiving mode and waits until data transmission is over |
| 6 | Data transmit time (Trx) | ACK is sent upon successful reception of the packet. |
| 7 | Sleep Time (Tsleep) | End node remains in the sleep mode before and after the reception of the data packet as defined by the experiment configuration |
| Annotation of Figure 6b | Stages of Data Transmission/Reception | PTrans | ||||||||
|---|---|---|---|---|---|---|---|---|---|---|
| 1 dBm | 3 dBm | 5 dBm | ||||||||
| Duration (ms) | Avg Current Consumption (mA) | Energy Consumption (μJ) | Duration (ms) | Avg Current Consumption (mA) | Energy Consumption (μJ) | Duration (ms) | Average Current Consumption (mA) | Energy Consumption (μJ) | ||
| 1 | Idle time (Tidle) | 7.3 | 10.5 | 7.29 | 10.0 | 10.75 | 10.4 | 10.75 | 10.75 | 11.18 |
| 2 | Data reception time (Trx1) | 1.0 | 36.0 | 11.66 | 1.05 | 38.8 | 14.22 | 1.0 | 49.0 | 21.60 |
| 3 | Radio standby time (Tsb) | 5.4 | 34.0 | 56.18 | 5.2 | 34.0 | 54.1 | 6.25 | 34.0 | 65.02 |
| 4 | Data transmit time (Ttx1) | 0.8 | 35.3 | 8.97 | 0.8 | 38.4 | 10.61 | 0.8 | 49.8 | 17.85 |
| 5 | Data reception time (Trx2) | 6.0 | 35.0 | 66.15 | 5.0 | 37.5 | 63.28 | 4.8 | 47.5 | 97.47 |
| 6 | Data transmit time (Ttx2) | 2.5 | 34.5 | 26.78 | 2.3 | 36.0 | 26.82 | 2.3 | 41.0 | 34.79 |
| Total energy consumption (μJ) | 177.03 | 179.43 | 247.91 | |||||||
| Annotation of Figure 6b | Stages of data Transmission/Reception | PTrans | ||||||||
|---|---|---|---|---|---|---|---|---|---|---|
| 1 dBm | 3 dBm | 5 dBm | ||||||||
| Duration (ms) | Average Current Consumption (mA) | Energy Consumption (μJ) | Duration (ms) | Average Current Consumption (mA) | Energy Consumption (μJ) | Duration (ms) | Average Current Consumption (mA) | Energy Consumption (μJ) | ||
| 1 | Idle time (Tidle) | 6.1 | 10.5 | 6.05 | 8.4 | 10.5 | 8.33 | 6.8 | 10.5 | 6.74 |
| 2 | Data reception time (Trx1) | 0.9 | 36.0 | 10.49 | 0.9 | 38.2 | 11.81 | 0.9 | 47.9 | 18.58 |
| 3 | Radio standby time (Tsb) | 6.0 | 33.8 | 61.69 | 5.5 | 33.7 | 56.21 | 5.5 | 33.9 | 56.88 |
| 4 | Data transmit time (Ttx1) | 0.7 | 35.1 | 7.76 | 0.7 | 36.0 | 8.16 | 0.7 | 47.5 | 14.21 |
| 5 | Data reception time (Trx2) | 4.0 | 35.0 | 44.10 | 4.0 | 36.0 | 46.65 | 4.8 | 46.0 | 91.41 |
| 6 | Data transmit time (Ttx2) | 2.1 | 33.9 | 22.23 | 2.1 | 36.0 | 25.07 | 2.1 | 40.0 | 30.24 |
| Total energy consumption (μJ) | 152.32 | 156.23 | 218.06 | |||||||
Publisher’s Note: MDPI stays neutral with regard to jurisdictional claims in published maps and institutional affiliations. |
© 2022 by the authors. Licensee MDPI, Basel, Switzerland. This article is an open access article distributed under the terms and conditions of the Creative Commons Attribution (CC BY) license (https://creativecommons.org/licenses/by/4.0/).
Share and Cite
Haque, K.F.; Abdelgawad, A.; Yelamarthi, K. Comprehensive Performance Analysis of Zigbee Communication: An Experimental Approach with XBee S2C Module. Sensors 2022, 22, 3245. https://doi.org/10.3390/s22093245
Haque KF, Abdelgawad A, Yelamarthi K. Comprehensive Performance Analysis of Zigbee Communication: An Experimental Approach with XBee S2C Module. Sensors. 2022; 22(9):3245. https://doi.org/10.3390/s22093245
Chicago/Turabian StyleHaque, Khandaker Foysal, Ahmed Abdelgawad, and Kumar Yelamarthi. 2022. "Comprehensive Performance Analysis of Zigbee Communication: An Experimental Approach with XBee S2C Module" Sensors 22, no. 9: 3245. https://doi.org/10.3390/s22093245
APA StyleHaque, K. F., Abdelgawad, A., & Yelamarthi, K. (2022). Comprehensive Performance Analysis of Zigbee Communication: An Experimental Approach with XBee S2C Module. Sensors, 22(9), 3245. https://doi.org/10.3390/s22093245