
Colorimetric Paper-Based Sensors against Cancer Biomarkers


 ,
,  and
and 
Abstract
1. Introduction
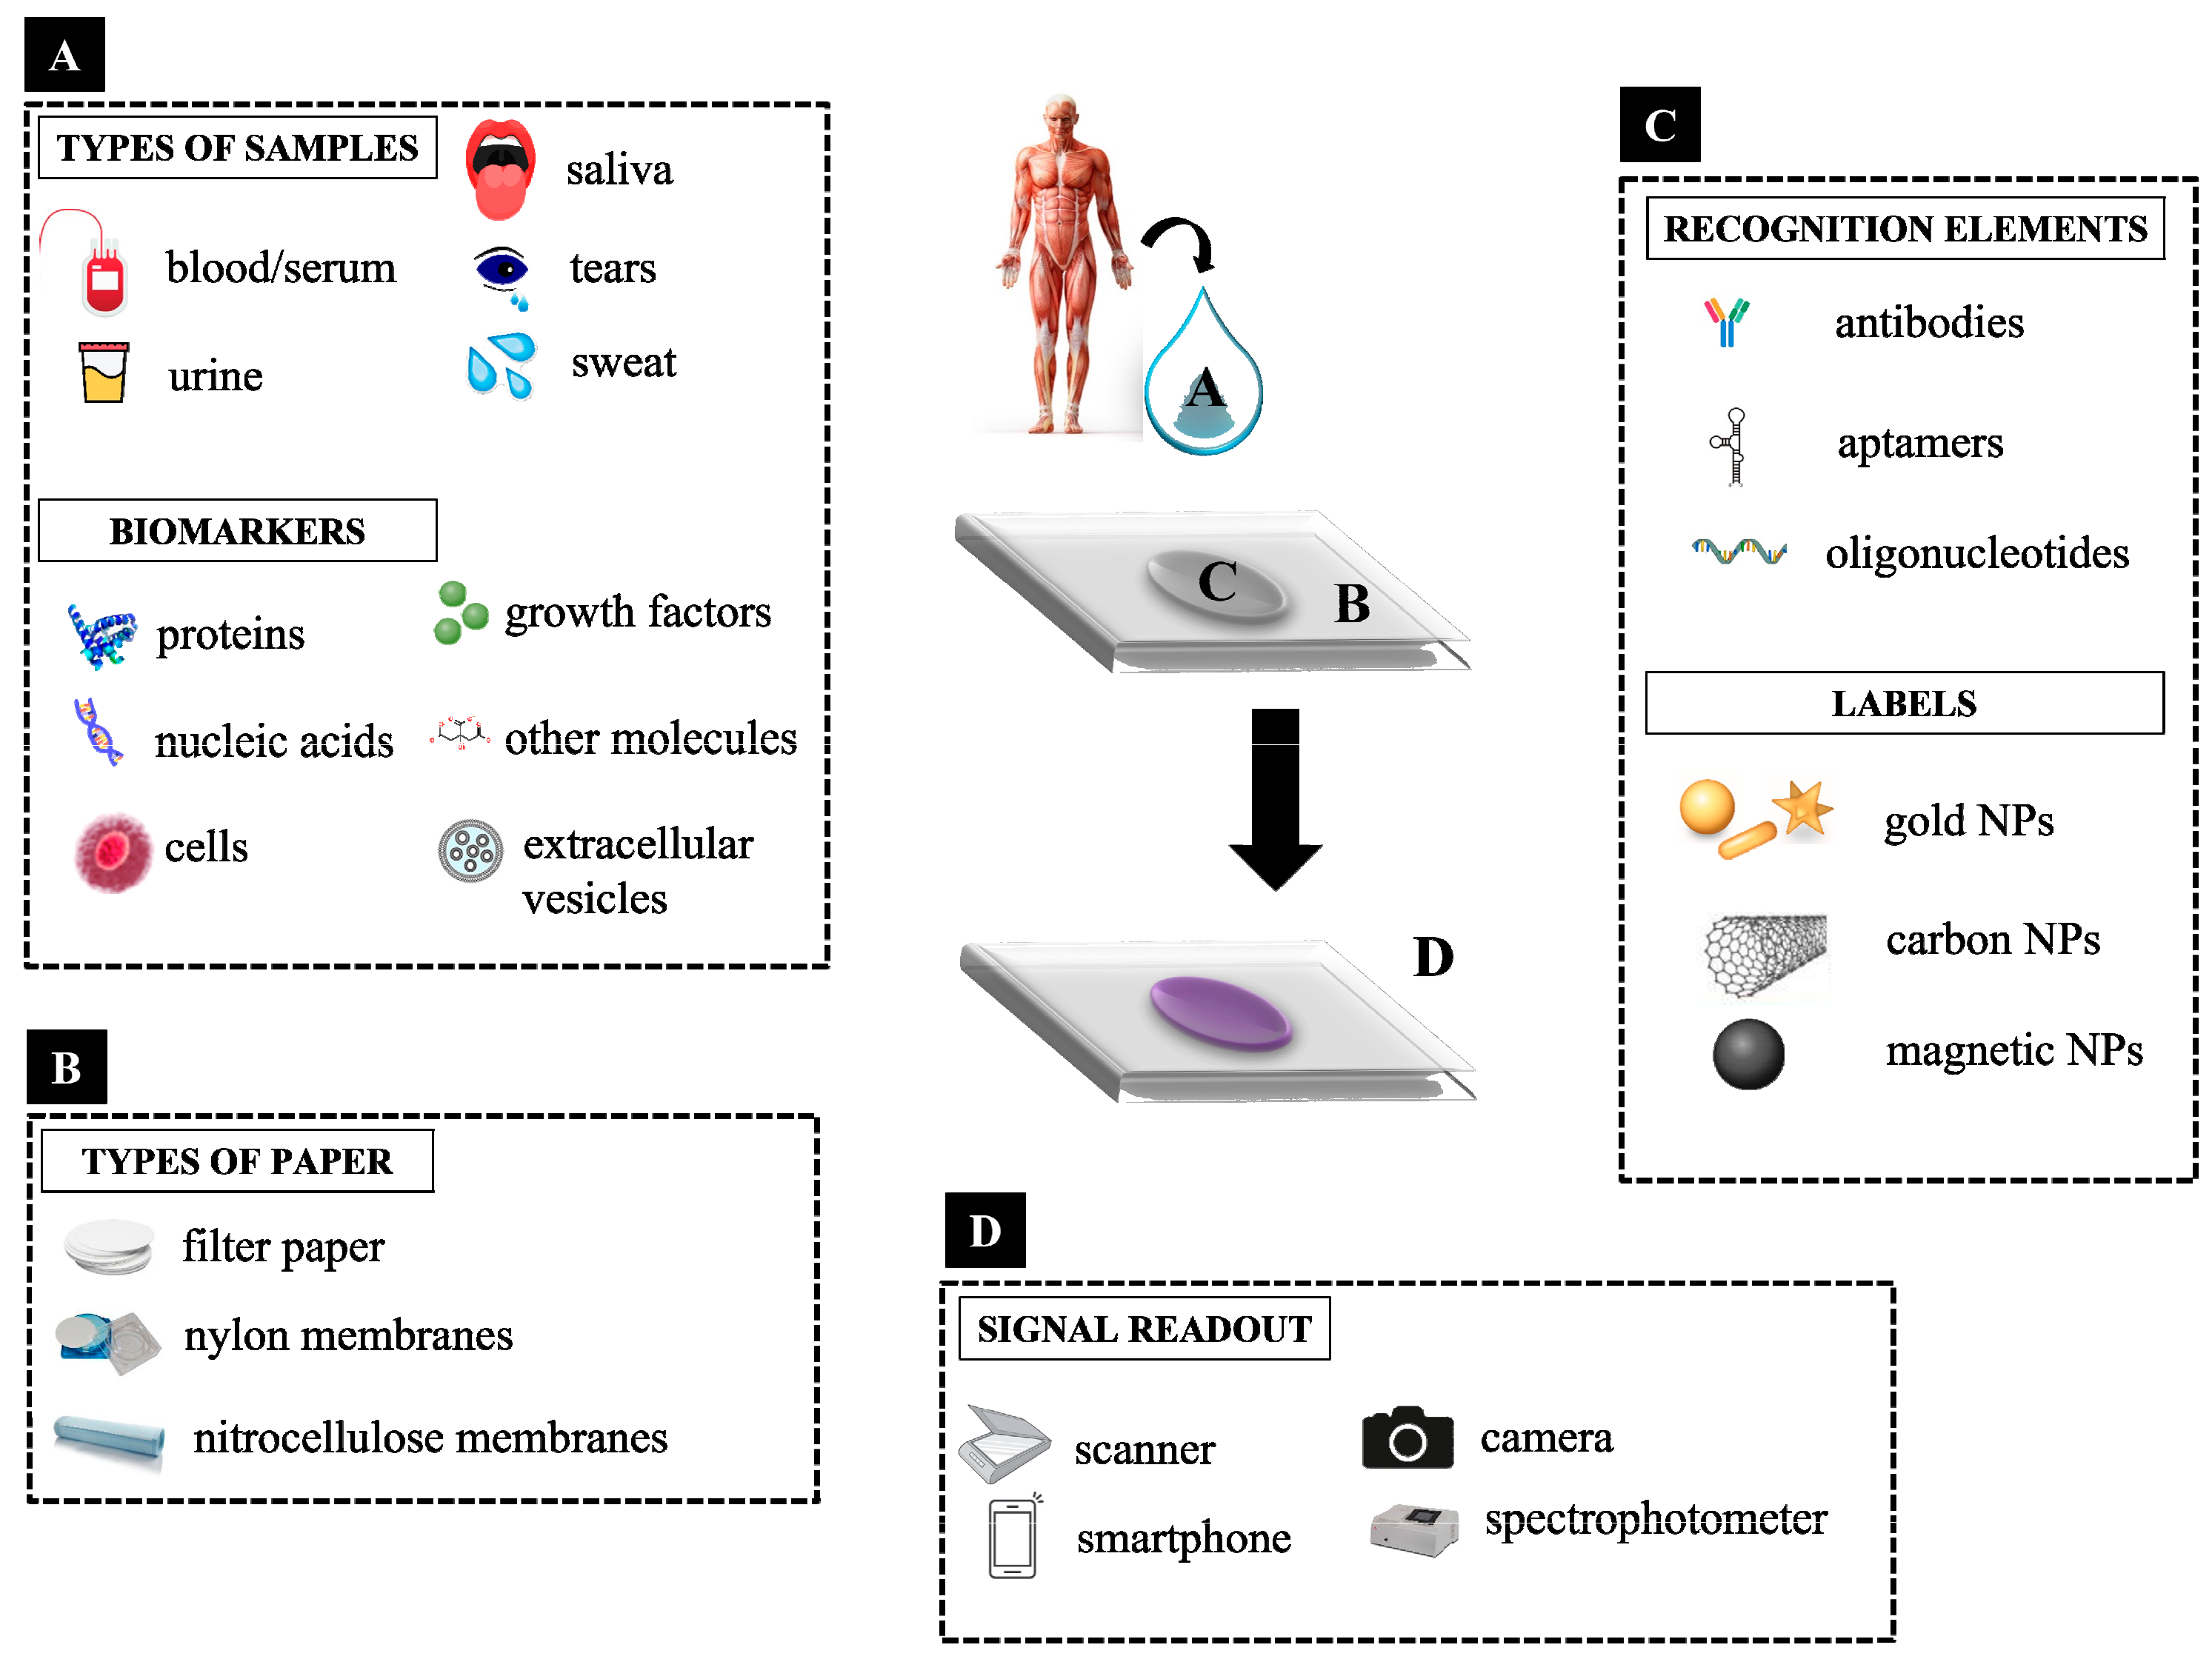
2. Paper-Based Sensors
3. Technical Approaches
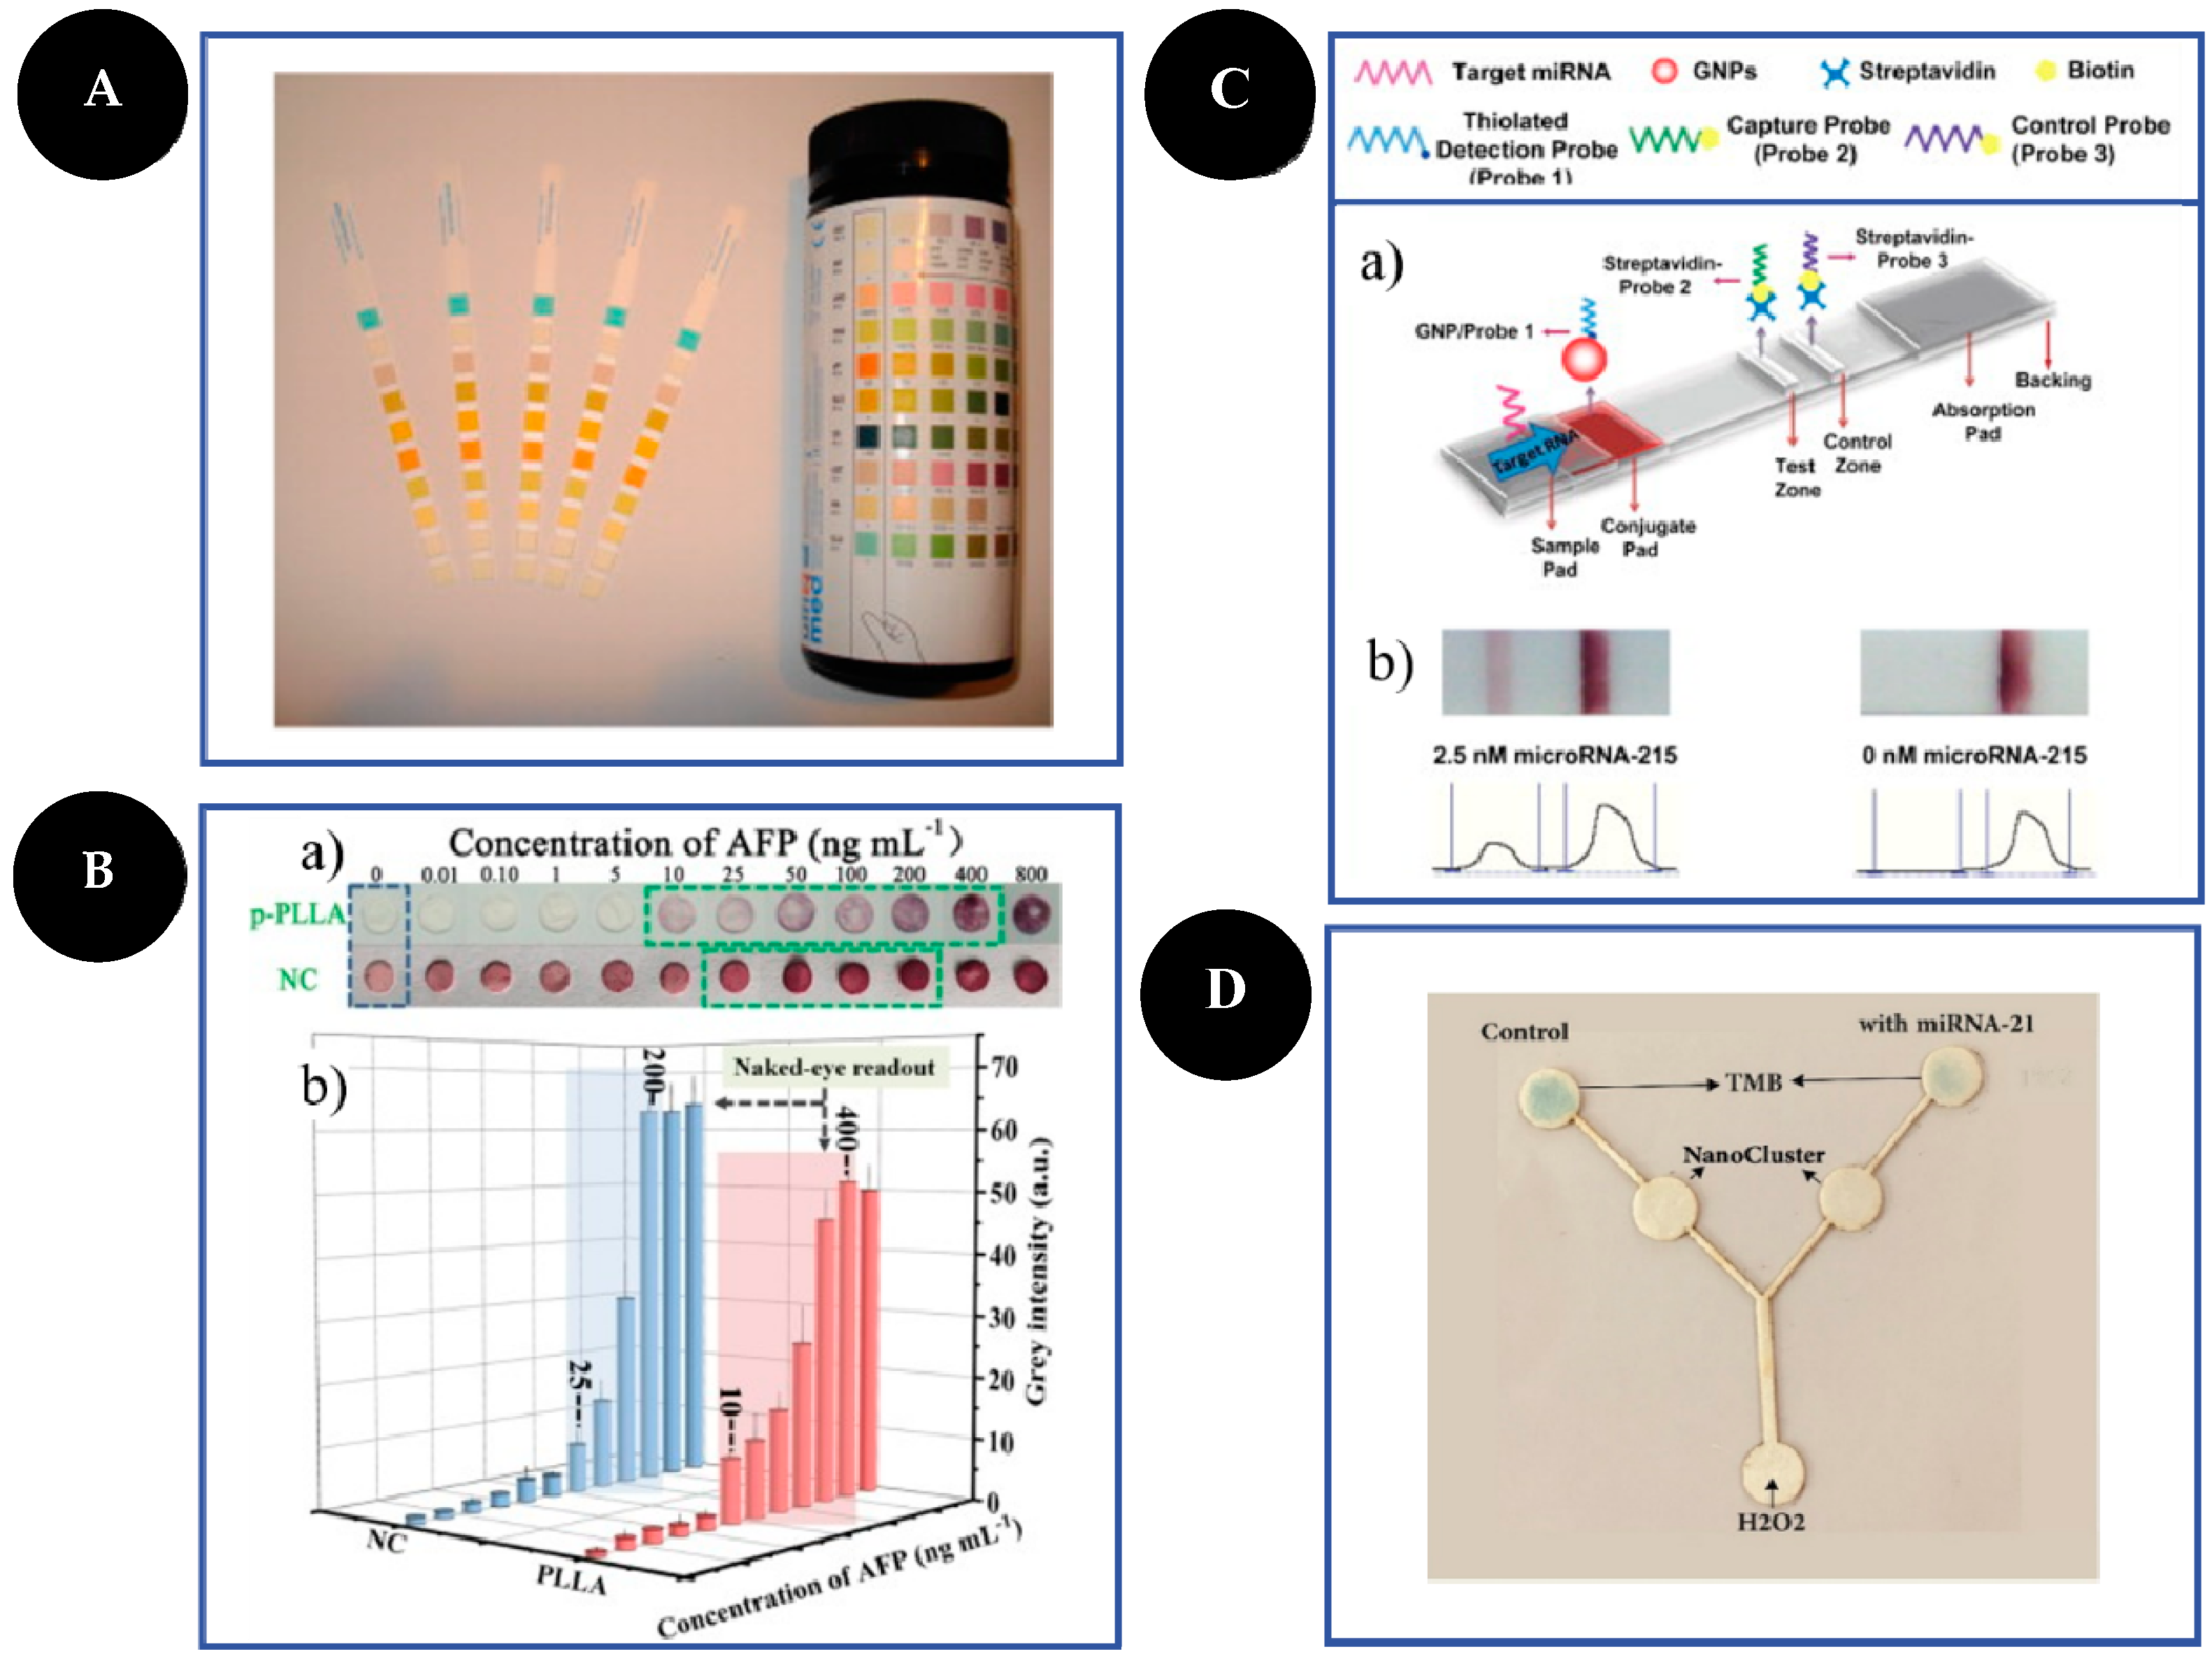
3.1. Dipsticks
3.2. Spot Tests
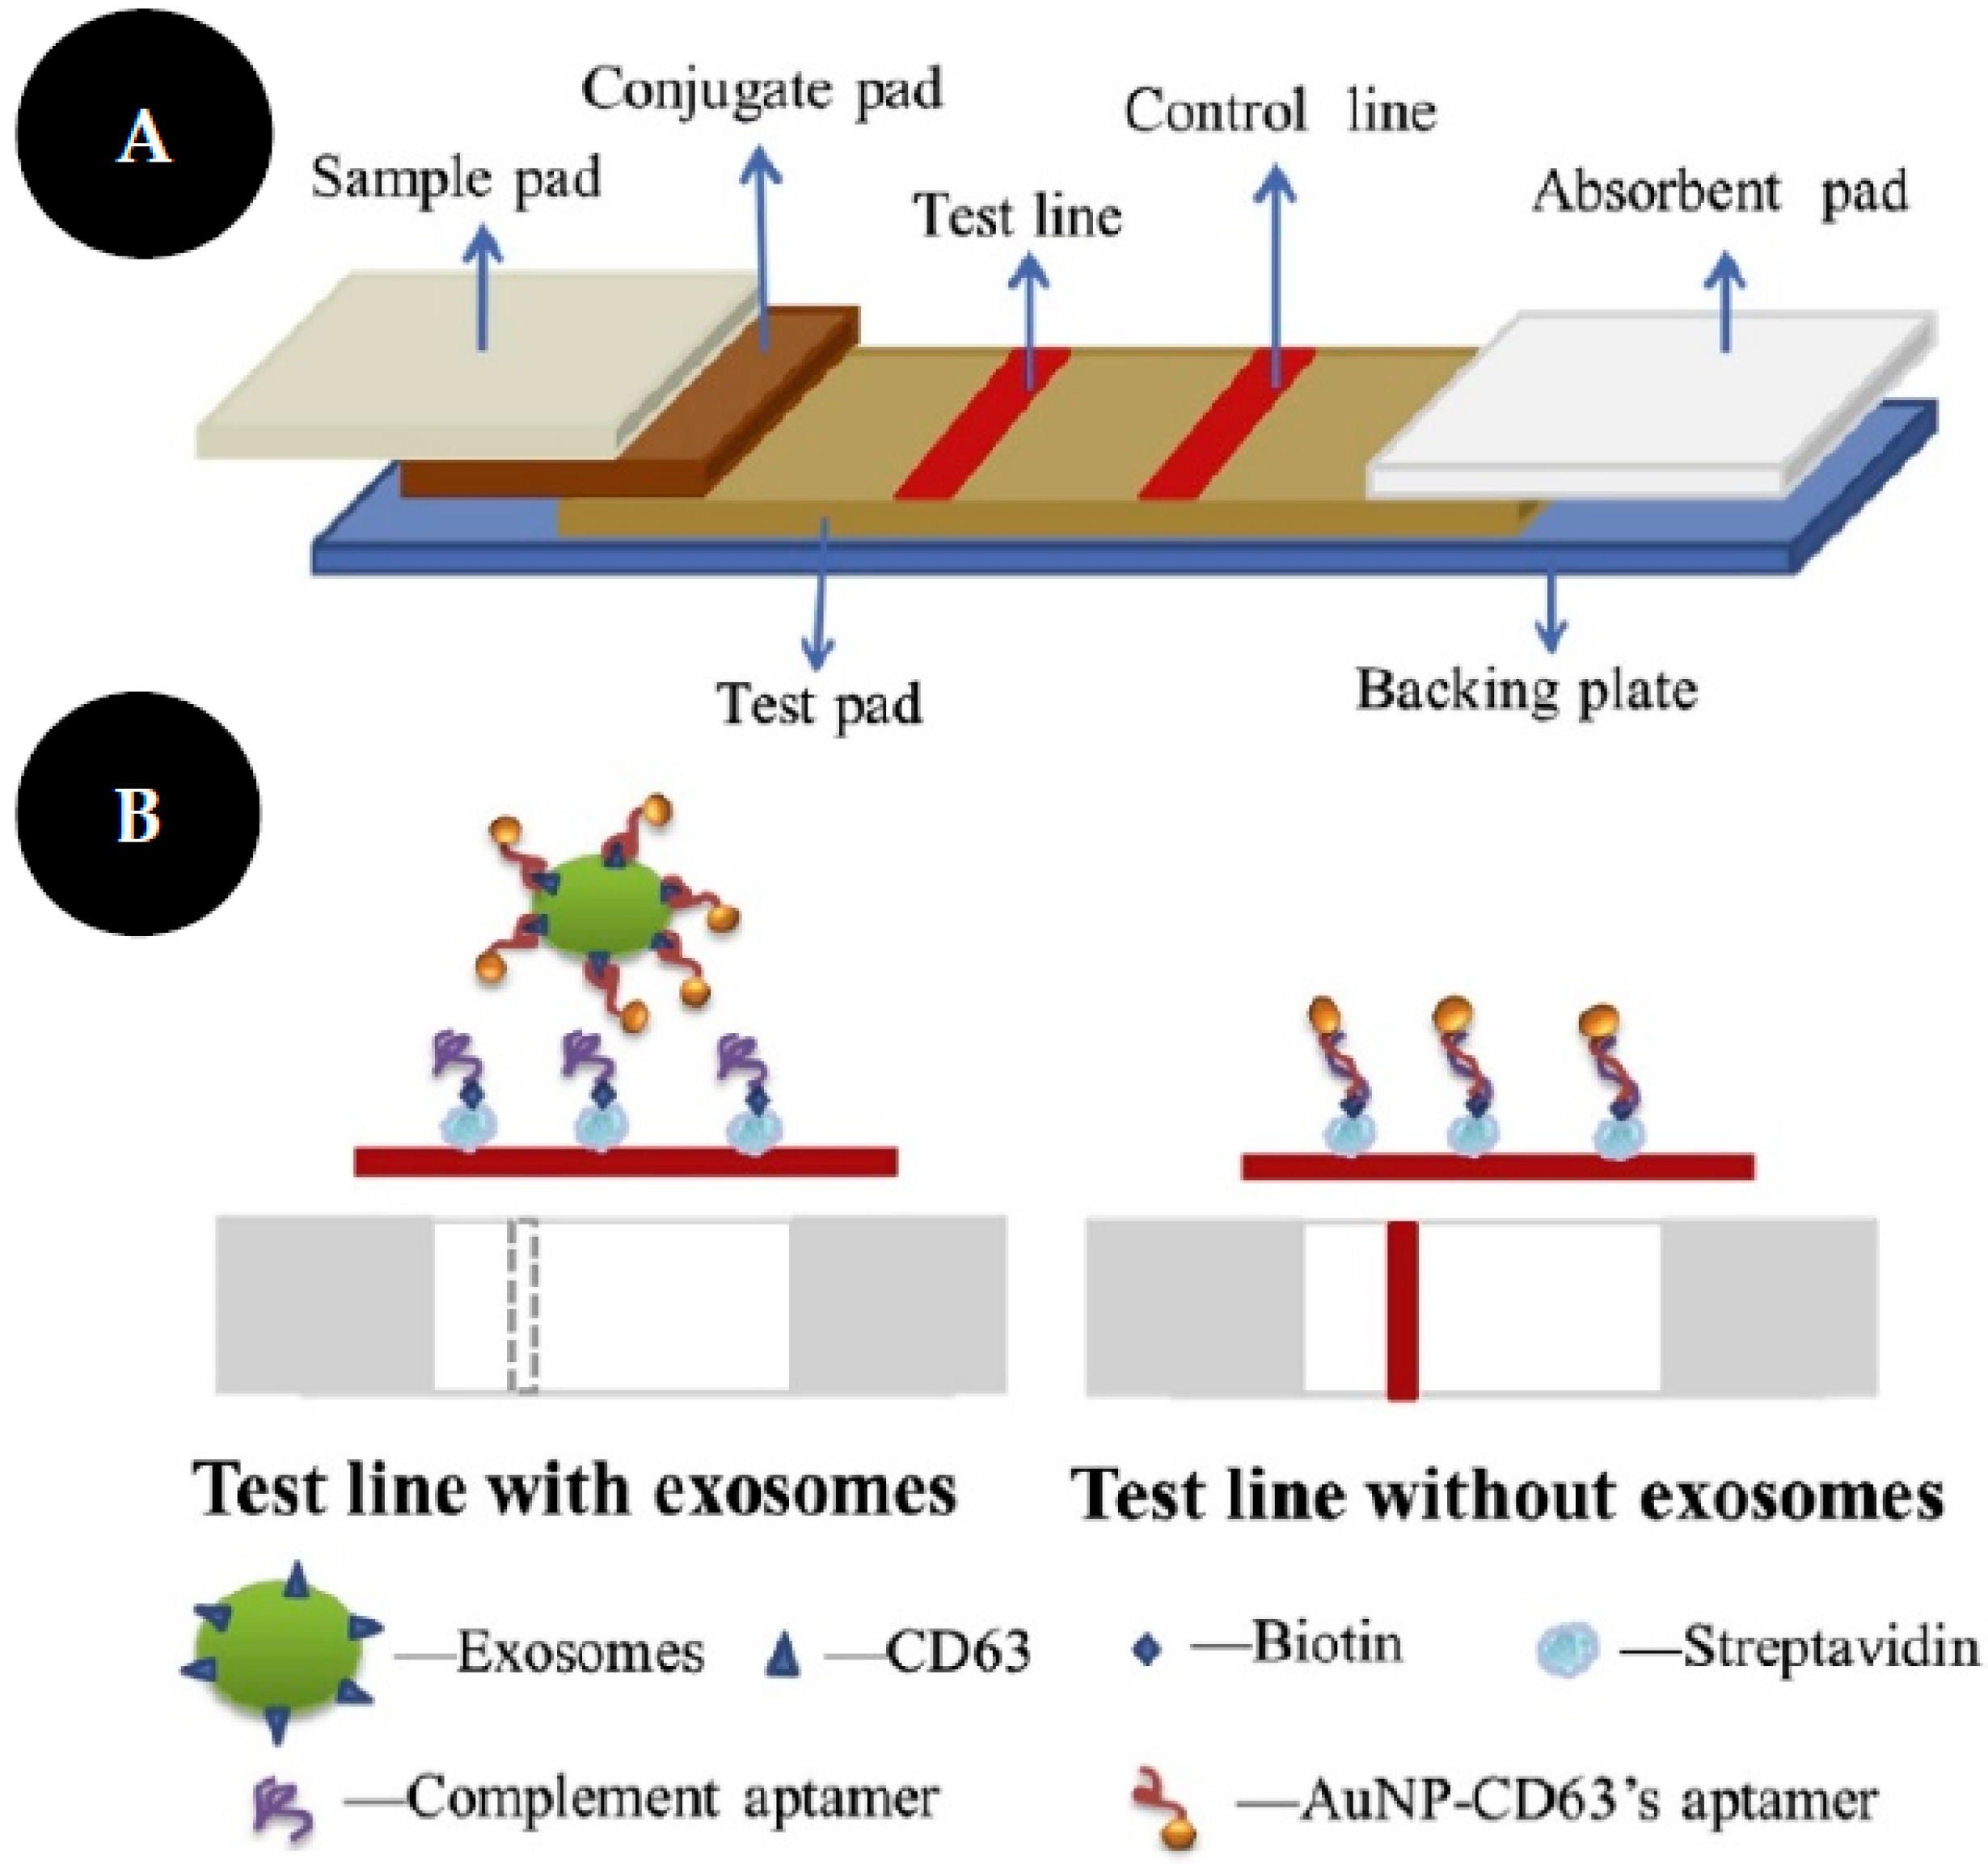
3.3. Lateral-Flow Assays
3.4. µPADs
4. Receptors or Biorecognition Elements
5. Signal Transduction
5.1. Colorimetric Transduction
5.2. Signal Readout
6. Application of Colorimetric Paper-Based Sensors in Cancer Biomarkers
6.1. Proteins
6.2. Enzymes
6.3. Growth Factors
6.4. Nucleic Acids
6.5. Other Molecules
7. Advantages and Challenges of Cancer Biomarker Detection in Colorimetric PADs
8. Conclusions and Future Perspectives
Author Contributions
Funding
Institutional Review Board Statement
Informed Consent Statement
Data Availability Statement
Conflicts of Interest
References
- Tothill, I.; Altintas, Z. Molecular biosensors: Promising new tools for early detection of cancer. Nanobiosen. Dis. Diagn. 2015, 4, 1–10. [Google Scholar] [CrossRef]
- Shankaran, D.R. Chapter 8—Nano-Enabled Immunosensors for Point-of-Care Cancer Diagnosis. In Applications of Nanomaterials; Mohan Bhagyaraj, S., Oluwafemi, O.S., Kalarikkal, N., Thomas, S., Eds.; Woodhead Publishing: Sawston, UK, 2018; pp. 205–250. [Google Scholar] [CrossRef]
- Mahmoudi, T.; de la Guardia, M.; Baradaran, B. Lateral flow assays towards point-of-care cancer detection: A review of current progress and future trends. TrAC Trends Anal. Chem. 2020, 125, 115842. [Google Scholar] [CrossRef]
- Suntornsuk, W.; Suntornsuk, L. Recent applications of paper-based point-of-care devices for biomarker detection. Electrophoresis 2020, 41, 287–305. [Google Scholar] [CrossRef] [PubMed]
- Kasetsirikul, S.; Shiddiky, M.J.A.; Nguyen, N.-T. Challenges and perspectives in the development of paper-based lateral flow assays. Microfluid. Nanofluidics 2020, 24, 17. [Google Scholar] [CrossRef]
- Singh, A.T.; Lantigua, D.; Meka, A.; Taing, S.; Pandher, M.; Camci-Unal, G. Paper-Based Sensors: Emerging Themes and Applications. Sensors 2018, 18, 2838. [Google Scholar] [CrossRef]
- Lim, W.Y.; Goh, B.T.; Khor, S.M. Microfluidic paper-based analytical devices for potential use in quantitative and direct detection of disease biomarkers in clinical analysis. J. Chromatogr. B 2017, 1060, 424–442. [Google Scholar] [CrossRef]
- Liu, L.; Yang, D.; Liu, G. Signal amplification strategies for paper-based analytical devices. Biosens. Bioelectron. 2019, 136, 60–75. [Google Scholar] [CrossRef]
- Tothill, I.E. Biosensors for cancer markers diagnosis. Semin. Cell Dev. Biol. 2009, 20, 55–62. [Google Scholar] [CrossRef]
- Mazzu-Nascimento, T.; Morbioli, G.G.; Milan, L.A.; Donofrio, F.C.; Mestriner, C.A.; Carrilho, E. Development and statistical assessment of a paper-based immunoassay for detection of tumor markers. Anal. Chim. Acta 2017, 950, 156–161. [Google Scholar] [CrossRef]
- Carrell, C.; Kava, A.; Nguyen, M.; Menger, R.; Munshi, Z.; Call, Z.; Nussbaum, M.; Henry, C. Beyond the lateral flow assay: A review of paper-based microfluidics. Microelectron. Eng. 2019, 206, 45–54. [Google Scholar] [CrossRef]
- Ratajczak, K.; Stobiecka, M. High-performance modified cellulose paper-based biosensors for medical diagnostics and early cancer screening: A concise review. Carbohydr. Polym. 2020, 229, 115463. [Google Scholar] [CrossRef] [PubMed]
- Hu, J.; Wang, S.; Wang, L.; Li, F.; Pingguan-Murphy, B.; Lu, T.J.; Xu, F. Advances in paper-based point-of-care diagnostics. Biosens. Bioelectron. 2014, 54, 585–597. [Google Scholar] [CrossRef] [PubMed]
- Agarwal, C.; Csóka, L. Recent Advances in Paper-Based Analytical Devices: A Pivotal Step Forward in Building Next-Generation Sensor Technology. In Sustainable Polymer Composites and Nanocomposites; Springer International Publishing: Berlin/Heidelberg, Germany, 2019; pp. 479–517. [Google Scholar] [CrossRef]
- Chen, Y.; Chu, W.; Liu, W.; Guo, X. Distance-based carcinoembryonic antigen assay on microfluidic paper immunodevice. Sens. Actuators B Chem. 2018, 260, 452–459. [Google Scholar] [CrossRef]
- Kuswandi, B.; Ensafi, A.A. Perspective—Paper-Based Biosensors: Trending Topic in Clinical Diagnostics Developments and Commercialization. J. Electrochem. Soc. 2019, 167, 037509. [Google Scholar] [CrossRef]
- Shende, P.; Prabhakar, B.; Patil, A. Color changing sensors: A multimodal system for integrated screening. TrAC Trends Anal. Chem. 2019, 121, 115687. [Google Scholar] [CrossRef]
- Aydindogan, E.; Ceylan, A.E.; Timur, S. Paper-based colorimetric spot test utilizing smartphone sensing for detection of biomarkers. Talanta 2020, 208, 120446. [Google Scholar] [CrossRef]
- Hosu, O.; Ravalli, A.; Lo Piccolo, G.M.; Cristea, C.; Sandulescu, R.; Marrazza, G. Smartphone-based immunosensor for CA125 detection. Talanta 2017, 166, 234–240. [Google Scholar] [CrossRef]
- Yamada, K.; Shibata, H.; Suzuki, K.; Citterio, D. Toward practical application of paper-based microfluidics for medical diagnostics: State-of-the-art and challenges. Lab Chip 2017, 17, 1206–1249. [Google Scholar] [CrossRef]
- Watt, J.; Banks, J. On a new method of preparing a test liquor to shew the presence of acids and alkalies in chemical mixtures. Philos. Trans. R. Soc. Lond. 1784, 74, 419–422. [Google Scholar] [CrossRef]
- Wang, K.; Yang, J.; Xu, H.; Cao, B.; Qin, Q.; Liao, X.; Wo, Y.; Jin, Q.; Cui, D. Smartphone-imaged multilayered paper-based analytical device for colorimetric analysis of carcinoembryonic antigen. Anal. Bioanal. Chem. 2020, 412, 2517–2528. [Google Scholar] [CrossRef]
- Armstrong, M.D.; Shaw, K.N.F.; Wall, P.E. The phenolic acids of human urine; paper chromatography of phenolic acids. J. Biol. Chem. 1956, 218, 293–303. [Google Scholar] [CrossRef]
- Alizadeh, N.; Salimi, A.; Hallaj, R. Mimicking peroxidase activity of Co2(OH)2CO3-CeO2 nanocomposite for smartphone based detection of tumor marker using paper-based microfluidic immunodevice. Talanta 2018, 189, 100–110. [Google Scholar] [CrossRef] [PubMed]
- Nie, J.; Zhang, Y.; Lin, L.; Zhou, C.; Li, S.; Zhang, L.; Li, J. Low-Cost Fabrication of Paper-Based Microfluidic Devices by One-Step Plotting. Anal. Chem. 2012, 84, 6331–6335. [Google Scholar] [CrossRef]
- Fakhri, N.; Abarghoei, S.; Dadmehr, M.; Hosseini, M.; Sabahi, H.; Ganjali, M.R. Paper based colorimetric detection of miRNA-21 using Ag/Pt nanoclusters. Spectrochim. Acta Part A Mol. Biomol. Spectrosc. 2020, 227, 117529. [Google Scholar] [CrossRef]
- Liu, W.; Yang, H.; Ding, Y.; Ge, S.; Yu, J.; Yan, M.; Song, X. Paper-based colorimetric immunosensor for visual detection of carcinoembryonic antigen based on the high peroxidase-like catalytic performance of ZnFe2O4–multiwalled carbon nanotubes. Analyst 2014, 139, 251–258. [Google Scholar] [CrossRef]
- Yokchom, R.; Laiwejpithaya, S.; Maneeprakorn, W.; Tapaneeyakorn, S.; Rabablert, J.; Dharakul, T. Paper-based immunosensor with signal amplification by enzyme-labeled anti-p16INK4a multifunctionalized gold nanoparticles for cervical cancer screening. Nanomed. Nanotechnol. Biol. Med. 2018, 14, 1051–1058. [Google Scholar] [CrossRef]
- Mwai, L.M.; Mutinda, C.K.; Ngugi, C.W.; Walong, E. Development of HPV 16/18 E6 oncoprotein paper-based nanokit for enhanced detection of HPV 16/18 E6 oncoprotein in cervical cancer screening. J. Nanotechnol. Nanomater. 2020, 1, 31–45. [Google Scholar] [CrossRef]
- Ma, F.; He, L.; Lindner, E.; Wu, D.-Y. Highly porous poly(l-lactic) acid nanofibers as a dual-signal paper-based bioassay platform for in vitro diagnostics. Appl. Surf. Sci. 2021, 542, 148732. [Google Scholar] [CrossRef]
- Eiras, C. A Point of Care Lateral Flow Assay for Rapid and Colorimetric Detection of Interleukin 6 and Perspectives in Bedside Diagnostics. J. Clin. Med. Res. 2020. [Google Scholar] [CrossRef]
- Gao, X.; Xu, H.; Baloda, M.; Gurung, A.S.; Xu, L.-P.; Wang, T.; Zhang, X.; Liu, G. Visual detection of microRNA with lateral flow nucleic acid biosensor. Biosens. Bioelectron. 2014, 54, 578–584. [Google Scholar] [CrossRef]
- Wang, Y.; Pei, H.; Jia, Y.; Liu, J.; Li, Z.; Ai, K.; Lu, Z.; Lu, L. Synergistic Tailoring of Electrostatic and Hydrophobic Interactions for Rapid and Specific Recognition of Lysophosphatidic Acid, an Early-Stage Ovarian Cancer Biomarker. J. Am. Chem. Soc. 2017, 139, 11616–11621. [Google Scholar] [CrossRef] [PubMed]
- Zheng, W.; Yao, L.; Teng, J.; Yan, C.; Qin, P.; Liu, G.; Chen, W. Lateral flow test for visual detection of multiple MicroRNAs. Sens. Actuators B Chem. 2018, 264, 320–326. [Google Scholar] [CrossRef] [PubMed]
- Ranganathan, V.; Srinivasan, S.; Singh, A.; DeRosa, M.C. An aptamer-based colorimetric lateral flow assay for the detection of human epidermal growth factor receptor 2 (HER2). Anal. Biochem. 2020, 588, 113471. [Google Scholar] [CrossRef] [PubMed]
- Ren, W.; Mohammed, S.I.; Wereley, S.; Irudayaraj, J. Magnetic Focus Lateral Flow Sensor for Detection of Cervical Cancer Biomarkers. Anal. Chem. 2019, 91, 2876–2884. [Google Scholar] [CrossRef]
- Yu, Q.; Zhao, Q.; Wang, S.; Zhao, S.; Zhang, S.; Yin, Y.; Dong, Y. Development of a lateral flow aptamer assay strip for facile identification of theranostic exosomes isolated from human lung carcinoma cells. Anal. Biochem. 2020, 594, 113591. [Google Scholar] [CrossRef]
- Liu, W.; Guo, Y.; Zhao, M.; Li, H.; Zhang, Z. Ring-Oven Washing Technique Integrated Paper-based Immunodevice for Sensitive Detection of Cancer Biomarker. Anal. Chem. 2015, 87, 7951–7957. [Google Scholar] [CrossRef]
- Mesgari, F.; Beigi, S.M.; Fakhri, N.; Hosseini, M.; Aghazadeh, M.; Ganjali, M.R. Paper-based chemiluminescence and colorimetric detection of cytochrome c by cobalt hydroxide decorated mesoporous carbon. Microchem. J. 2020, 157, 104991. [Google Scholar] [CrossRef]
- Resmi, P.E.; Stanley, J.; Kumar, S.; Soman, K.P.; Ramachandran, T.; TG, S.B. Fabrication of Paper Microfluidics POCT Device for the Colorimetric Assay of Alkaline Phosphatase. In Proceedings of the 2018 15th IEEE India Council International Conference (INDICON), Coimbatore, India, 16–18 December 2018; pp. 1–4. [Google Scholar]
- Liang, L.; Ge, S.; Li, L.; Liu, F.; Yu, J. Microfluidic paper-based multiplex colorimetric immunodevice based on the catalytic effect of Pd/Fe3O4@C peroxidase mimetics on multiple chromogenic reactions. Anal. Chim. Acta 2015, 862, 70–76. [Google Scholar] [CrossRef]
- Abarghoei, S.; Fakhri, N.; Borghei, Y.S.; Hosseini, M.; Ganjali, M.R. A colorimetric paper sensor for citrate as biomarker for early stage detection of prostate cancer based on peroxidase-like activity of cysteine-capped gold nanoclusters. Spectrochim. Acta Part A Mol. Biomol. Spectrosc. 2019, 210, 251–259. [Google Scholar] [CrossRef]
- Free, A.H.; Adams, E.C.; Kercher, M.L.; Free, H.M.; Cook, M.H. Simple Specific Test for Urine Glucose. Clin. Chem. 1957, 3, 163–168. [Google Scholar] [CrossRef]
- West, P.W. Selective Spot Test for Copper. Ind. Eng. Chem. Anal. Ed. 1945, 17, 740–741. [Google Scholar] [CrossRef]
- Singer, J.M.; Plotz, C.M. The latex fixation test: I. Application to the serologic diagnosis of rheumatoid arthritis. Am. J. Med. 1956, 21, 888–892. [Google Scholar] [CrossRef]
- Koczula, K.M.; Gallotta, A. Lateral flow assays. Essays Biochem. 2016, 60, 111–120. [Google Scholar] [CrossRef]
- Martinez, A.W.; Phillips, S.T.; Butte, M.J.; Whitesides, G.M. Patterned paper as a platform for inexpensive, low-volume, portable bioassays. Angew. Chem. 2007, 46, 1318–1320. [Google Scholar] [CrossRef] [PubMed]
- Ozer, T.; McMahon, C.; Henry, C.S. Advances in Paper-Based Analytical Devices. Annu. Rev. Anal. Chem. 2020, 13, 85–109. [Google Scholar] [CrossRef] [PubMed]
- Alahmad, W.; Sahragard, A.; Varanusupakul, P. Online and offline preconcentration techniques on paper-based analytical devices for ultrasensitive chemical and biochemical analysis: A review. Biosens. Bioelectron. 2021, 194, 113574. [Google Scholar] [CrossRef]
- Ming, T.; Luo, J.; Liu, J.; Sun, S.; Xing, Y.; Wang, H.; Xiao, G.; Deng, Y.; Cheng, Y.; Yang, Z.; et al. Paper-based microfluidic aptasensors. Biosens. Bioelectron. 2020, 170, 112649. [Google Scholar] [CrossRef]
- Li, W.; Zhang, X.; Li, T.; Ji, Y.; Li, R. Molecularly imprinted polymer-enhanced biomimetic paper-based analytical devices: A review. Anal. Chim. Acta 2021, 1148, 238196. [Google Scholar] [CrossRef]
- Moreira, F.T.C.; Correia, B.P.; Sousa, M.P.; Sales, G.F. Colorimetric cellulose-based test-strip for rapid detection of amyloid β-42. Microchim. Acta 2021, 188, 334. [Google Scholar] [CrossRef]
- Davidson, J.L.; Wang, J.; Maruthamuthu, M.K.; Dextre, A.; Pascual-Garrigos, A.; Mohan, S.; Putikam, S.V.S.; Osman, F.O.I.; McChesney, D.; Seville, J.; et al. A paper-based colorimetric molecular test for SARS-CoV-2 in saliva. Biosens. Bioelectron. X 2021, 9, 100076. [Google Scholar] [CrossRef]
- Pinheiro, T.; Ferrão, J.; Marques, A.C.; Oliveira, M.J.; Batra, N.M.; Costa, P.; Macedo, M.P.; Águas, H.; Martins, R.; Fortunato, E. Paper-Based In-Situ Gold Nanoparticle Synthesis for Colorimetric, Non-Enzymatic Glucose Level Determination. Nanomaterials 2020, 10, 2027. [Google Scholar] [CrossRef] [PubMed]
- Kaneta, T.; Alahmad, W.; Varanusupakul, P. Microfluidic paper-based analytical devices with instrument-free detection and miniaturized portable detectors. Appl. Spectrosc. Rev. 2019, 54, 117–141. [Google Scholar] [CrossRef]
- Murray, L.P.; Mace, C.R. Usability as a guiding principle for the design of paper-based, point-of-care devices—A review. Anal. Chim. Acta 2020, 1140, 236–249. [Google Scholar] [CrossRef] [PubMed]
- Fu, G.; Li, X.; Wang, W.; Hou, R. Multiplexed tri-mode visual outputs of immunoassay signals on a clip-magazine-assembled photothermal biosensing disk. Biosens. Bioelectron. 2020, 170, 112646. [Google Scholar] [CrossRef]
- Wang, L.-X.; Fu, J.-J.; Zhou, Y.; Chen, G.; Fang, C.; Lu, Z.S.; Yu, L. On-chip RT-LAMP and colorimetric detection of the prostate cancer 3 biomarker with an integrated thermal and imaging box. Talanta 2020, 208, 120407. [Google Scholar] [CrossRef]
- Mohammed, S.I.; Ren, W.; Flowers, L.; Rajwa, B.; Chibwesha, C.J.; Parham, G.P.; Irudayaraj, J.M.K. Point-of-care test for cervical cancer in LMICs. Oncotarget 2016, 7, 18787–18797. [Google Scholar] [CrossRef][Green Version]
- Mazzu-Nascimento, T.; Gomes Carneiro Leão, P.A.; Catai, J.R.; Morbioli, G.G.; Carrilho, E. Towards low-cost bioanalytical tools for sarcosine assays for cancer diagnostics. Anal. Methods 2016, 8, 7312–7318. [Google Scholar] [CrossRef]
- Masumoto, M.; Ohta, S.; Nakagawa, M.; Hiruta, Y.; Citterio, D. Colorimetric paper-based sarcosine assay with improved sensitivity. Anal. Bioanal. Chem. 2022, 414, 691–701. [Google Scholar] [CrossRef]
- Mahmoudi, T.; Pirpour Tazehkand, A.; Pourhassan-Moghaddam, M.; Alizadeh-Ghodsi, M.; Ding, L.; Baradaran, B.; Razavi Bazaz, S.; Jin, D.; Ebrahimi Warkiani, M. PCR-free paper-based nanobiosensing platform for visual detection of telomerase activity via gold enhancement. Microchem. J. 2020, 154, 104594. [Google Scholar] [CrossRef]
- Fu, A.C.; Hu, Y.; Zhao, Z.-H.; Su, R.; Song, Y.; Zhu, D. Functionalized paper microzone plate for colorimetry and up-conversion fluorescence dual-mode detection of telomerase based on elongation and capturing amplification. Sens. Actuators B Chem. 2018, 259, 642–649. [Google Scholar] [CrossRef]
- Prasad, K.S.; Abugalyon, Y.; Li, C.; Xu, F.; Li, X. A new method to amplify colorimetric signals of paper-based nanobiosensors for simple and sensitive pancreatic cancer biomarker detection. Analyst 2020, 145, 5113–5117. [Google Scholar] [CrossRef] [PubMed]
- Naorungroj, S.; Teengam, P.; Vilaivan, T.; Chailapakul, O. Paper-based DNA sensor enabling colorimetric assay integrated with smartphone for human papillomavirus detection. New J. Chem. 2021, 45, 6960–6967. [Google Scholar] [CrossRef]
- Shaban, S.M.; Lee, J.Y.; Kim, D.-H. Dual-Surfactant-Capped Ag Nanoparticles as a Highly Selective and Sensitive Colorimetric Sensor for Citrate Detection. ACS Omega 2020, 5, 10696–10703. [Google Scholar] [CrossRef] [PubMed]


| Target | Type of PAD | Recognition Element | System of Detection | Linear Range | LOD | Reference | |
|---|---|---|---|---|---|---|---|
| Proteins | CEA | μPAD | Ab | HRP + TMB | 0.5 to 70 ng/mL | 0.015 ng/mL | [1] |
| μPAD | Ab | HRP + TMB | 0 to 40 ng/mL | 2 ng/mL | [2] | ||
| spot test | Ab | nanocomposite with peroxidase-like activity + TMB | 0.002 to 75 ng/mL | 0.51 pg/mL | [3] | ||
| spot test | Ab | Carbon nanotubes with peroxidase-like activity + TMB | 0.005 to 30 ng/mL | 2.6 pg/mL | [4] | ||
| spot test | Ab | Biotin + avidin-peroxidase + TMB | - | - | [5] | ||
| μPAD | Ab | HRP + TMB | 0.1 to 20.0 ng/mL | 0.03 ng/mL | [6] | ||
| μPAD | Ab | AuNPs + Pd/Fe3O4@C NPs with peroxidase-like activity + TMB | 0.005 and 30 ng/mL | 1.7 pg/mL | [7] | ||
| CA-125 | spot test | Ab | AuNPs + silver enhancement | 30 to 100 U/mL. | 30 U/mL | [8] | |
| spot test | Ab | Cys-AuNPs | 0.1 to 10 ng/mL | 0.413 ng/mL | [9] | ||
| α-AFP | spot test | Ab | Cys-AuNPs | 0.1 to 100 ng/mL | 1.054 ng/mL | [9] | |
| μPAD | Ab | AuNPs + Pd/Fe3O4@C NPs with peroxidase-like activity + OPD | 0.005 and 30 ng/mL | 1.7 pg/mL | [7] | ||
| spot test | Ab | AuNPs | 10 to 400 ng/mL | 0.17 pg/mL | [10] | ||
| PSA | μPAD | Ab | AuNPs | 0.5 to 50 μg/L | ≈360.2 ng/L | [11] | |
| μPAD | Ab | Fe3O4 conversion to PB | 3 to 80 ng/mL | 2.7 ng/mL | [12] | ||
| PCA3 | μPAD | - | chromogenic substrate | 1 × 10⁻³ to 1 × 101 pg/μL | 0.34 fg/μL | [13] | |
| p16INK4a | spot test | Ab | AuNPs peroxidase-like activity + HRP + TMB | - | 300 cells (HeLa and CasKi cell lines) and 3000 cells (SiHa cell lines) | [14] | |
| HPV 16/18 E6 | spot test | Ab | AuNPs peroxidase-like activity + HRP + TMB | - | 0.0005 pg/mL | [15] | |
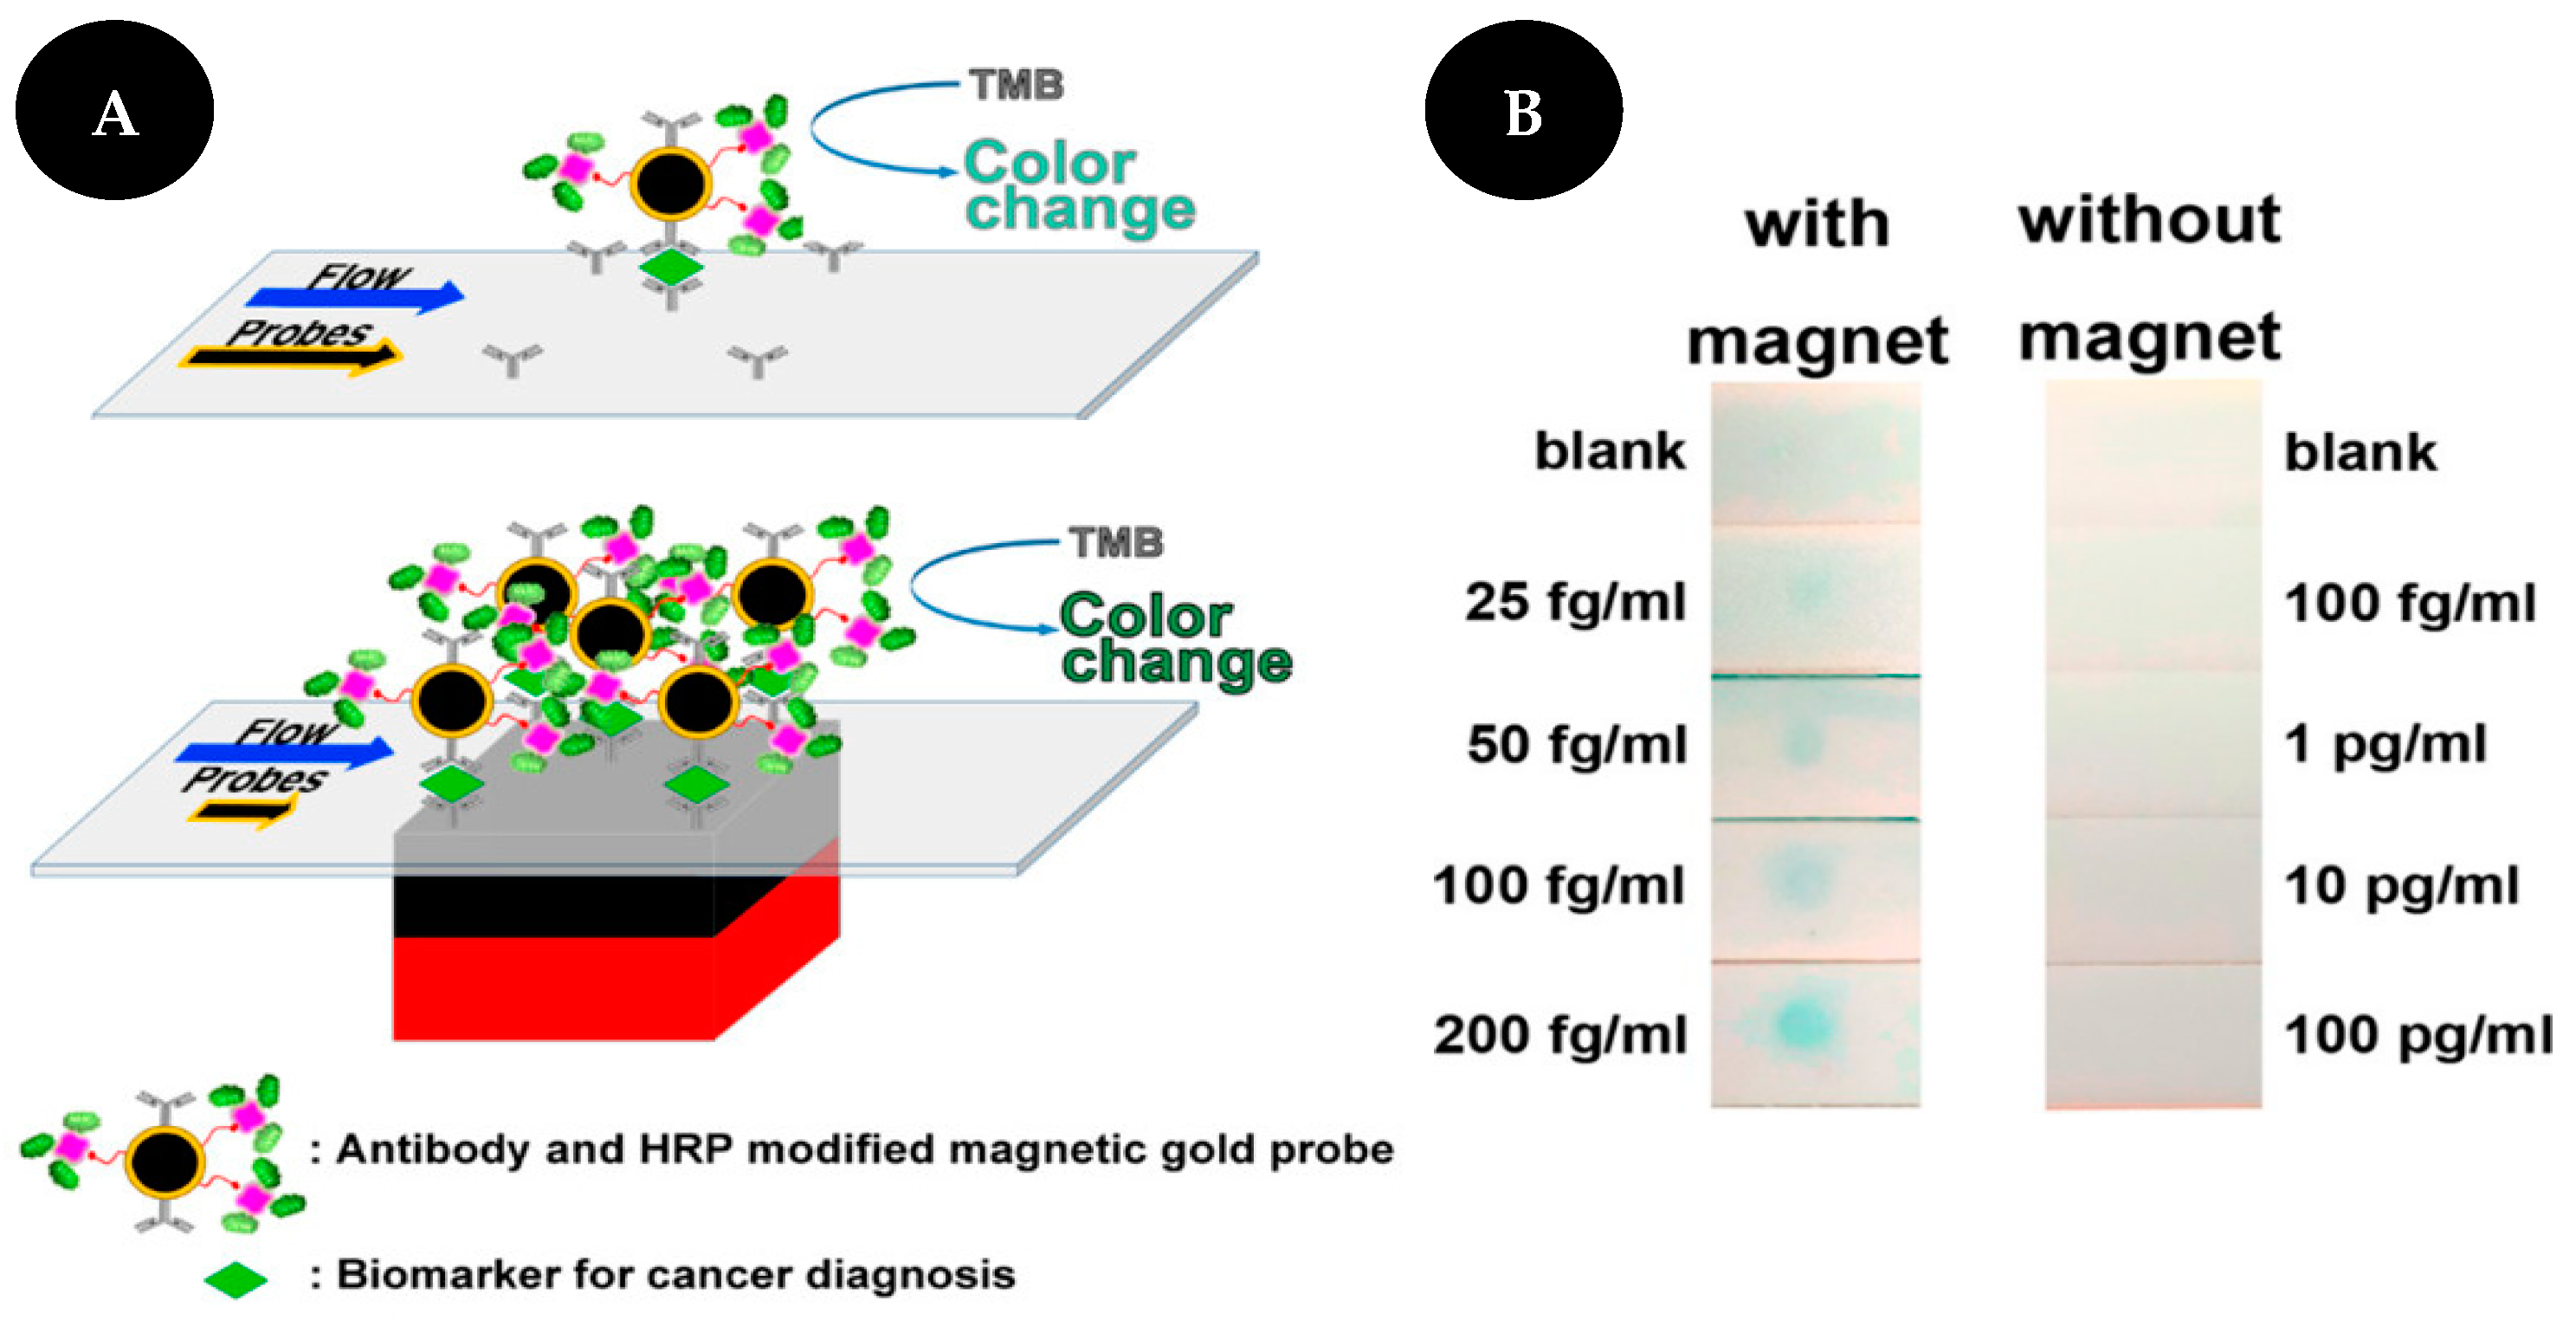
| VCP | LFA | Ab | gold-coated magnetic nanostructures + streptavidin poly-HRP + TMB | - | 25 fg/mL | [16] | |
| sarcosine | spot test | sarcosine oxidase | sarcosine oxidase + HRP + ABTS | 0 to 1 mM | 0.21 mM | [17] | |
| spot test | sarcosine oxidase | sarcosine oxidase + HRP + TMB | 0 to 10 μM | 0.6 μM | [18] | ||
| Cyt c | µPAD | aptamer | mesoporous carbon + TMB | 1 µM to 1 mM | 5.0 × 10⁻⁷ M | [19] | |
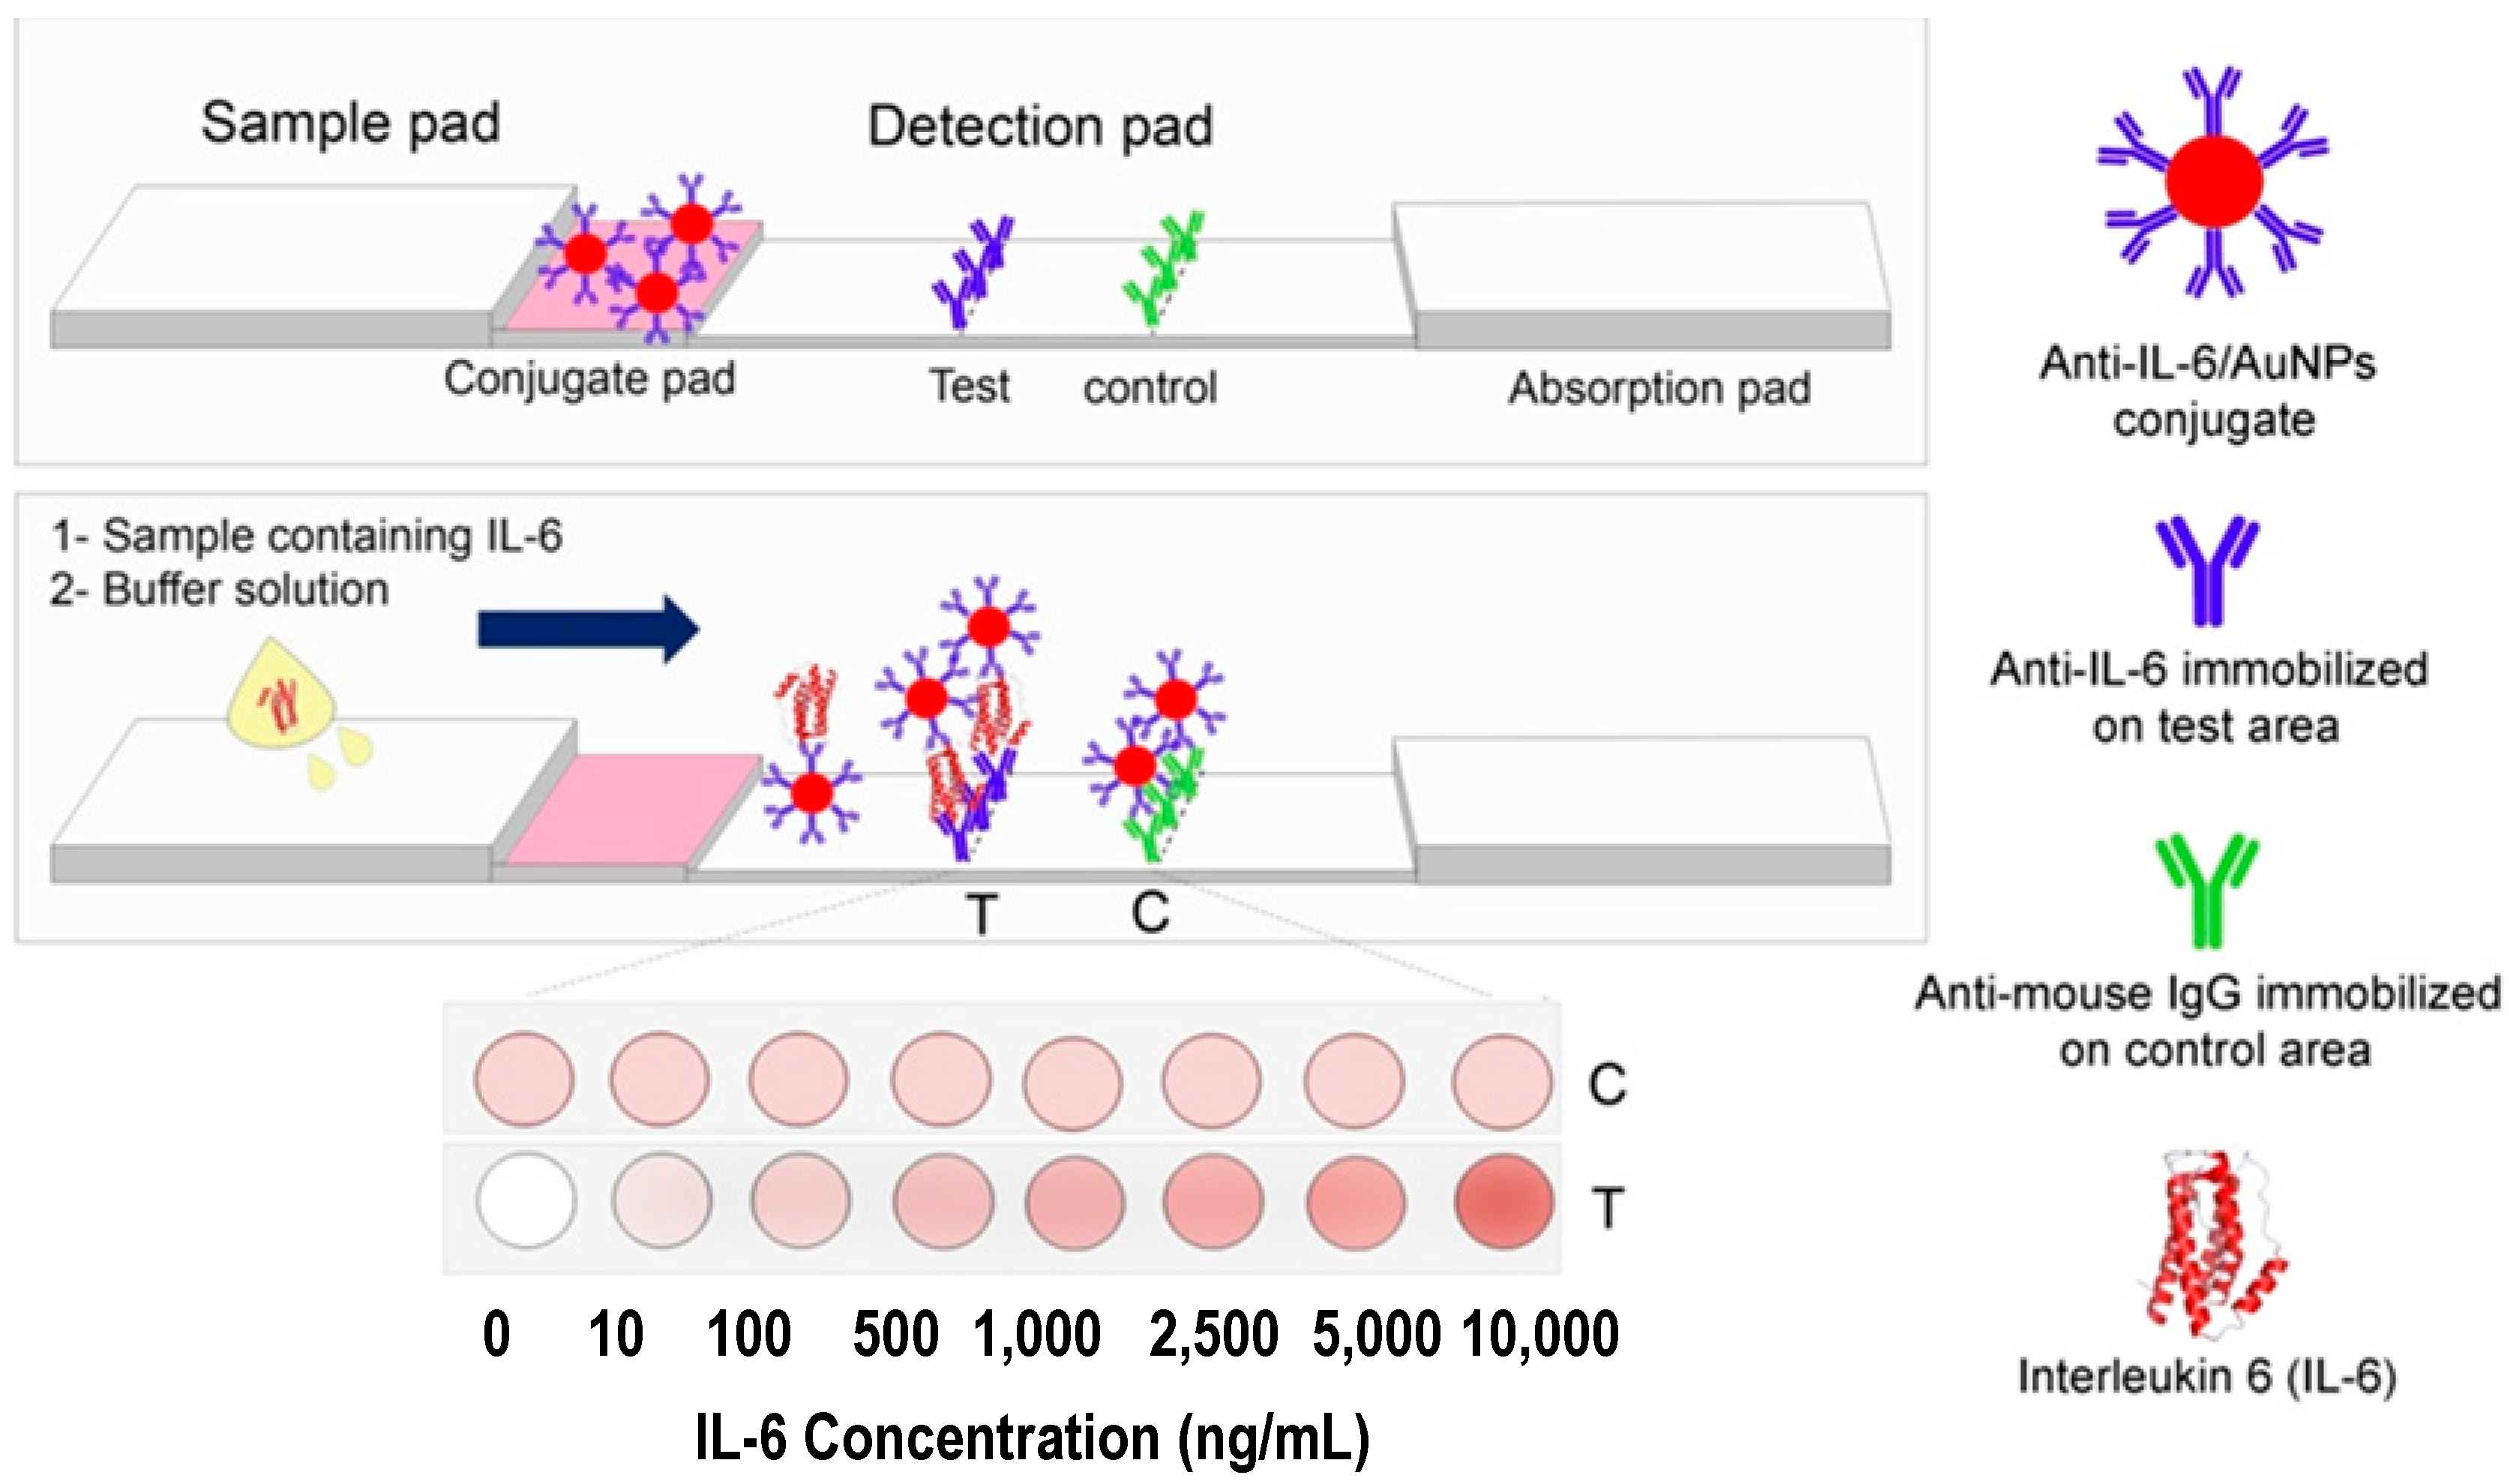
| IL-6 | LFA | Ab | AuNPs | 1.25 to 9000 ng/mL | 0.38 ng/mL | [20] | |
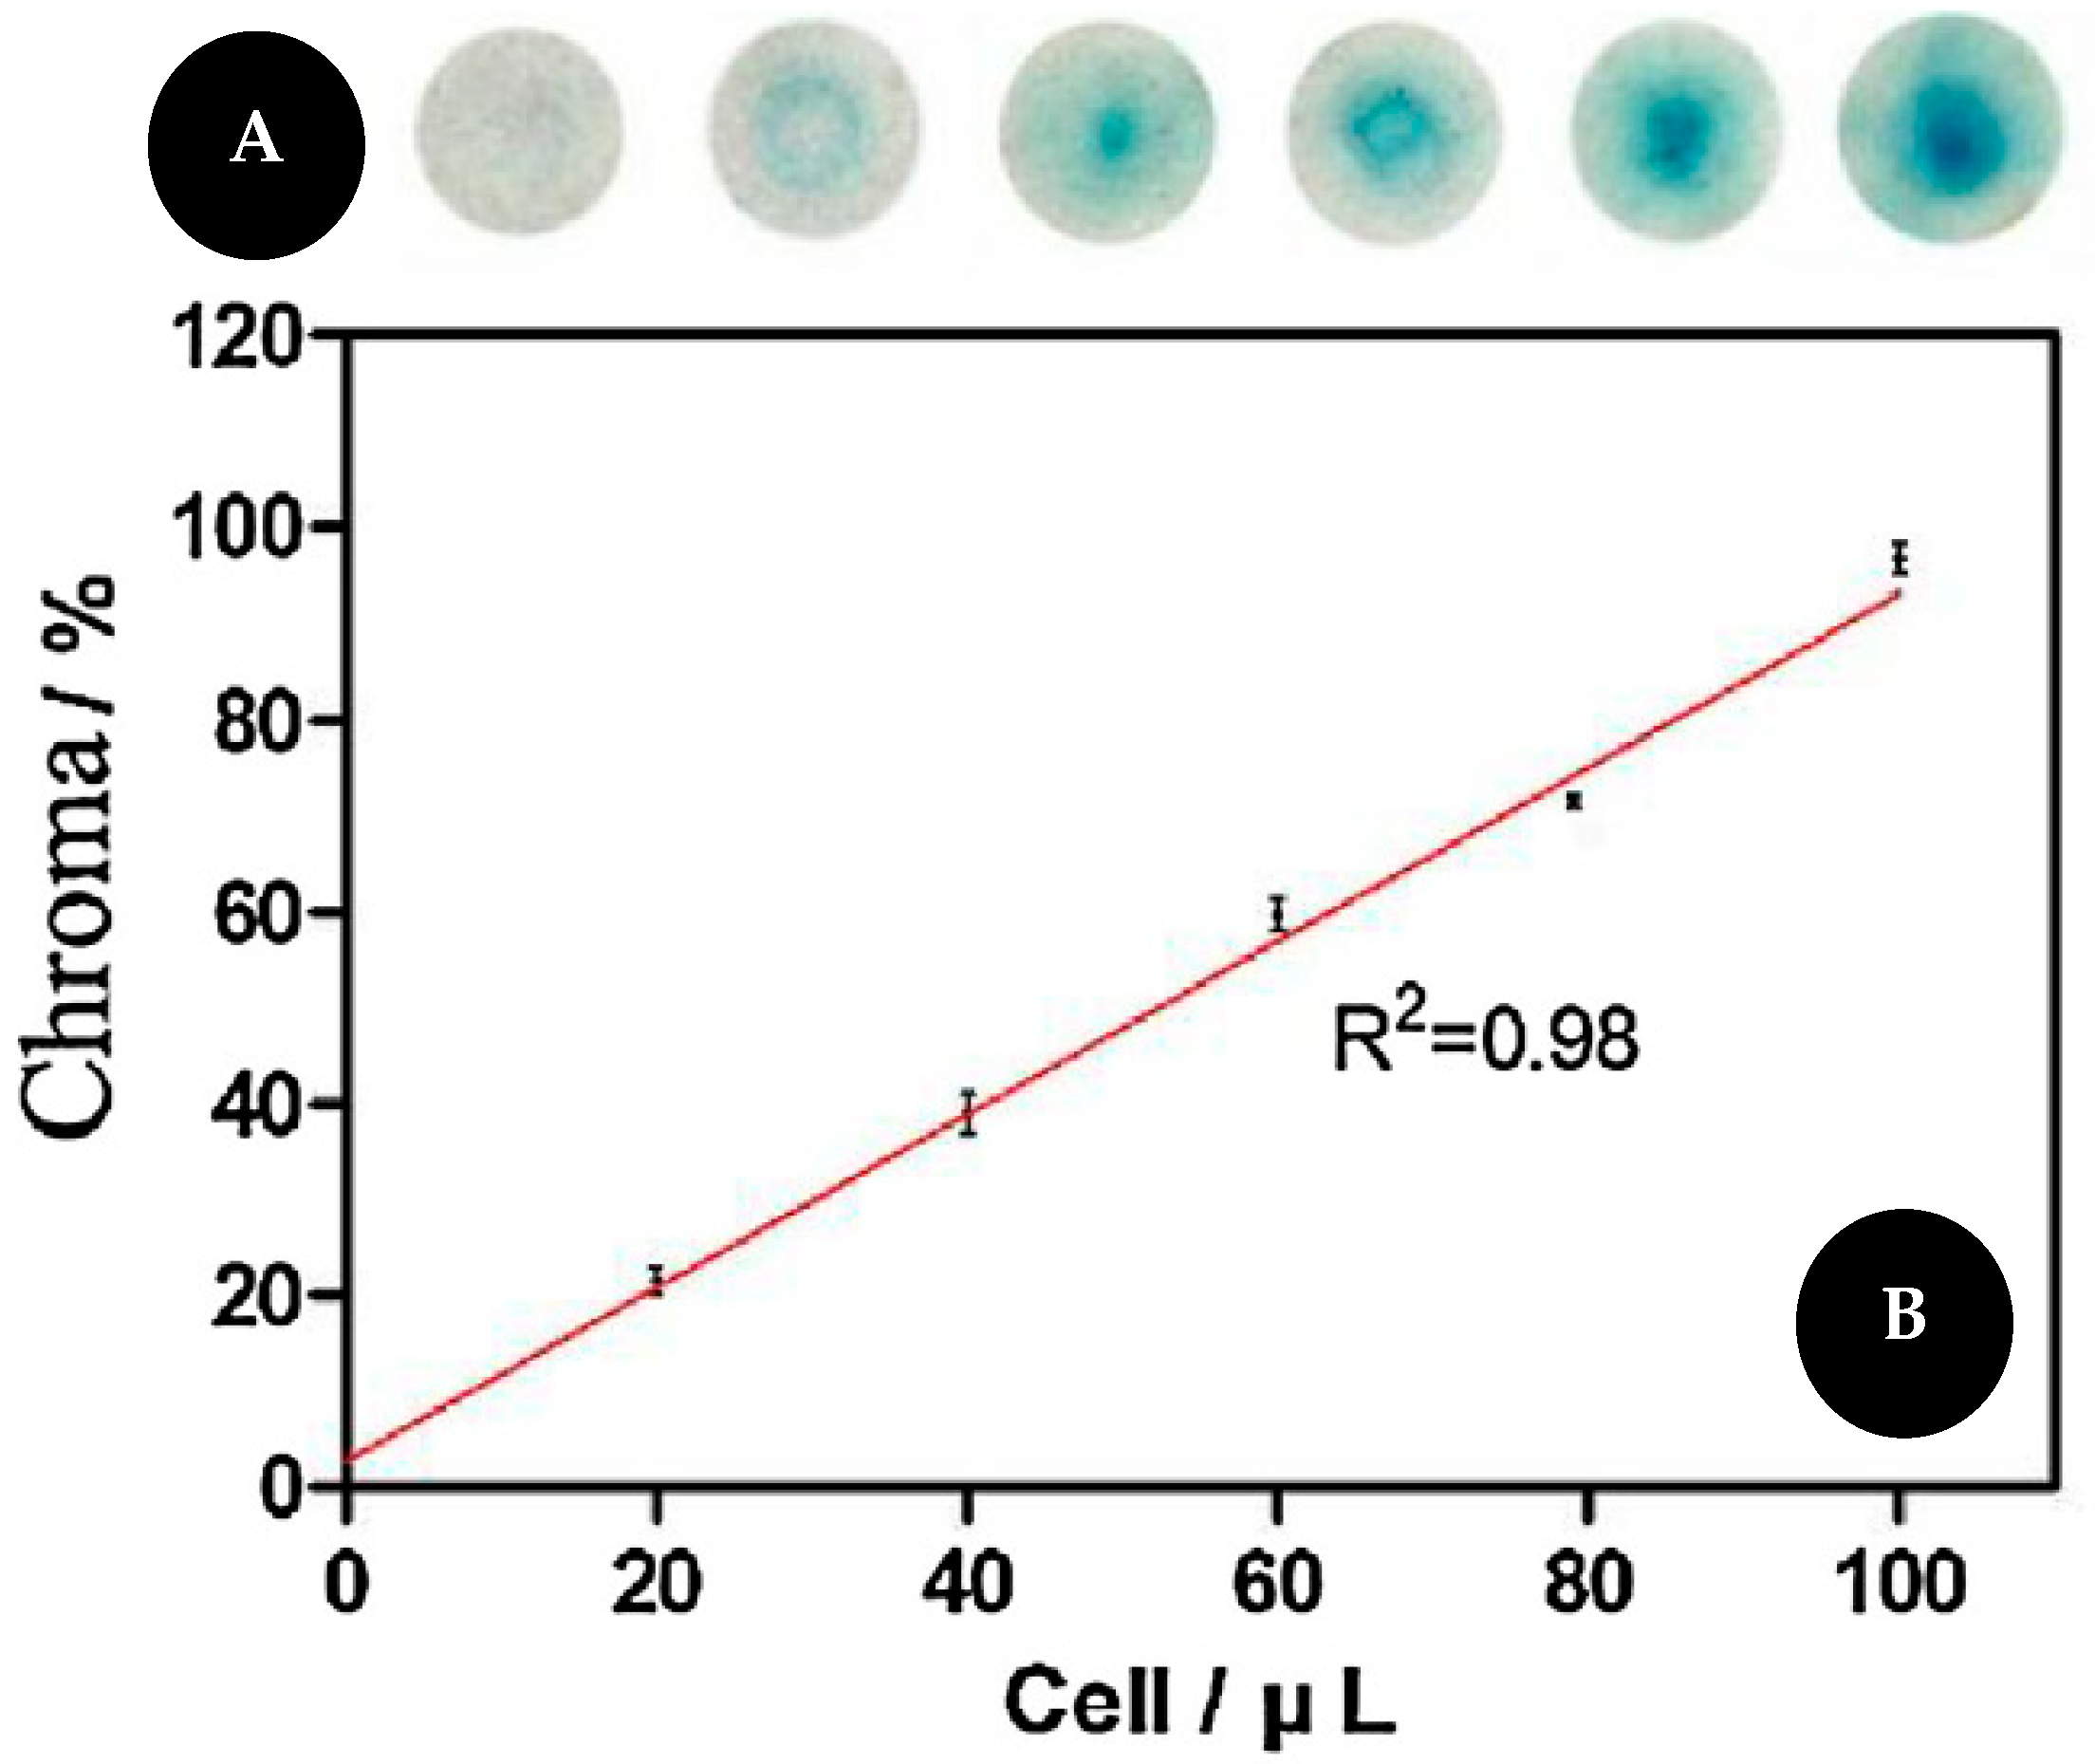
| Enzymes | telomerase | spot test | telomere complementary oligonucleotide | AuNPs + telomerase elongated biotinylated probe | 6 to 25,000 cells | 6 cells | [21] |
| spot test | telomerase substrate oligonucleotide | MB | 0 to 100 cells/μL | 20 cells/μL | [22] | ||
| ALP | µPAD | - | PNPP | 30–500 U/mL | - | [23] | |
| PEAK1 | spot test | Ab | AuNPs + HNB | 1 × 10⁻⁹ g/mL to 1 × 10⁻⁵ g/mL | 1 ng/mL | [24] | |
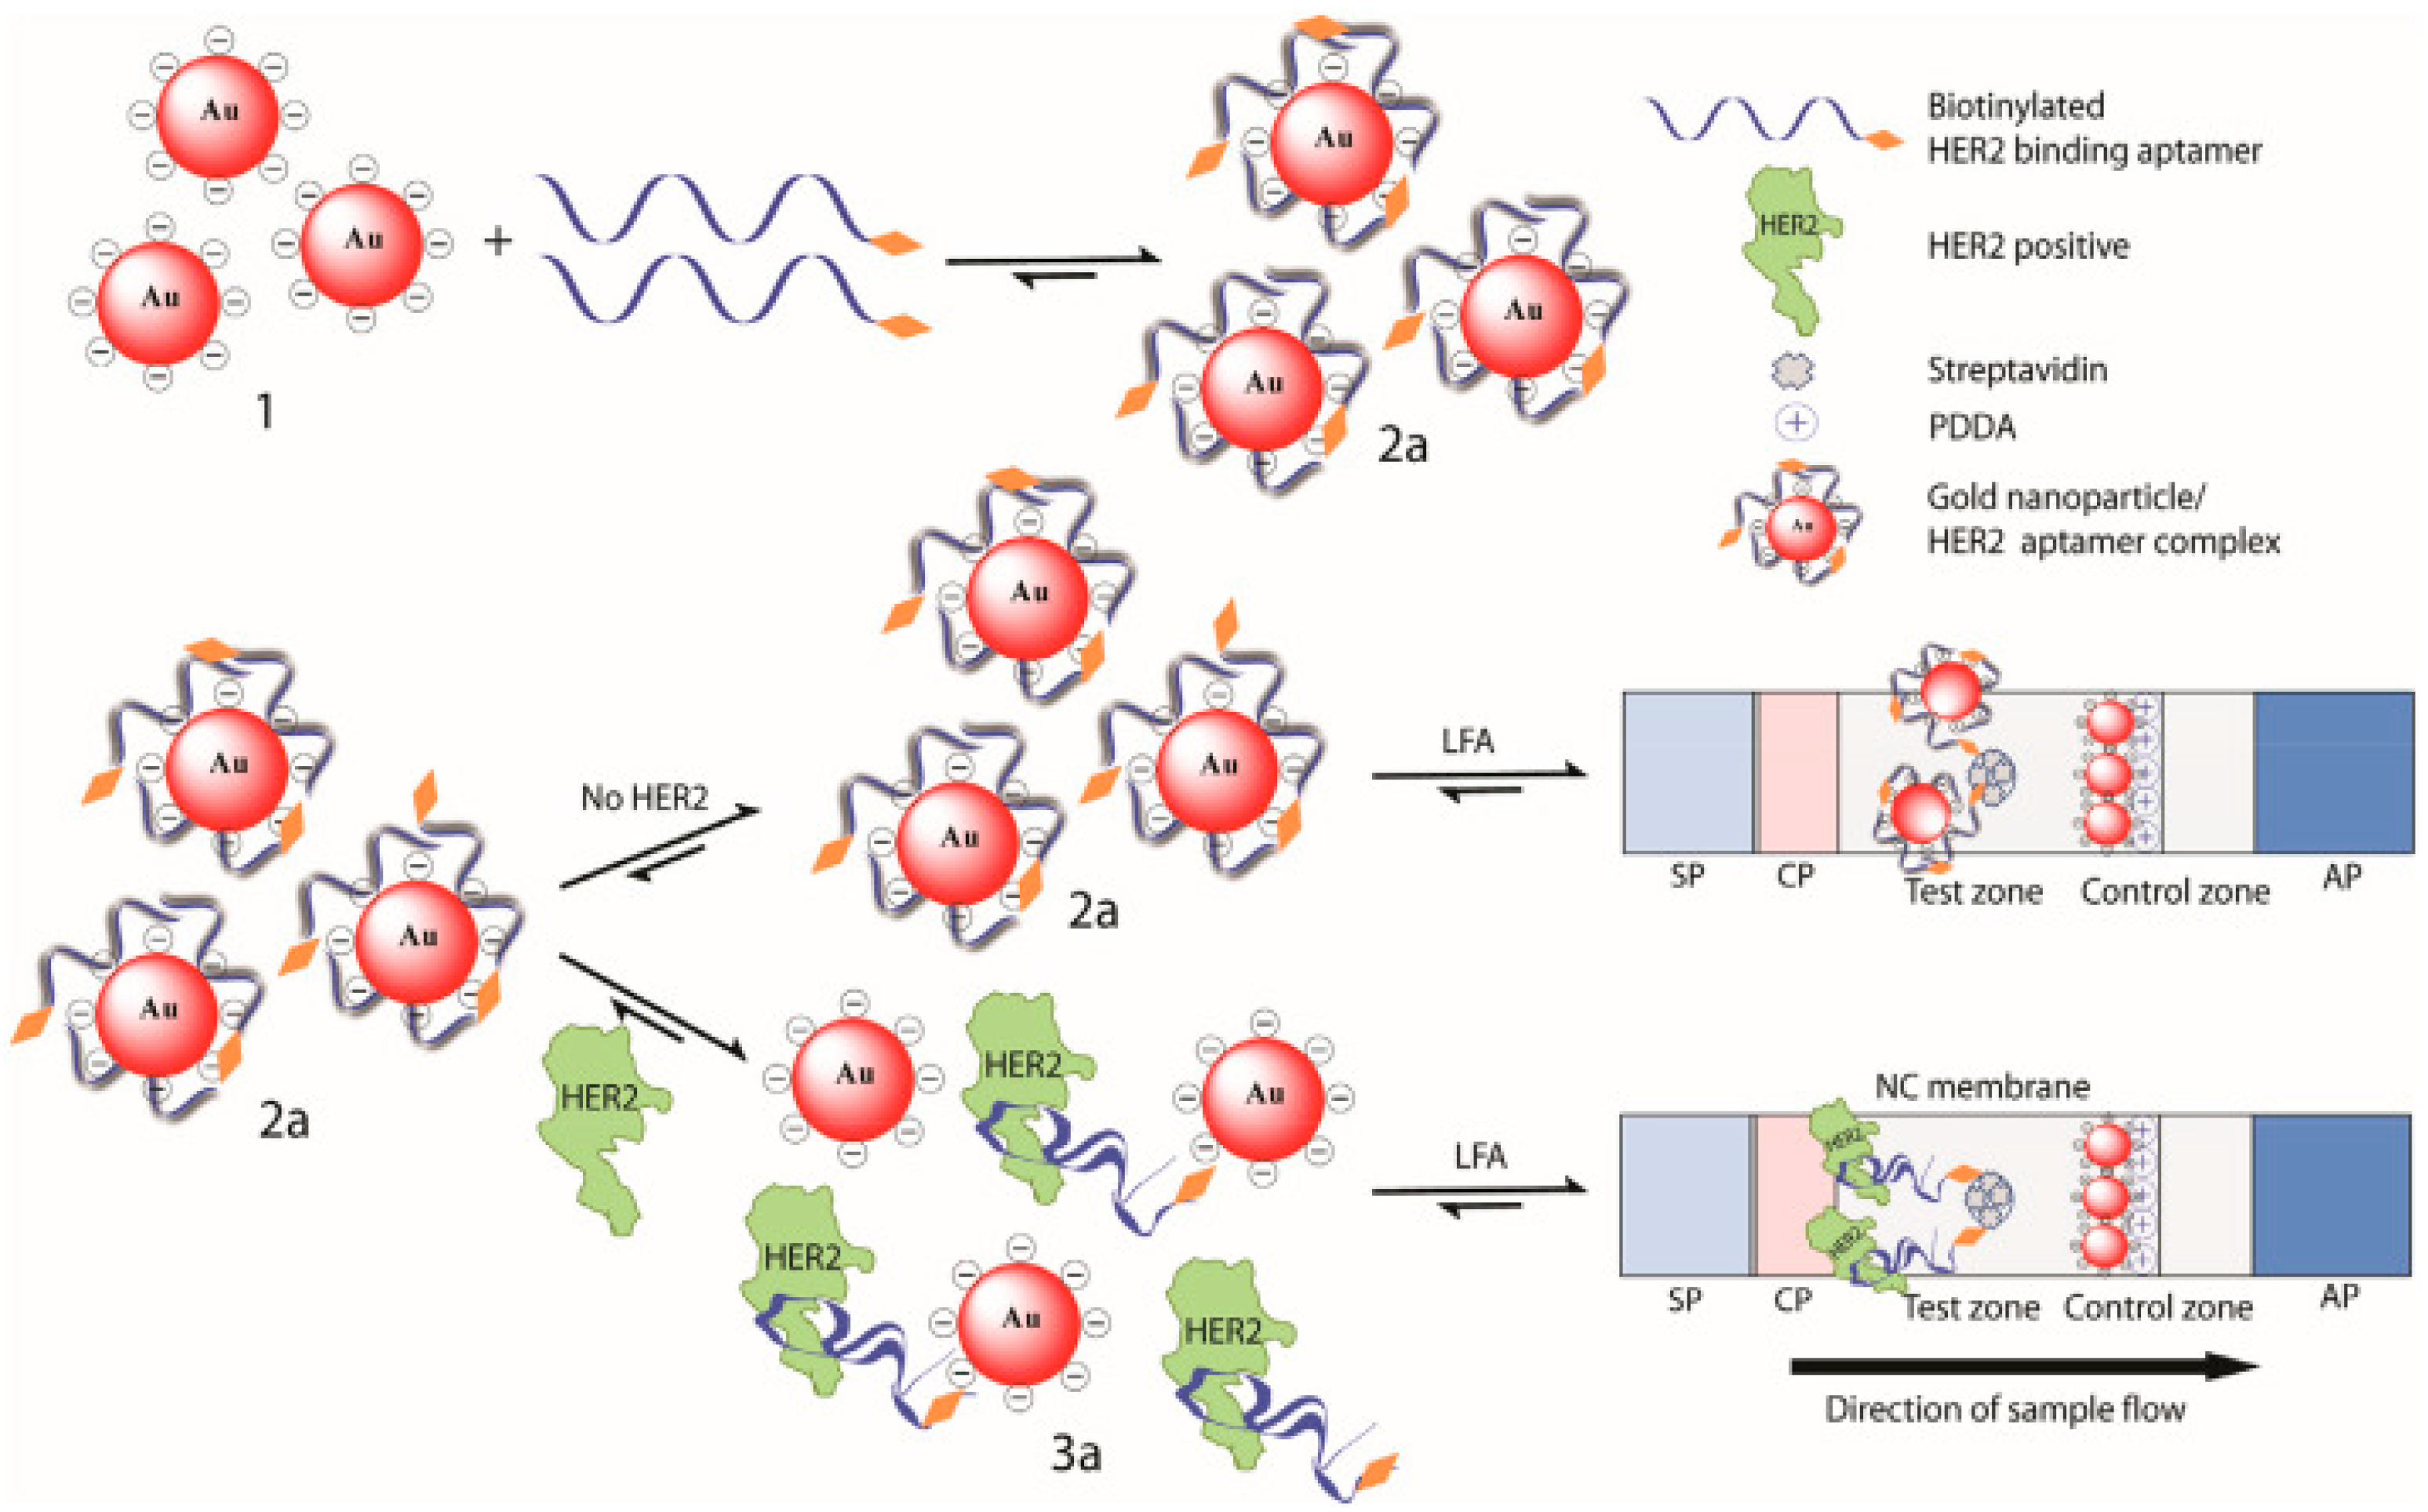
| Growth factors | HER2 | LFA | aptamer | AuNPs + biotin + streptavidin | 0 to 50 nM | 20 nM | [25] |
| Nucleic acids | microRNA-21 | LFA | ssDNA | AuNPs + biotin + streptavidin | 0.1 to 10 nM | 0.073 nM | [26] |
| µPAD | ssDNA | Ag/Pt NCs with peroxidase-like activity + TMB | 10 to 1000 pM | 4.1 pM | [27] | ||
| microRNA-155 | LFA | ssDNA | AuNPs + biotin + streptavidin | is 0.01 to 5 nM | 0.061 nM | [26] | |
| microRNA-210 | LFA | ssDNA | AuNPs + biotin + streptavidin | 0.05 to 10 nM | 0.085 nM | [26] | |
| microRNA-215 | LFA | ssDNA | AuNPs + biotin | 0.075 to 0 nM | 60 pM | [28] | |
| HPV type 16 DNA detection | spot test | acpcPNA | AuNPs | 1 to 1000 nM | 1 nM | [29] | |
| Other molecules | citrate | µPAD | - | Cys-AuNCs with peroxidase-like activity + TMB | 1 μM to 10 mM | 0.4 μM | [30] |
| spot test | - | AgNPs | 100 to 1000 μM | 4.05 nM | [31] | ||
| LPA | LFA | PDA | conformation transition | - | - | [32] | |
| NSCLC-derived exosomes | LFA | aptamer | AuNPs + biotin + streptavidin | - | 6.4 × 10⁹ particles/mL | [33] | |
Publisher’s Note: MDPI stays neutral with regard to jurisdictional claims in published maps and institutional affiliations. |
© 2022 by the authors. Licensee MDPI, Basel, Switzerland. This article is an open access article distributed under the terms and conditions of the Creative Commons Attribution (CC BY) license (https://creativecommons.org/licenses/by/4.0/).
Share and Cite
Carneiro, M.C.C.G.; Rodrigues, L.R.; Moreira, F.T.C.; Sales, M.G.F. Colorimetric Paper-Based Sensors against Cancer Biomarkers. Sensors 2022, 22, 3221. https://doi.org/10.3390/s22093221
Carneiro MCCG, Rodrigues LR, Moreira FTC, Sales MGF. Colorimetric Paper-Based Sensors against Cancer Biomarkers. Sensors. 2022; 22(9):3221. https://doi.org/10.3390/s22093221
Chicago/Turabian StyleCarneiro, Mariana C. C. G., Ligia R. Rodrigues, Felismina T. C. Moreira, and Maria Goreti F. Sales. 2022. "Colorimetric Paper-Based Sensors against Cancer Biomarkers" Sensors 22, no. 9: 3221. https://doi.org/10.3390/s22093221
APA StyleCarneiro, M. C. C. G., Rodrigues, L. R., Moreira, F. T. C., & Sales, M. G. F. (2022). Colorimetric Paper-Based Sensors against Cancer Biomarkers. Sensors, 22(9), 3221. https://doi.org/10.3390/s22093221