
Tiny Vehicle Detection for Mid-to-High Altitude UAV Images Based on Visual Attention and Spatial-Temporal Information


Abstract
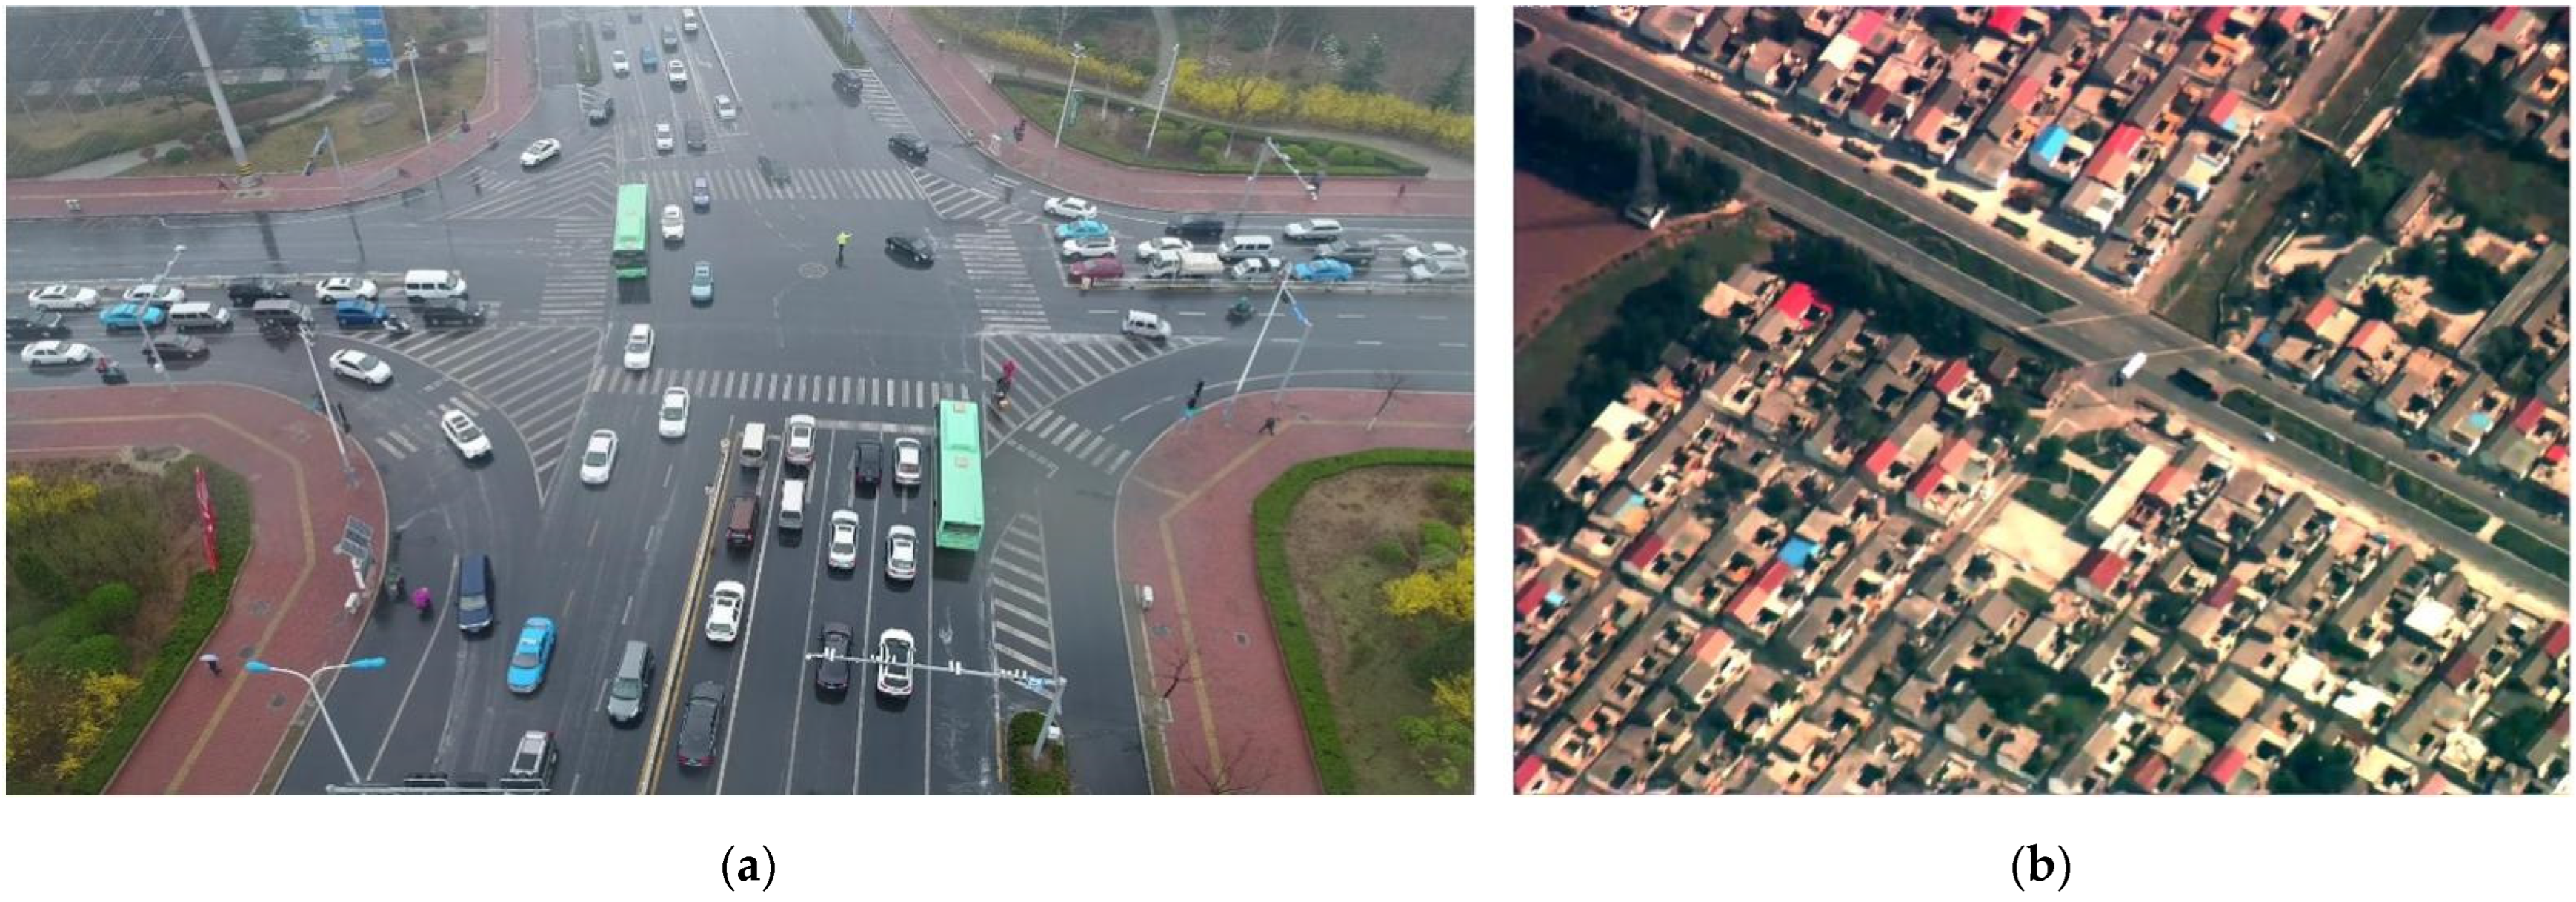
:1. Introduction
- (1)
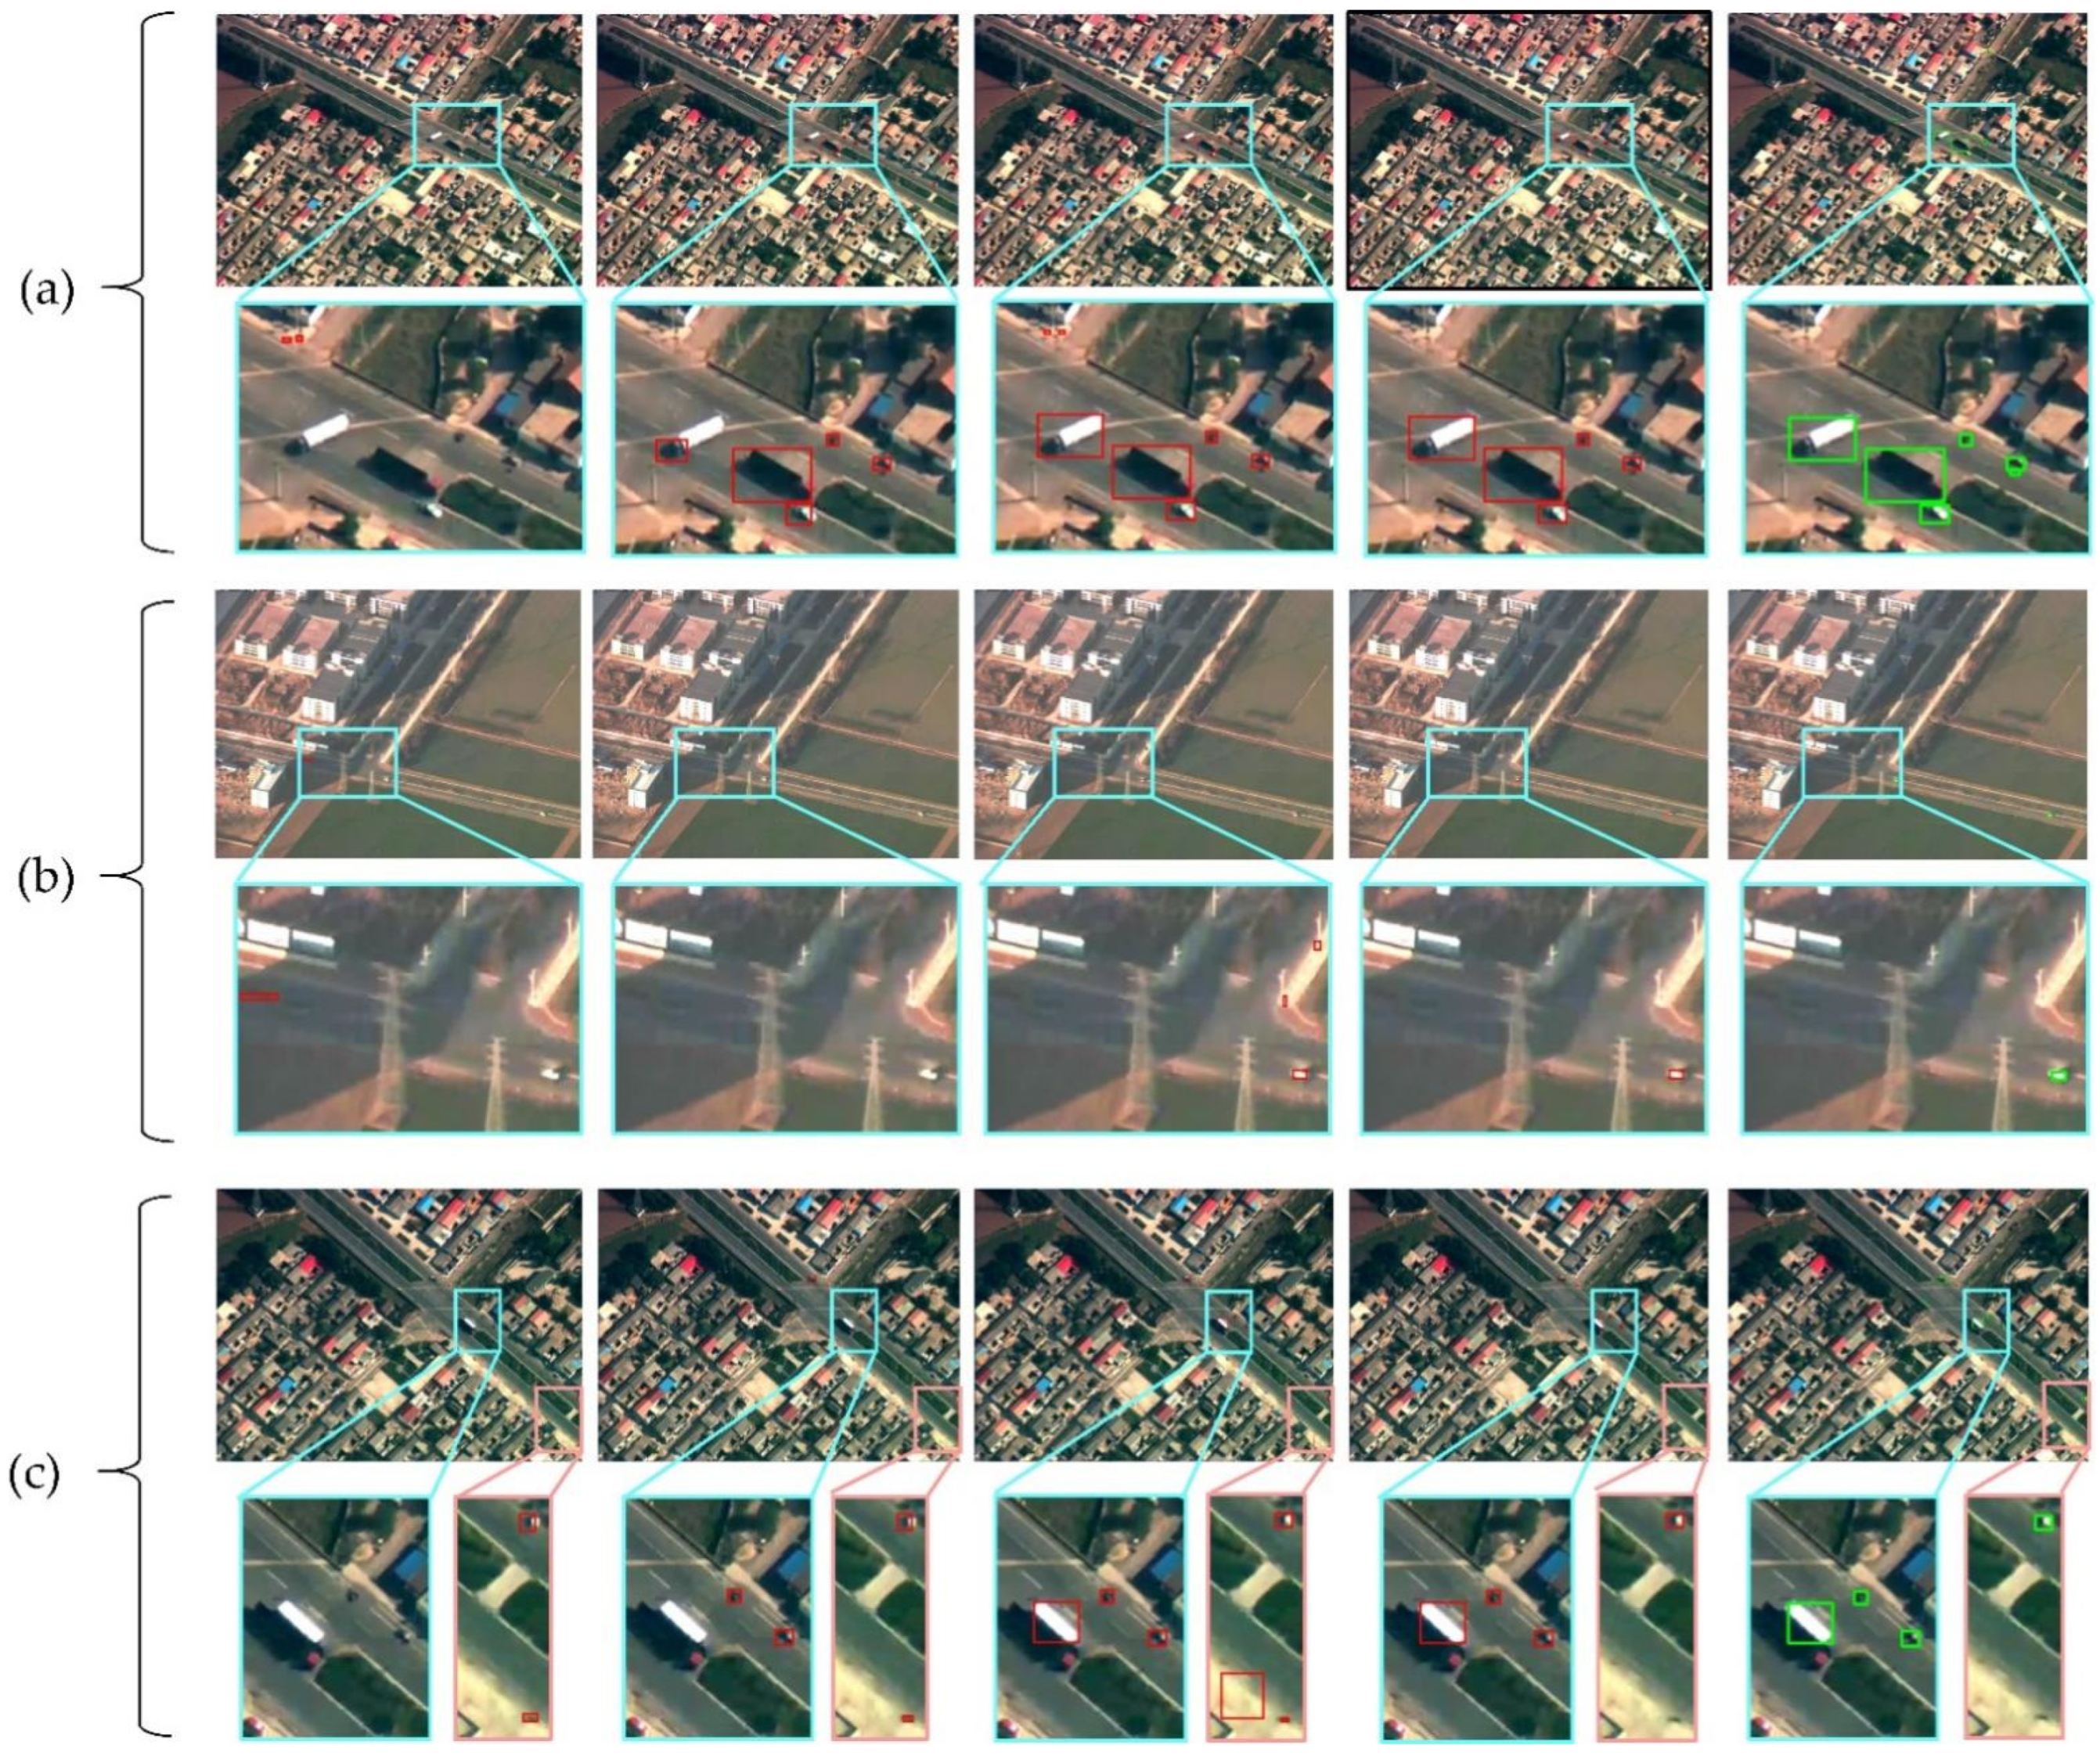
- We propose a multi-stage tiny vehicle detection framework with deep segmentation and traditional detection components to solve the problem that existing traditional methods have difficulty in detecting tiny objects from complex backgrounds.
- (2)
- We improve the RSS algorithm with both visual attention and spatial-temporal information, termed as STRSS, to assist the detection procedure by designing a locally weighted saliency decision, which can remove the false alarm and increase the detection precision.
- (3)
- The proposed method achieves effective detection of tiny vehicles under complex backgrounds with an F1 score of 78.32%. Moreover, our method is not limited by the size of the objects, and comparative experimental results show that it outperforms the advanced DNNs-based method for extremely tiny object detection with pixels smaller than 5 × 5.
2. Related Work
2.1. Single Frame Detection
2.2. Moving Object Detection
2.3. DNNs-Based Small Object Detection
3. Materials and Method
3.1. General Framework
3.2. RSS Algorithm
3.2.1. Regional Stability
- (1)
- Multi-level threshold segmentation
- (2)
- Connected regions clustering
- (a)
- area variation: ;
- (b)
- center distance: ;
- (c)
- fill rate difference:
- (d)
- aspect ratio difference:
- (3)
- Stability region post-verification
3.2.2. Regional Saliency
3.2.3. Integration of Stability and Saliency
3.3. STRSS Based on Visual Attention and Spatial-Temporal Information
3.3.1. Road Segmentation
3.3.2. Visual Stability Region Extraction
- (1)
- White objects processing
- (2)
- Stability region discrimination based on Hu moment
3.3.3. Spatial-Temporal Information Assistance
- (1)
- Candidate region association
- (2)
- Locally weighted saliency decision
4. Experiments and Results
4.1. Data Collection
4.2. Dataset Description
4.3. Experimental Settings
4.3.1. Parameter Settings
4.3.2. Evaluation Metrics
- (1)
- Precision
- (2)
- F1 score
- (3)
- MIoU
4.4. Experimental Results
4.4.1. Evaluation of MTVD Algorithm
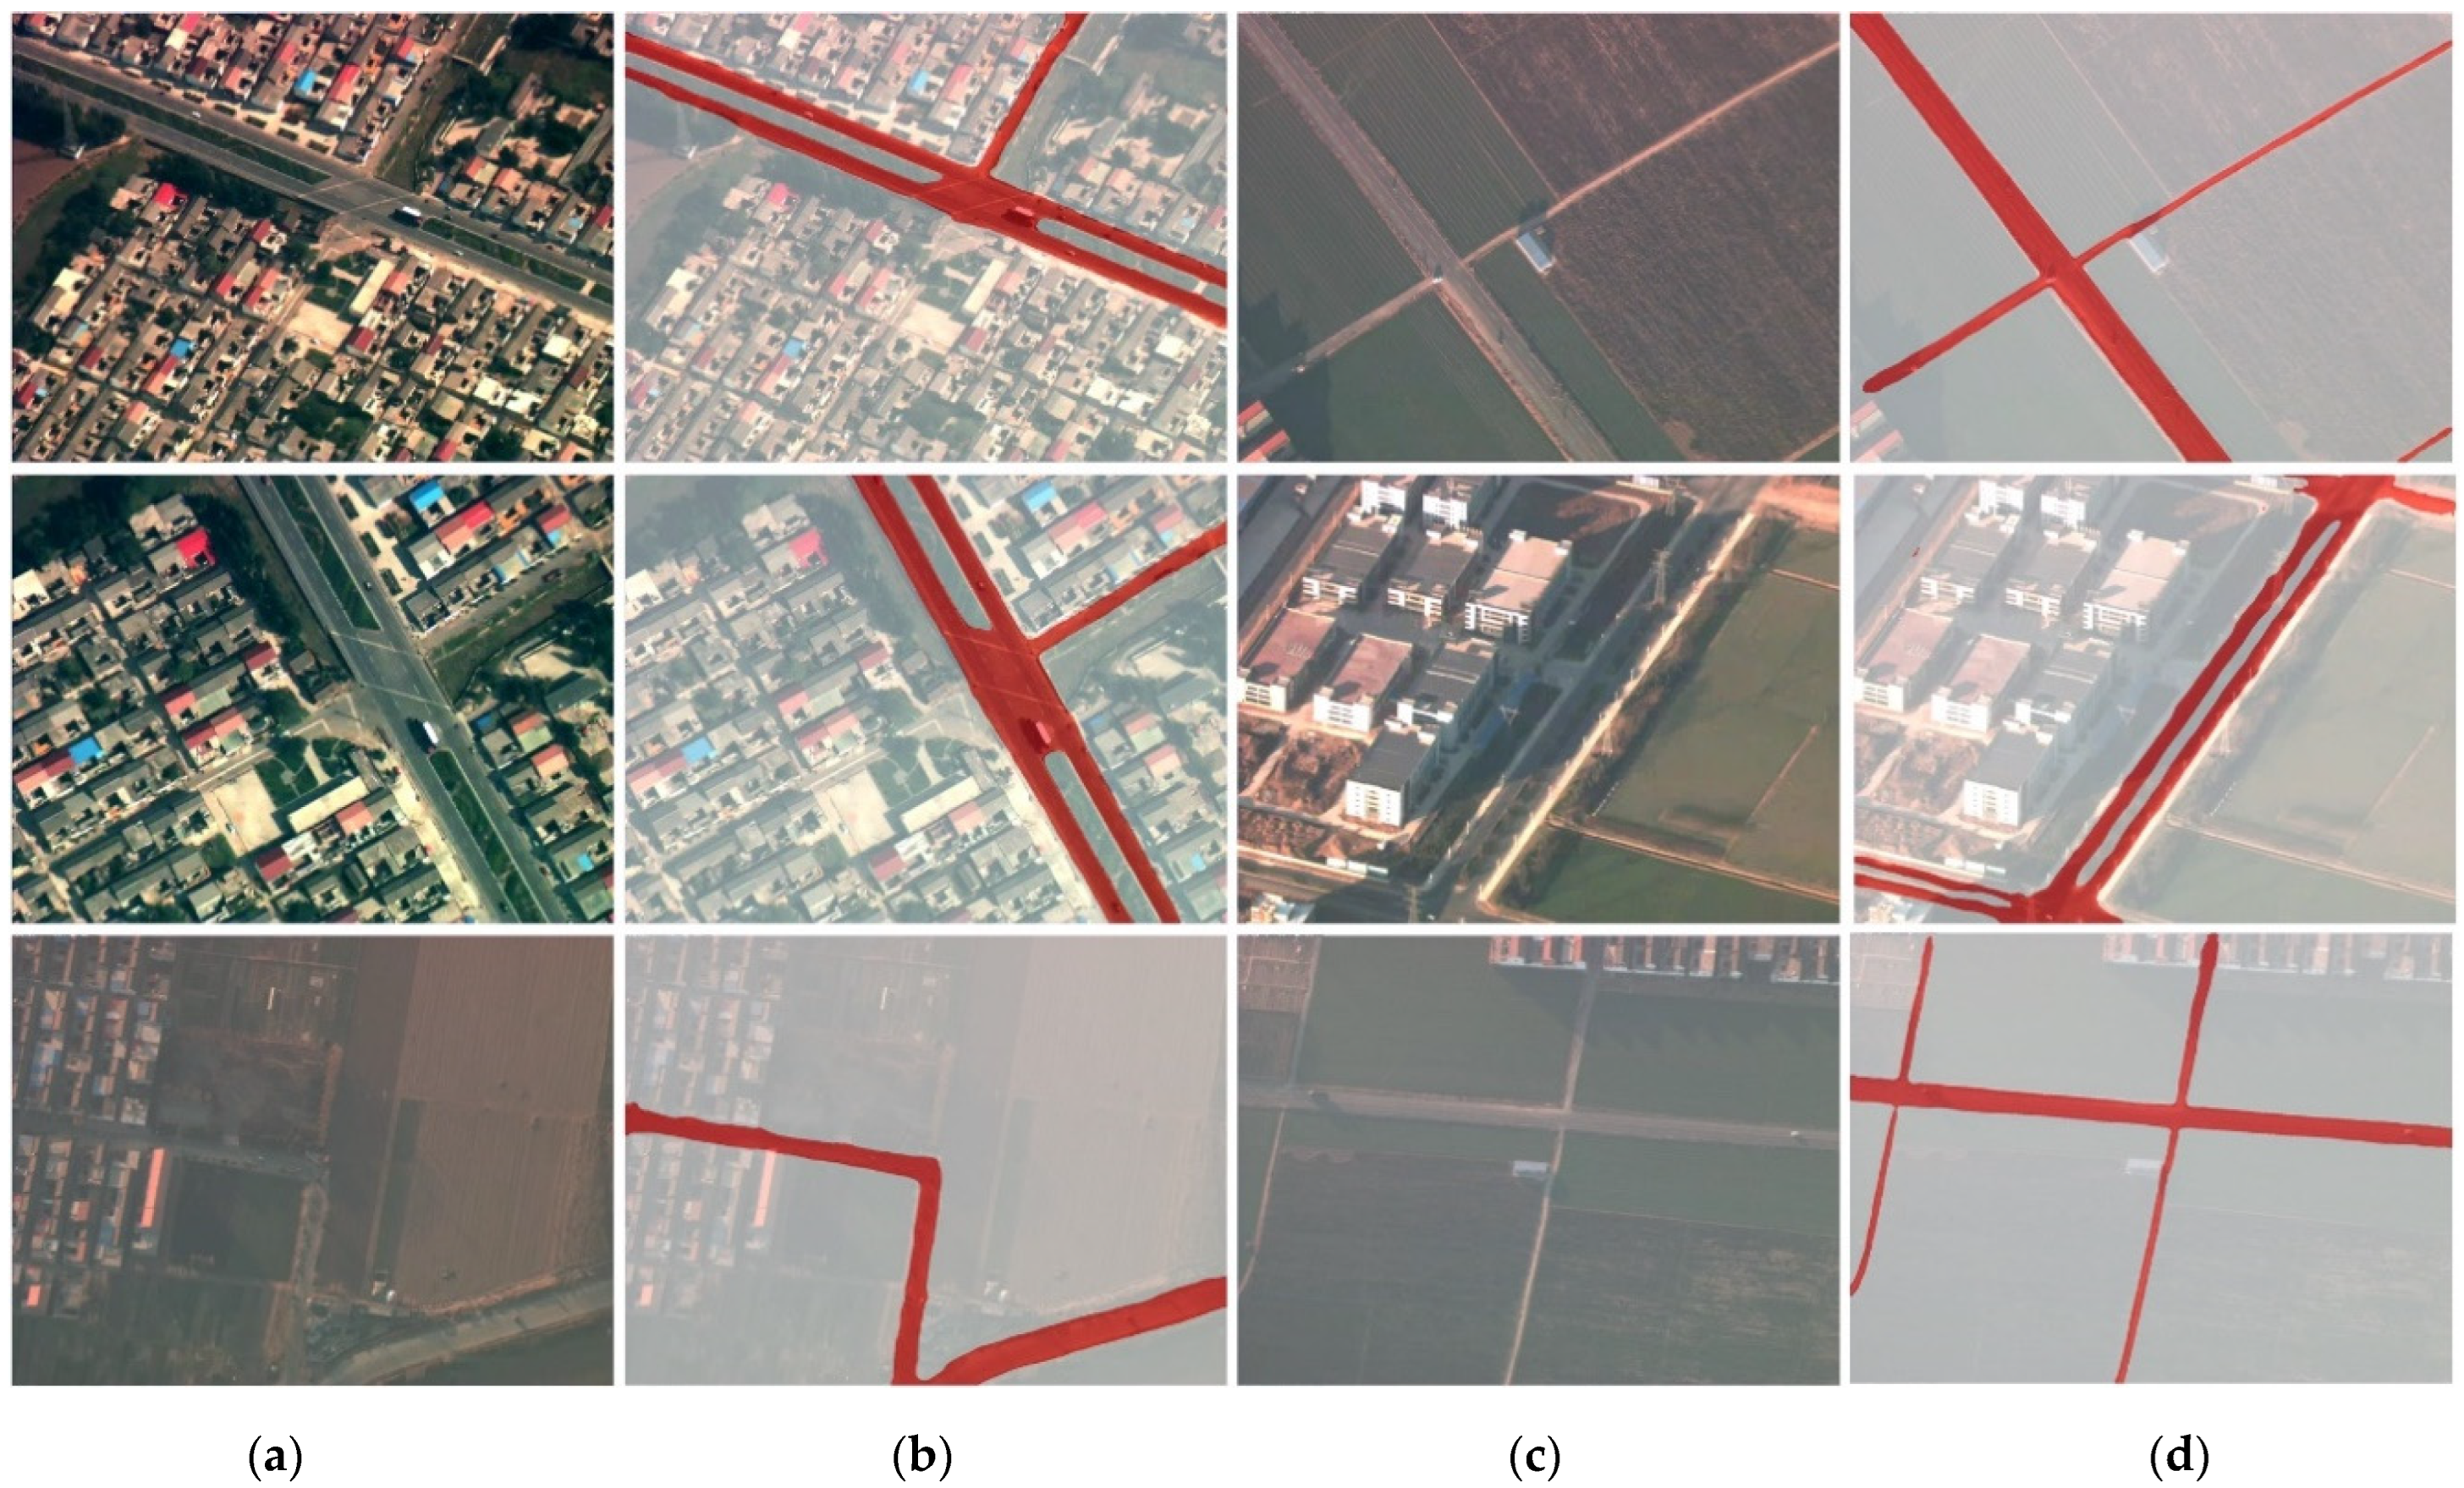
- (1)
- Road segmentation
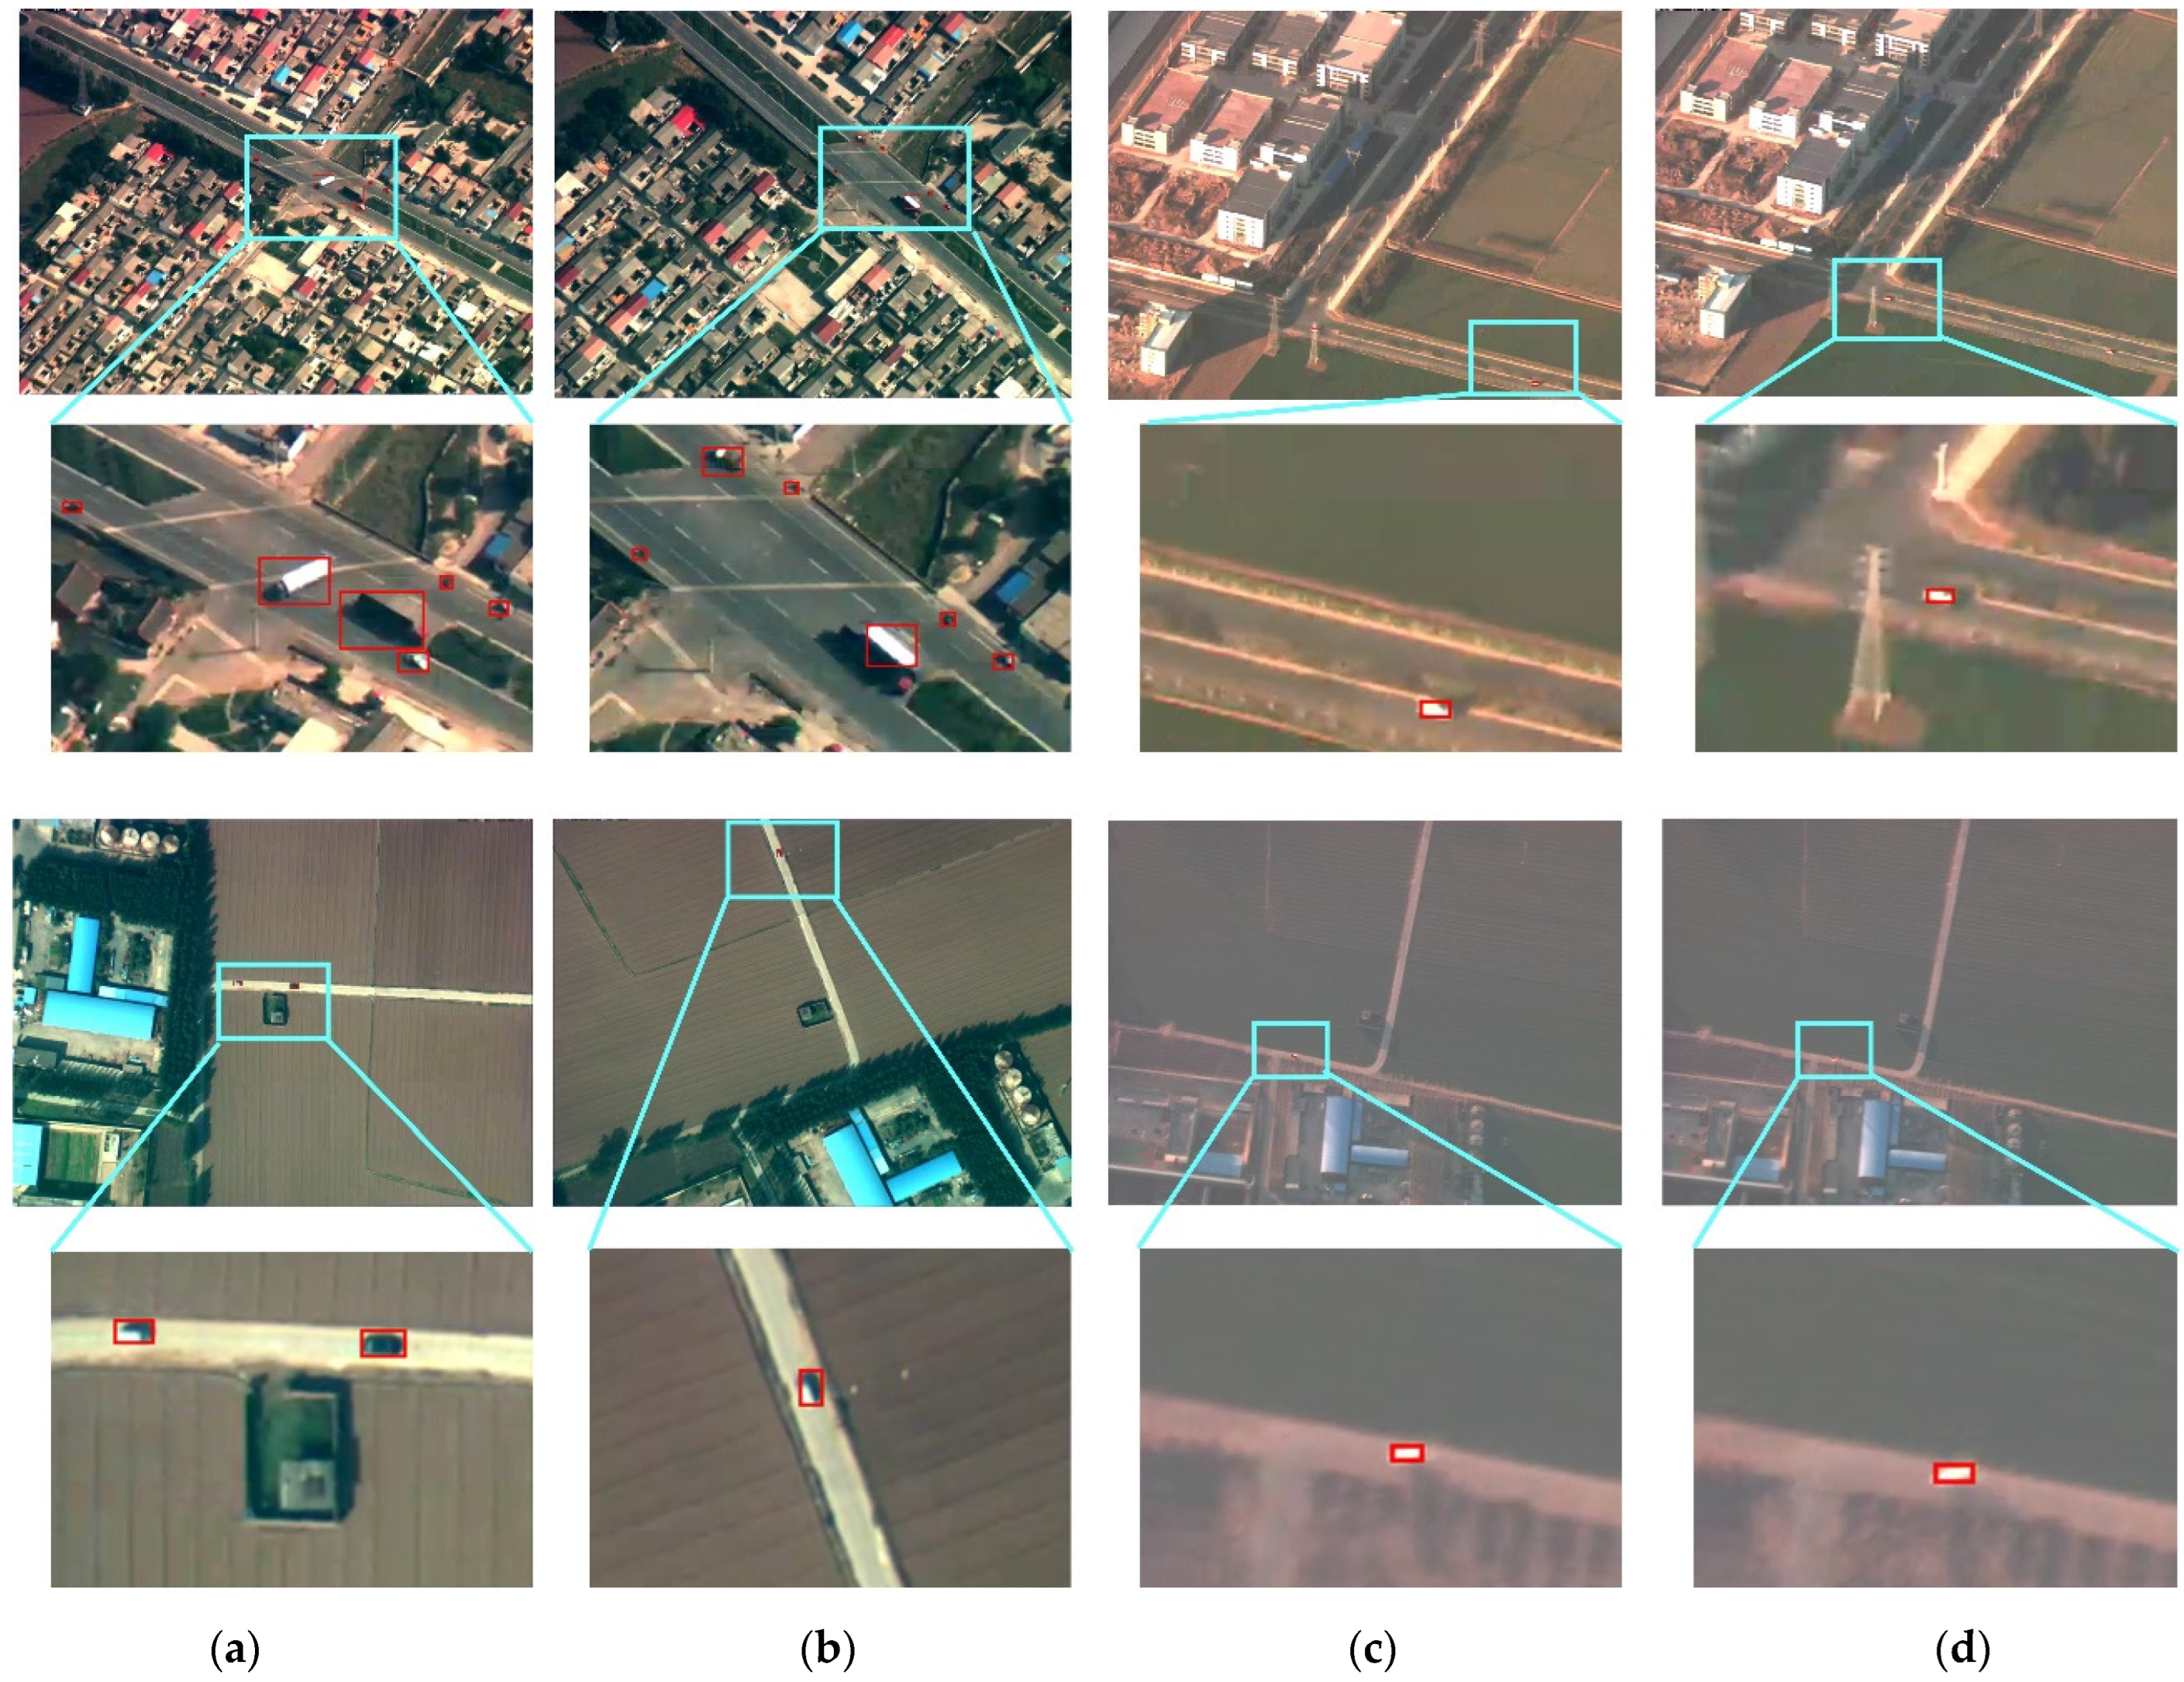
- (2)
- Vehicle detection
4.4.2. Ablation Experiments
4.4.3. Tinier Object Exploration
5. Conclusions
Author Contributions
Funding
Institutional Review Board Statement
Informed Consent Statement
Data Availability Statement
Acknowledgments
Conflicts of Interest
References
- Li, H.; Ding, W.; Cao, X.; Liu, C. Image Registration and Fusion of Visible and Infrared Integrated Camera for Medium-Altitude Unmanned Aerial Vehicle Remote Sensing. Remote Sens. 2017, 9, 441. [Google Scholar] [CrossRef] [Green Version]
- Li, H.; Li, X.; Ding, W.; Huang, Y. Metadata-Assisted Global Motion Estimation for Medium-Altitude Unmanned Aerial Vehicle Video Applications. Remote Sens. 2015, 7, 12606–12634. [Google Scholar] [CrossRef] [Green Version]
- Zhu, P.; Wen, L.; Du, D.; Bian, X.; Hu, Q.; Ling, H. Vision Meets Drones: Past, Present and Future. arXiv 2020, arXiv:2001.06303. [Google Scholar]
- Mueller, M.; Smith, N.; Ghanem, B. A Benchmark and Simulator for UAV Tracking. In Proceedings of the European Conference on Computer Vision (ECCV), Amsterdam, The Netherlands, 8–16 October 2016; pp. 445–461. [Google Scholar]
- Robicquet, A.; Sadeghian, A.; Alahi, A. Learning Social Etiquette: Human Trajectory Understanding In Crowded Scenes. In Proceedings of the European Conference on Computer Vision (ECCV), Amsterdam, The Netherlands, 8–16 October 2016; pp. 549–565. [Google Scholar]
- Barekatain, M.; Martí, M.; Shih, H. Okutama-Action: An Aerial View Video Dataset for Concurrent Human Action Detection. In Proceedings of the 2017 IEEE Conference on Computer Vision and Pattern Recognition Workshops (CVPRW), Honolulu, HI, USA, 21–26 July 2017; pp. 2153–2160. [Google Scholar]
- Du, D.; Qi, Y.; Yu, H.; Yang, Y.; Duan, K.; Li, G.; Zhang, W.; Huang, Q.; Tian, Q. The Unmanned Aerial Vehicle Benchmark: Object Detection and Tracking. In Proceedings of the European Conference on Computer Vision (ECCV), Munich, Germany, 8–14 September 2018; pp. 375–391. [Google Scholar]
- Lin, T.; Maire, M.; Belongie, S. Microsoft COCO: Common Objects in Context. In Proceedings of the European Conference on Computer Vision (ECCV), Zurich, Switzerland, 6–12 September 2014; pp. 740–755. [Google Scholar]
- Zhang, W.; Cong, M.; Wang, L. Algorithms for optical weak small targets detection and tracking: Review. In Proceedings of the International Conference on Neural Networks and Signal Processing, Nanjing, China, 14–17 December 2003; pp. 643–647. [Google Scholar]
- Ozbay, M.; Şahingil, M. A fast and robust automatic object detection algorithm to detect small objects in infrared images. In Proceedings of the 2017 25th Signal Processing and Communications Applications Conference (SIU), Antalya, Turkey, 15–18 May 2017; pp. 1–4. [Google Scholar]
- Yang, Y.; Sun, W. Adaptive Detection of Infrared Small Target Based on Target-Background Separation with Ratio Minimization of Singular Values. In Proceedings of the 2018 4th Annual International Conference on Network and Information Systems for Computers (ICNISC), Wuhan, China, 19–21 April 2018; pp. 144–149. [Google Scholar]
- Bai, X.; Zhou, F.; Jin, T. Enhancement of dim small target through modified top-hat transformation under the condition of heavy clutter. Signal Process. 2010, 90, 1643–1654. [Google Scholar] [CrossRef]
- Chen, Y.; Xin, Y. An Efficient Infrared Small Target Detection Method Based on Visual Contrast Mechanism. IEEE Geosci. Remote Sens. Lett. 2016, 13, 962–966. [Google Scholar] [CrossRef]
- Zhao, J.; Liu, F.; Bo, M. An Algorithm of Dim and Small Target Detection Based on Wavelet Transform and Image Fusion. In Proceedings of the International Symposium on Computational Intelligence and Design (ISCID), Washington, DC, USA, 28–29 October 2012; pp. 43–45. [Google Scholar]
- Duk, V.; Ng, B.; Rosenberg, L. The potential of 2D wavelet transforms for target detection in sea-clutter. In Proceedings of the IEEE National Radar Conference, Arlington, VA, USA, 10–15 May 2015; pp. 901–906. [Google Scholar]
- Kim, S.; Yang, Y.; Lee, J. Small Target Detection Utilizing Robust Methods of the Human Visual System for IRST. J. Infrared Millim. Terahertz Waves 2009, 30, 994–1011. [Google Scholar] [CrossRef]
- Wang, X.; Lv, G.; Xu, L. Infrared dim target detection based on visual attention. Infrared Phys. Technol. 2012, 55, 513–521. [Google Scholar] [CrossRef]
- Achanta, R.; Hemami, S.; Estrada, F. Frequencytuned salient region detection. In Proceedings of the Conference on Computer Vision and Pattern Recognition (CVPR), Miami, FL, USA, 20–25 June 2009; pp. 1597–1604. [Google Scholar]
- Redmon, J.; Farhadi, A. Yolov3: An incremental improvement. arXiv 2018, arXiv:1804.02767. [Google Scholar]
- Lin, T.; Goyal, P.; Girshick, R.; He, K.; Dollar, P. Focal loss for dense object detection. IEEE Trans. Pattern Anal. Mach. Intell. 2017, 42, 318–327. [Google Scholar] [CrossRef] [Green Version]
- Lou, J.; Zhu, W.; Wang, H. Small target detection combining regional stability and saliency in a color image. Multimed. Tools Appl. 2017, 76, 14781–14798. [Google Scholar] [CrossRef]
- Wei, Y.; You, X.; Li, H. Multiscale patch-based contrast measure for small infrared target detection. Pattern Recognit. 2016, 58, 216–226. [Google Scholar] [CrossRef]
- Matas, J.; Chum, O.; Urban, M.; Pajdla, T. Robust wide-baseline stereo from maximally stable extremal regions. Image Vis. Comput. 2004, 22, 761–767. [Google Scholar] [CrossRef]
- Elgammal, A.; Harwood, D.; Davis, L. Non-parametric model for background subtraction. In Proceedings of the European Conference on Computer Vision (ECCV), Dublin, Ireland, 26 June–1 July 2000; Springer: Berlin/Heidelberg, Germany, 2000; pp. 751–767. [Google Scholar]
- Zheng, M.; Wu, Z.; Bakhdavlatov, S. Real-time aerial targets detection algorithm based background subtraction. In Proceedings of the Asia-Pacific Signal and Information Processing Association Annual Summit and Conference, Kaohsiung, Taiwan, 29 October–1 November 2013; pp. 1–6. [Google Scholar]
- Li, W.; Yao, J.; Dong, T. Moving vehicle detection based on an improved interframe difference and a Gaussian model. In Proceedings of the Congress on Image and Signal Processing (CISP), Shenyang, China, 14–16 October 2015; pp. 969–973. [Google Scholar]
- Chen, Y.; Dong, J. Target Detection Based on the Interframe Difference of Block and Graph-Based. In Proceedings of the 2016 9th International Symposium on Computational Intelligence and Design (ISCID), Hangzhou, China, 10–11 December 2016; pp. 467–470. [Google Scholar]
- Hossen, M.; Tuli, S. A surveillance system based on motion detection and motion estimation using optical flow. In Proceedings of the 2016 5th International Conference on Informatics, Electronics and Vision (ICIEV), Dhaka, Bangladesh, 13–14 May 2016; pp. 646–651. [Google Scholar]
- Han, X.; Gao, Y.; Lu, Z. Research on Moving Object Detection Algorithm Based on Improved Three Frame Difference Method and Optical Flow. In Proceedings of the 2015 Fifth International Conference on Instrumentation and Measurement, Computer, Communication and Control (IMCCC), Qinhuangdao, China, 18–20 September 2015; pp. 580–584. [Google Scholar]
- Zhang, F.; Li, C.; Shi, L. Detecting and tracking dim moving point target in IR image sequence. Infrared Phys. Technol. 2005, 46, 323–328. [Google Scholar] [CrossRef]
- Li, X.; Yang, Y.; Sun, Z. Multi-Frame Integration Method for Radar Detection of Weak Moving Target. IEEE Trans. Veh. Technol. 2021, 70, 3609–3624. [Google Scholar] [CrossRef]
- Li, B.; Xu, Z.; Zhang, J. Dim-Small Target Detection Based on Adaptive Pipeline Filtering. Math. Probl. Eng. 2020, 1, 8234349. [Google Scholar] [CrossRef]
- Dong, L.; Wang, B. Robust Infrared Maritime Target Detection Based on Visual Attention and Spatiotemporal Filtering. IEEE Trans. Geosci. Remote Sens. 2017, 55, 3037–3050. [Google Scholar] [CrossRef]
- Wang, B.; Dong, L.; Zhao, M. A small dim infrared maritime target detection algorithm based on local peak detection and pipeline-filtering. In Proceedings of the International Conference on Graphic & Image Processing, Singapore, 23–25 October 2015. [Google Scholar]
- Lin, T.; Dollar, P.; Girshick, R.; He, K.; Hariharan, B.; Belongie, S. Feature pyramid networks for object detection. In Proceedings of the IEEE Conference on Computer Vision and Pattern Recognition (CVPR), Honolulu, HI, USA, 21–26 July 2017; pp. 2117–2125. [Google Scholar]
- Fu, C.; Liu, W.; Rang, A.; Tyagi, A.; Berg, A.C. DSSD: Deconvolutional single shot detector. arXiv 2017, arXiv:1701.06659. [Google Scholar]
- Chen, C.; Liu, M.; Tuzel, O.; Xiao, J. R-CNN for Small Object Detection. In Proceedings of the Asian Conference on Computer Vision, Taipei, Taiwan, 20–24 November 2016; pp. 214–230. [Google Scholar]
- Guang, L.; Wu, Y.; Zhao, J. SCAN: Semantic Context Aware Network for Accurate Small Object Detection. Int. J. Comput. Intell. Syst. 2018, 11, 936–950. [Google Scholar]
- Wang, J.; Chen, K.; Yang, S.; Loy, C.C.; Lin, D. Region Proposal by Guided Anchoring. In Proceedings of the IEEE Conference on Computer Vision and Pattern Recognition (CVPR), Long Beach, CA, USA, 15–20 June 2019; pp. 2960–2969. [Google Scholar]
- Zhang, S.; Zhu, X.; Lei, Z.; Shi, H.; Wang, X.; Li, S.Z. S3fd: Single shot scale-invariant face detector. In Proceedings of the IEEE International Conference on Computer Vision (ICCV), Venice, IT, USA, 22–29 October 2017; pp. 192–201. [Google Scholar]
- Li, W.; Li, H.; Wu, Q.; Chen, X.; Ngan, K.N. Simultaneously Detecting and Counting Dense Vehicles From Drone Images. IEEE Trans. Ind. Electron. 2019, 66, 9651–9662. [Google Scholar] [CrossRef]
- Dai, X.; Chen, Y.; Xiao, B.; Chen, D.; Liu, M.; Yuan, L.; Zhang, L. Dynamic Head: Unifying Object Detection Heads with Attentions. In Proceedings of the IEEE/CVF Conference on Computer Vision and Pattern Recognition, Nashville, TN, USA, 20–25 June 2021. [Google Scholar]
- Ghiasi, G.; Cui, Y.; Srinivas, A.; Qian, R.; Lin, T.-Y.; Cubuk, E.D.; Le, Q.V.; Zoph, B. Simple copy-paste is a strong data augmentation method for instance segmentation. In Proceedings of the IEEE/CVF Conference on Computer Vision and Pattern Recognition, Nashville, TN, USA, 20–25 June 2021. [Google Scholar]
- Bochkovskiy, A.; Wang, C.-Y.; Liao, H.-J.M. YOLOv4: Optimal Speed and Accuracy of Object Detection. arXiv 2020, arXiv:2004.10934. [Google Scholar]
- Zhu, X.; Su, W.; Lu, L.; Li, B.; Wang, X.; Dai, J. Deformable DETR: Deformable Transformers for End-to-End Object Detection. arXiv 2020, arXiv:2010.04159. [Google Scholar]
- Zhu, X.; Lyu, S.; Wang, X.; Zhao, Q. TPH-YOLOv5: Improved YOLOv5 Based on Transformer Prediction Head for Object Detection on Drone-captured Scenarios. In Proceedings of the IEEE/CVF International Conference on Computer Vision Workshops (ICCVW), Montreal, QC, Canada, 11–17 October 2021; pp. 2778–2788. [Google Scholar]
- Perreault, H.; Bilodeaua, G.-A.; Sauniera, N.; Héritier, M. FAVOD: Feature fusion architecture for video object detection. Pattern Recognit. Lett. 2021, 151, 294–301. [Google Scholar] [CrossRef]
- Perreault, H.; Heritier, M.; Gravel, P.; Bilodeau, G.-A.; Saunier, N. RN-VID: A Feature Fusion Architecture for Video Object Detection. In Proceedings of the International Conference on Image Analysis and Recognition, Varzim, Portugal, 24–26 June 2020; Springer: Cham, Switzerland, 2020. [Google Scholar]
- Han, M.; Wang, Y.; Chang, X.; Qiao, Y. Mining Inter-Video Proposal Relations for Video Object Detection. In Proceedings of the European Conference on Computer Vision (ECCV), Glasgow, UK, 23–28 August 2020; pp. 431–446. [Google Scholar]
- Perreault, H.; Bilodeau, G.-A.; Saunier, N.; Heritier, M. Spotnet: Self-attention multi-task network for object detection. In Proceedings of the 2020 17th Conference on Computer and Robot Vision (CRV), Ottawa, ON, Canada, 13–15 May 2020; pp. 230–237. [Google Scholar]
- Otsu, N. A Threshold Selection Method from Gray-Level Histograms. IEEE Trans. Syst. Man Cybern. 2007, 9, 62–66. [Google Scholar] [CrossRef] [Green Version]
- Chen, L.; Zhu, Y.; Papandreou, G. Encoder-Decoder with Atrous Separable Convolution for Semantic Image Segmentation. In Proceedings of the European Conference on Computer Vision (ECCV), Munich, Germany, 8–14 September 2018; pp. 833–851. [Google Scholar]


| Dataset | Road Segmentation Set | Tiny Vehicle Detection Set |
|---|---|---|
| Number of images | 413 | 160 |
| Image size | 1392 × 1040 | 1392 × 1040 |
| Annotated category | road and background | vehicle |
| Number of objects | - | 827 |
| Size of objects | - | 10 × 10–50 × 50 |
| Method | Precision (%) | Recall (%) | F1 Score (%) |
|---|---|---|---|
| RSS | 36.77 | 16.81 | 23.07 |
| ours | 71.26 | 86.94 | 78.32 |
| Newly Added Conditions | Precision (%) | Recall (%) | F1 Score (%) |
|---|---|---|---|
| Baseline | 36.77 | 16.81 | 23.07 |
| Fine-tuning the parameters | 64.10 | 21.16 | 31.82 |
| Modify saliency decision condition | 67.92 | 39.18 | 49.69 |
| Remove second post-verification | 69.55 | 69.04 | 69.30 |
| White objects processing | 63.33 | 89.60 | 74.21 |
| Hu moment discrimination | 68.35 | 83.56 | 75.19 |
| Locally weighted saliency decision | 71.26 | 86.94 | 78.32 |
| Scaling Factor | Size of Usual Objects | Precision (%) | Recall (%) | F1 Score (%) |
|---|---|---|---|---|
| 1 | 10 × 10 | 71.26 | 86.94 | 78.32 |
| 2/3 | 7 × 7 | 70.85 | 80.53 | 75.38 |
| 1/2 | 5 × 5 | 70.91 | 78.11 | 74.34 |
| 1/3 | 3 × 3 | 72.17 | 75.57 | 73.83 |
| Method | Scaling Factor | 1 | 2/3 | 1/2 | 1/3 |
|---|---|---|---|---|---|
| Size of Usual Objects | 10 × 10 | 7 × 7 | 5 × 5 | 3 × 3 | |
| YOLOv5s | F1 score | 83.87 | 83.62 | 72.07 | 69.73 |
| YOLOv5m | F1 score | 85.41 | 83.61 | 71.68 | 70.56 |
| Ours | F1 score | 78.32 | 75.38 | 74.34 | 73.83 |
Publisher’s Note: MDPI stays neutral with regard to jurisdictional claims in published maps and institutional affiliations. |
© 2022 by the authors. Licensee MDPI, Basel, Switzerland. This article is an open access article distributed under the terms and conditions of the Creative Commons Attribution (CC BY) license (https://creativecommons.org/licenses/by/4.0/).
Share and Cite
Yu, R.; Li, H.; Jiang, Y.; Zhang, B.; Wang, Y. Tiny Vehicle Detection for Mid-to-High Altitude UAV Images Based on Visual Attention and Spatial-Temporal Information. Sensors 2022, 22, 2354. https://doi.org/10.3390/s22062354
Yu R, Li H, Jiang Y, Zhang B, Wang Y. Tiny Vehicle Detection for Mid-to-High Altitude UAV Images Based on Visual Attention and Spatial-Temporal Information. Sensors. 2022; 22(6):2354. https://doi.org/10.3390/s22062354
Chicago/Turabian StyleYu, Ruonan, Hongguang Li, Yalong Jiang, Baochang Zhang, and Yufeng Wang. 2022. "Tiny Vehicle Detection for Mid-to-High Altitude UAV Images Based on Visual Attention and Spatial-Temporal Information" Sensors 22, no. 6: 2354. https://doi.org/10.3390/s22062354
APA StyleYu, R., Li, H., Jiang, Y., Zhang, B., & Wang, Y. (2022). Tiny Vehicle Detection for Mid-to-High Altitude UAV Images Based on Visual Attention and Spatial-Temporal Information. Sensors, 22(6), 2354. https://doi.org/10.3390/s22062354