
State of the Art Techniques for Water Quality Monitoring Systems for Fish Ponds Using IoT and Underwater Sensors: A Review

 ,
, 

Abstract
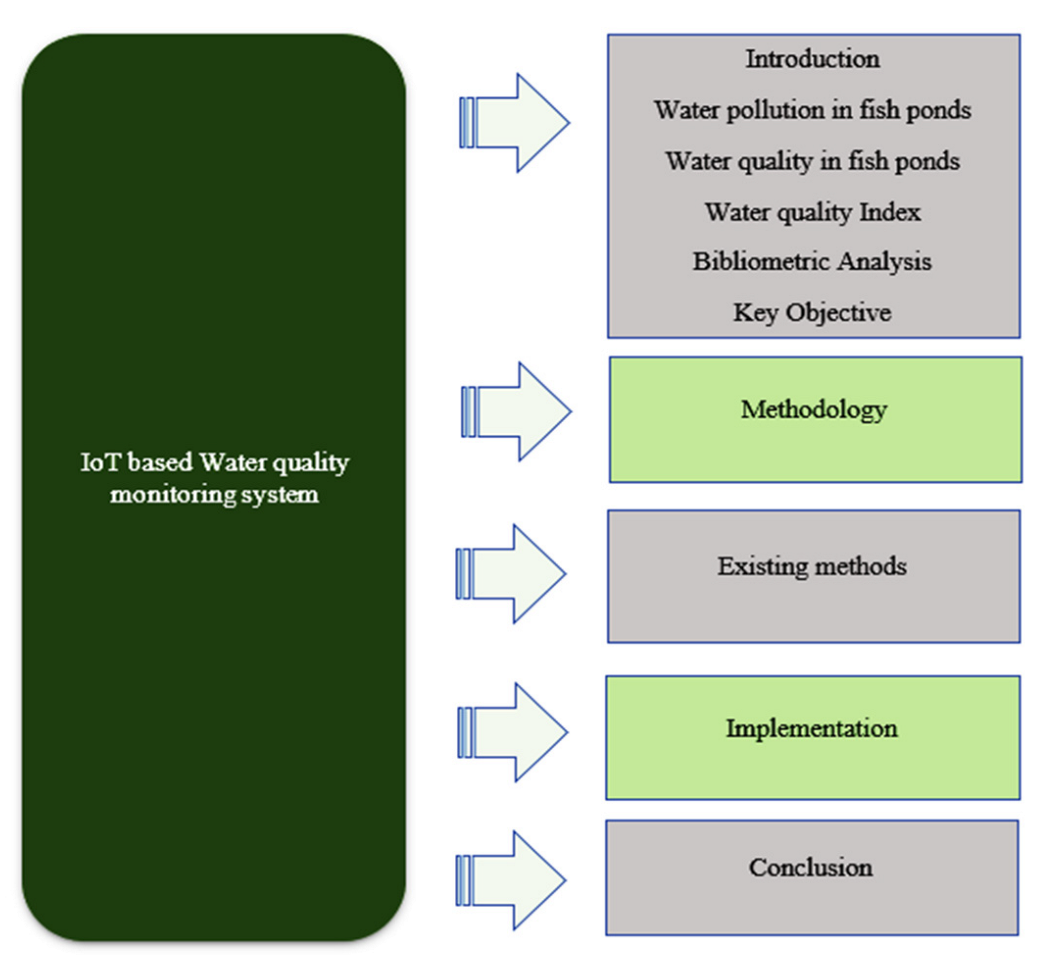
1. Introduction
1.1. Water Pollution in the Fish Pond
1.2. Safe Water Quality Parameters
1.3. Water Quality in a Fish Pond
1.4. Water Quality Index (WQI)
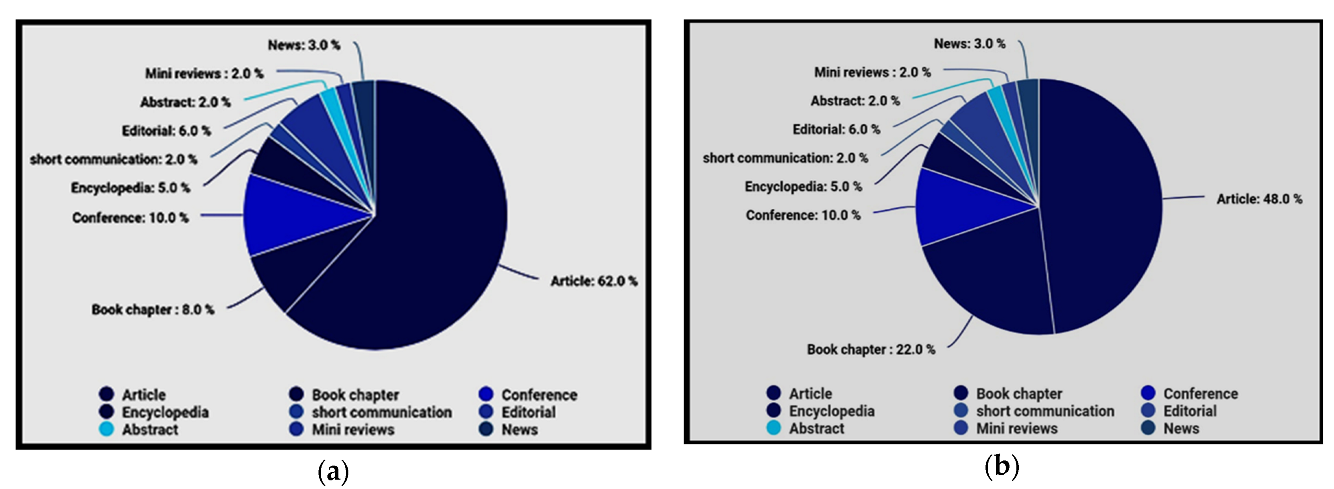
1.5. Bibliometric Analysis
1.6. Key Highlights
- Reviewing the latest papers proposed by various researchers concerning this area for the past decade (2011–2020).
- Depicting the significance of IoT usage in Water Quality Monitoring Systems (WQMS).
- Quantitative examination through various measurements showing the viability and decency of ongoing plans.
- Mostly helpful for fish pond analysis as these systems will check quality and safeguard living beings inside the water.
2. Methodology
3. Existing Methods
4. Implementation
4.1. Traditional WQMS vs. IoT Based WQMS
4.2. What Is New in This Article?
4.3. Futuristic Way to Multidisciplinary Research
4.4. Bibliometric Inferences
4.5. Limitations & Future Enhancements
Author Contributions
Funding
Institutional Review Board Statement
Informed Consent Statement
Data Availability Statement
Conflicts of Interest
Abbreviations
| AI | Artificial Intelligence |
| ML | Machine Learning |
| DL | Deep Learning |
| SVM | Support Vector Machine |
| WQMS | Water Quality Monitoring System |
| WSN | Wireless Sensor Networks |
| IoT | Internet of Things |
| DO | Dissolved Oxygen |
| CO2 | Carbon Dioxide |
| TC | Total Coliform |
| WQI | Water Quality Index |
| FC | Fecal Coliform |
| TDS | Total Dissolved Solids |
| TSS | Total Suspended Solids |
| TS | Total Solids |
| TH | Total Hardness |
| EC | Electrical conductivity |
| CL | Chloride |
| T | Temperature |
| pH | Potential of hydrogen |
| ORP | Oxidation-Reduction Potential |
| T-CL | Total Chlorine |
| F-CL | Free chlorine |
| GPRS | General Packet Radio Service |
| GIS | Geographic Information System |
| MCU | Microcontroller Unit |
| PC | Personal Computer |
| WQM | Water Quality Monitoring |
| WI-FI | Wireless Fidelity |
References
- Salim, T.I.; Alam, H.S.; Pratama, R.P.; Anto, I.A.F.; Munandar, A. Portable and online water quality monitoring system using wireless sensor network. In Proceedings of the 2nd International Conference IEEE ICACOMIT 2017, Jakarta, Indonesia, 23–24 October 2017. [Google Scholar]
- Arjun, K.; Latha, C.A. Detection of Water Level, Quality and Leakage using Raspberry Pi with Internet of Things. Int. Res. J. Eng. Technol. (IRJET) 2017, 4, 2875–2880. [Google Scholar]
- Sajith, S.; Nithya, V. Automated Water Usage Monitoring System. In Proceedings of the IEEE International Conference on Communication and Signal Processing, Melmaruvathur, India, 6–8 April 2016. [Google Scholar]
- Yang, S.H.; Chen, X.; Chen, X.; Yang, L.; Chao, B.; Cao, J. A case study of Internet of things: A wireless household water consumption monitoring system. In Proceedings of the IEEE 2nd World Forum on Internet of Things (WF-IoT), Milan, Italy, 14–16 December 2015. [Google Scholar]
- Lambrou, T.P.; Anastasiou, C.C.; Panayiotou, C.G.; Polycarpou, M.M. A Low-Cost Sensor Network for Real-Time Monitoring and Contamination Detection in Drinking Water Distribution Systems. IEEE Sens. J. 2014, 14, 2765–2772. [Google Scholar] [CrossRef]
- Water Pollution Facts, Types, Causes and Effects of Water Pollution|NRDC. Available online: https://www.nrdc.org/stories/water-pollution-everything-you-need-know (accessed on 19 May 2021).
- Winfield, J.; Gerdeaux, D. Fisheries in the densely populated landscape of Western Europe. Freshw. Fish. Ecol. 2016, 181–190. [Google Scholar]
- Gregor, J. Arsenic removal during conventional aluminum based drinking water treatment. Water Res. 2001, 35, 1659–1664. [Google Scholar] [CrossRef]
- Garcia, M.; Beıcares, E. Bacterial removal in three pilot scale waste water treatment systems for rural areas. Water Sci. Technol. 1997, 35, 197–200. [Google Scholar] [CrossRef][Green Version]
- Burhanettin, F.; Alper, N.; Ergun, Y.; Bulent, K. The performance of pumice as a filter bed material under rapid filtration conditions. Filtr. Sep. 2003, 40, 41–47. [Google Scholar]
- Cho, B.Y. Iron removal using aerated granular filter. Process Biochem. 2005, 40, 3314–3320. [Google Scholar] [CrossRef]
- Annie, R.; Pierre, S.; Julia, B.; Marie, R.; de-Roubin, P.L. Detection and enumeration of coliforms in drinking water: Current methods and emerging approaches. J. Microbiol. Methods 2002, 49, 31–54. [Google Scholar]
- Salamon, H.; Behr, M.A.; Rhee, J.T.; Small, P.M. Genetic distances for the study of infectious disease epidemiology. Am. J. Epidemiol. 2000, 151, 324–334. [Google Scholar] [CrossRef][Green Version]
- Carranzo, I.V. Standard Methods for Examination of water and wastewater. Estim. Bact. Density 2005, 21, 9221. [Google Scholar]
- Witte, W. Ecological impact of antibiotic use in animals on different complex micro flora: Environment. Int. J. Anti. Microb. Agents 2000, 14, 321–325. [Google Scholar] [CrossRef]
- Asim, K.; Robert, J.; Joseph, D.; Lawrence, H.; Ronald, M. Detection of coliform bacteria in water by polymerase chain reaction and gene probes. Environ. Micro-Biol. 1990, 56, 307–314. [Google Scholar]
- Asim, K.; Shawn, C.; McCarty, R. Detection of coliform bacteria and Escherichia coli by multiplex polymerase chain reaction: Comparison with defined substrate and plating methods for water quality monitoring. Environ. Micro-Biol. 1991, 57, 2429–2432. [Google Scholar]
- Berg, J.; Fiksdal, L. Rapid detection of total and fecal coliforms in water byenzymatic hydrolysis of 4-methylumbelliferone-beta-dgalactoside. Environ. Microbiol. 1988, 54, 2118–2122. [Google Scholar] [CrossRef] [PubMed]
- Hossain, B. Cyanobacterial Abundance and Bloom Dynamics on Two Urban waste feed Fish Pond of Bangladesh. J. Subtrop. Agric. Res. Dev. 2009, 7, 645–652. [Google Scholar]
- Schindler, D.W. Effects of Acid Rain on Freshwater Ecosystems. Science 1988, 239, 149–157. [Google Scholar] [CrossRef]
- Holopainen, J.; Oikari, A. Ecophysiological Effects of temporary Acidification on Carassius carassius (L.). Ann. Zool. Finnici. 1992, 29, 29–38. [Google Scholar]
- Michael, J.; Matthew, D.; Steven, M. Impacts of Endothall Applications on Largemouth Bass Spawning Behavior and Reproductive Success. N. Am. J. Fish. Manag. 2008, 28, 1812–1817. [Google Scholar]
- Annett, C.A. Hunting behavior of Florida largemouth bass, Micropterus salmonids florid-anus, in a channelized river. Environ. Biol. Fishes 1998, 53, 75–87. [Google Scholar] [CrossRef]
- Engel, S. Eurasian water milfoil as a fishery management tool. Fisheries 1995, 20, 20–26. [Google Scholar] [CrossRef]
- Wilde, G.E.; Riechers, R.K.; Johnson, J. Angler attitudes toward control of freshwater vegetation. J. Aquat. Plant Manag. 1992, 30, 77–79. [Google Scholar]
- Clarke, W.G. Ground fish exploitation rates based on life history parameters. Can. J. Fish Aquat. Sci. 1991, 48, 734–750. [Google Scholar] [CrossRef]
- Ahmad, M.K.; Islam, S.; Rahman, S.; Haque, M.R.; Islam, M.M. Heavy metals in water, sediment and some fishes of Buriganga River, Bangladesh. Int. J. Environ. Res. 2010, 4, 321–332. [Google Scholar]
- Aboul-Ezz, A.S.; Abdel-Razek, S.E. Heavy metal accumulation in the Tilapia nilotica L. and in the waters of Lake Manzalah. Egypt. J. Appl. Sci. 1991, 6, 37–52. [Google Scholar]
- Waqar, A. Levels of selected heavy metals in tuna fish. Arab. J. Sci. Eng. 2006, 31, 89–92. [Google Scholar]
- Oguzie, F.A. Heavy metals in fish, water and effluents of lower Ikpoba River in Benin City, Nigeria. Pak. J. Sci. Indust. Res. 2003, 46, 156–160. [Google Scholar]
- Norman, J.R. Note on the fishes of the Suez. Canal. Proc. Zool. Soc. Lond. 1929, 99, 615–616. [Google Scholar] [CrossRef]
- Lucy Towers. 2015. Available online: https://thefishsite.com/articles/water-quality-a-priority-for-successful-aquaculture (accessed on 19 May 2021).
- Groundwater—Wikipedia. Available online: https://en.wikipedia.org/wiki/Groundwater (accessed on 19 May 2021).
- U S Environmental Protection Agency. The Facts about Nutrient Pollution. United State Environmental Protection Agency, 1–2; 2012. Available online: www.epa.gov/nutrientpollution (accessed on 9 June 2021).
- Ezugwu, C.N.; Apeh, S. Ground Water and Surface Water as One Resource: Connectivity and Interaction. IOSR J. Mech. Civ. Eng. 2017, 14, 54–59. [Google Scholar] [CrossRef]
- Ahmed, U.; Mumtaz, R.; Anwar, H.; Mumtaz, S.; Qamar, A.M. Water quality monitoring: From conventional to emerging technologies. Water Sci. Technol. Water Supply 2020, 20, 28–45. [Google Scholar] [CrossRef]
- Cloete, N.A.; Malekian, R.; Nair, L. Design of Smart Sensors for Real-Time Water Quality Monitoring. IEEE Access 2016, 4, 3975–3990. [Google Scholar] [CrossRef]
- Brands, E.; Rajagopal, R.; Eleswarapu, U.; Li, P. Groundwater. In International Encyclopedia of Geography: People, the Earth, Environment and Technology; John Wiley & Sons, Ltd.: Oxford, UK, 2017; pp. 1–17. [Google Scholar]
- Babu Loganathan, G.; Principal, D.; Chengalvaraya, P.; Kumar, R.S. IoT Based Water and Soil Quality Monitoring System. Int. J. Mech. Eng. Technol. 2019, 10, 537–541. [Google Scholar]
- Geetha, S.; Gouthami, S. Internet of things enabled real time water quality monitoring system. Smart Water 2016, 2, 1. [Google Scholar] [CrossRef]
- Abba, S.; Namkusong, J.W.; Lee, J.A.; Crespo, M.L. Design and performance evaluation of a low-cost autonomous sensor interface for a smart IoT-based irrigation monitoring and control system. Sensors 2019, 19, 3643. [Google Scholar] [CrossRef] [PubMed]
- Lewis, M.A.; Maki, A.W. Effects of water hardness and diet on productivity of Daphnia magna Straus. in laboratory culture. Hydrobiologia 1981, 85, 175–179. [Google Scholar] [CrossRef]
- Pule, M.; Yahya, A.; Chuma, J. Wireless sensor networks: A survey on monitoring water quality. J. Appl. Res. Technol. 2017, 15, 562–570. [Google Scholar] [CrossRef]
- Adu-Manu, K.S.; Tapparello, C.; Heinzelman, W.; Katsriku, F.A.; Abdulai, J.D. Water quality monitoring using wireless sensor networks: Current trends and future research directions. ACM Trans. Sens. Netw. 2017, 13, 1–41. [Google Scholar] [CrossRef]
- Kashid, S.G.; Pardeshi, S.A. A survey of water distribution system and new approach to intelligent water distribution system. In Proceedings of the 1st International Conference on Networks and Soft Computing, ICNSC 2014, Guntur, India, 19–20 August 2014; pp. 339–344. [Google Scholar]
- Chowdury, M.S.U.; Emran, T.B.; Ghosh, S.; Pathak, A.; Alam, M.M.; Absar, N.; Andersson, K.; Hossain, M.S. IoT based real-time river water quality monitoring system. Procedia Comput. Sci. 2019, 155, 161–168. [Google Scholar] [CrossRef]
- Kumar, S.; Yadav, S.; Yashaswini, H.M.; Salvi, S. An IoT-based smart water micro grid and smart water tank management system. In Emerging Research in Computing, Information, Communication and Applications; Springer: Berlin/Heidelberg, Germany, 2019; Volume 906, pp. 417–431. [Google Scholar]
- Kawarkhe, M.B.; Agrawal, S.; Corresponding, I. Smart Water Monitoring System Using IoT at Home. IOSR J. Comput. Eng. 2019, 21, 14–19. [Google Scholar]
- Prasad, A.N.; Mamun, K.A.; Islam, F.R.; Haqva, H. Smart water quality monitoring system. In Proceedings of the 2nd Asia-Pacific World Congress on Computer Science and Engineering, APWC on CSE, Nadi, Fiji, 2–4 December 2016. [Google Scholar]
- Ma, D.; Cui, J. Design and realization of water quality information management system based on GIS. In Proceedings of the International Symposium on Water Resource and Environmental Protection, Xi’an, China, 20–22 May 2011; Volume 1, pp. 775–778. [Google Scholar]
- Qiuchan, B.A.I.; Wu, J.; Chunxia, J.I.N. The Water Quality Online Monitoring System Based on Wireless Sensor Network. In Proceedings of the 13th International Symposium on Computational Intelligence and Design (ISCID), Hangzhou, China, 12–13 December 2020; pp. 234–237. [Google Scholar]
- Shuo, J.; Yonghui, Z.; Wen, R.; Kebin, T. The Unmanned Autonomous Cruise Ship for Water Quality Monitoring and Sampling. In Proceedings of the International Conference on Computer Systems, Electronics and Control (ICCSEC), Dalian, China, 25–27 December 2017; pp. 700–703. [Google Scholar]
- Wang, X.; Dai, J.; Liu, Z.; Zhao, X.; Dong, S.; Zhao, Z.; Zhang, M. The lake water bloom intelligent prediction method and water quality remote monitoring system. In Proceedings of the Sixth International Conference on Natural Computation, Yantai, China, 10–12 August 2010; Volume 7, pp. 3443–3446. [Google Scholar]
- Lin, Z.; Wang, W.; Yin, H.; Jiang, S.; Jiao, G.; Yu, J. Design of monitoring system for rural drinking water source based on WSN. In Proceedings of the International Conference on Computer Network, Electronic and Automation (ICCNEA), Xi’an, China, 23–25 September 2017; pp. 289–293. [Google Scholar]
- Zhang, L.; Yan, H. Implementation of a GIS-based water quality standards syntaxis and basin water quality prediction system. In Proceedings of the International Symposium on Geomatics for Integrated Water Resource Management, Lanzhou, China, 19–21 October 2012; pp. 1–4. [Google Scholar]
- Jha, M.K.; Sah, R.K.; Rashmitha, M.S.; Sinha, R.; Sujatha, B.; Suma, K.V. Smart Water Monitoring System for Real-time water quality and usage monitoring. In Proceedings of the International Conference on Inventive Research in Computing Applications (ICIRCA), Coimbatore, India, 11–12 July 2018; pp. 617–621. [Google Scholar]
- Hamid, S.A.; Rahim, A.M.A.; Fadhlullah, S.Y.; Abdullah, S.; Muhammad, Z.; Leh, N.A.M. IoT based water quality monitoring system and evaluation. In Proceedings of the 2020 10th IEEE International Conference on Control System, Computing and Engineering (ICCSCE), Penang, Malaysia, 21–22 August 2020; pp. 102–106. [Google Scholar]
- Pang, Z.; Jia, K. Designing and accomplishing a multiple water quality monitoring system based on SVM. In Proceedings of the Ninth International Conference on Intelligent Information Hiding and Multimedia Signal Processing, Beijing, China, 16–18 October 2013; pp. 121–124. [Google Scholar]
- Kai, C.; Weiwei, Z.; Lu, D. Research on Mobile Water Quality Monitoring System Based on Underwater Bionic Robot Fish Platform. In Proceedings of the IEEE International Conference on Advances in Electrical Engineering and Computer Applications (AEECA), Dalian, China, 25–27 August 2020; pp. 457–461. [Google Scholar]
- Daigavane, V.V.; Gaikwad, M.A. Water quality monitoring system based on IoT. Adv. Wirel. Mob. Commun. 2017, 10, 1107–1116. [Google Scholar]
- Pokhrel, S.; Pant, A.; Gautam, R.; Kshatri, D.B. Water Quality Monitoring System Using IoT. J. Innov. Eng. Educ. 2020, 3, 155–164. [Google Scholar] [CrossRef]
- Pasika, S.; Gandla, S.T. Smart water quality monitoring system with cost-effective using IoT. Heliyon 2020, 6, e04096. [Google Scholar] [CrossRef] [PubMed]
- Moparthi, N.R.; Mukesh, C.; Sagar, P.V. Water quality monitoring system using IoT. In Proceedings of the Fourth International Conference on Advances in Electrical, Electronics, Information, Communication and Bio-Informatics (AEEICB), Chennai, India, 27–28 February 2018; pp. 1–5. [Google Scholar]
- Madhavireddy, V.; Koteswarrao, B. Smart water quality monitoring system using IoT technology. Int. J. Eng. Technol. 2018, 7, 636. [Google Scholar] [CrossRef]


| Variable | Temperature (°C) | ||||
|---|---|---|---|---|---|
| 19 | 21 | 23 | 28 | 31 | |
| Salinity (ppm) | |||||
| 0 | 9.4 | 9.1 | 8.7 | 7.9 | 7.5 |
| 5000 | 8.9 | 8.6 | 8.3 | 7.5 | 7.2 |
| 10,000 | 8.5 | 8.2 | 7.9 | 7.1 | 6.8 |
| altitude (m) | |||||
| 0 (Sea Level) | 9.4 | 9.1 | 8.7 | 7.9 | 7.5 |
| 305 | 9.0 | 8.7 | 8.4 | 7.6 | 7.3 |
| 610 | 8.7 | 8.4 | 8.1 | 7.3 | 7.0 |
| pH | 15 °C | 20 °C | 25 °C | 90 °C |
|---|---|---|---|---|
| 7.0 | 0.25 | 0.4 | 0.6 | 1.0 |
| 7.4 | 0.6 | 1.0 | 1.5 | 2.4 |
| 7.8 | 1.6 | 2.5 | 4.0 | 5.7 |
| 8.2 | 4.1 | 5.9 | 10.0 | 13.2 |
| 8.6 | 8.4 | 13.7 | 20.7 | 27.7 |
| 9.0 | 19.6 | 28.5 | 39.1 | 49.0 |
| 9.2 | 38.3 | 50.0 | 61.7 | 70.8 |
| 9.6 | 60.2 | 71.2 | 79.4 | 85.9 |
| 10.0 | 72.4 | 79.9 | 85.6 | 90.6 |
| Authors | Technology | Baseboard | Sensors | ||||
|---|---|---|---|---|---|---|---|
| pH | Ammonia | Temp | Nitrogen | DO | |||
| Ma et al. (2011) | IoT | ✓ | ✓ | ||||
| Qiuchan et al. (2020) | IoT | Arduino | ✓ | ✓ | ✓ | ||
| Shuo et al. (2017) | IoT | Raspberry pi | ✓ | ✓ | |||
| Wang et al. (2010) | DL | Arduino | ✓ | ✓ | |||
| Lin et al. (2017) | IoT-WSN | Arduino | ✓ | ✓ | ✓ | ||
| Zhang et al. (2012) | IoT | Node MCU | ✓ | ✓ | |||
| Jha et al. (2018) | IoT | Node MCU | ✓ | ✓ | ✓ | ||
| Hamid et al. (2020) | IoT-Cloud | Arduino | ✓ | ✓ | |||
| Pang et al. (2013) | ML-IoT | Arduino | ✓ | ✓ | ✓ | ||
| Kai et al. (2020) | AI | ✓ | ✓ | ✓ | |||
| Daigavane et al. (2017) | IoT | Arduino | ✓ | ✓ | |||
| Pokhrel et al.(2018) | IoT | Arduino | ✓ | ✓ | |||
| Pasika and Gandhla (2020) | IoT | MCU | ✓ | ✓ | |||
| Moparti et al. (2018) | IoT | Arduino | ✓ | ||||
| Madhavireddy and Koteswarrao (2018) | IoT | MCU | ✓ | ✓ | |||
| No. | Hardware/Software Specification | Image | Description |
|---|---|---|---|
| 1. | Arduino/Raspberry pi as baseboard |  | The Raspberry Pi is a low-cost, small-sized computer that connects to a monitor or TV and uses a standard keyboard and mouse. |
(or) | The Arduino is an open-source microcontroller developed by Arduino.cc. The board consists of digital and analog input/output (I/O) pins that may be connected/interfaced to various expansion shields. It is programmable with the Arduino Integrated Development Environment through a type B USB cable. It can be powered through a USB port or by an external 9-volt power source | ||
| 2. | pH sensor |  | A pH sensor used for water measurements. Measures the amount of alkalinity and acidity in water. |
| 3. | Temperature sensor (LM35) |  | Reads the water temperature |
| 4. | DO sensor |  | Used to measure the gaseous oxygen dissolved in water |
| 5. | Nitrogen sensor |  | Sensor used to measure NO3 in freshwater applications |
| 6. | Ammonia sensor |  | The AmmoLyt—used to detect the Ammonia Concentrations in water |
| 7. | OS | Windows-10/Linux | Operating System to be installed in the computer that can be used for programming/configuring IoT devices. |
| 8. | Mobile devices | Android/iOS | To support Mobile Applications and monitoring thereafter |
Publisher’s Note: MDPI stays neutral with regard to jurisdictional claims in published maps and institutional affiliations. |
© 2022 by the authors. Licensee MDPI, Basel, Switzerland. This article is an open access article distributed under the terms and conditions of the Creative Commons Attribution (CC BY) license (https://creativecommons.org/licenses/by/4.0/).
Share and Cite
Manoj, M.; Dhilip Kumar, V.; Arif, M.; Bulai, E.-R.; Bulai, P.; Geman, O. State of the Art Techniques for Water Quality Monitoring Systems for Fish Ponds Using IoT and Underwater Sensors: A Review. Sensors 2022, 22, 2088. https://doi.org/10.3390/s22062088
Manoj M, Dhilip Kumar V, Arif M, Bulai E-R, Bulai P, Geman O. State of the Art Techniques for Water Quality Monitoring Systems for Fish Ponds Using IoT and Underwater Sensors: A Review. Sensors. 2022; 22(6):2088. https://doi.org/10.3390/s22062088
Chicago/Turabian StyleManoj, M., V. Dhilip Kumar, Muhammad Arif, Elena-Raluca Bulai, Petru Bulai, and Oana Geman. 2022. "State of the Art Techniques for Water Quality Monitoring Systems for Fish Ponds Using IoT and Underwater Sensors: A Review" Sensors 22, no. 6: 2088. https://doi.org/10.3390/s22062088
APA StyleManoj, M., Dhilip Kumar, V., Arif, M., Bulai, E.-R., Bulai, P., & Geman, O. (2022). State of the Art Techniques for Water Quality Monitoring Systems for Fish Ponds Using IoT and Underwater Sensors: A Review. Sensors, 22(6), 2088. https://doi.org/10.3390/s22062088