1. Introduction
Spine deformity can occur by birth, due to aging, injury, or due to spine surgery. Road accidents are the main cause of spinal injuries due to increasing rate of auto and motor vehicles. In 2013, the World Health Organization (WHO) presented key facts regarding spinal injuries and deformities showing that every year almost 250,000 to 500,000 people suffer from spine issues [
1]. According to the 2016 American Journal of Public Health [
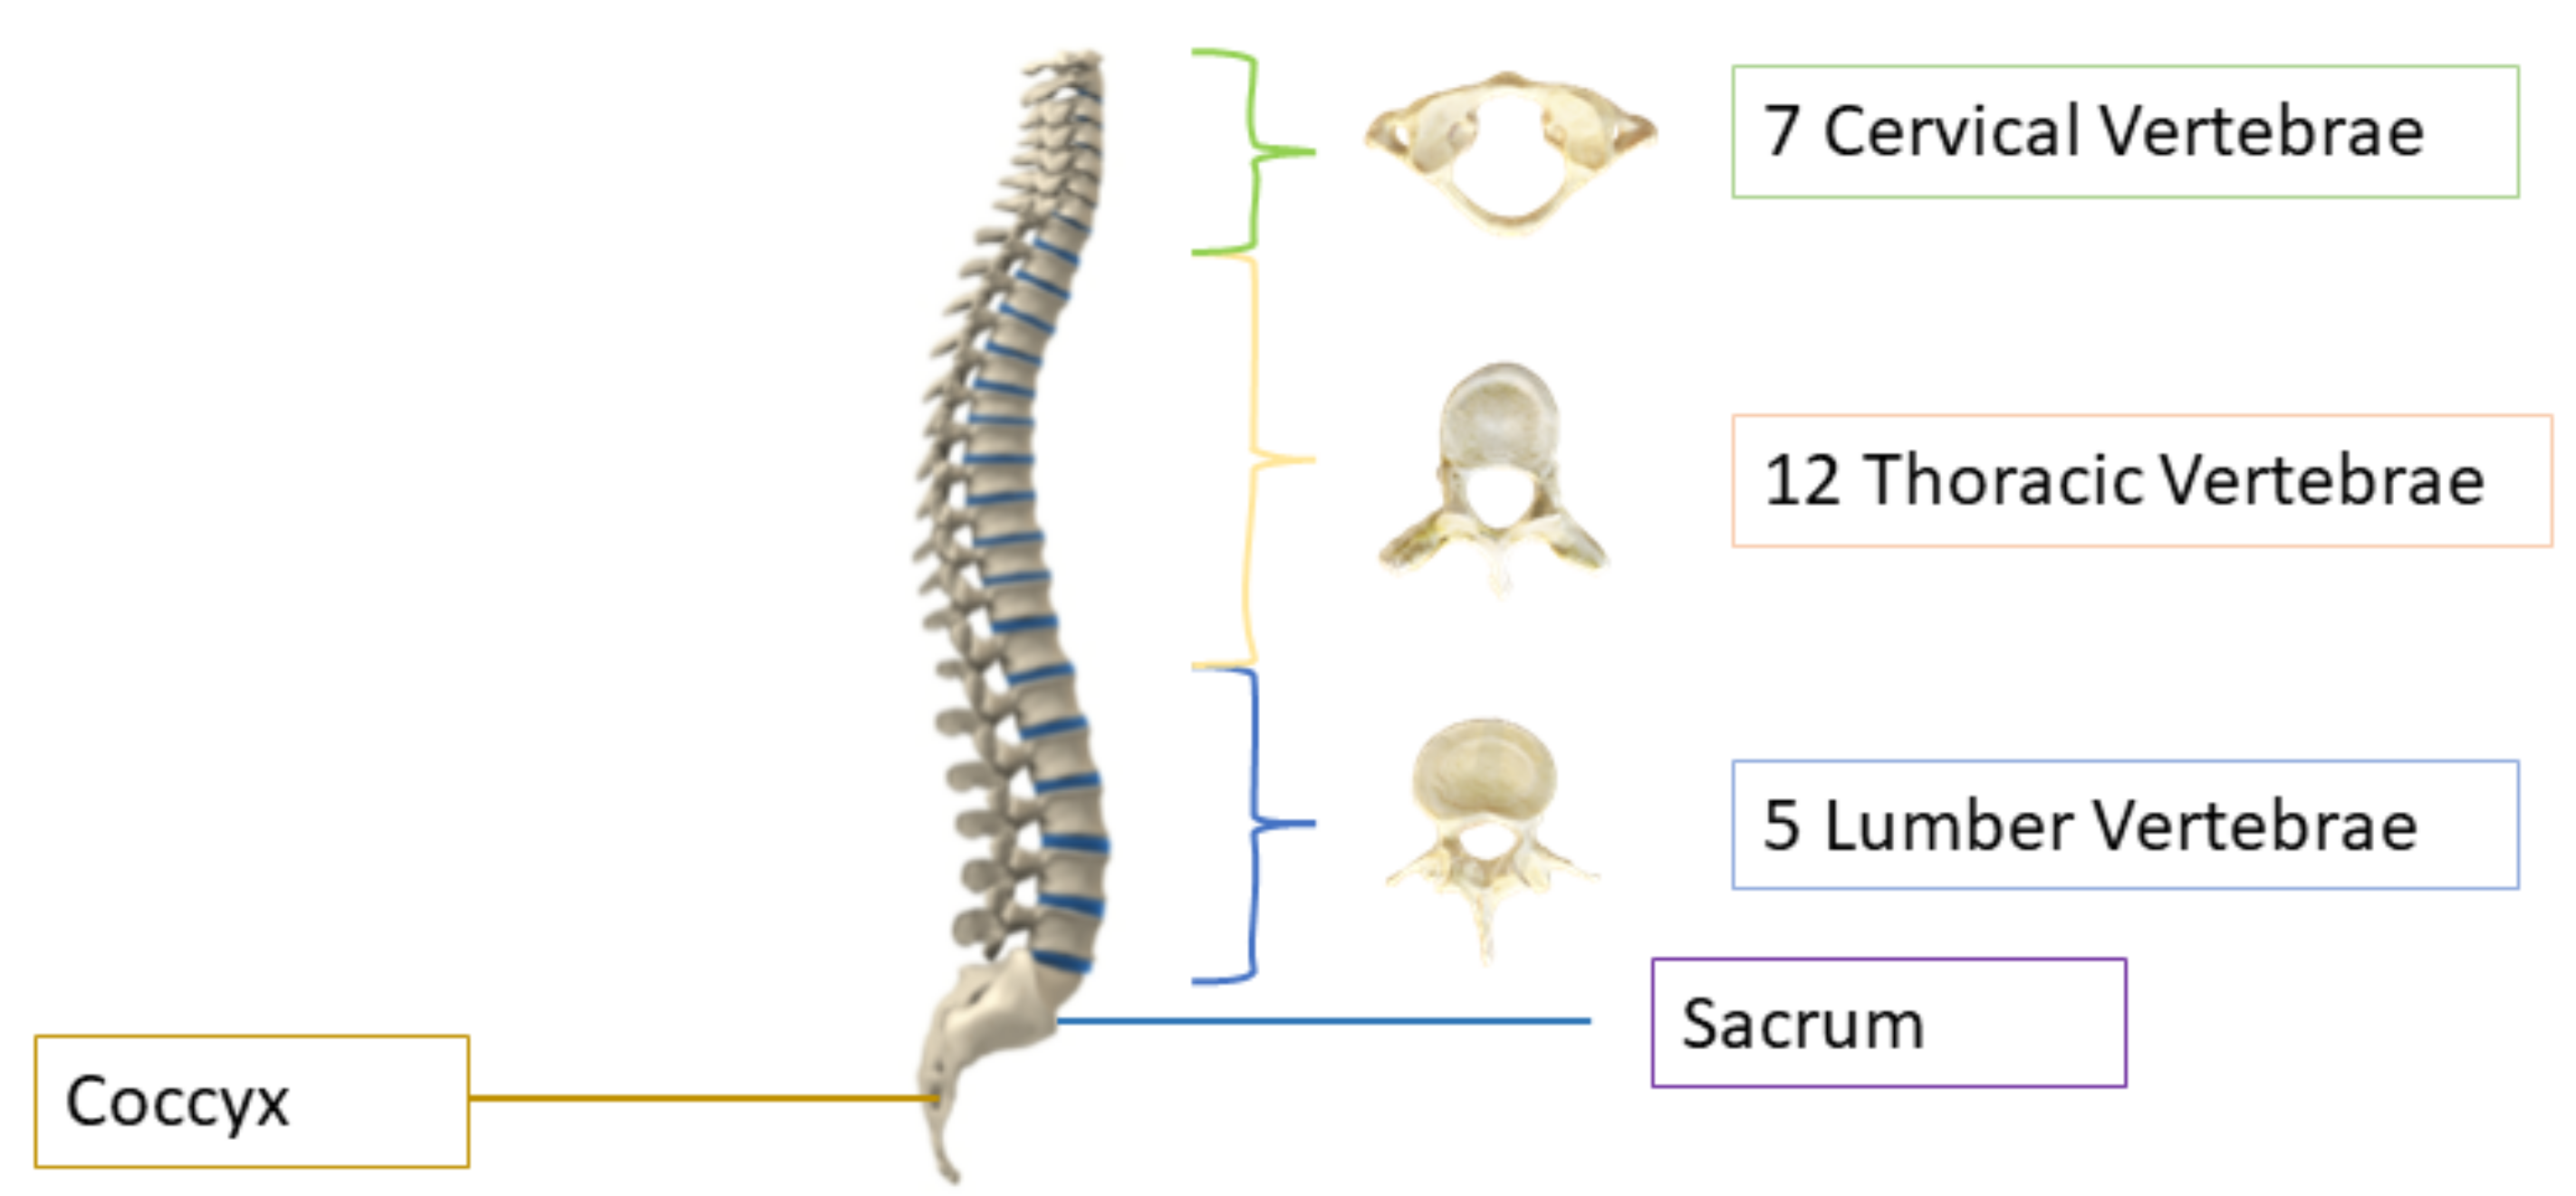
2], after stroke, spine issues are the second leading cause of paralysis. The human spine consists of 26 vertebrae; the first seven in the neck are called cervical, the twelve in the torso are called thoracic, and the five in the lower back are called lumbar vertebrae, as shown in
Figure 1. The other two are sacrum and coccyx. The area of the low back, also known as the lumbar region, starts below the rib cage [
3]. The lumbar vertebrae, numbered from L1–L5, are the largest in size and are more prone to deformity because they are responsible for carrying the weight of the body [
4]. About 80% of the population suffers lower back pain in their lives [
5], and it is the third most common reason for doctor visits, costing Americans more than USD 50 billion each year [
6]. Imaging tests can help the doctors in diagnosing the lumbar spine deformity and they can correlate it with pain symptoms. Diagnosing the deformity is a laborious task and clinicians require manual methods or computer-assisted diagnoses tools which act as a brain of doctors; they have improved the clinical identification, and are less prone to errors. Conventional manual diagnoses are prolonged and there can be variability in manual diagnoses [
7,
8]. Automated systems based on artificial intelligence (AI) can help to lessen the diagnostic errors caused by human clinical practice [
9,
10,
11] and they can be used to assist the clinicians in diagnosing the spinal disorders.
Magnetic resonance imaging (MRI) and computed tomography (CT) technologies are used to detect various spinal disorders by machine learning (ML) techniques which assist the surgeons and physicians to diagnose the disease without using time-consuming manual methods. Timely diagnoses of spine deformities can prevent the patient from dangerous consequences and help in treating the disease at its early stage. MRI scan is good at detecting small herniation of discs, pressed nerves, and soft-tissue-related issues, while CT is more useful in detecting the moderate- and high-risk spinal fractures and injuries due to its clear bones’ structure [
13].
AI has been very popular in medical imaging in the past few years, and it helps the clinicians and doctors to diagnose various diseases. As the number of imaging modalities are increasing, they support the clinicians to diagnose but they lack efficiency and accuracy; however, AI has changed the way people process large amounts of data [
14]. Our objective is to develop a diagnostic system which is based on object detector framework and can be used to detect the lumbar spine deformities using machine learning tools. Manual labeling is outdated and automated methods can save the precious time of doctors.
The paper is organized as follows:
Section 2 describes the related work about the models used for vertebrae identification and localization;
Section 3 discusses the dataset used in our proposed technique and covers the detailed methodology, results are analyzed in
Section 4 and the conclusion is presented in
Section 5.
2. Related Work
AI is growing vastly in medical imaging, and automated systems have been developed by many researchers to diagnose different diseases and help the doctors to choose less invasive surgical procedures. Many studies have been carried out on lumbar spine as it is responsible for lower backache. Due to heavy mechanical stress, slip often occurs at L4 to L5 or L5 to S1. In the past, many approaches have been applied on the vertebrae to detect, segment, and identify various diseases, but, still, researchers are working on better and new techniques to diagnose the diseases more efficiently.
In [
15], researchers worked to detect the lumbar spinal stenosis (MRI) images. They worked on axial view of the images and applied SegNet with different training ratios. Mabarki et al. [
16] worked on convolutional neural networks (CNN) based on Visual Geometry Group 19 (VGG19) architecture to detect the herniation in the lumbar disc. They tested the system successfully with more than 200 patients. Ala et al. [
17] developed a system to find the herniation in disc by taking centroid distance function as a shape feature. They concluded that this feature can be visualized as the best indicator of disc herniation in MRI scan axial images. In [
18], authors worked on the mid-sagittal view of the MRI images. They use two segmentation techniques: The first technique was a customized algorithm and the other was semantic segmentation. They obtained good results in classification of spondylolisthesis and lumbar lordosis.
A cascaded fully connected network (FCN) was developed in [
19]. They trained the 3D FCN to obtain the lumbar shape and called it a localization net, and then they trained another 3D FCN to segment the cropped lumbar, and called it a segmentation net. The localization net helped the segmentation net to segment the lumbar region correctly. Their results are pretty good, with a dice coefficient of 95%. Liao et al. [
20] worked on arbitrary CT images which is a demanding task. As all the images have different shapes and appearances, it is very difficult to segment and localize vertebrae. Therefore, they solved the problem by working on short-range contextual information and long-range contextual information. For short-range contextual information, a 3D FCN is used to extract the features, and for long-range contextual information, they used the bidirectional recurrent neural network, which is applied to encode the contextual information. In conclusion, their method extracts better feature representation than previously used methods with a notable margin on the Medical Image Computing and Computer-Assisted Intervention (MICCAI) Challenge dataset. To predict the centroid coordinates of vertebrae, a deep network was deployed in [
21]. They used the public dataset of CT volumetric images and obtained accuracy up to 90%.
Glocker et al. [
22] developed a novel approach based on a regression tree. They used two datasets and have a total of 424 CT scans images with different pathologies. Each classification forest is trained to a maximum depth of 24 trees and consists of 20 trees. Their approach works better than regression forest + hidden Markov model (HMM) on pathological spine CT. Pisov et al. [
23] worked on a publicly available dataset of the chest to detect the early stage of osteoporosis. Another two-step algorithm is proposed by them, which is used to localize the vertebral column in 3D CT images and the next step is to detect each vertebra and look for fractures in 2D. They trained neural networks for both steps on GPU using an easy six-keypoint-based annotation scheme. Their error is very small, up to 1 mm with very high accuracy up to 0.99. In [
24], authors presented their work at Large Scale Vertebrae Segmentation Challenge (VerSe) in 2019, where they used a human–machine hybrid algorithm, with 95% of high vertebrae identification rate and 90% dice coefficient. They used three steps to identify vertebrae: The first step is to detect vertebrae, the second step is to label the vertebrae that is based on btrfly-Net [
25], and the third step is to segment vertebrae, which was performed by U-Net. In [
26], vertebrae segmentation and labeling was carried out by using a FCN. They segmented the vertebrae by combining the network with a memory component that keeps information about already-segmented vertebrae. After segmentation, it then searches for another vertebrae that is located next to the segmented one and predicts whether it is visible enough to process for further analysis. The methodology attained very high accuracy of 93%, with only one mislabeled vertebrae case. Lecron et al. [
27] tried to develop an automatic approach to detect the vertebra. The purpose of developing such model is to detect vertebra without human involvement. They obtained the points of interest in radiography by an edge polygonal approximation, and a scale-invariant feature transform (SIFT) descriptor was used to train a support vector machine (SVM) model. They conclude that their results are very promising, with a corner and vertebrae detection accuracy rate up to 90% and 86%. James et al. [
28] proposed a system to detect and localize vertebrae. It detects vertebrae using 3D samples and identifies the specific vertebrae using 2D slices. Their results show very accurate identification and localization of vertebrae.
Friska et al. [
29] developed an automated system to measure the foraminal widths and anteroposterior diameter to determine the disease called lumbar spinal stenosis. They used SegNet to obtain six regions of interests in composite axial MRI Images. The results reported 97% agreement with the specialists’ opinion to identify the severity in the intervertebral disc herniation. Boundary detection method using dynamic programming was developed in [
30]. They calculated the Euclidean distance between their method of detecting the boundary and manual labeling of lumbar spine and achieved the mean Euclidean distance of 3 mm. Ghosh et al. [
31] proposed a system that uses two methods to detect and localize the intervertebral disc (IVD). The system detects IVD by using different machine learning algorithms and segments all the tissues in lumbar sagittal MRI by using different features and training them on robust classifiers. The process achieved promising results with both methods. Gang et al. [
32] proposed a novel approach of adding three CNN layers in You Look Only Once (YOLO)-tiny. Their system was used to detect spinal fractures with accuracy of 85.63%. Zuzanna et al. [
33] used YOLOv3 to detect different regions in the pelvic area. Modified YOLOv3 is developed in [
34]. The researchers used the approach to locate the IVD and detect disc herniation.
Bagus Adhi Kusuma [
35], in his research article, addressed the detection of scoliosis using X-ray images. The author preprocessed by converting X-ray images to grayscale and marked seed locations that divide images into 12 sub-images. Later, median filtering and canny were applied to obtain the boundary or vertebrae. After center point calculations, polynomial curve fitting, and Cobb angle estimation, with the help of gradient equation, was achieved. K-mean clustering played a significant role to determine the scoliosis curve. The procedure average deviation is less than 6 degrees. Yaling Pan et al. in [
36] used two separate mask regions with convolutional neural network (R-CNN) models to segment and detect the spinal curve and all vertebral bones on 248 X-rays. The Cobb angle is measured from the output of these models. Measuring the angle between any interior and superior perpendicular of the cranial and caudal vertebrae, a set containing all possible angles is obtained, and a maximum angle is considered as the Cobb angle. To assess the reliability and accuracy, two experienced radiologists separately measured the Cobb angle. Manually output results of these models were compared, achieving intraclass and interclass correlation coefficients of 0.941 and 0.887, respectively.
In [
37], Safari et al. developed a semi-manual approach for the estimation of Cobb angle. Contract stretching is used to extract the ROI in an input X-ray image. The curvature of the spine is determined with the help of manual landmarking of at least one point for each vertebra, and a fifth-order polynomial curve fitting is applied. After determining the morphologic curve, the final phase is to estimate the Cobb angle by using a tangent equation. The equation is calculated at the inflection points, and the angle is between two perpendicular lines to the spinal curve. The paper claims the correlation coefficient between the angle values is 0.81. In [
38], a new, high-precision regression technique, adaptive error correction net (AEC-Net), is introduced for evaluation of Cobb angle from X-ray images of spine. The proposed technique has two modules: The first one is regressing landmark net for boundary features extraction that indirectly aids in Cobb angle calculation. The second one is angle net for direct approach for Cobb calculation using curve features. The final stage is error correction net that basically estimates both modules’ output using extrapolation to identify the difference in Cobb angles from both networks. To evaluate the results, 581 spinal anterior–posterior X-ray images were utilized, attaining a mean absolute error of 4.90 in Cobb angle.
Kang Cheol Kim et al., in [
39], presented an approach to identify scoliosis from X-ray images; they explained the drawbacks of manual measurements which are laborious and time-consuming. The method consists of three major parts: in the first part, a confidence map is utilized for localization. In the second part, a vertebral-tilt field is used for the estimation of slope of each vertebra, and in the third part, the Cobb angle is measured using vertebral centroids in combination with the calculated vertebral-tilt field. The performance is evaluated, accomplishing circular mean absolute error (CMAE) of 3:51 degree and symmetric mean absolute percentage error (SMAPE) of 7:84% for the Cobb angle. The main purpose of these works are to aid the clinicians in handling the time-consuming task of manual image labeling.
The researchers have utilized different image processing and machine learning techniques for analysis of spine to identify different lumber deformities. Recently, utilization of deep learning has also been carried out for this purpose. The automated analysis of lumbar deformities relies on accurate localization of vertebrae, and even a small variation in the centers can lead to false grading of deformities. In the current state-of-the-art approaches, almost no research has been carried out on the localization of vertebrae. Most of them have taken this problem as segmentation, which generally faces challenges in the presence of noise and illumination changes. With recent advancements in deep learning, we have more robust object localization techniques which are invariant to these changes, so these techniques can be utilized for localization of vertebrae and further analysis of spinal deformities. Keeping all these gaps and challenges in mind, the contributions made in this research work are as follows:
This paper presents the object detection framework for lumbar deformities and provides the research community an annotated dataset in the sagittal plane with labels in YOLO format.
One of the major contributions of this research work is to utilize the object detection/localization module as vertebrae localization in comparison to current state-of-the-art methods which are based on semantic segmentation.
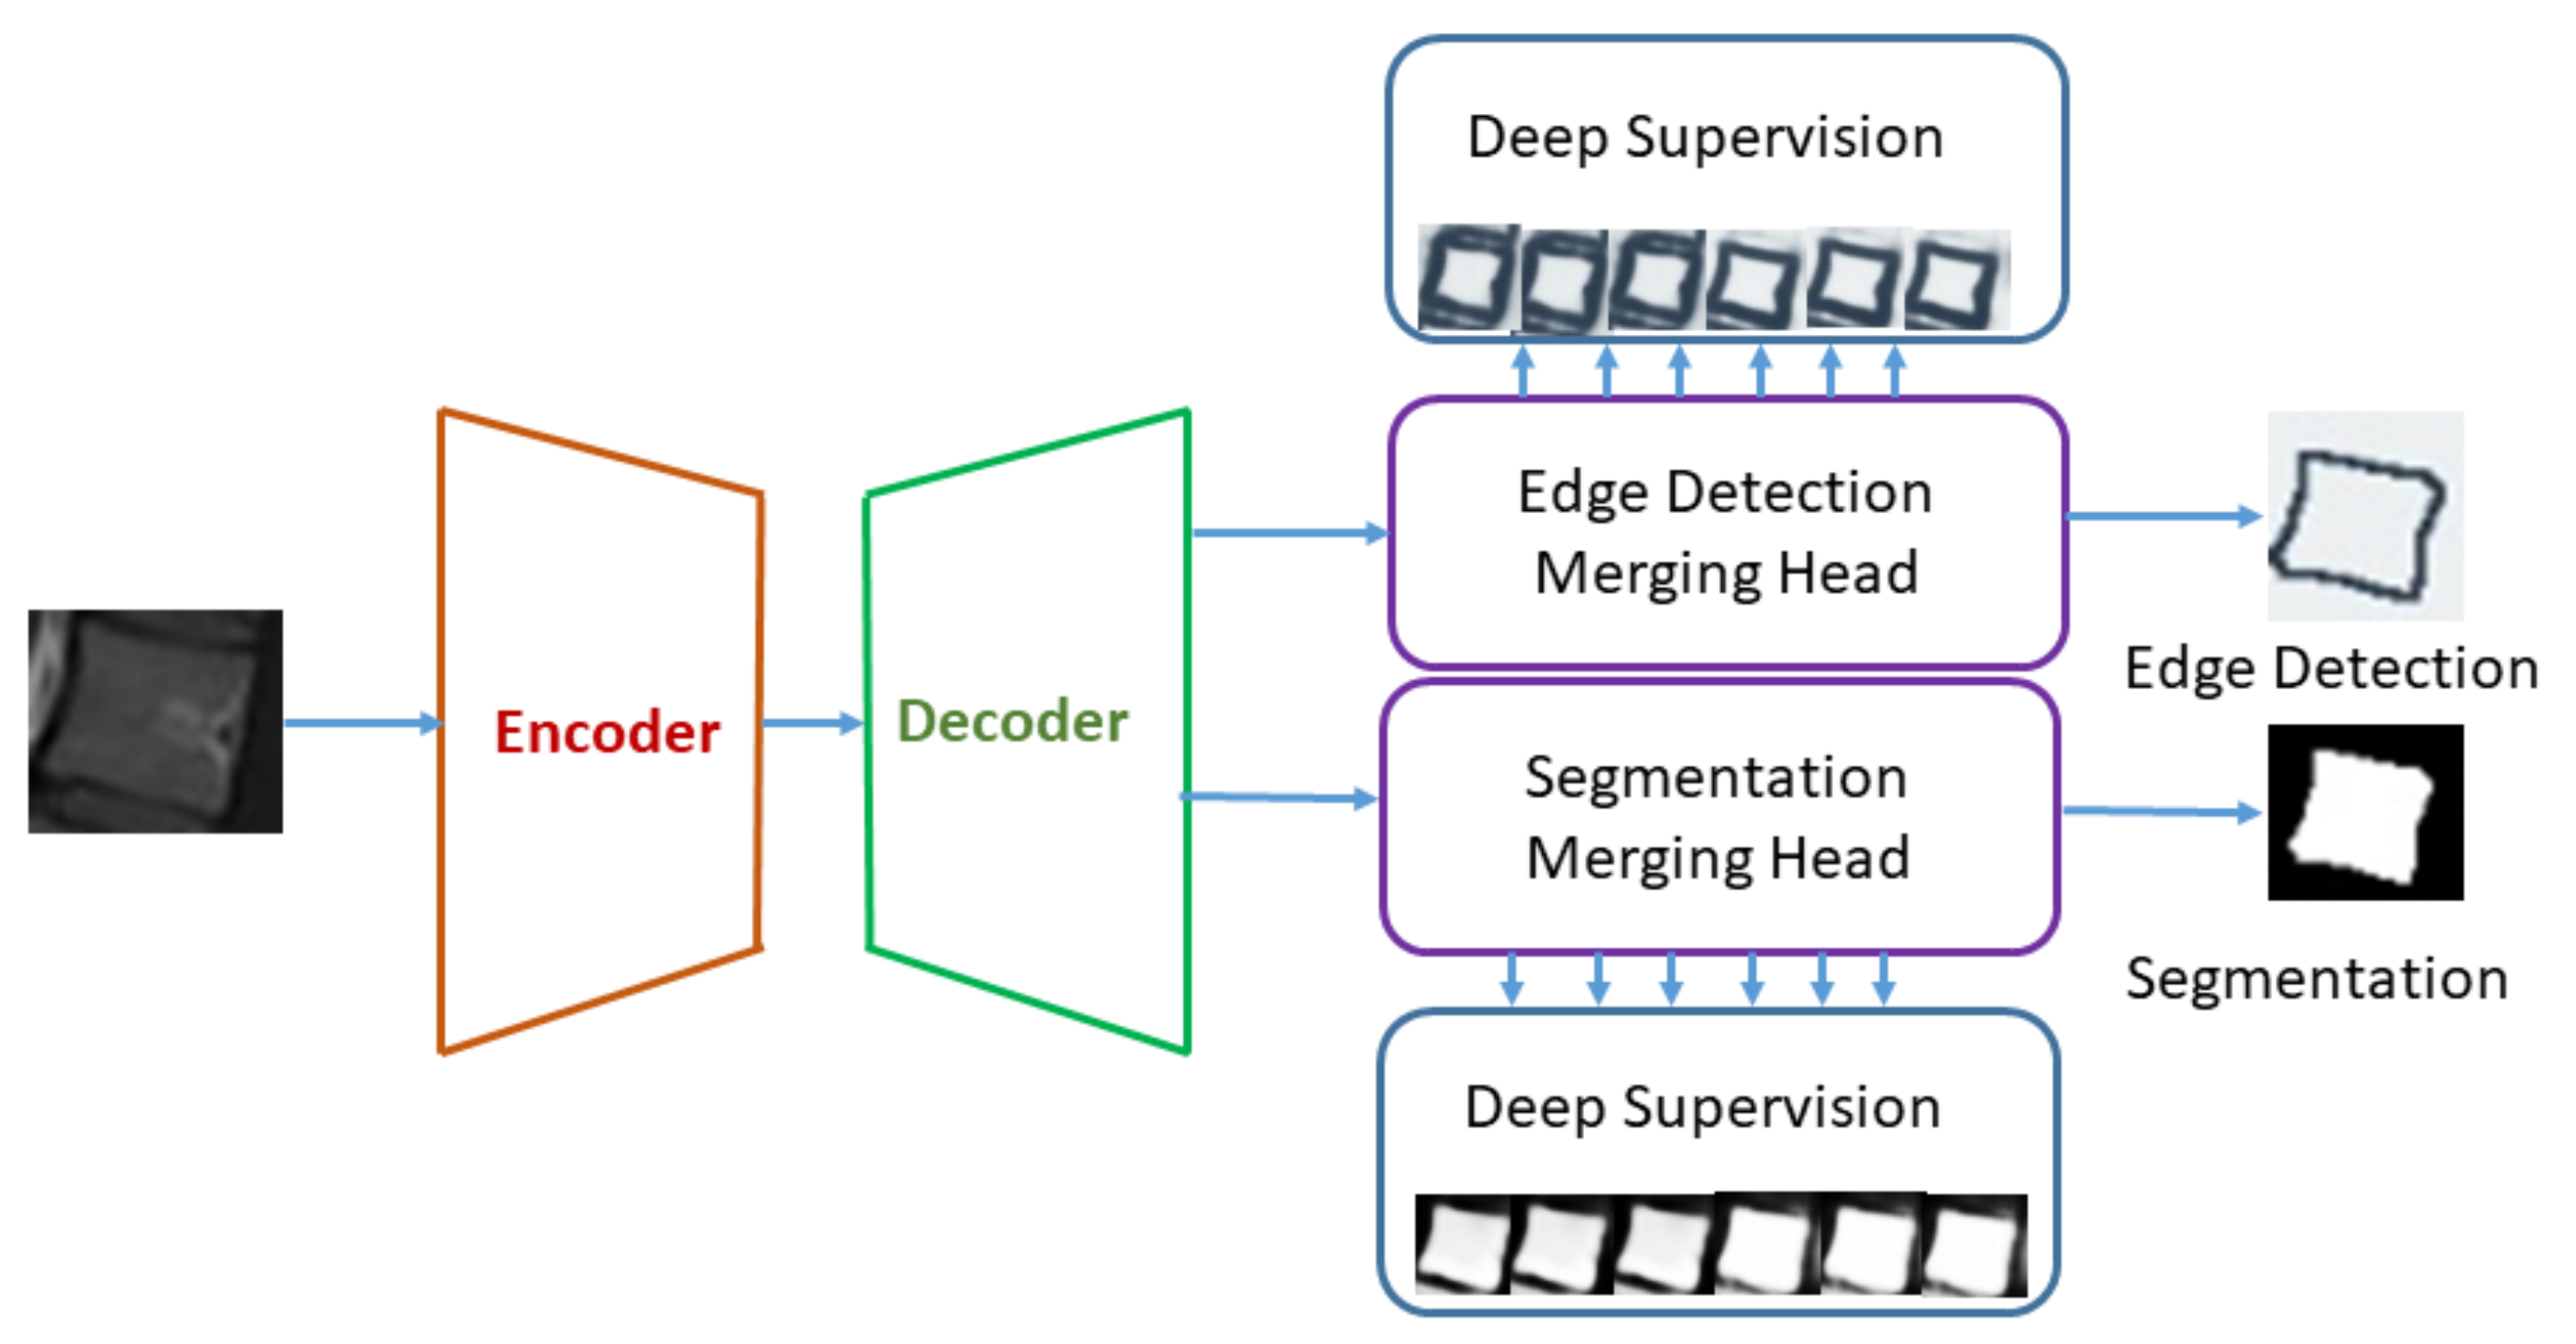
Edge-based segmentation is used to obtain the localized vertebrae to diagnose the disease.
Furthermore, we provide automated methods to calculate the angles to diagnose lumbar deformity, such as lumbar lordosis, and its further grading, which will be used as a decision support system for young radiologists and helps them to grade the severity of lumbar deformities.
4. Results and Discussion
Various deep learning techniques were applied on the same dataset, but we used object detector for the localization of lumbar spine and sacrum and the labelMe python package for data annotations and saved it in YOLO format. Vertebrae were localized with a very good confidence score. An empirical threshold of 0.65 was applied on confidence score to eliminate the boxes with lower scores. The non-maximum suppression (NMS) intersection over union (IOU) threshold is set to 0.3 in testing data.
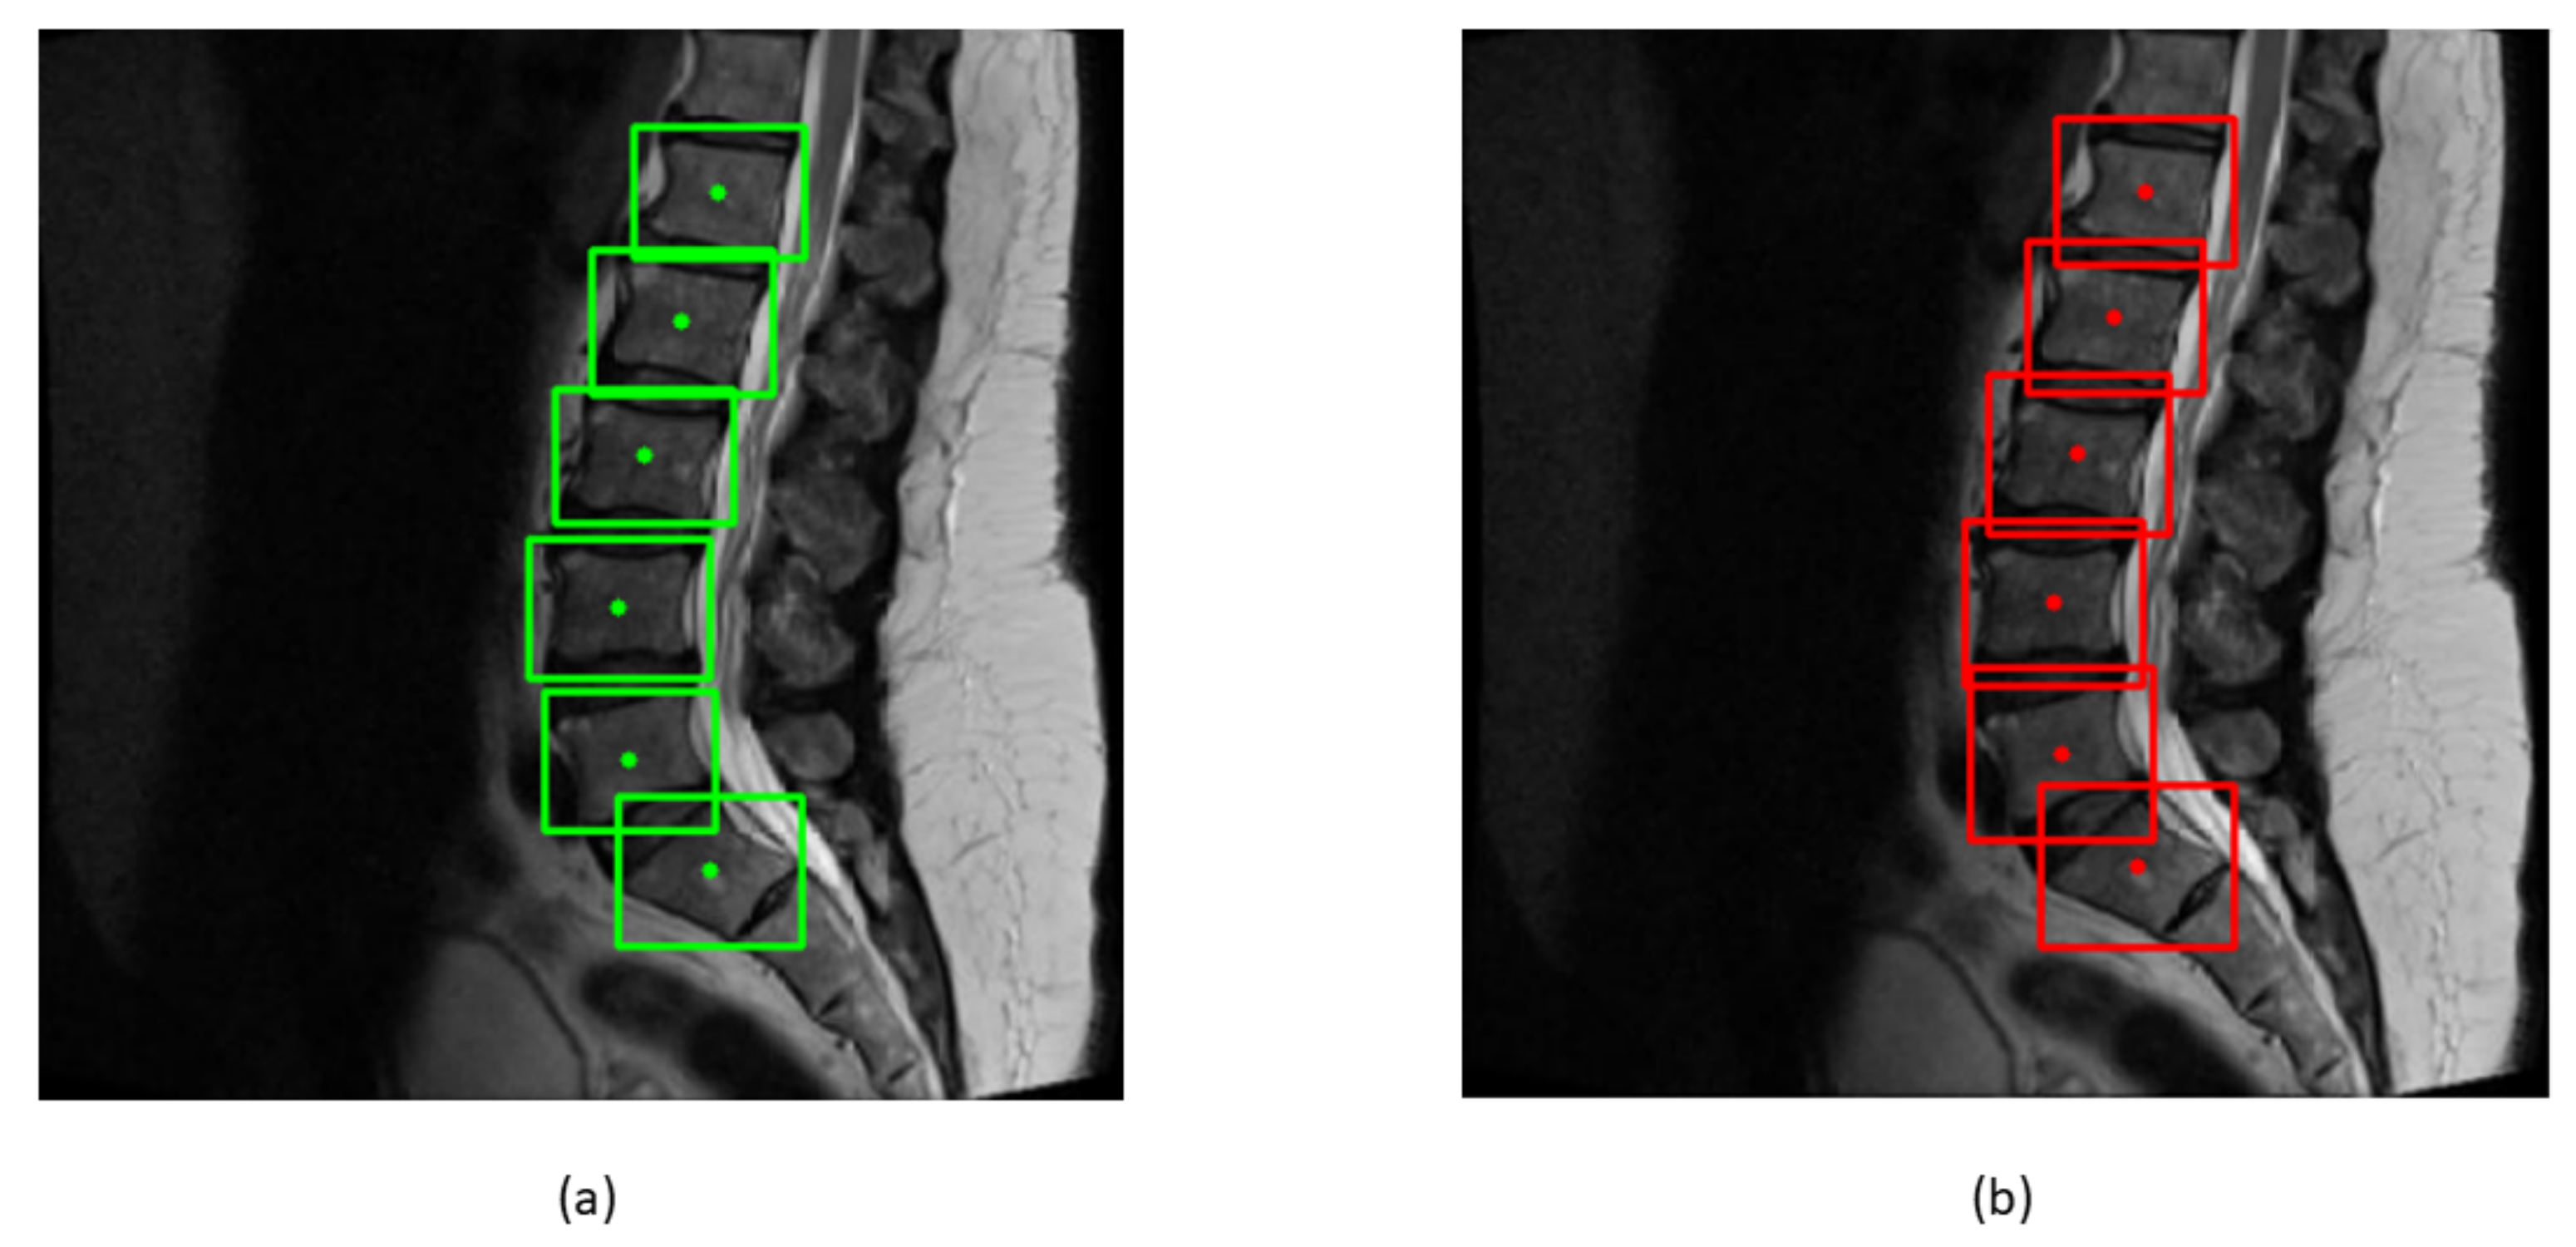
Bounding boxes are drawn across each vertebra to find the centroids of boxes. The ground truth and predicted centroids are measured by the following formula:
where
xmin,
xmax,
ymin, and
ymax represent the
x and
y coordinates of bounding boxes. The ground truth and predicted centroids are shown in green and red colors in
Figure 10.
After training and testing the model, the ground truth and predicted bounding boxes were compared by the EU of center points. The mean of the EU between the centroids of bounding boxes and IOU of two boxes can be calculated from the following formula:
Table 1 shows the mean and the standard deviation of six vertebrae. The distance between the centroids is in millimeters; the sacrum has the highest EU mean due to its tilted structure, while L1 has the least EU mean of 1.6 mm. Low value of mean indicates less distance between the centroids.
Table 2 shows the mean and standard deviation of IOU of each vertebra. Each vertebra has high value of mean and low value of standard deviation. High value of mean shows higher overlap between the bounding boxes.
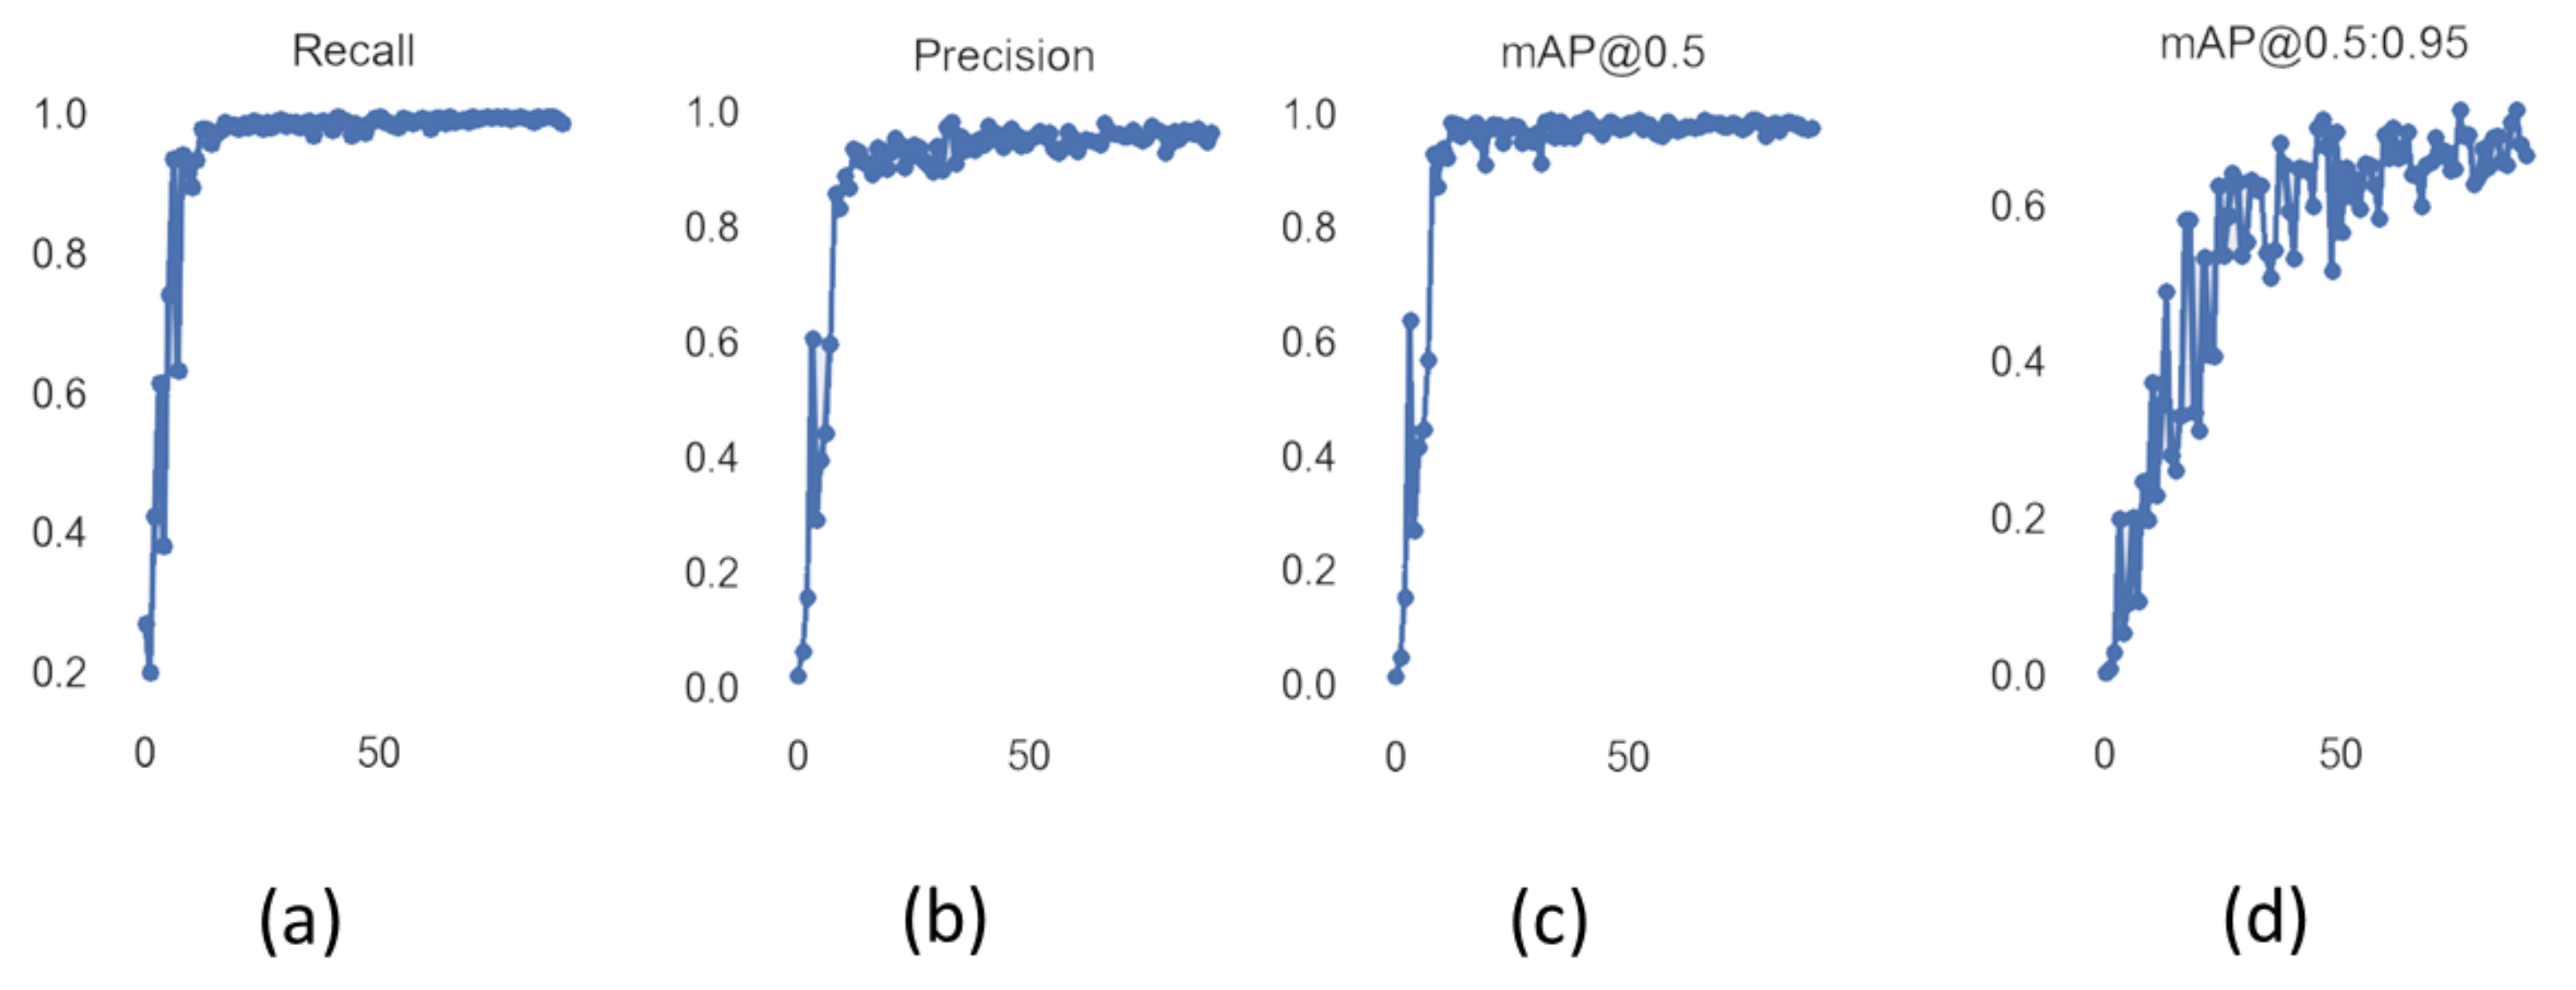
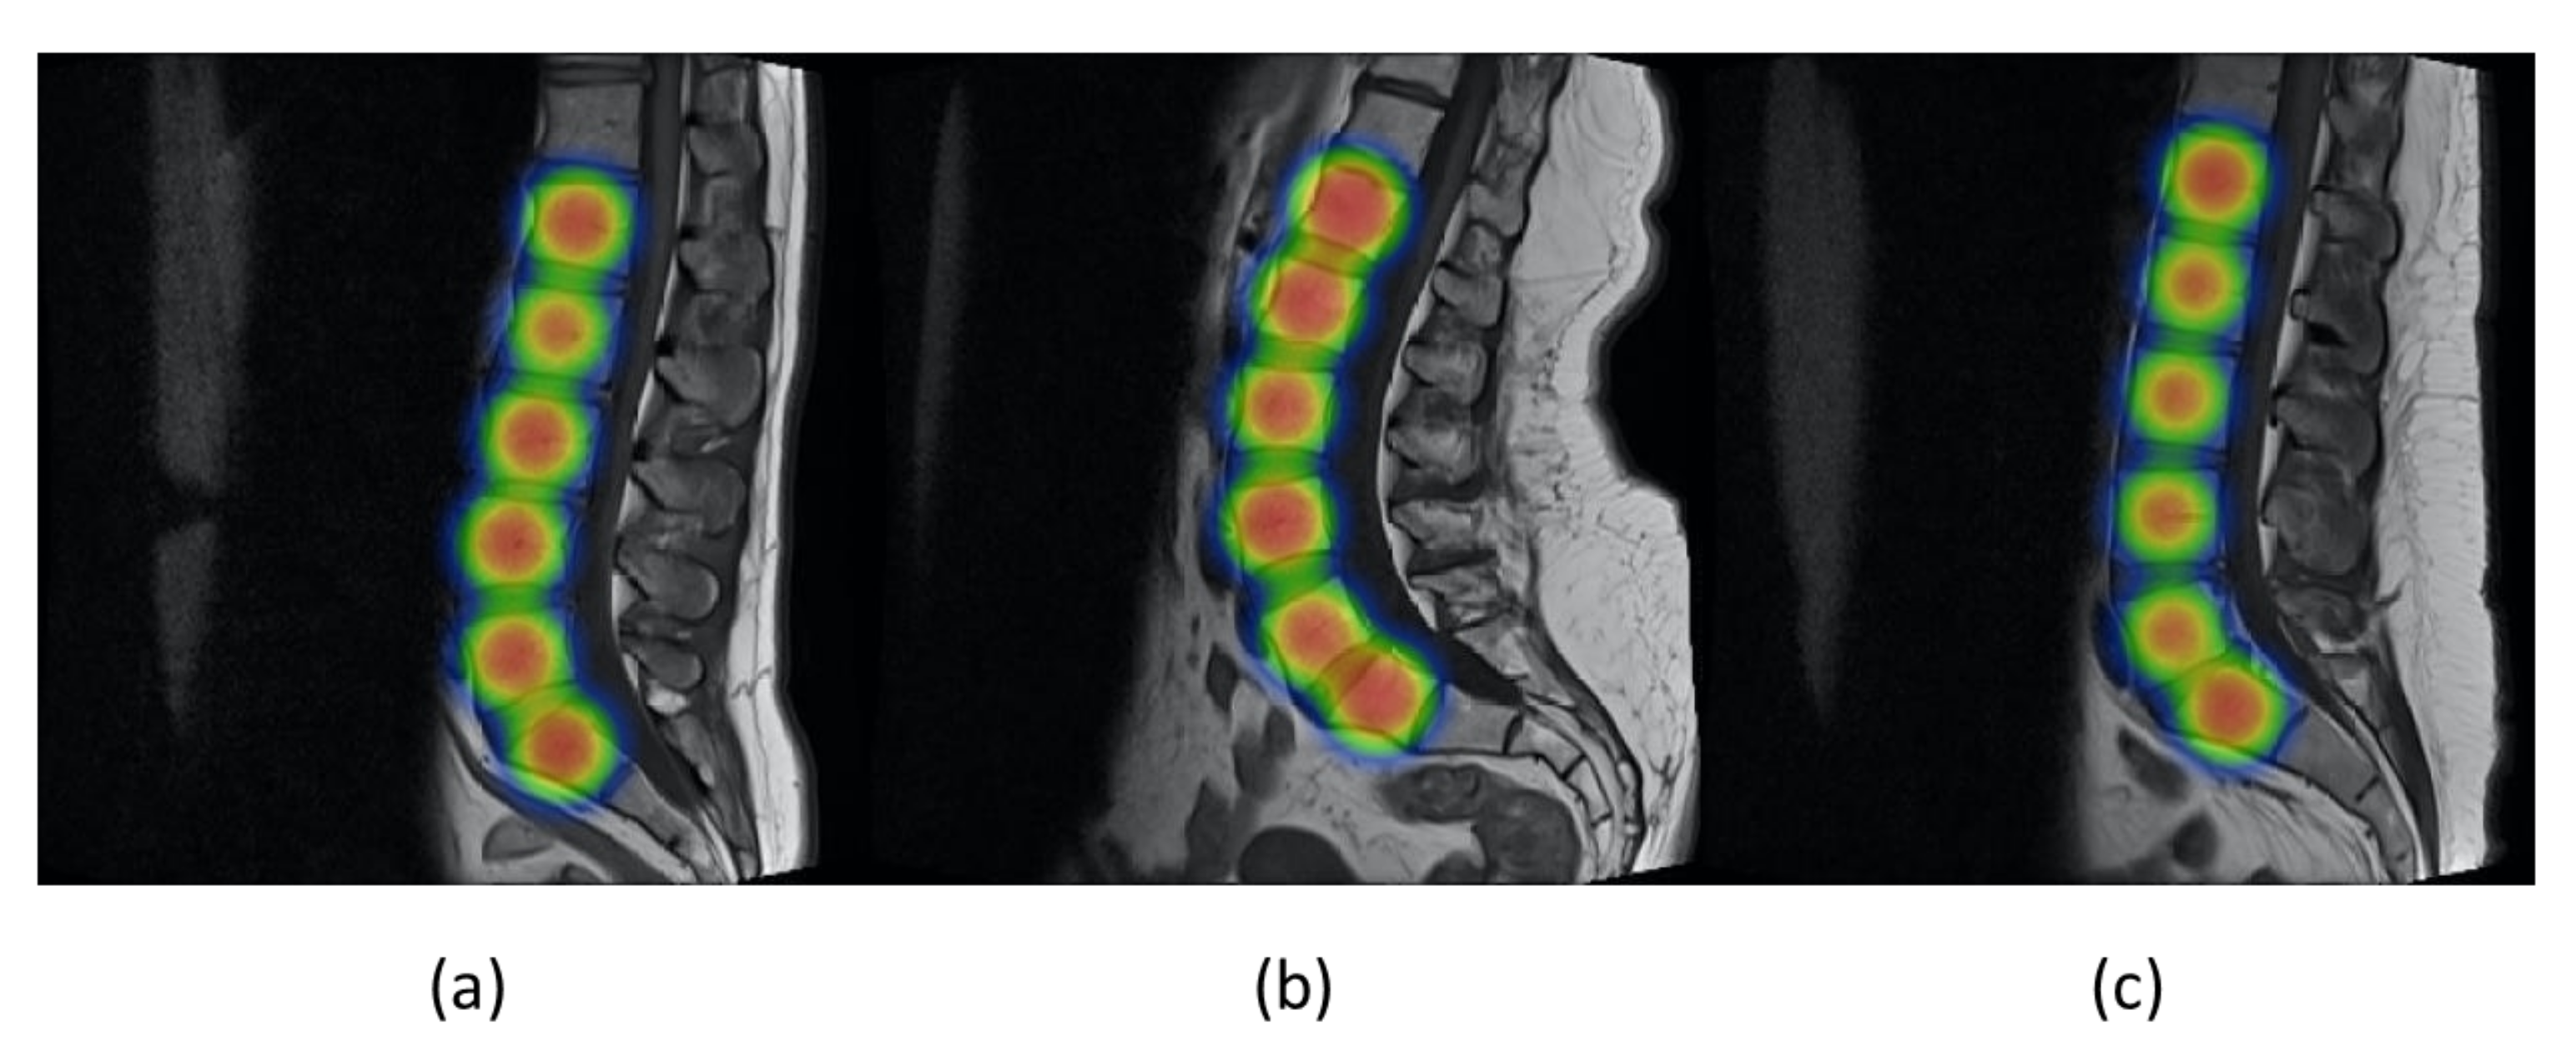
Figure 11 shows the values of precision and recall of object detector YOLOv5 with increasing values of epoch from 0 to 90. Mean average precision (mAP) is the mean of average precision, and we obtained mAP of 0.975 by using YOLOv5s. YOLOv5 can be visualized in heat maps from its trained weights before applying non-maximum suppression, as shown in
Figure 12.
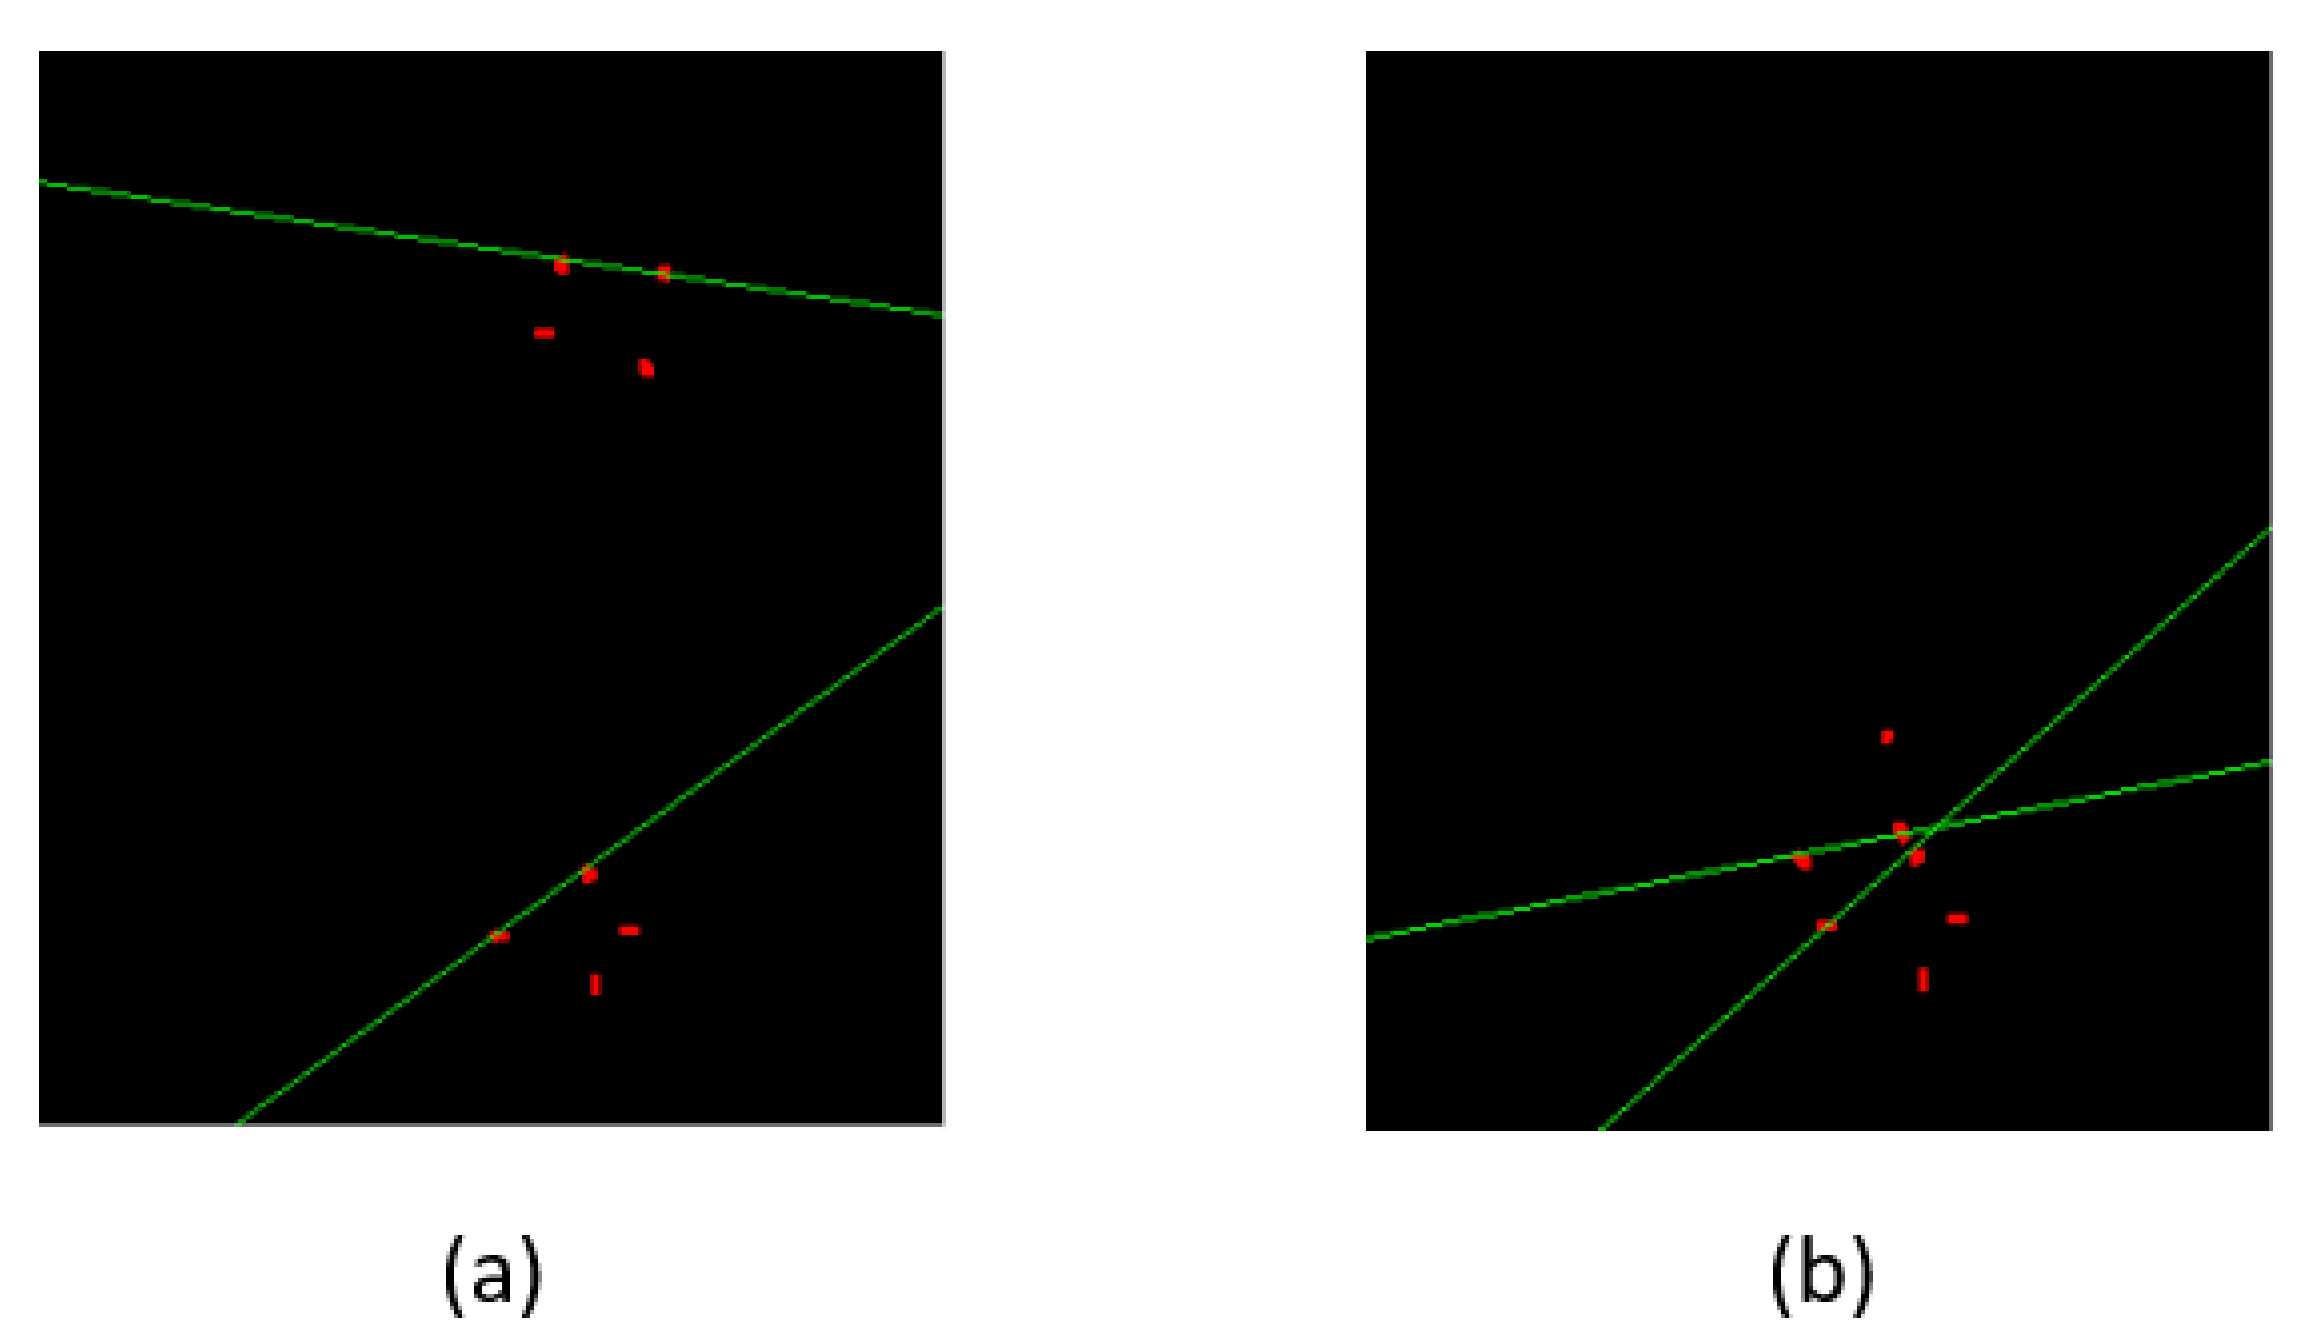
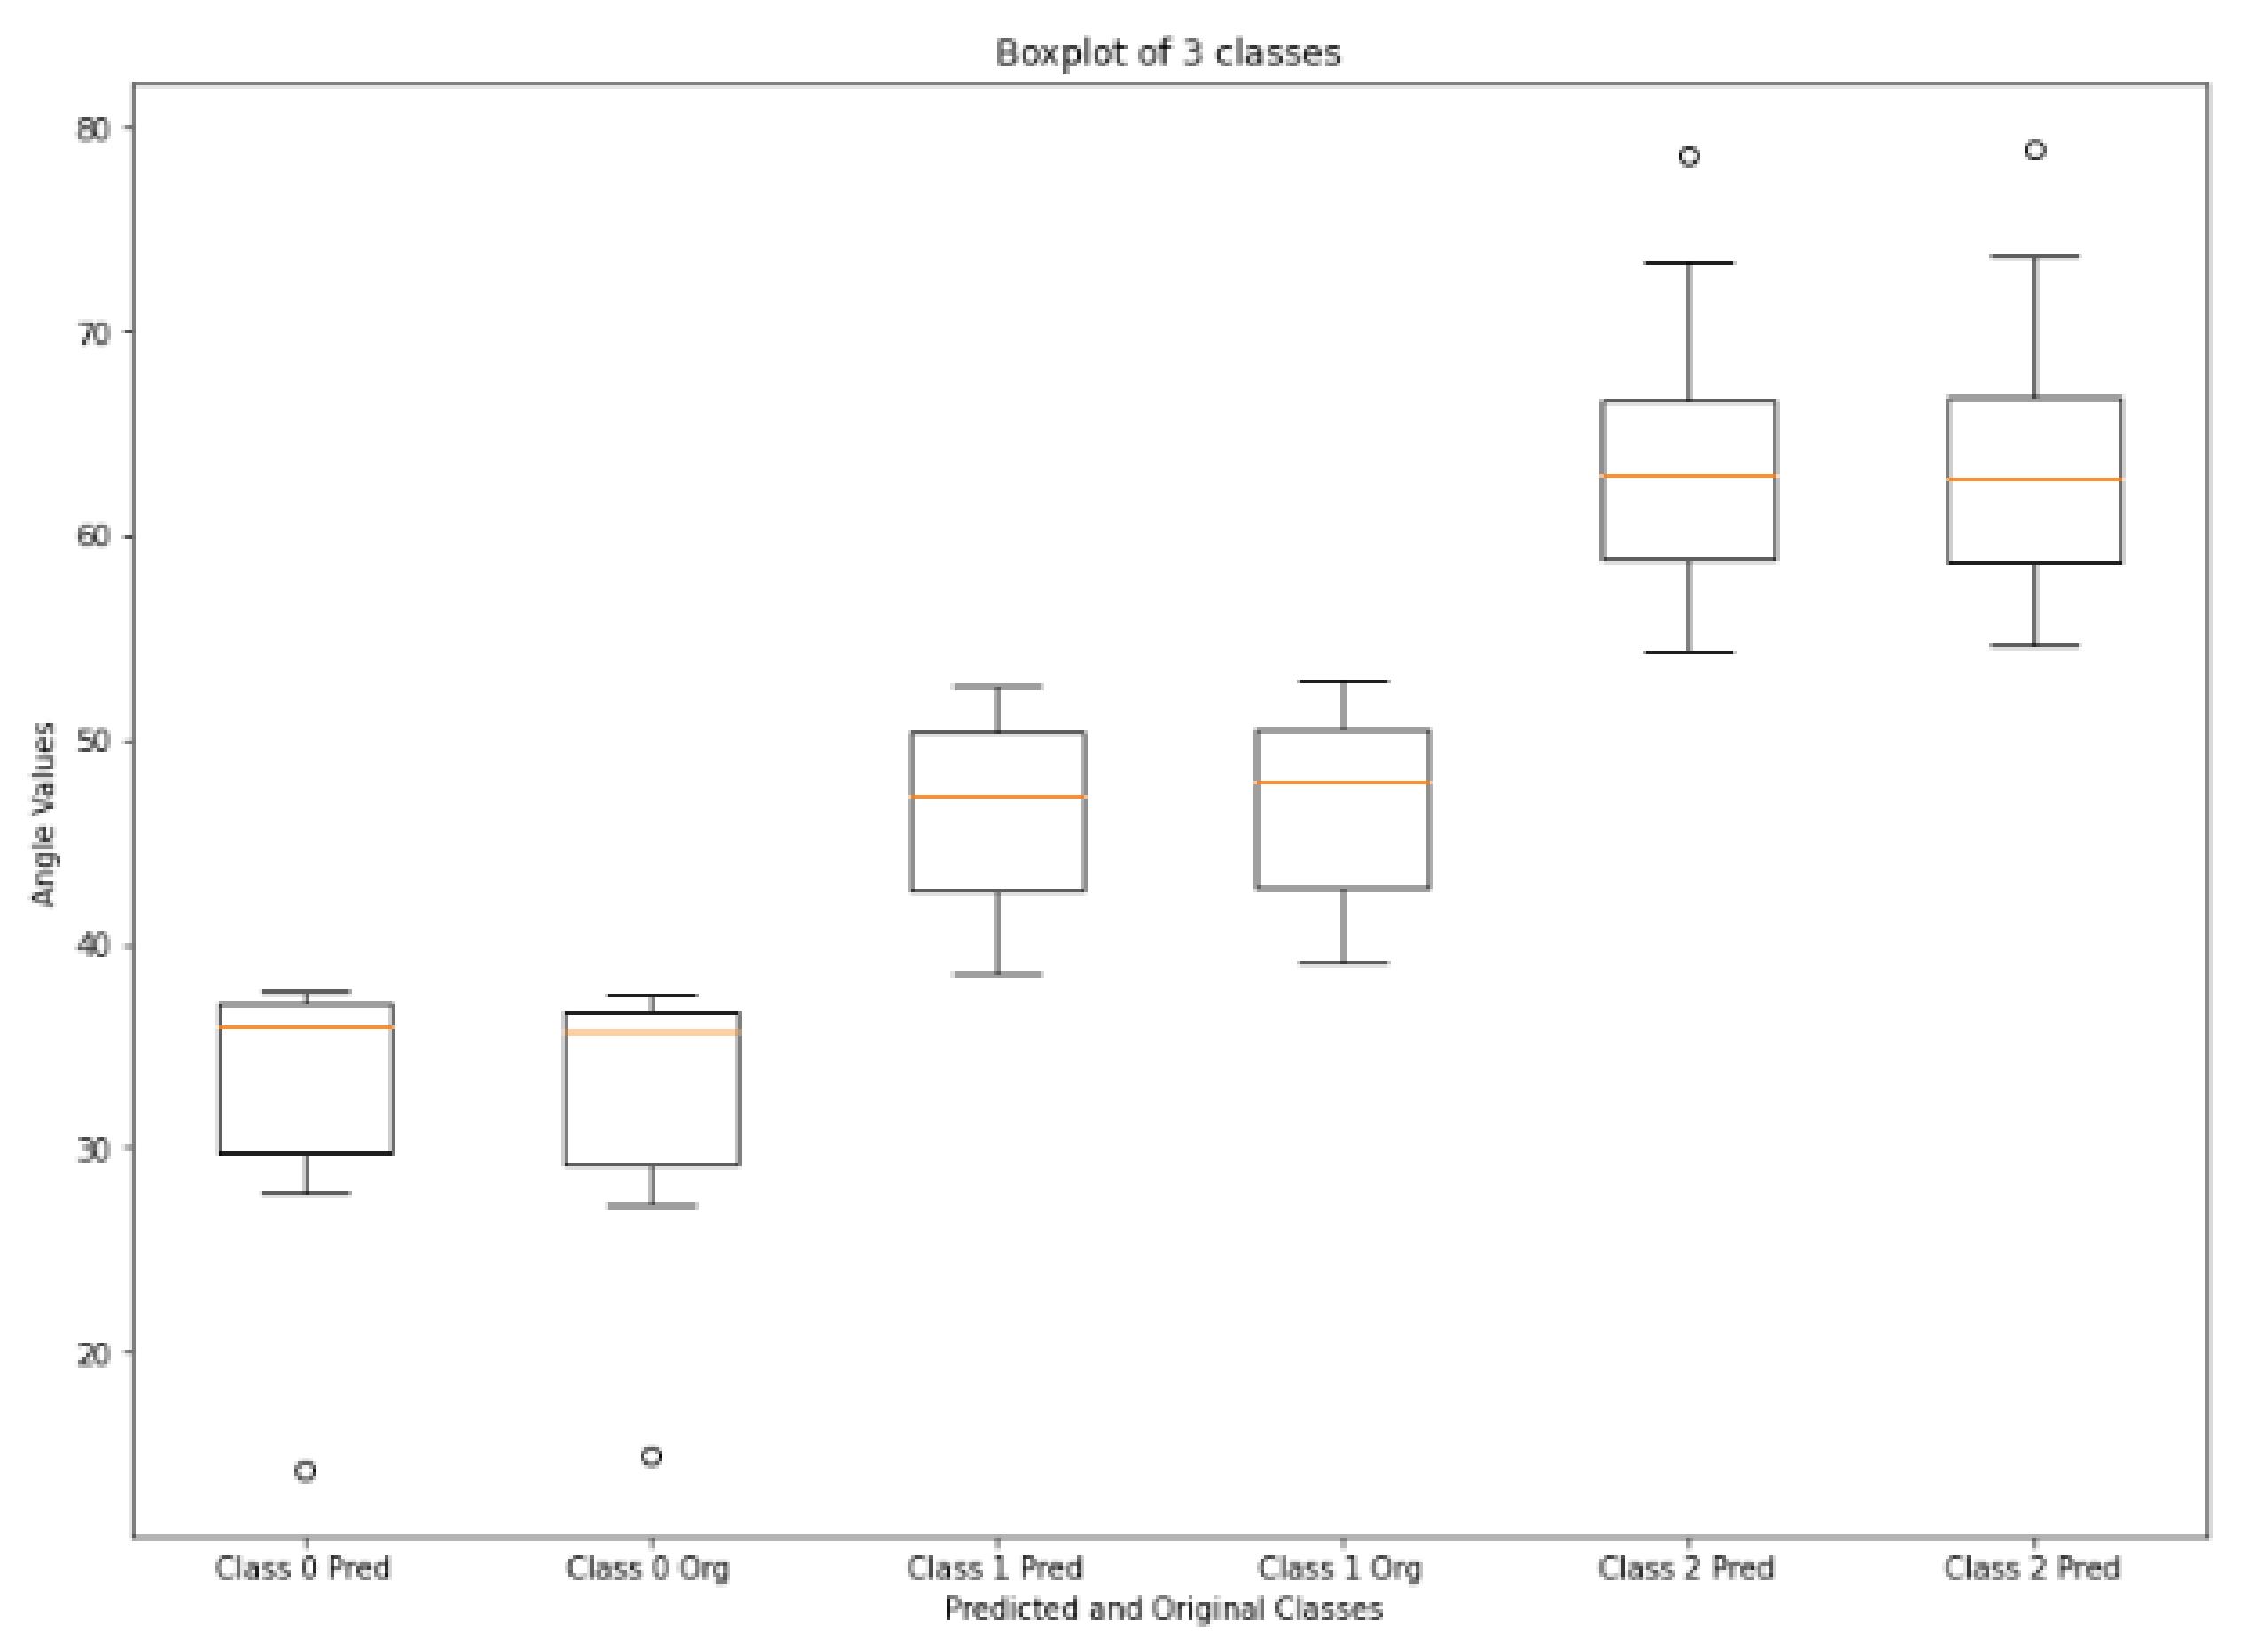
Figure 13 shows the boxplot values of calculated and ground truth angles of three classes calculated from the corners of vertebrae that are passed through HED U-Net. Normal LLA ranges from 39° to 53° [
54], so angles less than 39° are in the range of hypolordosis, named as class 0. Normal lordosis is class 1, and class 2 is hyperlordosis, having angle values above 53°. The boxplot shows very small error between the calculated values and ground truth values of angles. According to [
55,
56,
57], the measurement error up to
–
is clinically accepted. The mean error and standard deviation of mean error of LLA and LSA are shown in
Table 3. LLA and LSA calculated from our method have very small mean error values, i.e., 0.29° and 0.38°. A confusion matrix for this technique is shown in
Table 4; low values of mean error indicate there is no failure cases in any class. It has classified all the 51 subjects of lordosis correctly.
4.1. Comparison of Models
We compared YOLOv5 with other object detection models in
Table 5. Region-based fully convolutional network (R-FCN) [
58] has residual networks (ResNet) as a backbone to detect the objects. We achieved 0.894 mAP value to detect the lumbar vertebrae and a sacrum by using R-FCN. SSD513 [
59] is the single shot detector with 513 × 513 inputs that detects the vertebrae with the mAP of 0.925. Lin et al. [
60] used feature pyramid networks (FPN) architecture in faster RCNN to detect the object more accurately. We obtained mAP value of 0.942 by using the FPN FRCN, which is the second highest value in
Table 5. YOLOv3 is the third variant of the YOLO family, which is believed to be three times faster than SSD [
61]. It achieved 0.917 mAP in detecting the vertebrae. YOLOv5 has surpassed other current state of the art methods and its mAP is 0.033 greater than FPN FRCN.
4.2. Comparison of Approaches for Lumbar Lordosis Assessment
We used two ways to diagnose the lumbar lordosis. This first method is to assess the lumbar lordosis by finding the angle from the corners of the vertebra, while the other method is the lumbar lordosis assessment through region area, where the area is correlated with the angles values to classify the disease. A block diagram of the region-area-based method to diagnose the lumbar lordosis is shown in
Figure 14. The presented technique consists of preprocessing steps, training of YOLOv5 model, vertebrae localization, centroids calculations, and area computation through centroids. The centroids of localized vertebrae can be connected together to find the area of enclosed region, which will be used to diagnose the severity of the disease.
Ref. [
18] proposed the method to diagnose lordosis on the basis of area enclosed in the region. They combined [
62,
63] techniques to obtain the area under the curve from the centroids. We computed the area from the centroids of the bounding boxes of YOLOv5. The centroid of L1 is connected to L2, L2 to L3, and so on, and lastly, the centroid of S is connected to L1, to form an enclosed region. The normal range for lordosis is 39° to 53° [
54]. Angles below 39 are termed as hypolordosis, while the angles above 53° are termed as hyperlordosis. The area of the enclosed region is correlated with the angles to diagnose the disease. The area can be found by summing all the non-zero pixels in the images. The equation is given by
Arearegion represents the area of the region,
zzi is the non-zero pixels in the images, and
zz is the interval between pixels and is equivalent to one pixel. This method was proposed by [
18] to diagnose the lordosis from the centroids instead of corner points.
Figure 15 shows three images, each from a different lordosis type. Hypolordosis includes straight back and flat back cases, while hyperlordosis includes sway back of the vertebrae. The region area of normal lordosis is smaller than the hyperlordosis and greater than the hypolordosis curve [
18]. We obtained 74.5 percent accuracy by using this technique.
Table 6 shows the confusion matrix for this technique; the total number of test cases is 51, in which 6 subjects have hypolordosis, 19 subjects have normal lordosis, and 26 subjects have hyperlordosis. Hypolordosis is classified correctly, while normal and hyper have some of the misclassified cases.
The summary of all the results is shown in
Table 7. The results show that lumbar assessment through corners classifies the class more accurately as compared to lumbar lordosis assessment through region area. Our proposed approach outperforms the region-area-based approach by 25.5%. The first method uses the localization and edge-based segmentation methods to diagnose the disease, while the region-area-based method uses only the localization part and then calculates the centroids of the vertebrae to calculate the area of the enclosed region. Accuracies for both techniques are shown in
Table 7.
4.3. Comparison with Other Researchers
We also compared our proposed model with other researchers. Our proposed methodology uses YOLOv5 for the localization and HED U-Net for the edge based segmentation, Masood et al. used Resnet-UNet for the segmentation of lumbar vertebrae, Suri et al. [
64] used three neural networks, each network for each modality of image to compute the LLA, while Cho et al. [
65] used semantic segmentation by using the model UNet We obtained very small mean error of LLA and LSA as compared to [
41,
64,
65]. The first two techniques are applied on Composite Lumbar Spine MRI Dataset [
41]. As we can see from the results, our object detection and edge-based segmentation model outperforms other state-of-the-art models that use semantic segmentation. This system will help the clinicians and support their decisions in diagnosing the disease.
Table 8 shows the comparison of our results with other researchers. Our proposed technique achieves ME of 0.29° and 0.38° for LLA and LSA, which is 2.32° and 1.63° less than the ME of LLA and LSA calculated by the proposed approach of Masood et al.
Clinicians often use time-consuming different manual or semi-manual methods to calculate the Cobb angles and diagnose the vertebral diseases. Our proposed method is an automated method to compute the Cobb angles with very small mean error value. According to [
66], clinicians take around 18.96 s to calculate the Cobb angles, while our method gives the Cobb angles results within 5 s on 10th gen Intel core i7 and Nvidia Geforce RTX 3060. We used the object detector to localize the vertebrae, which has not been used before, and then edge-based segmentation to diagnose the disease severity. As no object detection framework for diagnosing the spinal disorder is present, the comparison is difficult. We also compared YOLOv5 with other object detectors, i.e., R-FCN, SSD513, FPN FRCN, and YOLOv3. We achieved the highest value of mAP by using the YOLOv5 model. The region-area-based method tends to fail because it is dependent on centroids of multiple vertebrae, and small error in the computation of the centroids can affect the whole area, which can led to misclassification. Cobb angle is dependent on the end plate structures of vertebrae, and its computation often tends to fail if there is an abnormal-shaped vertebra in test phase, as the model has been trained on the dataset having mostly healthy vertebrae. Our primary focus is to develop a fully automated system to diagnose the disease, and very little attention is given to the abnormally deformed vertebrae.
