
Toward a Selective Analysis of Heavy Metal Salts in Aqueous Media with a Fluorescent Probe Array


 ,
,  and
and 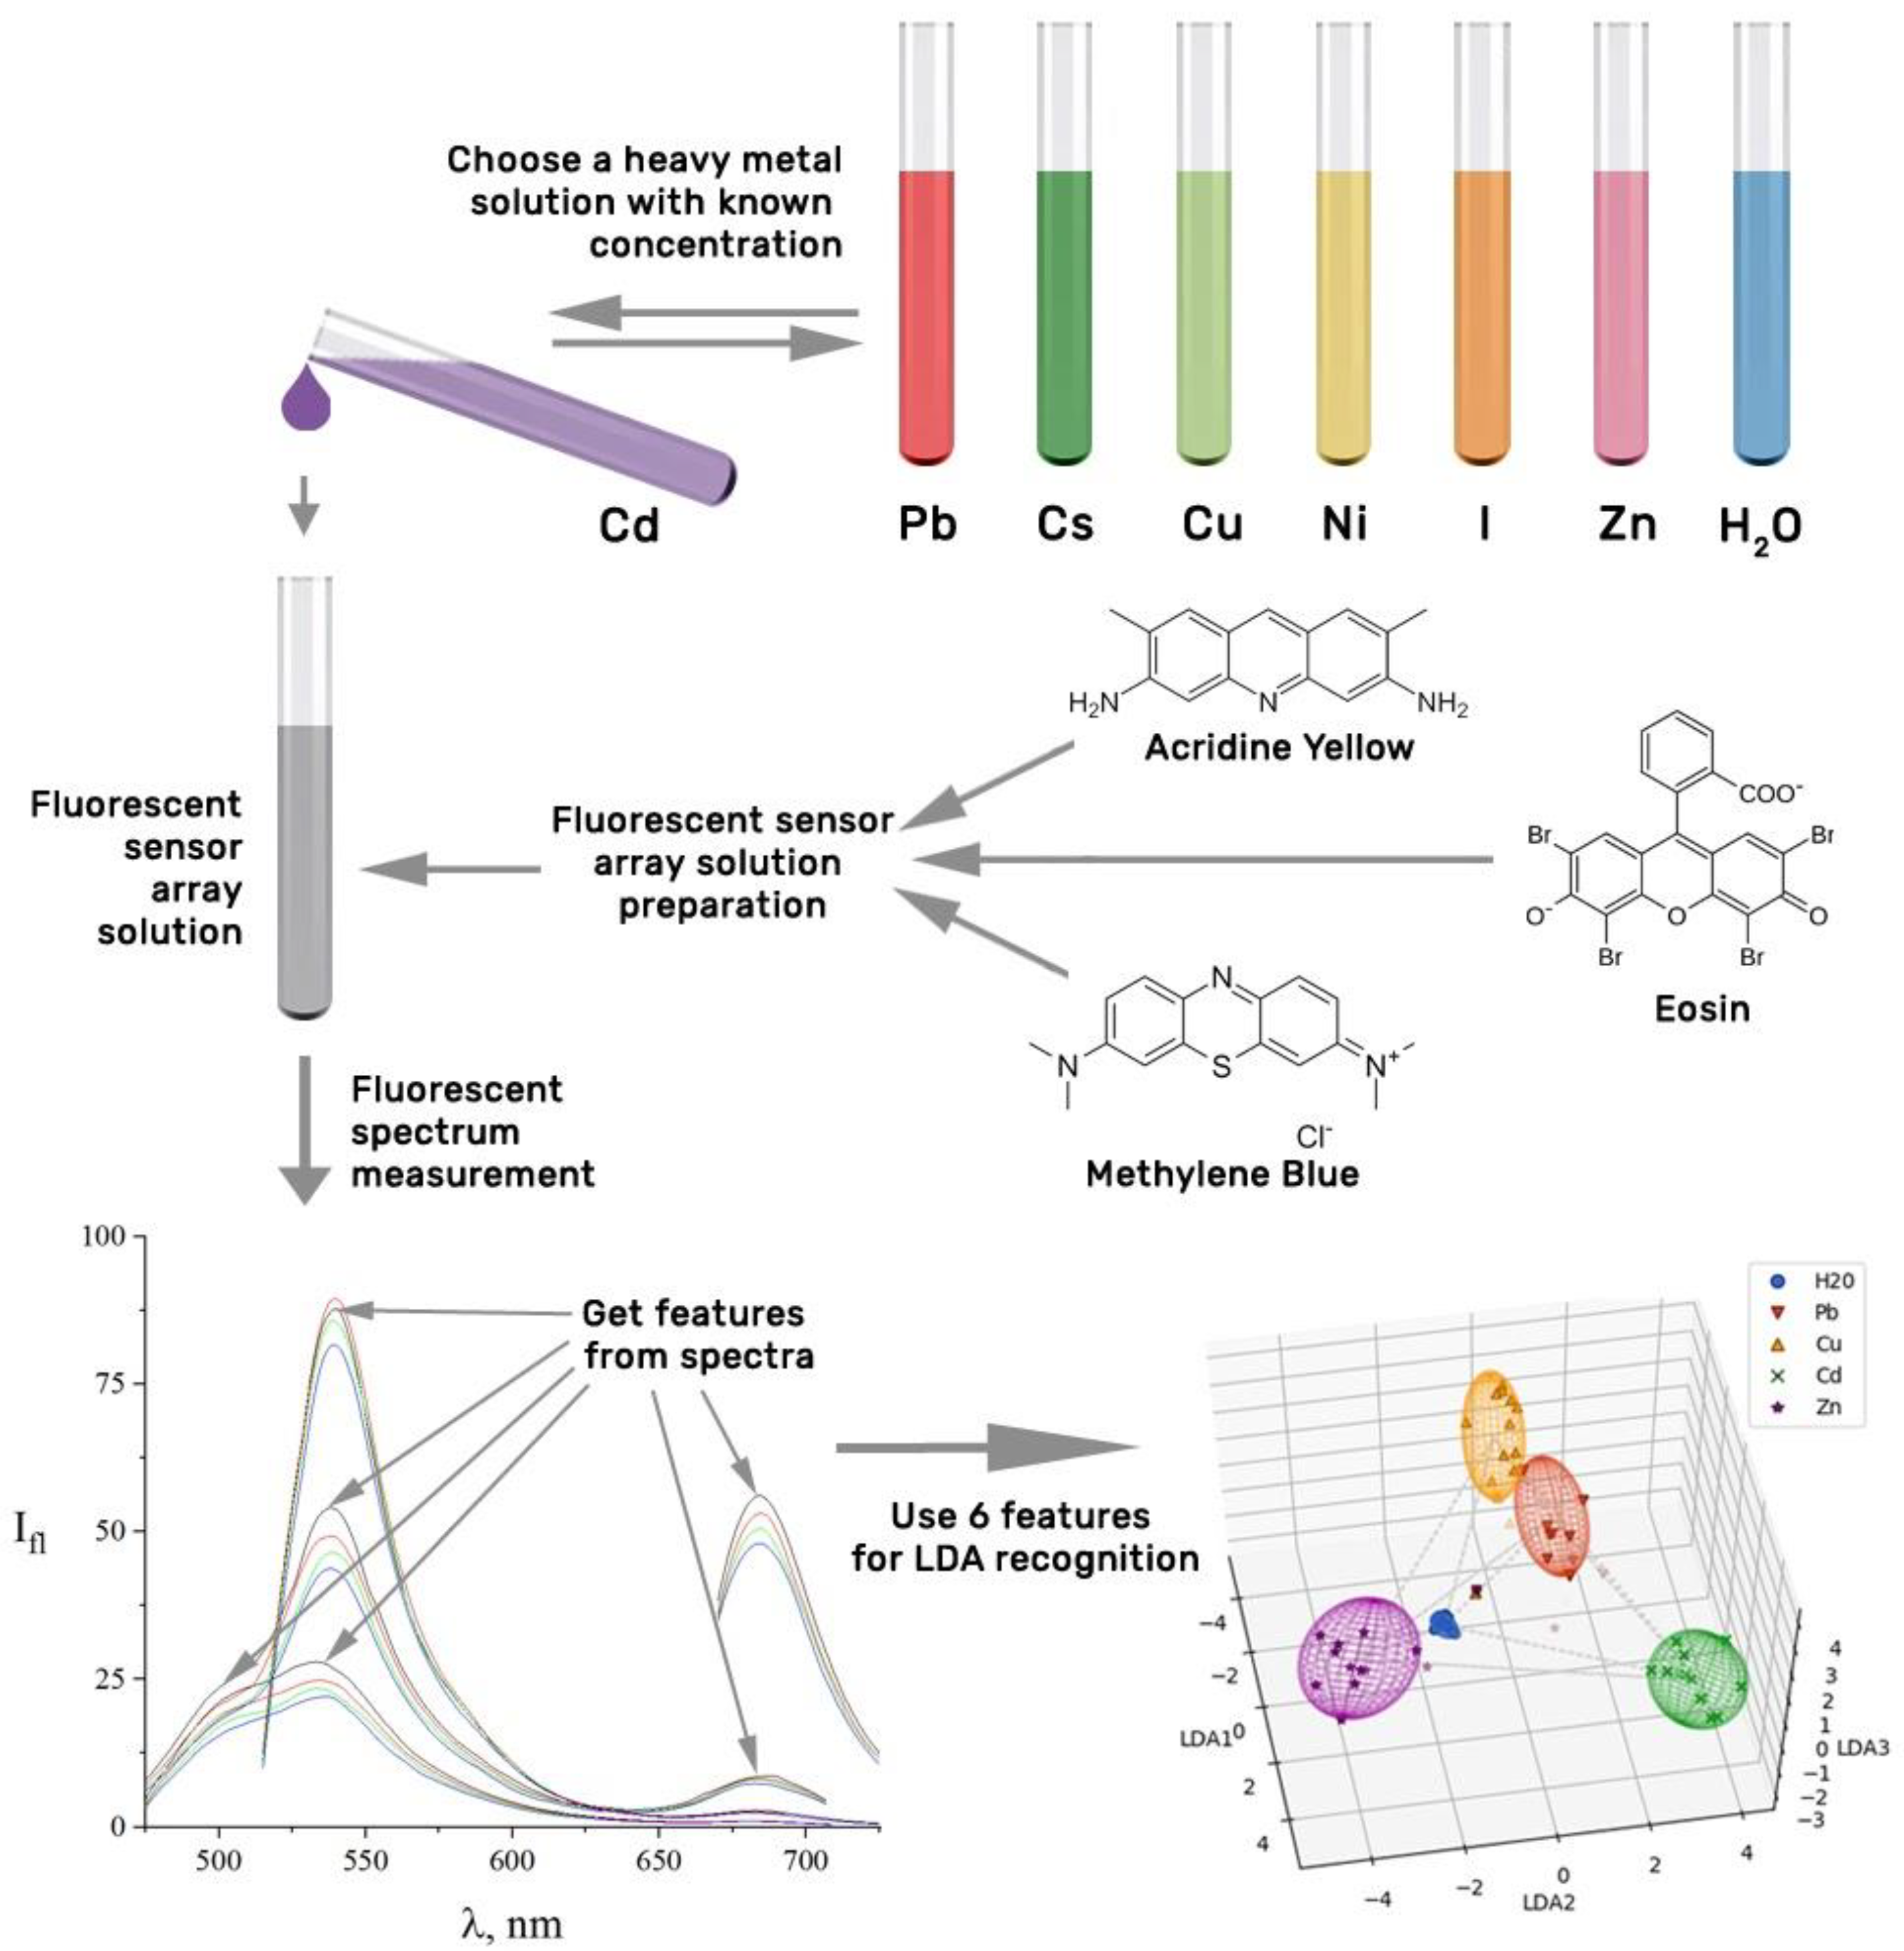
Abstract
:1. Introduction
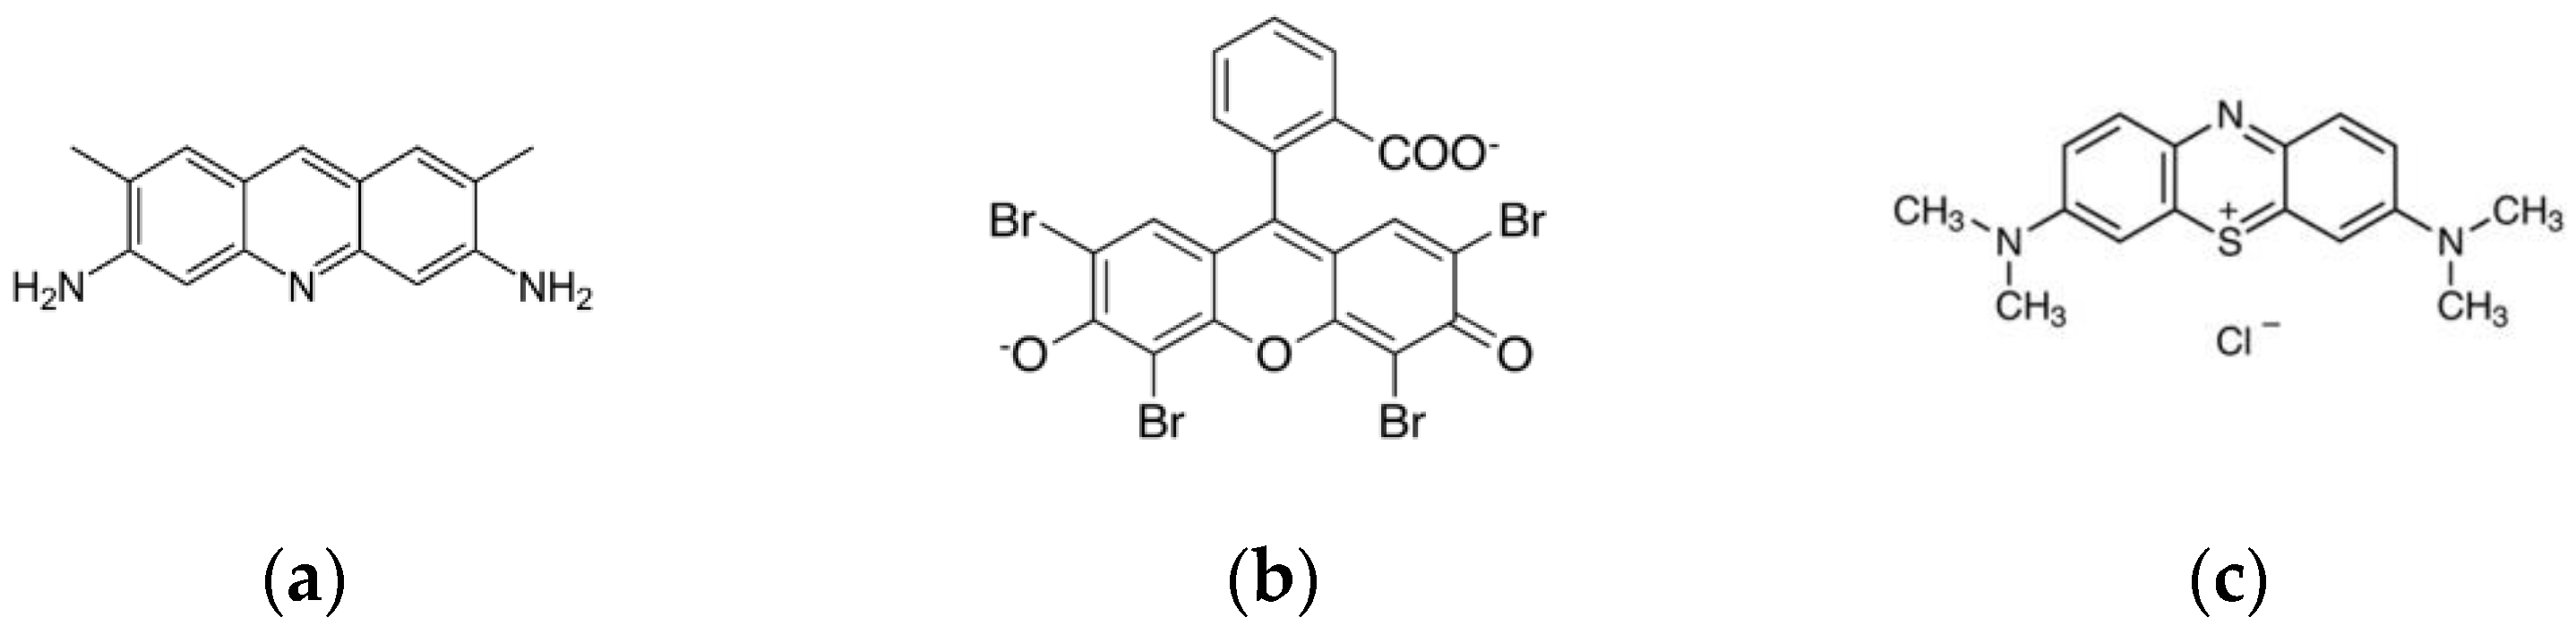
2. Materials and Methods
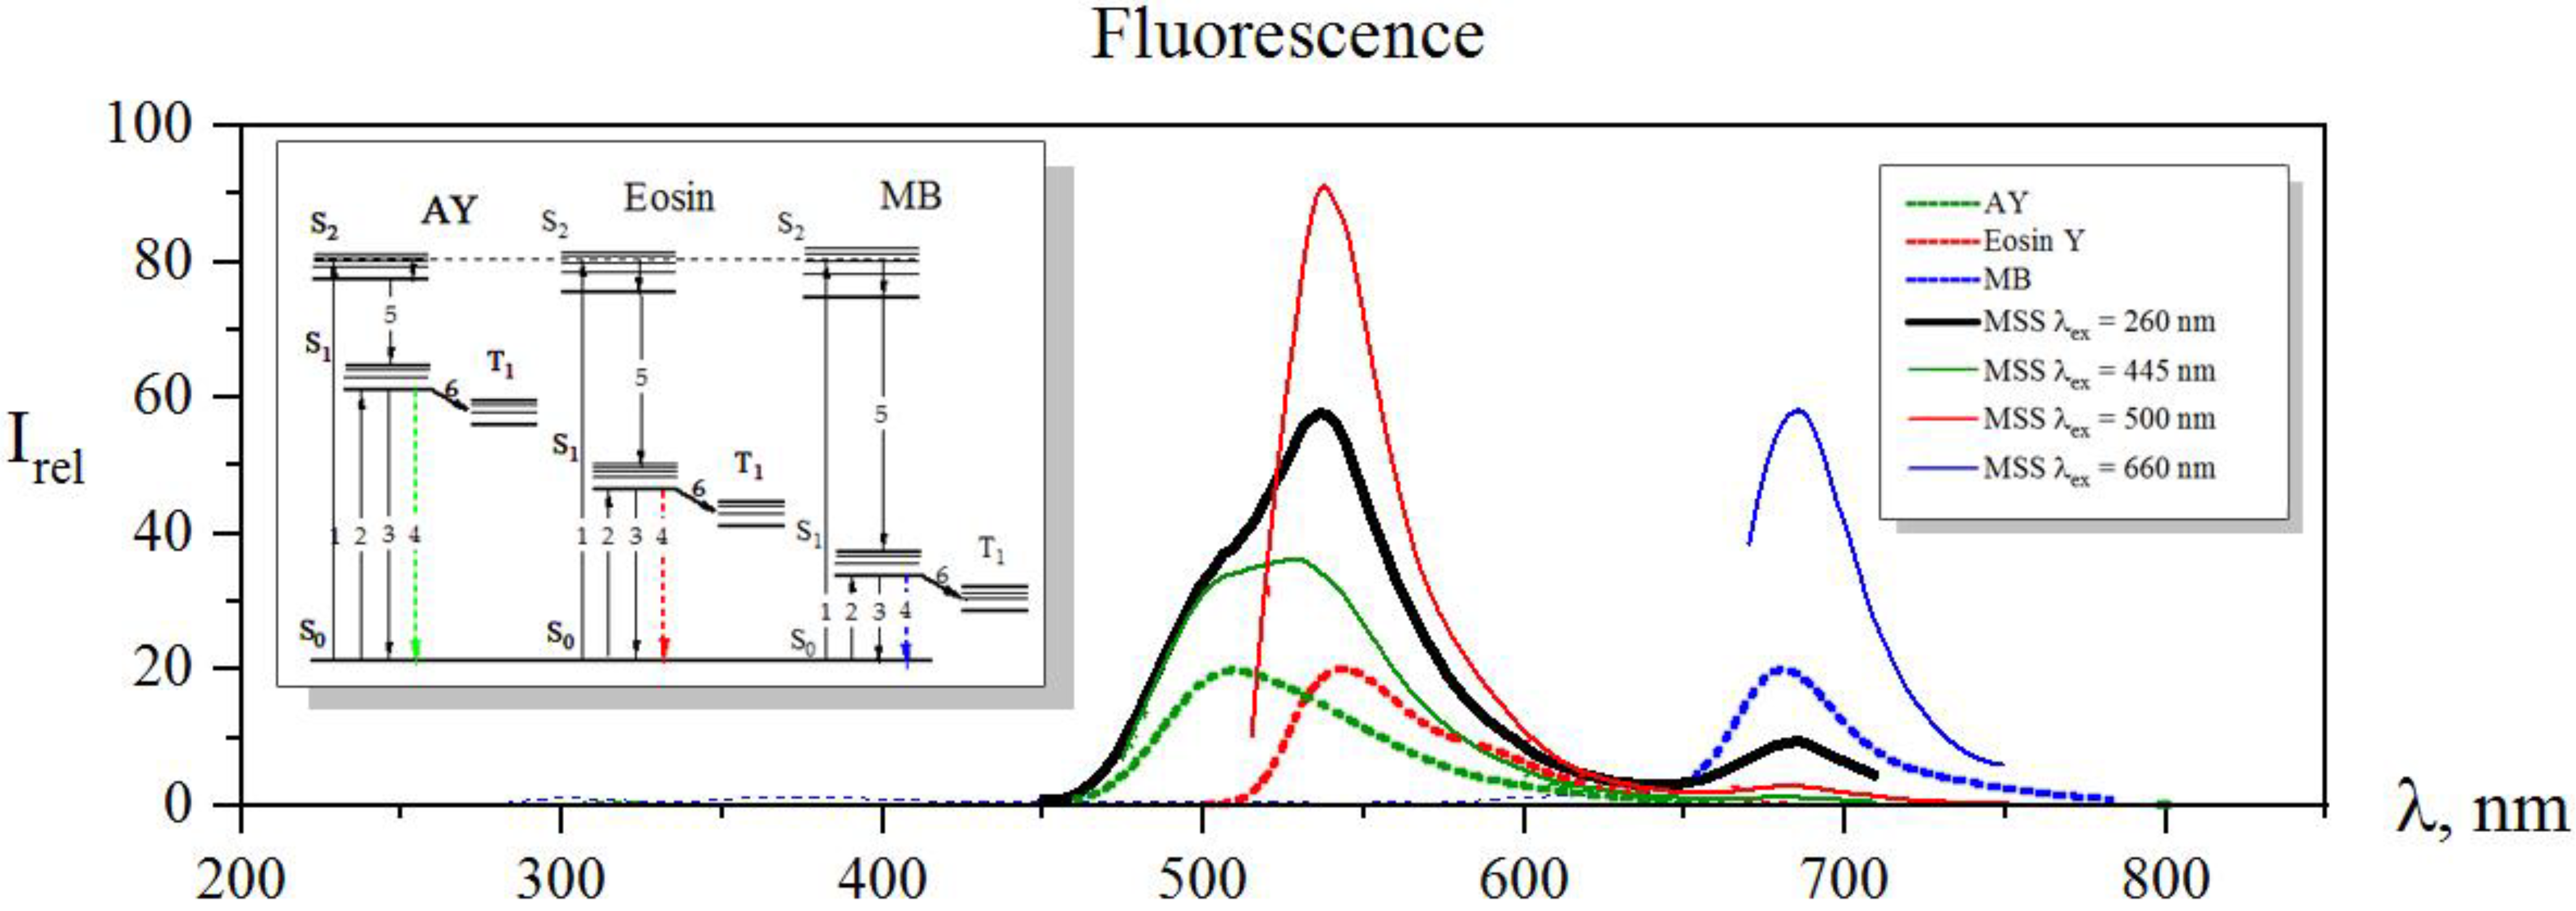
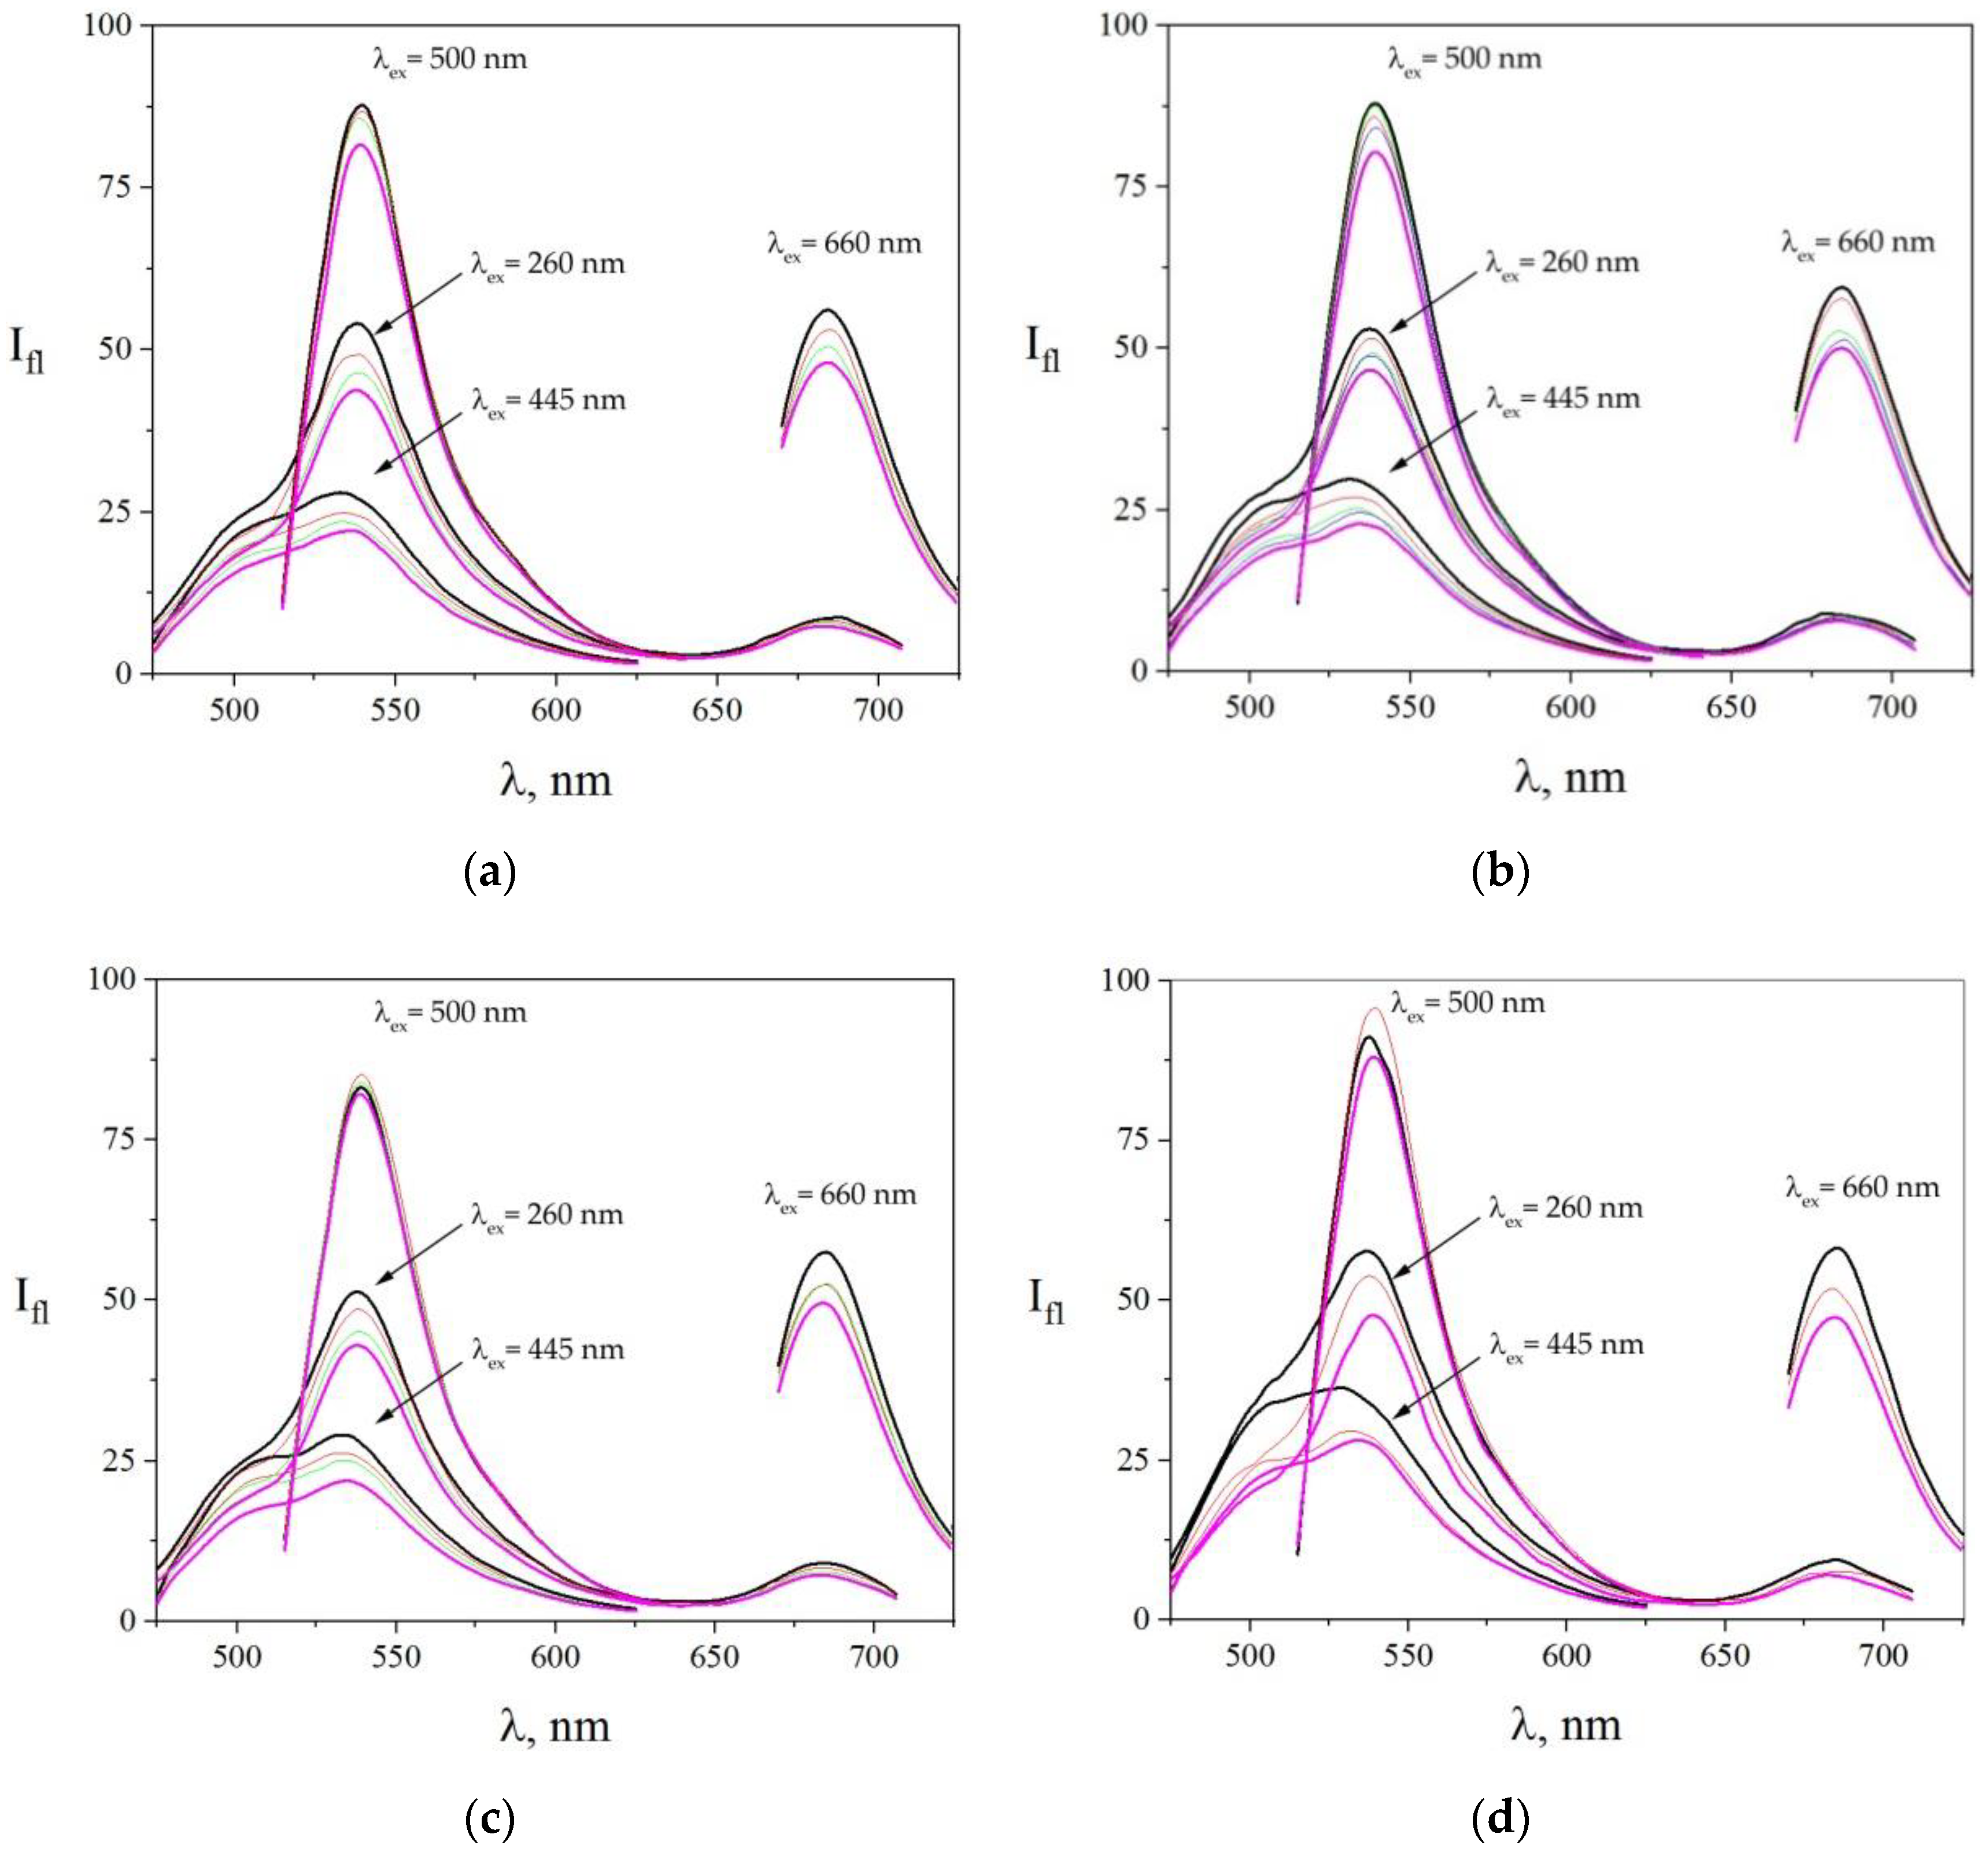
3. Results and Discussion
4. Conclusions
Author Contributions
Funding
Institutional Review Board Statement
Informed Consent Statement
Data Availability Statement
Acknowledgments
Conflicts of Interest
References
- Buledi, J.A.; Amin, S.; Haider, S.I.; Bhanger, M.I.; Solangi, A.R. A review on detection of heavy metals from aqueous media using nanomaterial-based sensors. Environ. Sci. Pollut. Res. 2020, 28, 58994–59002. [Google Scholar] [CrossRef] [PubMed]
- Smith, W.H. Air Pollution and Forests: Interactions between Air Contaminants and Forest Ecosystems; Springer Science & Business Media: Berlin/Heidelberg, Germany, 2012. [Google Scholar]
- Appelo, C.A.J.; Postma, D. Geochemistry, Groundwater and Pollution; CRC Press: Boca Raton, FL, USA, 2004. [Google Scholar]
- Zamora-Ledezma, C.; Negrete-Bolagay, D.; Figueroa, F.; Zamora-Ledezma, E.; Ni, M.; Alexis, F.; Guerrero, V.H. Heavy metal water pollution: A fresh look about hazards, novel and conventional remediation methods. Environ. Technol. Innov. 2021, 22, 101504. [Google Scholar] [CrossRef]
- Chibuike, G.U.; Obiora, S.C. Heavy metal polluted soils: Effect on plants and bioremediation methods. Appl. Environ. Soil Sci. 2014, 2014, e752708. [Google Scholar] [CrossRef] [Green Version]
- Li, C.; Zhou, K.; Qin, W.; Tian, C.; Qi, M.; Yan, X.; Han, W. A review on heavy metals contamination in soil: Effects, sources, and remediation techniques. Soil Sediment Contam. Int. J. 2019, 28, 380–394. [Google Scholar] [CrossRef]
- Que, E.L.; Domaille, D.W.; Chang, C.J. Metals in neurobiology: Probing their chemistry and biology with molecular imaging. Chem. Rev. 2008, 108, 1517–1549. [Google Scholar] [CrossRef]
- Jaishankar, M.; Tseten, T.; Anbalagan, N.; Mathew, B.B.; Beeregowda, K.N. Toxicity, mechanism and health effects of some heavy metals. Interdiscip. Toxicol. 2014, 7, 60–72. [Google Scholar] [CrossRef] [Green Version]
- Flora, S.J.S.; Mittal, M.; Mehta, A. Heavy metal induced oxidative stress & its possible reversal by chelation therapy. Indian J. Med. Res. 2008, 128, 501–523. [Google Scholar]
- Tchounwou, P.B.; Yedjou, C.G.; Patlolla, A.K.; Sutton, D.J. Heavy metal toxicity and the environment. In Molecular, Clinical and Environmental Toxicology; Experientia Supplementum; Luch, A., Ed.; Springer: Berlin/Heidelberg, Germany, 2012; Volume 101, pp. 133–164. [Google Scholar] [CrossRef] [Green Version]
- Eddaif, L.; Shaban, A.; Telegdi, J. Sensitive detection of heavy metals ions based on the calixarene derivatives-modified piezoelectric resonators: A review. Int. J. Environ. Anal. Chem. 2019, 99, 824–853. [Google Scholar] [CrossRef] [Green Version]
- Špirić, Z.; Vučković, I.; Stafilov, T.; Kušan, V.; Frontasyeva, M. Air pollution study in Croatia using moss biomonitoring and ICP-AES and AAS analytical techniques. Arch. Environ. Contam. Toxicol. 2013, 65, 33–46. [Google Scholar] [CrossRef]
- Drennan-Harris, L.R.; Wongwilawan, S.; Tyson, J.F. Trace determination of total mercury in rice by conventional inductively coupled plasma mass spectrometry. J. Anal. At. Spectrom. 2013, 28, 259–265. [Google Scholar] [CrossRef] [Green Version]
- Lee, S.; Bong, S.; Ha, J.; Kwak, M.; Park, S.-K.; Piao, Y. Electrochemical deposition of bismuth on activated graphene-nafion composite for anodic stripping voltammetric determination of trace heavy metals. Sens. Actuators B Chem. 2015, 215, 62–69. [Google Scholar] [CrossRef]
- Liang, Y.; Deng, B.; Shen, C.; Qin, X.; Liang, S. Determination of the binding sites and binding constants between Pb(II) and DNA using capillary electrophoresis combined with electrothermal atomic absorption spectrometry. J. Anal. At. Spectrom. 2015, 30, 903–908. [Google Scholar] [CrossRef]
- Palisoc, S.; Vitto, R.I.M.; Natividad, M. Determination of heavy metals in herbal food supplements using bismuth/multi-walled carbon nanotubes/Nafion modified graphite electrodes sourced from waste batteries. Sci. Rep. 2019, 9, 18491. [Google Scholar] [CrossRef]
- Willis, J.B. Determination of lead and other heavy metals in urine by atomic absorption spectroscopy. Anal. Chem. 1962, 34, 614–617. [Google Scholar] [CrossRef]
- Kenawy, I.M.M.; Hafez, M.A.H.; Akl, M.A.; Lashein, R.R. Determination by AAS of some trace heavy metal ions in some natural and biological samples after their preconcentration using newly chemically modified chloromethylated polystyrene-PAN ion-exchanger. Anal. Sci. 2000, 16, 493–500. [Google Scholar] [CrossRef] [Green Version]
- Mohamed, R.A.; Abdel-Lateef, A.M.; Mahmoud, H.H.; Helal, A.I. Determination of trace elements in water and sediment samples from Ismaelia Canal using ion chromatography and atomic absorption spectroscopy. Chem. Speciat. Bioavailab. 2012, 24, 31–38. [Google Scholar] [CrossRef]
- Venkata Subba Raju, O.; Prasad, P.M.N.; Rami Reddy, Y.V. Determination of heavy metals in ground water by Icp-MS in selected coastal areas of Spsr Nellore District, Andhra Pradesh, India. IJSR Int. J. Sci. Res. 2013, 2, 78–81. [Google Scholar] [CrossRef]
- Lewen, N.; Mathew, S.; Schenkenberger, M.; Raglione, T. A rapid ICP-MS screen for heavy metals in pharmaceutical compounds. J. Pharm. Biomed. Anal. 2004, 35, 739–752. [Google Scholar] [CrossRef]
- Zhao, F.; Chen, Z.; Zhang, F.; Li, R.; Zhou, J. Ultra-sensitive detection of heavy metal ions in tap water by laser-induced breakdown spectroscopy with the assistance of electrical-deposition. Anal. Methods 2010, 2, 408–414. [Google Scholar] [CrossRef]
- Chen, Y.; Zhang, Q.; Li, G.; Li, R.; Zhou, J. Laser ignition assisted spark-induced breakdown spectroscopy for the ultra-sensitive detection of trace mercury ions in aqueous solutions. J. Anal. At. Spectrom. 2010, 25, 1969–1973. [Google Scholar] [CrossRef]
- Lee, Y.; Oh, S.-W.; Hanb, S.-H. Laser-induced breakdown spectroscopy (LIBS) of heavy metal ions at the sub-parts per million level in water. Appl. Spectrosc. 2012, 66, 1385–1396. [Google Scholar] [CrossRef] [PubMed]
- Guinn, V.P.; Wagner, C.D. Instrumental neutron activation analysis. Anal. Chem. 1960, 32, 317–323. [Google Scholar] [CrossRef]
- Glascock, M. An Overview of Neutron Activation Analysis. 2003. Available online: http://fs.teledos.gr:2206/%3ERESEARCH%20PUBLICATIONS/NUCLEAR%20TECHNOLOGY%20-%20ENGINEERING/Elemental%20Analysis/An%20Overview%20of%20Neutron%20Activation%20Analysis.%20M.%20D.%20Glascock.pdf (accessed on 20 December 2021).
- Yusuf, S.; Fisli, A.; Wardhani, S. The role of NAA in the environmental studies. Quantitative determination of heavy metals pollutant on environmental samples. In Proceedings of the JAERI-CONF-2003–004, Tokai, Japan, 7 March 2003; Volume 37, p. 37002233. [Google Scholar] [CrossRef]
- Spelthahn, H.; Kirsanov, D.; Legin, A.; Osterrath, T.; Schubert, J.; Zander, W.; Schöning, M.J. Development of a thin-film sensor array for analytical monitoring of heavy metals in aqueous solutions. Phys. Stat. Sol. (A) Appl. Mater. Sci. 2012, 209, 885–891. [Google Scholar] [CrossRef]
- Lu, Y.; Liang, X.; Niyungeko, C.; Zhou, J.; Xu, J.; Tian, G. A review of the identification and detection of heavy metal ions in the environment by voltammetry. Talanta 2018, 178, 324–338. [Google Scholar] [CrossRef] [PubMed]
- Emons, H.; Baade, A.; Schöning, M.J. Voltammetric determination of heavy metals in microvolumes of rain water. Electroanalysis 2000, 12, 1171–1176. [Google Scholar] [CrossRef]
- Papkovsky, D.B.; Papkovskaia, N.; Smyth, A.; Kerry, J.; Ogurtsov, V.I. Phosphorescent sensor approach for non-destructive measurement of oxygen in packaged foods: Optimisation of disposable oxygen sensors and their characterization over a wide temperature range. Anal. Lett. 2000, 33, 1755–1777. [Google Scholar] [CrossRef]
- Hassoun, A.; Sahar, A.; Lakhal, L.; Aït-Kaddour, A. Fluorescence spectroscopy as a rapid and non-destructive method for monitoring quality and authenticity of fish and meat products: Impact of different preservation conditions. LWT 2019, 103, 279–292. [Google Scholar] [CrossRef]
- Geddes, C.D. Optical halide sensing using fluorescence quenching: Theory, simulations and applications—A review. Meas. Sci. Technol. 2001, 12, R53. [Google Scholar] [CrossRef] [Green Version]
- De Acha, N.; Elosúa, C.; Corres, J.M.; Arregui, F.J. Fluorescent sensors for the detection of heavy metal ions in aqueous media. Sensors 2019, 19, 599. [Google Scholar] [CrossRef] [Green Version]
- Lian, J.; Xu, Q.; Wang, Y.; Meng, F. Recent developments in fluorescent materials for heavy metal ions analysis from the perspective of forensic chemistry. Front. Chem. 2020, 8, 593291. [Google Scholar] [CrossRef]
- Nurerk, P.; Kanatharana, P.; Bunkoed, O. A selective determination of copper ions in water samples based on the fluorescence quenching of thiol-capped CdTe quantum dots. Luminescence 2016, 31, 515–522. [Google Scholar] [CrossRef] [PubMed]
- Wu, F.-Y.; Bae, S.W.; Hong, J.-I. A selective fluorescent sensor for Pb(II) in water. Tetrahedron Lett. 2006, 47, 8851–8854. [Google Scholar] [CrossRef]
- Antony, E.J.; Raj, M.; Paulpandi, R.Q.; Paulraj, M.S.; Enoch, I.V.M.V. A highly selective fluorescent sensor for Pb2+ based on a modified β-cyclodextrin. J. Fluoresc. 2015, 25, 1031–1036. [Google Scholar] [CrossRef]
- Wan, J.; Duan, W.; Chen, K.; Tao, Y.; Dang, J.; Zeng, K.; Ge, Y.; Wu, J.; Liu, D. Selective and sensitive detection of Zn(II) ion using a simple peptide-based sensor. Sens. Actuators B Chem. 2018, 255, 49–56. [Google Scholar] [CrossRef]
- Vendrell, M.; Zhai, D.; Er, J.C.; Chang, Y.-T. Combinatorial strategies in fluorescent probe development. Chem. Rev. 2012, 112, 4391–4420. [Google Scholar] [CrossRef] [PubMed]
- Shieh, P.; Dien, V.T.; Beahm, B.J.; Castellano, J.M.; Wyss-Coray, T.; Bertozzi, C.R. CalFluors: A universal motif for fluorogenic azide probes across the visible spectrum. J. Am. Chem. Soc. 2015, 137, 7145–7151. [Google Scholar] [CrossRef] [PubMed] [Green Version]
- Kobayashi, H.; Longmire, M.R.; Ogawa, M.; Choyke, P.L. Rational chemical design of the next generation of molecular imaging probes based on physics and biology: Mixing modalities, colors and signals. Chem. Soc. Rev. 2011, 40, 4626–4648. [Google Scholar] [CrossRef] [Green Version]
- Costa, F.S.L.; Silva, P.P.; Morais, C.L.M.; Theodoro, R.C.; Arantes, T.D.; Lima, K.M.G. Comparison of multivariate classification algorithms using EEM fluorescence data to distinguish: Cryptococcus neoformans and Cryptococcus gattii pathogenic fungi. Anal. Methods 2017, 9, 3968–3976. [Google Scholar] [CrossRef]
- Dankowska, A.; Małecka, M.; Kowalewski, W. Detection of plant oil addition to cheese by synchronous fluorescence spectroscopy. Dairy Sci. Technol. 2015, 95, 413–424. [Google Scholar] [CrossRef] [Green Version]
- Chen, L.; Li, L.; Wu, D.; Tian, X.; Xia, D.; Lu, L.; Yang, C.; Nie, Y. Construction of multi-channel fluorescence sensor array and its application for accurate identification and sensitive quantification of multiple metal ions. Sens. Actuators B Chem. 2020, 303, 127277. [Google Scholar] [CrossRef]
- Smith, D.G.; Mitchell, L.; New, E.J. Pattern recognition of toxic metal ions using a single-probe thiocoumarin array. Analyst 2019, 144, 230–236. [Google Scholar] [CrossRef] [PubMed] [Green Version]
- Cao, Z.; Cao, Y.; Kubota, R.; Sasaki, Y.; Asano, K.; Lyu, X.; Zhang, Z.; Zhou, Q.; Zhao, X.; Xu, X.; et al. Fluorescence anion chemosensor array based on pyrenylboronic acid. Front. Chem. 2020, 8, 414. [Google Scholar] [CrossRef] [PubMed]
- Moczko, E.; Mirkes, E.M.; Cáceres, C.; Gorban, A.N.; Piletsky, S. Fluorescence-based assay as a new screening tool for toxic chemicals. Sci. Rep. 2016, 6, 33922. [Google Scholar] [CrossRef] [PubMed] [Green Version]
- He, W.; Luo, L.; Liu, Q.; Chen, Z. Colorimetric sensor array for discrimination of heavy metal ions in aqueous solution based on three kinds of thiols as receptors. Anal. Chem. 2018, 90, 4770–4775. [Google Scholar] [CrossRef]
- Gruzina, T.G.; Zadorozhnyaya, A.M.; Gutnik, G.A.; Vember, V.V.; Ulberg, Z.R.; Kanyuk, N.I.; Starodub, N.F. A bacterial multisensor for determination of the contents of heavy metals in water. J. Water Chem. Technol. 2007, 29, 50–53. [Google Scholar] [CrossRef]
- Margulies, D.; Rout, B. Multi-Sensor Array Compound and Methods of Use Thereof. U.S. Patent 10,017,525, 16 July 2013. [Google Scholar]
- Melnikov, A.G.; Melnikov, G.V.; Varezhnikov, A.S.; Efremova, V.V.; Kuenbaeva, V.R.; Dykin, V.S.; Sysoev, V.V. The fluorescencent multi-sensor array to selectively detect a presence of various heavy metals in aqua solutions. In Proceedings of the 2016 International Conference on Actual Problems of Electron Devices Engineering, APEDE, Saratov, Russia, 22–23 September 2016; Volume 2, p. 7879034. [Google Scholar] [CrossRef]
- Derayea, S.M.; Nagy, D.M. Application of a xanthene dye, eosin y, as spectroscopic probe in chemical and pharmaceutical analysis; A review. Rev. Anal. Chem. 2018, 37, 20170020. [Google Scholar] [CrossRef]
- Abolghasemi, M.-M.; Ghorbani-Cheghamarani, A.; Babakhanian, A. A novel electrochemical sensing platform based on Pt/PPy/Eosin-Y for the determination of cadmium. New J. Chem. 2017, 41, 11335–11341. [Google Scholar] [CrossRef]
- Teuber, M.; Rögner, M.; Berry, S. Fluorescent probes for non-invasive bioenergetic studies of whole cyanobacterial cells. Biochim. Et Biophys. Acta Bioenerg. 2001, 1506, 31–46. [Google Scholar] [CrossRef]
- Kulikova, T.; Porfireva, A.; Rogov, A.; Evtugyn, G. Electrochemical DNA sensor based on acridine yellow adsorbed on glassy carbon electrode. Sensors 2021, 21, 7763. [Google Scholar] [CrossRef]
- Liu, S.P.; Sa, C.; Hu, X.L.; Kong, L. Fluorescence quenching method for the determination of sodium carboxymethyl cellulose with acridine yellow or acridine orange. Spectrochim. Acta-Part A Mol. Biomol. Spectrosc. 2006, 64, 817–822. [Google Scholar] [CrossRef]
- Amat, A.M.; Arques, A.; Galindo, F.; Miranda, M.A.; Santos-Juanes, L.; Vercher, R.F.; Vicente, R. Acridine yellow as solar photocatalyst for enhancing biodegradability and eliminating ferulic acid as model pollutant. Appl. Catal. B Environ. 2007, 73, 220–226. [Google Scholar] [CrossRef]
- Xu, L.; Yan, X.; Yuan, C. An unexpected dual-response pH probe based on acridine. RSC Adv. 2018, 8, 35289–35293. [Google Scholar] [CrossRef] [Green Version]
- Ginimuge, P.R.; Jyothi, S.D. Methylene blue: Revisited. J. Anaesthesiol. Clin. Pharmacol. 2010, 26, 517–520. [Google Scholar] [PubMed]
- Selvam, S.; Sarkar, I. Bile salt induced solubilization of methylene blue: Study on methylene blue fluorescence properties and molecular mechanics calculation. J. Pharm. Anal. 2017, 7, 71–75. [Google Scholar] [CrossRef] [PubMed]
- Huang, X.; Li, Z.; Cao, T.; Cai, Q.; Zeng, C.; Fu, H.; Hu, L. A methylene blue-based near-infrared fluorescent probe for rapid detection of hypochlorite in tap water and living cells. RSC Adv. 2018, 8, 14603–14608. [Google Scholar] [CrossRef] [Green Version]
- Yaroslavsky, A.N.; Feng, X.; Muzikansky, A.; Hamblin, M.R. Fluorescence polarization of methylene blue as a quantitative marker of breast cancer at the cellular level. Sci. Rep. 2019, 9, 940. [Google Scholar] [CrossRef] [PubMed]
- Olmsted, J., III. Calorimetric determinations of absolute fluorescence quantum yields. J. Phys. Chem. 1979, 83, 2581–2584. [Google Scholar] [CrossRef]
- Seybold, P.G.; Gouterman, M.; Callis, J. Calorimetric, photometric and lifetime determinations of fluorescence yields of fluorescein dyes. Photochem. Photobiol. 1969, 9, 229–242. [Google Scholar] [CrossRef]
- Redmond, R.W.; Gamlin, J.N. A compilation of singlet oxygen yields from biologically relevant molecules. Photochem. Photobiol. 1999, 70, 391–475. [Google Scholar] [CrossRef]
- Pedregosa, F.; Varoquaux, G.; Gramfort, A.; Michel, V.; Thirion, B.; Grisel, O.; Blondel, M.; Prettenhofer, P.; Weiss, R.; Dubourg, V.; et al. Scikit-learn: Machine learning in Python. J. Mach. Learn. Res. 2011, 12, 2825–2830. [Google Scholar] [CrossRef]
- Arunjegan, A.; Rajaji, P.; Sivanesan, S.; Panneerselvam, P. A Turn-ON fluorometric biosensor based on ssDNA immobilized with a metal phenolic nanomaterial for the sequential detection of Pb(ii) and epirubicin cancer drug. RSC Adv. 2021, 11, 12361–12373. [Google Scholar] [CrossRef]
- Wu, G.; Li, M.; Zhu, J.; Lai, K.W.C.; Tong, Q.; Lu, F. A highly sensitive and selective turn-on fluorescent probe for Pb(II) ions based on a coumarin-quinoline platform. RSC Adv. 2016, 6, 100696–100699. [Google Scholar] [CrossRef]
- Chae, M.-Y.; Yoon, J.; Czarnik, A.W. Chelation-enhanced fluorescence chemosensing of Pb(II), an inherently quenching metal ion. J. Mol. Recognit. 1996, 9, 297–303. [Google Scholar] [CrossRef]
- Sysoev, V.V.; Kiselev, I.; Trouillet, V.; Bruns, M. Enhancing the gas selectivity of single-crystal SnO2:Pt thin-film chemiresistor microarray by SiO2 membrane coating. Sens. Actuators B Chem. 2013, 185, 59–69. [Google Scholar] [CrossRef]


Publisher’s Note: MDPI stays neutral with regard to jurisdictional claims in published maps and institutional affiliations. |
© 2022 by the authors. Licensee MDPI, Basel, Switzerland. This article is an open access article distributed under the terms and conditions of the Creative Commons Attribution (CC BY) license (https://creativecommons.org/licenses/by/4.0/).
Share and Cite
Melnikov, A.G.; Bykov, D.A.; Varezhnikov, A.S.; Sysoev, V.V.; Melnikov, G.V. Toward a Selective Analysis of Heavy Metal Salts in Aqueous Media with a Fluorescent Probe Array. Sensors 2022, 22, 1465. https://doi.org/10.3390/s22041465
Melnikov AG, Bykov DA, Varezhnikov AS, Sysoev VV, Melnikov GV. Toward a Selective Analysis of Heavy Metal Salts in Aqueous Media with a Fluorescent Probe Array. Sensors. 2022; 22(4):1465. https://doi.org/10.3390/s22041465
Chicago/Turabian StyleMelnikov, Andrey G., Denis A. Bykov, Alexey S. Varezhnikov, Victor V. Sysoev, and Gennady V. Melnikov. 2022. "Toward a Selective Analysis of Heavy Metal Salts in Aqueous Media with a Fluorescent Probe Array" Sensors 22, no. 4: 1465. https://doi.org/10.3390/s22041465
APA StyleMelnikov, A. G., Bykov, D. A., Varezhnikov, A. S., Sysoev, V. V., & Melnikov, G. V. (2022). Toward a Selective Analysis of Heavy Metal Salts in Aqueous Media with a Fluorescent Probe Array. Sensors, 22(4), 1465. https://doi.org/10.3390/s22041465