
Classification of Two Volatiles Using an eNose Composed by an Array of 16 Single-Type Miniature Micro-Machined Metal-Oxide Gas Sensors


Abstract
:1. Introduction
New Contribution
2. Background

| Year | Reference | V (V) | I (A) | P (W) | MOX | Other non-MOX | Classification Method | Volatiles Detected | ||
|---|---|---|---|---|---|---|---|---|---|---|
| Number | Types | Number | Types | |||||||
| This paper | 5 | 0.18 | 0.9 | 16 | 1 | 0 | 0 | PCA [36]-kNN | 2 | |
| 2021 | Burgués [35] | - | - | 1.0 | 16 | 4 | 5 | 2 | PLSR [37] | 1 A |
| 2020 | Arroyo [38] | 5 | 0.19 | 0.9 | 4 | 4 | 0 | 0 | NN [39] | 2C |
| 2020 | Burgués [40] | - | - | - | 27 | 5 | 0 | 0 | None | 1 C |
| 2020 | Tiele [41] | 12 | - | - | 10 | 10 G | 1 | 1 | PCA [36] | 3 C |
| 2019 | Palacín [34] | 12 | 1.0 | 12.0 | 16 | 4 | 0 | 0 | PLS-DA [42] | 2 |
| 2019 | Fan [43] | - | - | - | 2 | 2 | 3 | 3 | OCGM-OCNN | 3 C |
| 2018 | Burgués [31] | - | - | - | 7 | 1 | 0 | 0 | None | 1 C |
| 2018 | Burgués [32] | - | - | - | 6 + 3+3 D | 1 | 0 | 0 | PLS [44] | 1 C |
| 2018 | Gongora [45] | - | - | - | 6 | 5 | 1 | 1 | DNN | 10 |
| 2017 | Monroy [46] | - | - | - | 10 | 8 | 0 | 0 | PCA-SVM | 2 |
| 2016 | Rossi [33] | - | - | 2 × 0.76 | 2 | 2 | 0 | 0 | Threshold | 1 A,C |
| 2016 | Schleif [47] | - | - | - | 5 | 5 | 0 | 0 | SGTM-TT | 4 |
| 2016 | Fonollosa [48] | - | - | - | 5 × 8 | 4 | 0 | 0 | SVM [49]-SVR | 4 C |
| 2015 | Vries [50] | - | - | - | 5 × 4 | - | 0 | 0 | PCA-ANOVA | 4 |
| 2015 | Westenbrink [4] | - | - | - | 8 G | - | 3 | 2 | LDA [51]-kNN | 3 |
| 2015 | Fonollosa [52] | - | - | - | 16 | 4 | 0 | 0 | RC [53] | 2 A,E |
| 2014 | Marco [30] | - | - | - | 96 | 12 | 4 × 4096 | 31 | PCA [36]-PLS | 2 |
| 2014 | Rossi [54] | - | - | 0.130 | 8 G | - | - | - | - | - |
| 2014 | Sanchez [55] | - | - | - | 8 | 4 | 0 | 0 | None | 1 A |
| 2014 | Monroy [56] | - | - | - | 7 | 7 | 0 | 0 | Kernel DM+V | 1 A |
| 2014 | Bennetts [57] | - | - | - | 3 | 3 | 0 | 0 | PCA [36] | 2 |
| 2013 | Savarese [58] | - | - | - | 10 | - | 0 | 0 | PCA [36] | 2 F |
| 2013 | Monroy [59] | - | - | - | 11 | 9 | 0 | 0 | Regression | 1 A |
| 2012 | Vergara [60] | - | - | - | 16 | 4 | 0 | 0 | SVM | 6 C |
| 2012 | Bennetts [29] | - | - | - | 6 | 1 | 0 | 0 | MV RV M [61] | 2 |
| 2012 | Aguilera [62] | - | - | - | 16 | 16 G | 0 | 0 | ICA [63]-PLS-ANN | 15 F |
| 2012 | Brudzewski [64] | - | - | - | 2 B × 12 | 8 | 0 | 0 | PCA-SVM [49] | 5, 11 F |
| 2011 | Haddi [65] | - | - | - | 6 | 6 | 0 | 0 | PCA-SVM [49] | 5 F |
| 2011 | Gonzalez [66] | - | - | - | 4 B × 7 | 7 | 0 | 0 | None | 1 A |
| 2010 | Brudzewski [67] | - | - | - | 2 B × 12 | 8 | 0 | 0 | 2D convolution | 6 F |
| 2010 | Guo [68] | - | - | - | 12 | 12 | 0 | 0 | PCA [36]-kNN | 4 F |
| 2010 | Mildner [69] | - | - | - | 3 × 6 | - | 0 | 0 | 2 × PCA [36]-PLS | 3 F |
| 2009 | Lilienthal [70] | - | - | - | 6 | 5 | 0 | 0 | Kernel DM + V | 1 C |
| … | ||||||||||
| 2002 | Arnold [28] | - | - | - | 38 | 1 G | 0 | 0 | PCA-LDA [51] | 2 E, 1 A |
| … | ||||||||||
| 1998 | Marco [26] | - | - | - | 6 | 3 + 3 G | 0 | 0 | SOM [27] | 6 |
| … | ||||||||||
| 1982 | Persaud [25] | - | - | - | 3 | 3 | 0 | 0 | - | E, F |
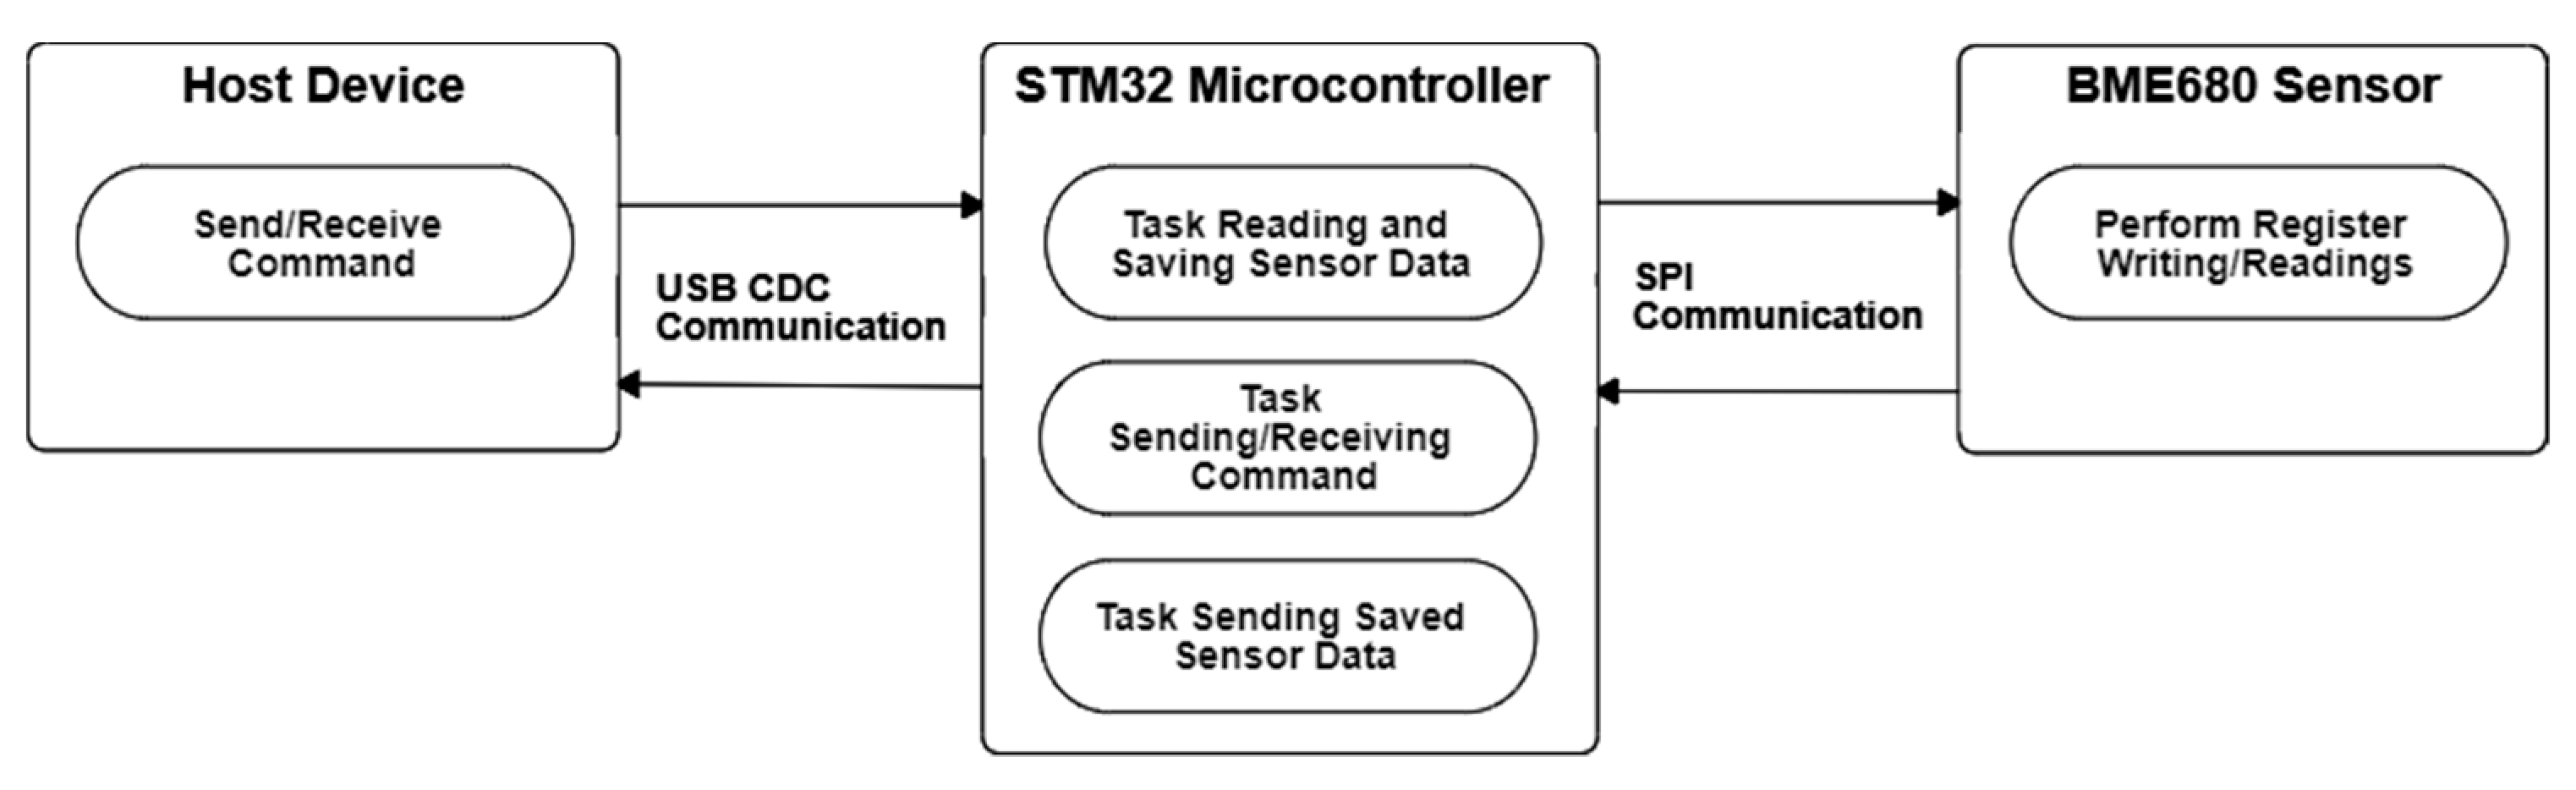
3. Materials and Methods
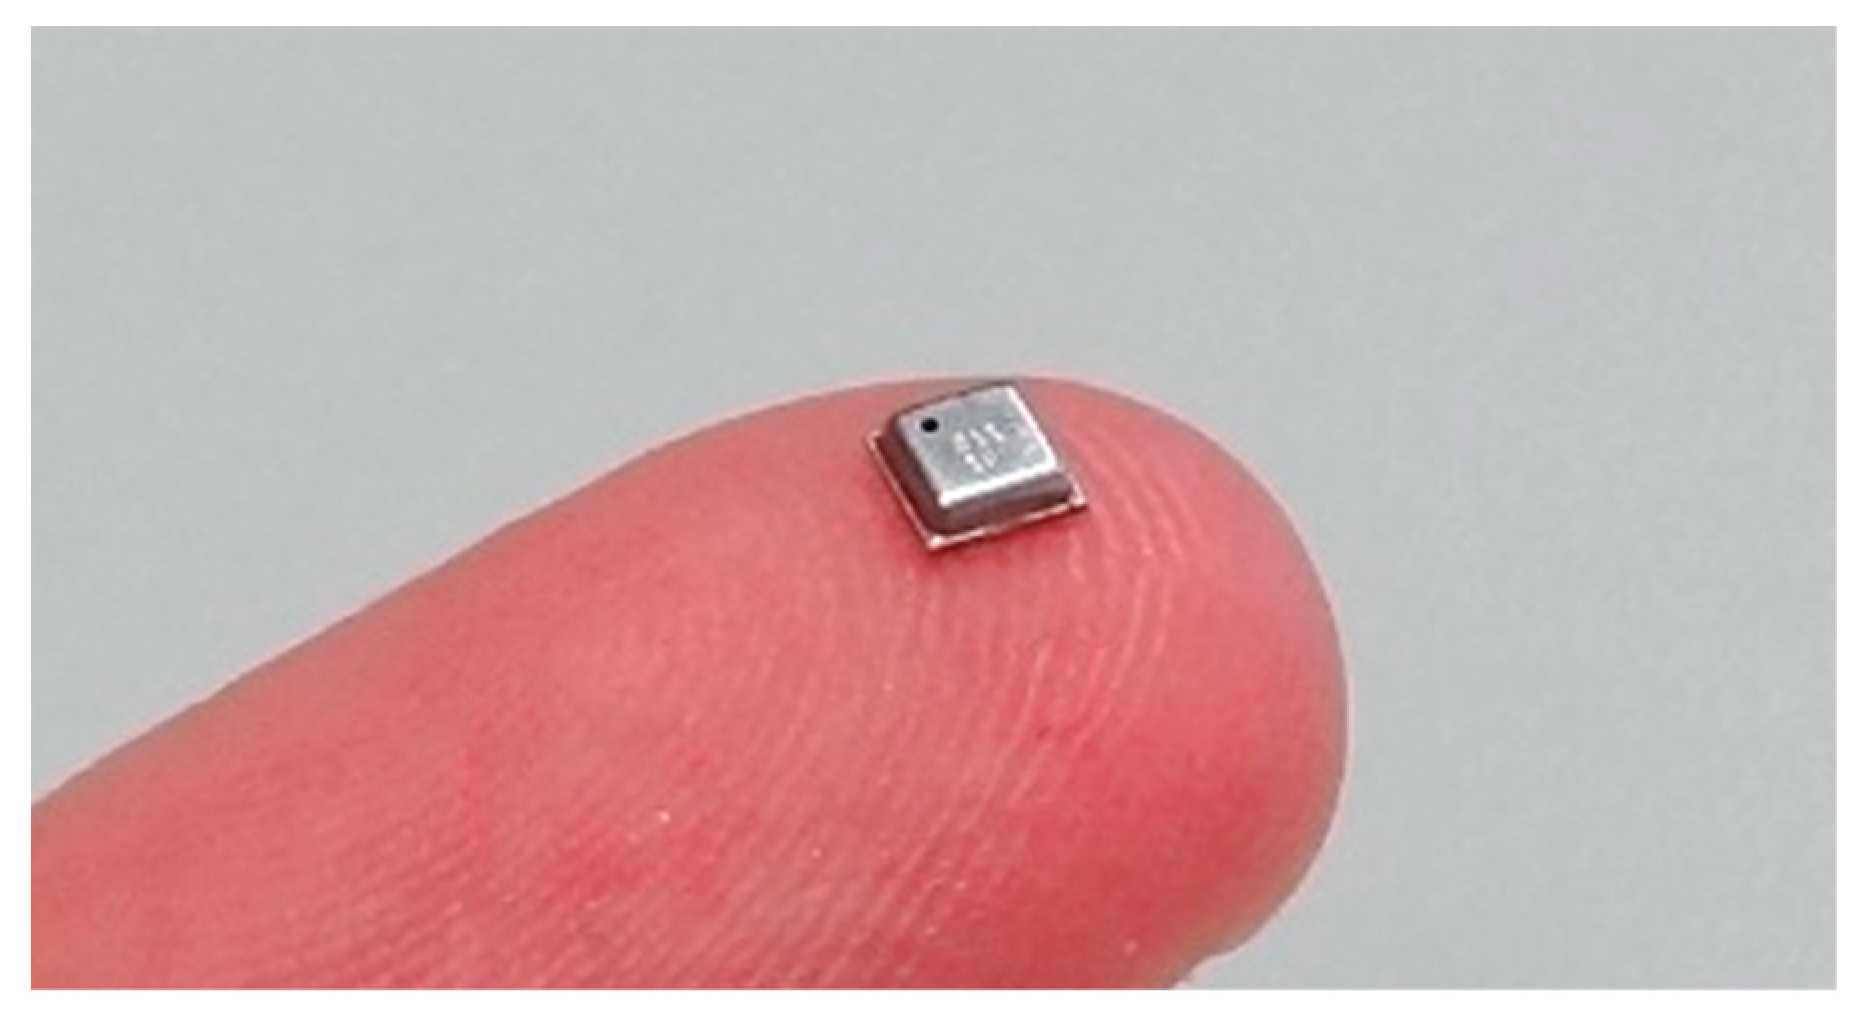
3.1. BME680 Sensor
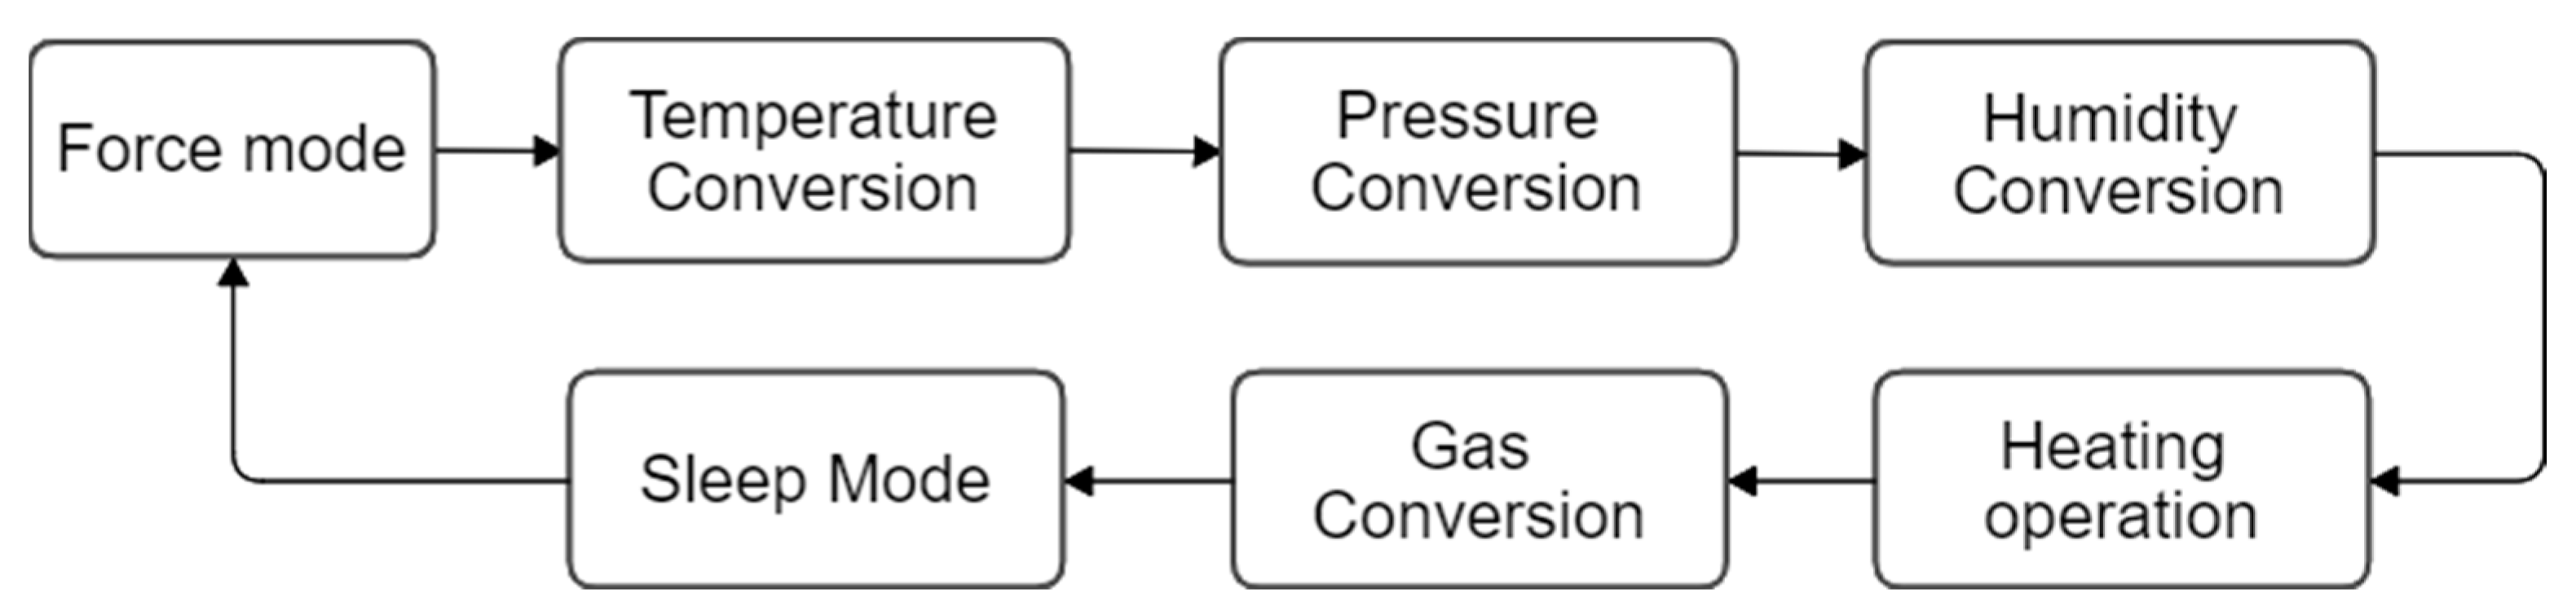
3.1.1. Operation of the BME680 Sensor
3.1.2. Configuration of the BME680
3.1.3. Measurement of the Resistance of the Sensing Layer of the MOX Gas Sensor
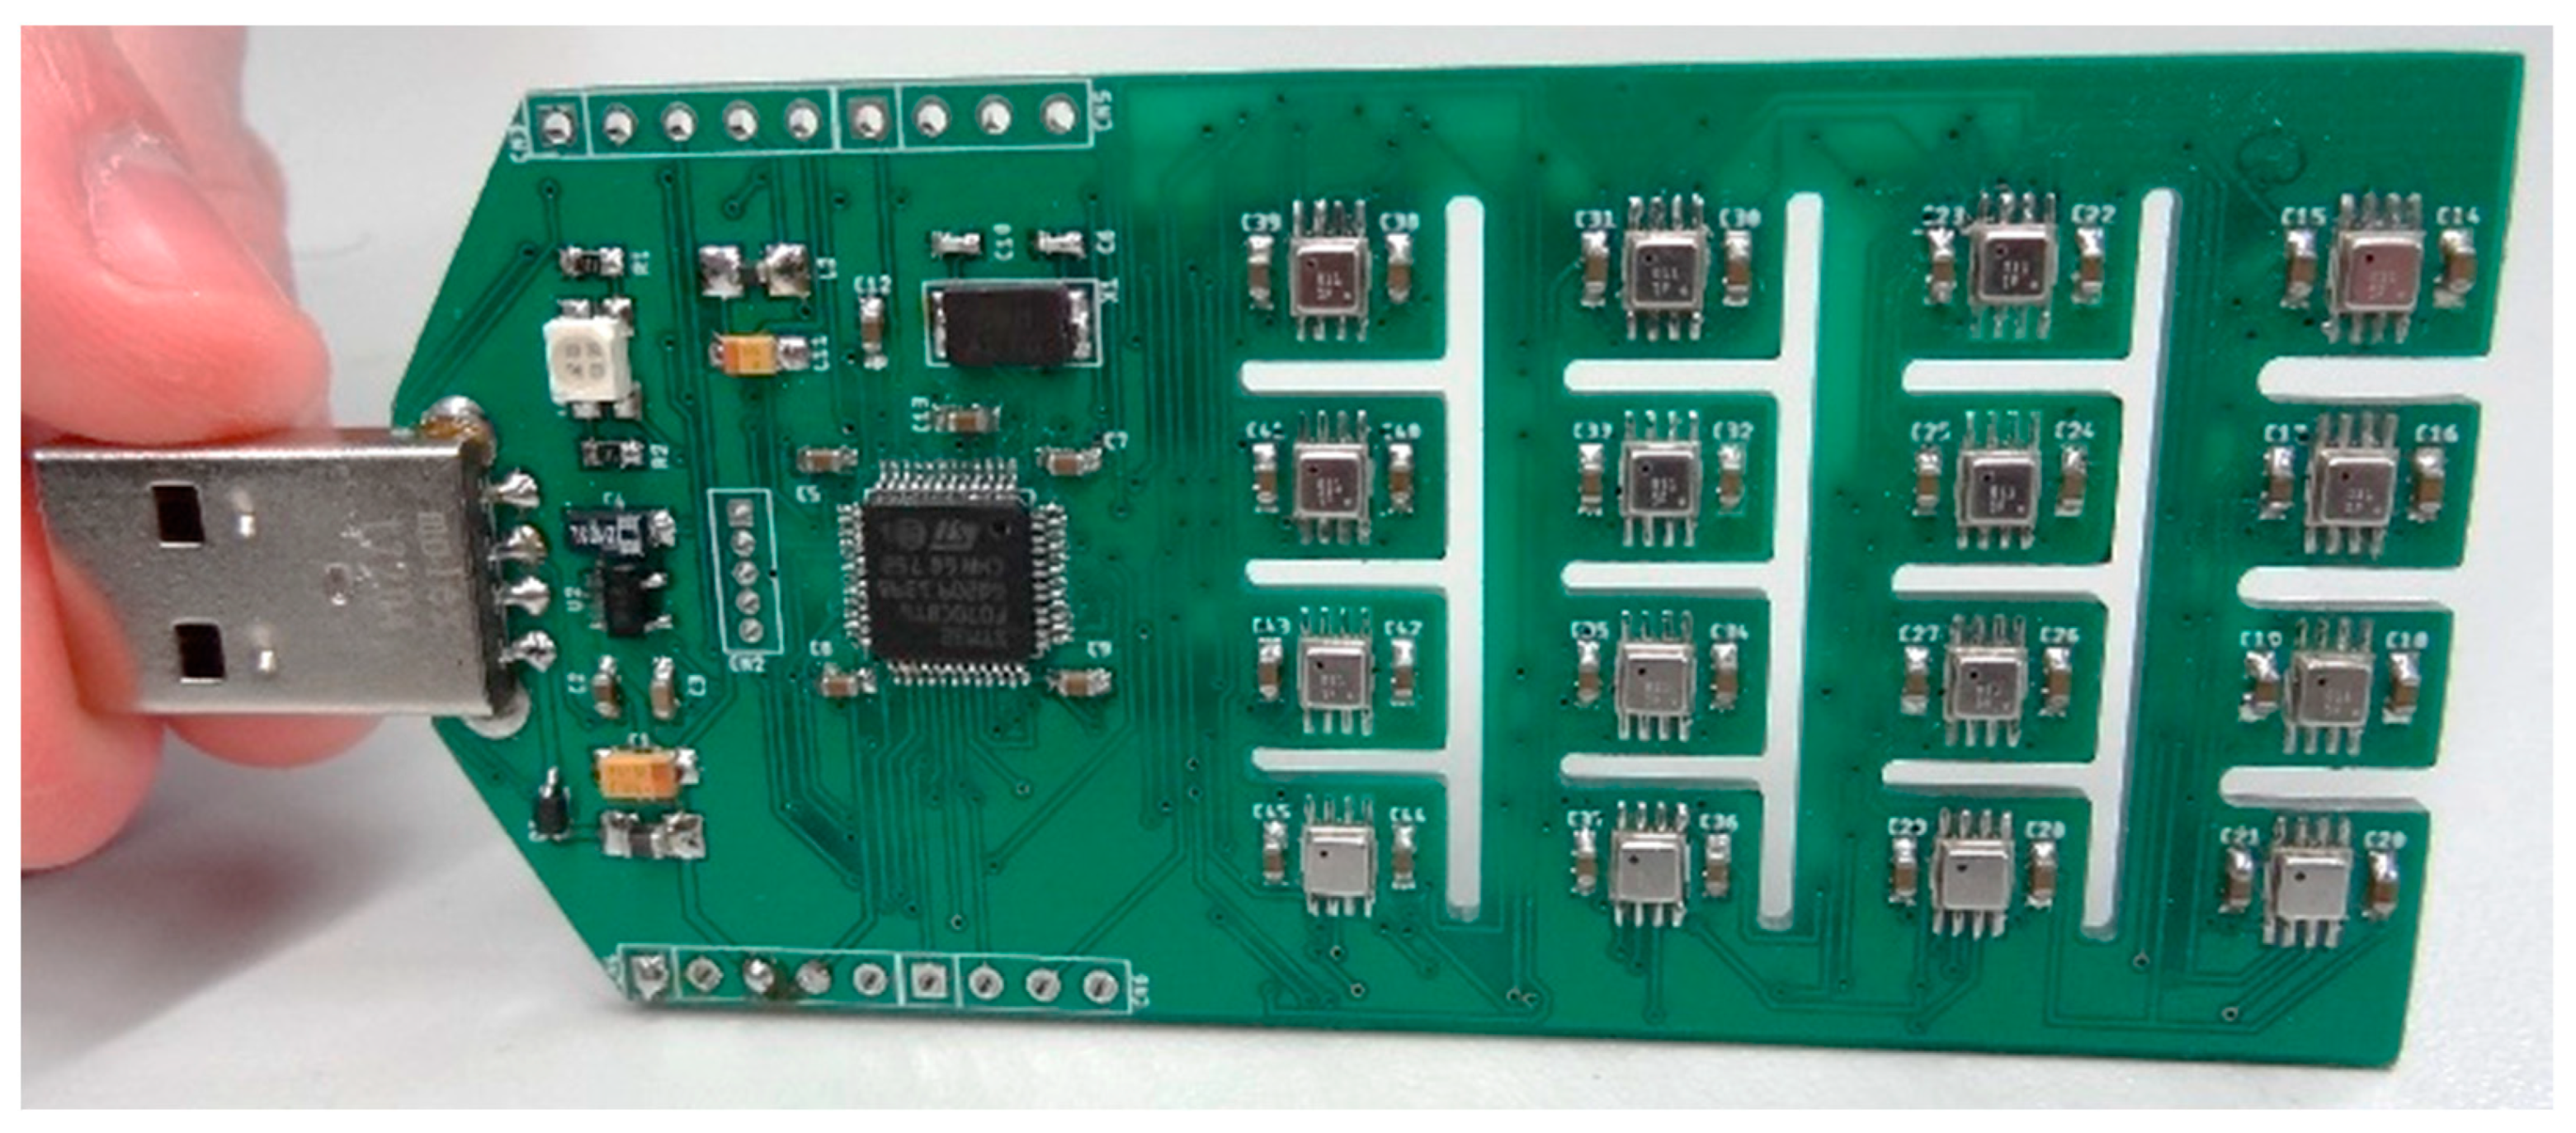
3.2. eNose as an Array of 16 Single-Type BME680 Gas Sensors
3.2.1. Individual Configuration of the Array of 16 BME680 Gas Sensors
3.2.2. eNose Normal Measurement Operation
3.3. Target Gases Used to Train and Test the eNose
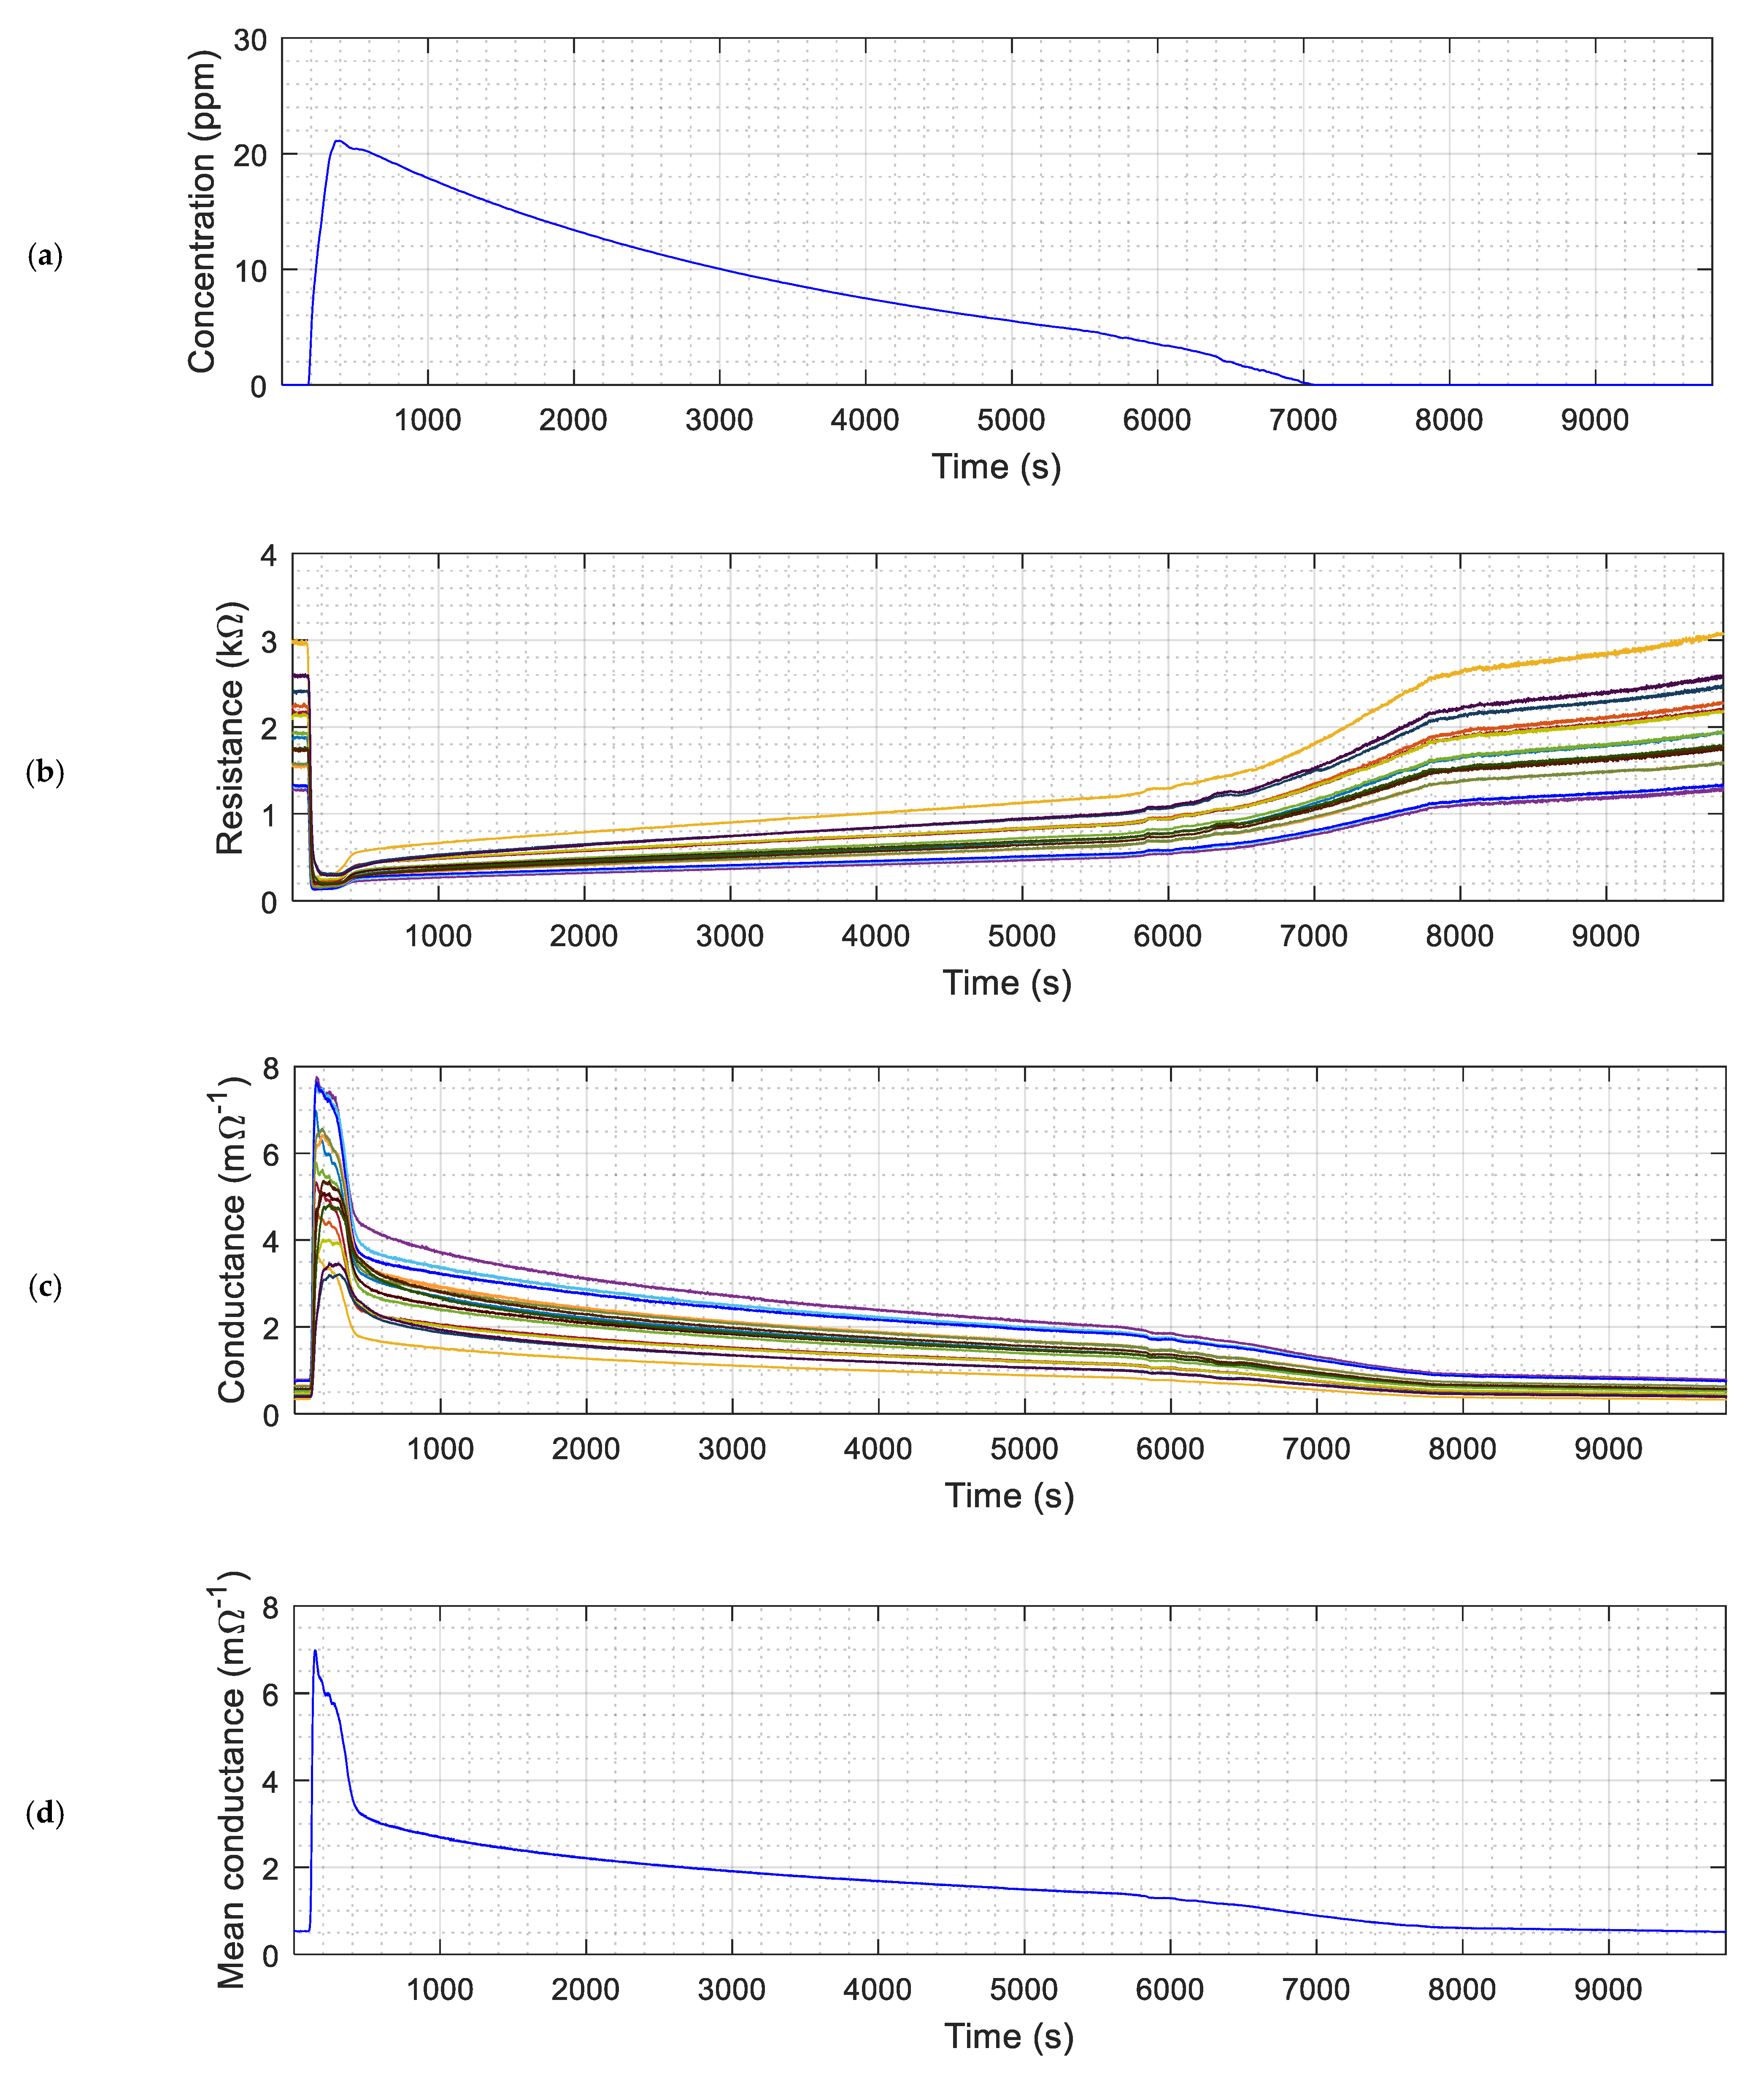
3.4. Reference Measurements of Volatile Concentration
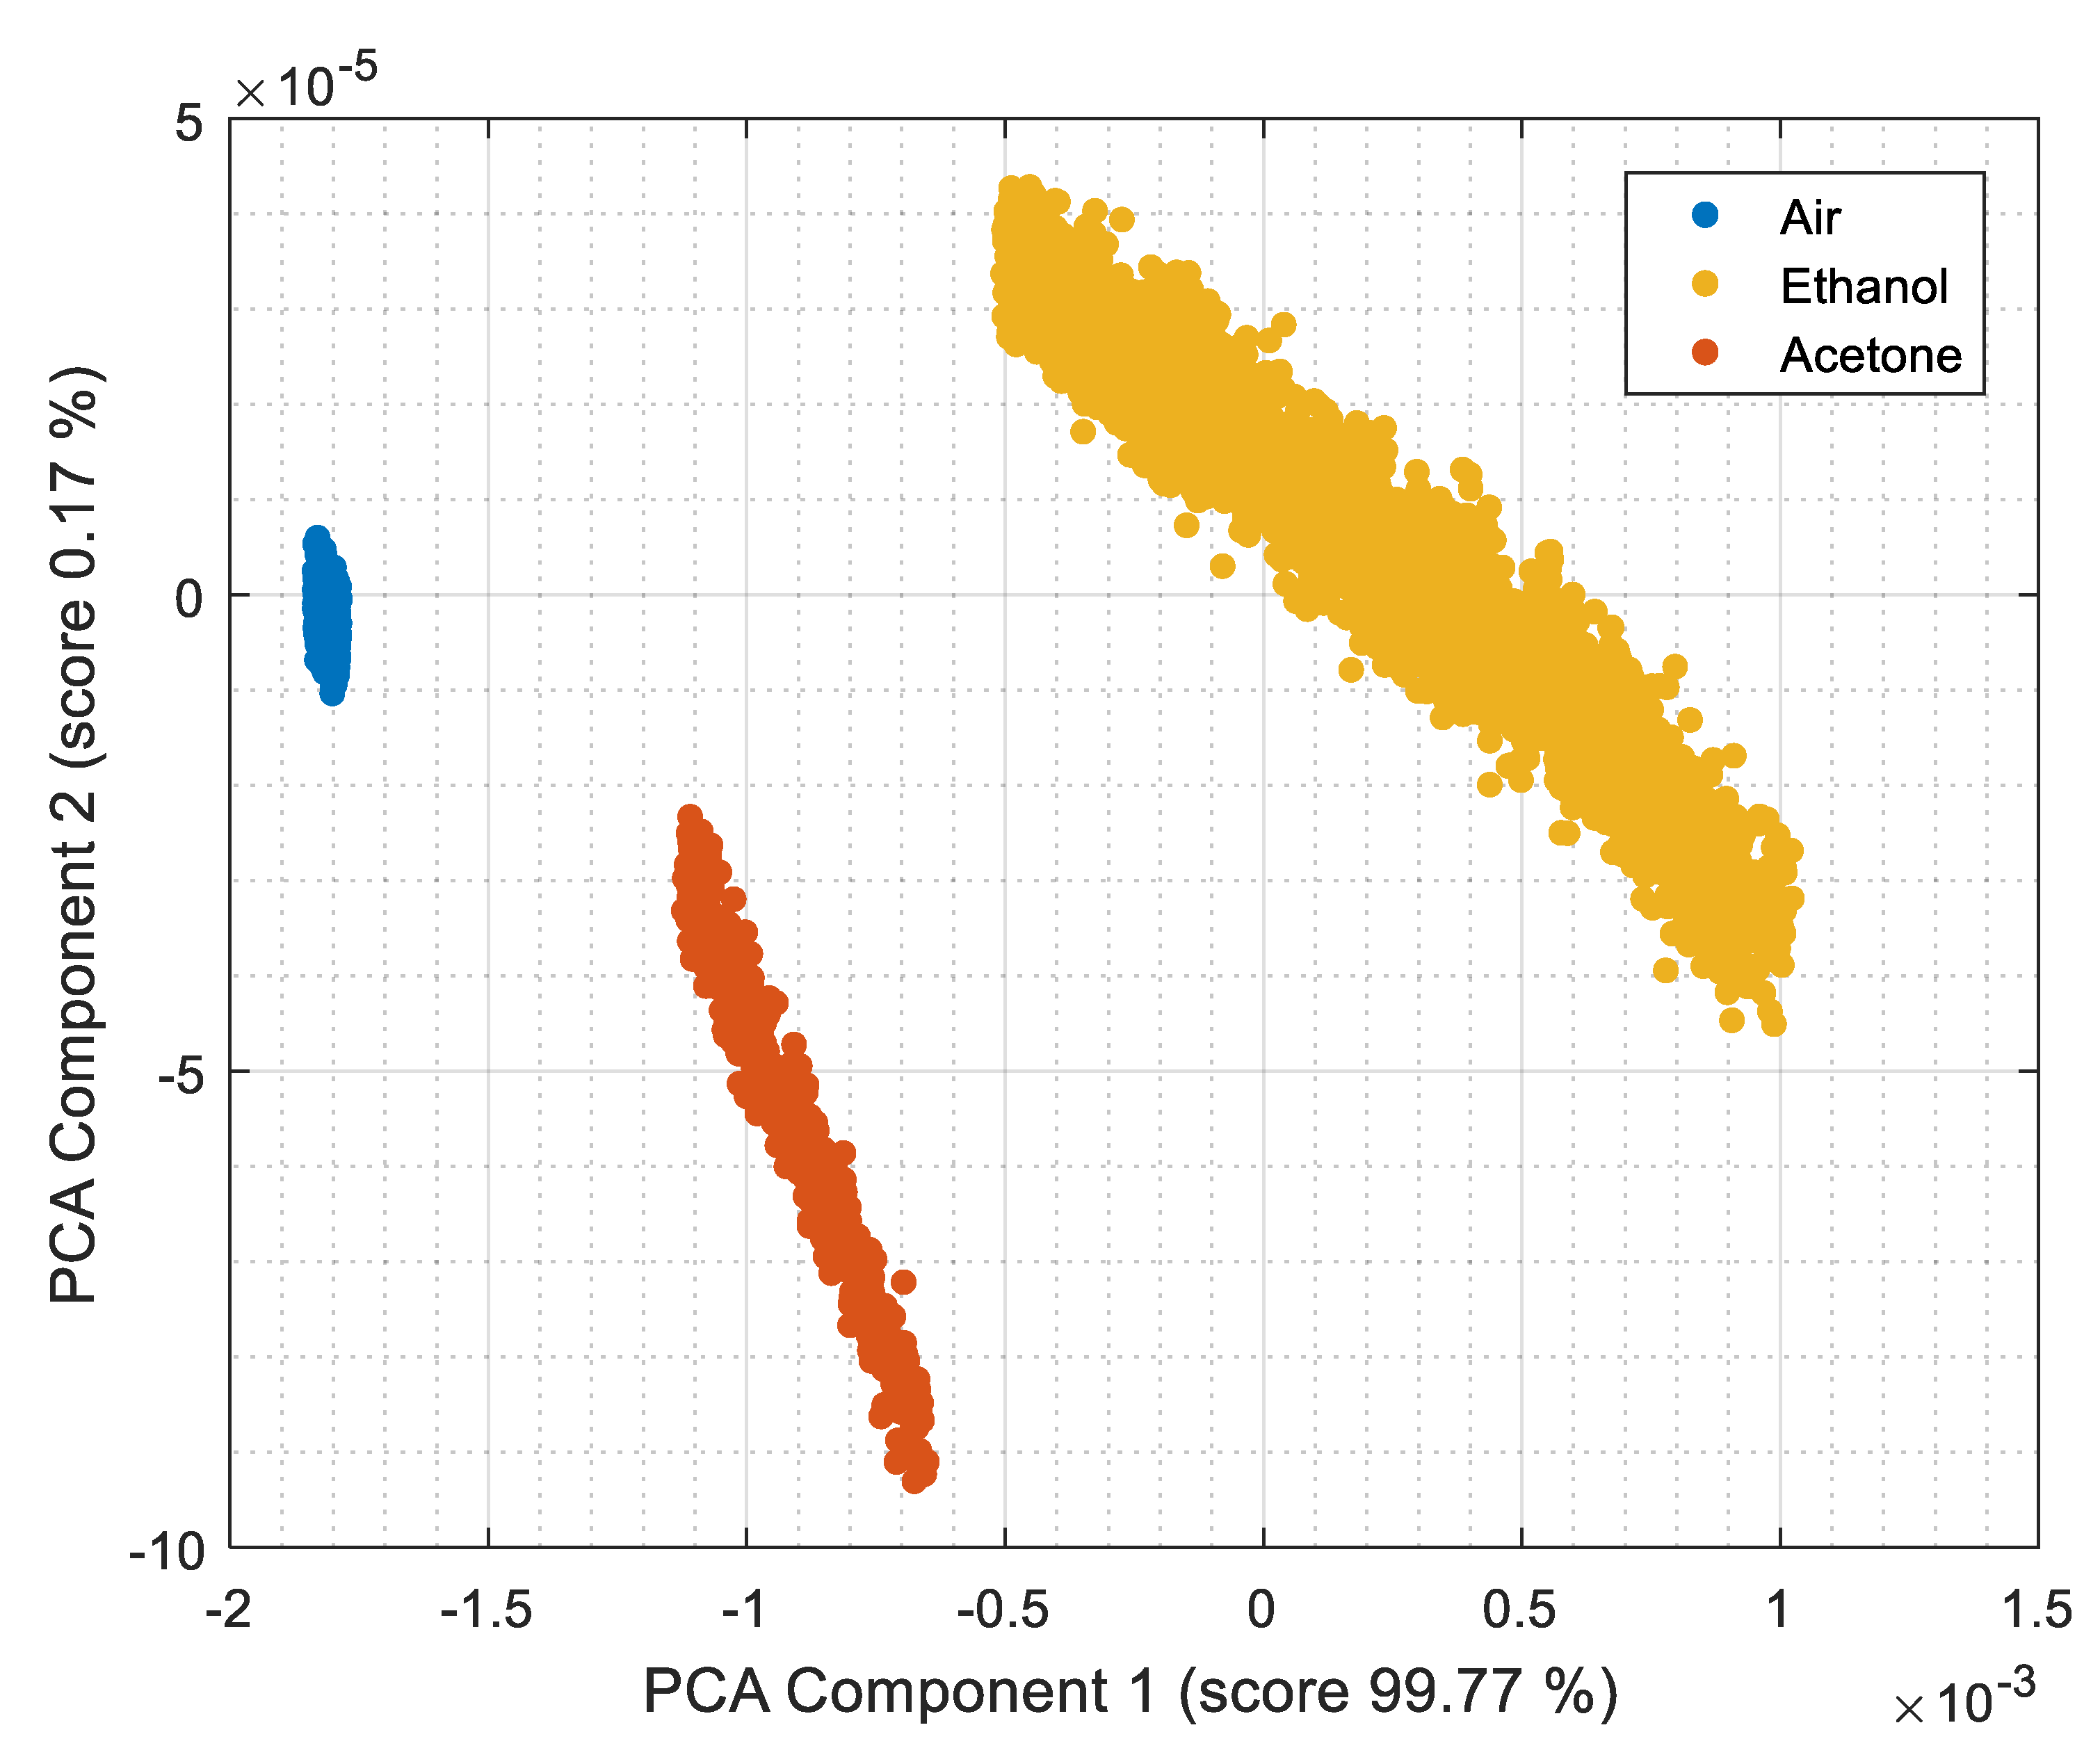
3.5. Principal Component Analysis (PCA)
3.6. k-Nearest Neighbors (k-NN)
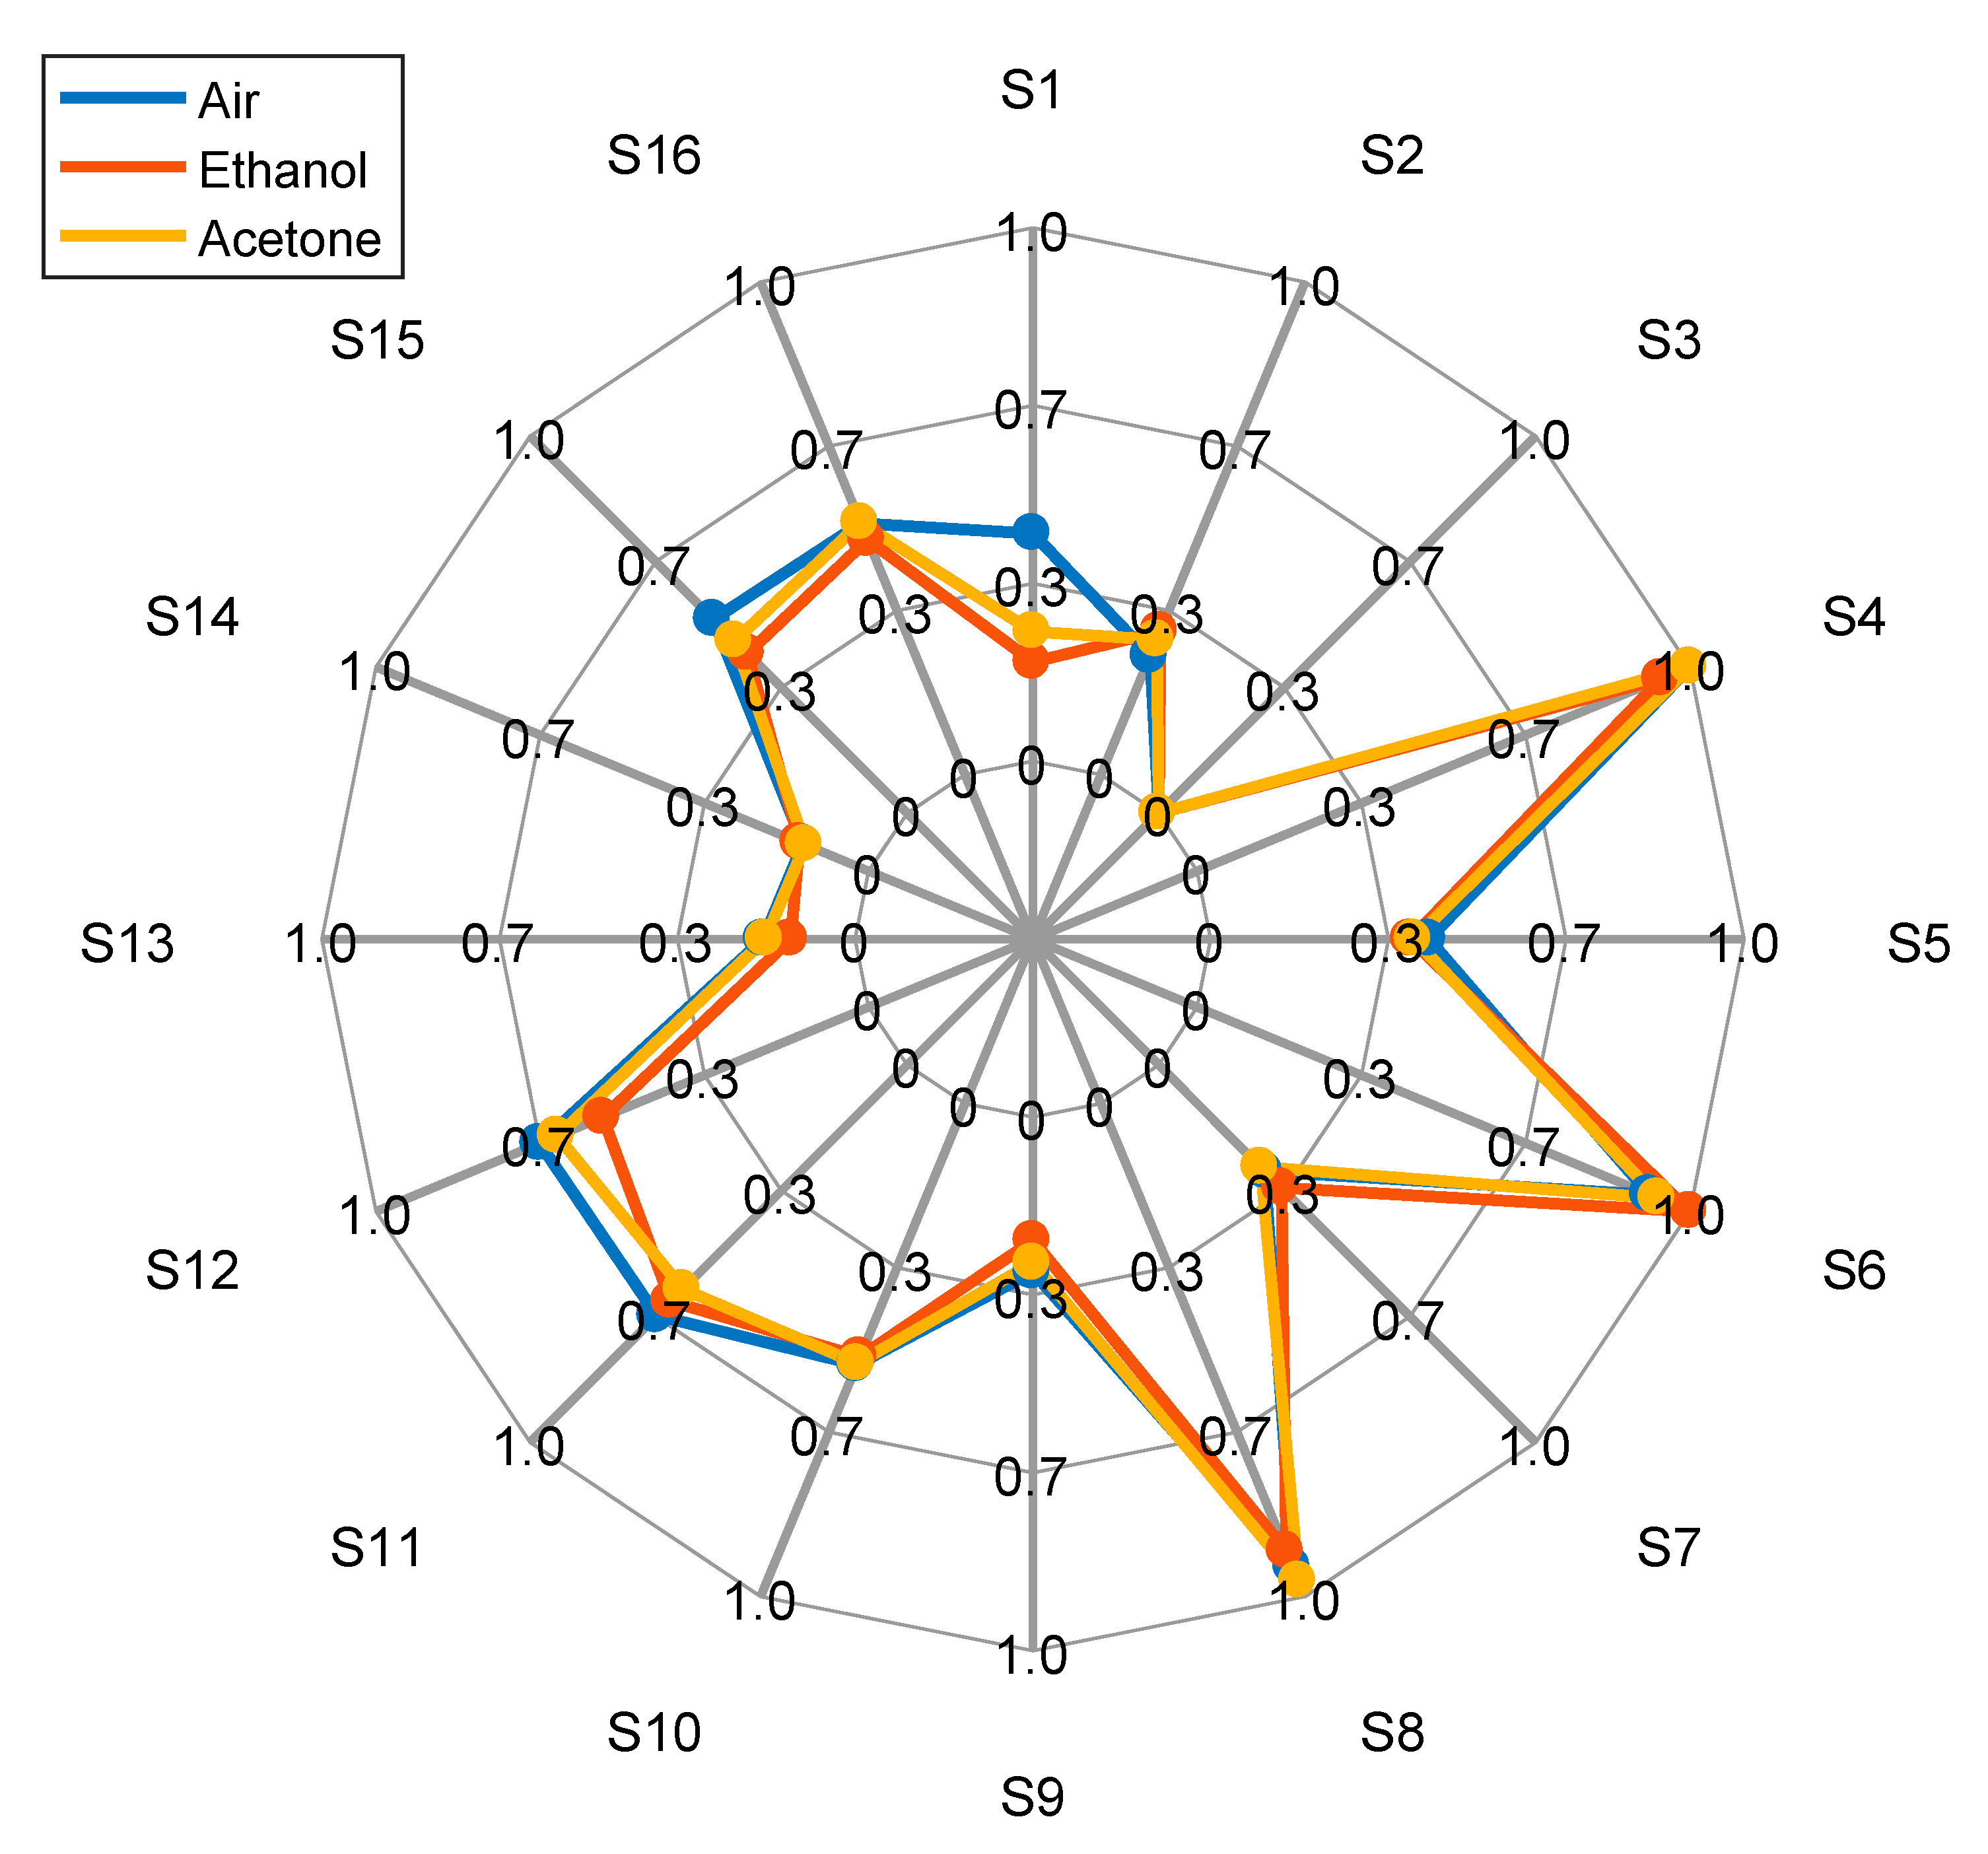
4. Calibration of the eNose with Ethanol and Acetone
5. Validation of the eNose to Detect Ethanol and Acetone
6. Conclusions
Author Contributions
Funding
Institutional Review Board Statement
Informed Consent Statement
Data Availability Statement
Conflicts of Interest
References
- Ampuero, S.; Bosset, J.O. The electronic nose applied to diary products: A review. Sens. Actuators B Chem. 2003, 94, 1–12. [Google Scholar] [CrossRef]
- Sarig, Y. Potential applications of artificial olfactory sensing for quality evaluation of fresh produce. J. Agric. Eng. Res. 2000, 77, 239–258. [Google Scholar] [CrossRef]
- Covington, J.A.; Marco, S.; Persaud, K.C.; Schiffman, S.S.; Nagle, H.T. Artificial Olfaction in the 21st Century. IEEE Sens. J. 2021, 21, 12969–12990. [Google Scholar] [CrossRef]
- Westenbrink, E.; Arasaradnam, R.P.; O’Connell, N.; Bailey, C.; Nwokolo, C. Development and application of a new electronic nose instrument for the detection of colorectal cancer. Biosens. Bioelectron. 2015, 65, 733–738. [Google Scholar] [CrossRef] [PubMed]
- Wilson, A.D. Diverse Applications of Electronic-Nose Technologies in Agriculture and Forestry. Sensors 2013, 13, 2295–2348. [Google Scholar] [CrossRef] [PubMed] [Green Version]
- So, S.; Koushanfar, F.; Kosterev, A.; Tittel, F. LaserSPECks: Laser SPECtroscopic Trace-Gas Sensor Networks—Sensor Integration and Applications. In Proceedings of the 6th International Conference on Information Processing in Sensor Networks, Cambridge, MA, USA, 25–27 April 2007; pp. 226–235. [Google Scholar]
- Wang, D.; Agrawal, D.P.; Toruksa, W.; Chaiwatpongsakorn, C.; Lu, M.; Keener, T.C. Monitoring ambient air quality with carbon monoxide sensor-based wireless network. Commun. ACM 2010, 53, 138–141. [Google Scholar] [CrossRef]
- Rossi, M.; Brunelli, D. Analyzing the transient response of MOX gas sensors to improve the lifetime of distributed sensing systems. In Proceedings of the 5th IEEE International Workshop on Advances in Sensors and Interfaces (IWASI), Bari, Italy, 13–14 June 2013; pp. 211–216. [Google Scholar] [CrossRef]
- Chiu, S.-W.; Tang, K.-T. Towards a Chemiresistive Sensor-Integrated Electronic Nose: A Review. Sensors 2013, 13, 14214–14247. [Google Scholar] [CrossRef] [Green Version]
- Zampolli, S.; Elmi, I.; Ahmed, F.; Passini, M.; Cardinali, G.C.; Nicoletti, S.; Dori, L. An electronic nose based on solid state sensor arrays for low-cost indoor air quality monitoring applications. Sens. Actuators B Chem. 2004, 101, 39–46. [Google Scholar] [CrossRef]
- Bhattacharya, S.; Sridevi, S.; Pitchiah, R. Indoor Air Quality Monitoring using Wireless Sensor Network. In Proceedings of the 2012 Sixth International Conference on Sensing Technology (ICST), Kolkata, India, 18–21 December 2012; pp. 422–427. [Google Scholar] [CrossRef]
- Song, K.; Wang, Q.; Liu, Q.; Zhang, H.; Cheng, Y. A wireless electronic nose system using a Fe2O3 gas sensing array and least squares support vector regression. Sensors 2011, 11, 485–505. [Google Scholar] [CrossRef]
- Fine, G.F.; Cavanagh, L.M.; Afonja, A.; Binions, R. Metal oxide semi-conductor gas sensors in environmental monitoring. Sensors 2010, 10, 5469–5502. [Google Scholar] [CrossRef] [Green Version]
- Wetchakun, K.; Samerjai, T.; Tamaekong, N.; Liewhiran, C.; Siriwong, C.; Kruefu, V.; Wisitsoraat, A.; Tuantranont, A.; Phanichphant, S. Semiconducting metal oxides as sensors for environmentally hazardous gases. Sens. Actuators B Chem. 2011, 160, 580–591. [Google Scholar] [CrossRef]
- Ghasemi-Varnamkhasti, M.; Mohtasebi, S.S.; Siadat, M.; Balasubramanian, S. Meat Quality Assessment by Electronic Nose (Machine Olfaction Technology). Sensors 2009, 9, 6058–6083. [Google Scholar] [CrossRef] [PubMed]
- Peris, M.; Escuder-Gilabert, L. A 21st century technique for food control: Electronic noses. Anal. Chim. Acta 2009, 638, 1–15. [Google Scholar] [CrossRef]
- Gardner, J.W.; Shin, H.W.; Hines, E.L. An electronic nose system to diagnose illness. Sens. Actuators B Chem. 2000, 70, 19–24. [Google Scholar] [CrossRef]
- Nakhleh, M.K.; Amal, H.; Jeries, R.; Broza, Y.Y.; Aboud, M.; Gharra, A.; Ivgi, H.; Khatib, S.; Badarneh, S.; Har-Shai, L.; et al. Diagnosis and Classification of 17 Diseases from 1404 Subjects via Pattern Analysis of Exhaled Molecules. ACS Nano 2017, 11, 112–125. [Google Scholar] [CrossRef] [Green Version]
- Liu, H.; Zhang, L.; Li, K.H.H.; Tan, O.K. Microhotplates for Metal Oxide Semiconductor Gas Sensor Applications—Towards the CMOS-MEMS Monolithic Approach. Micromachines 2018, 9, 557. [Google Scholar] [CrossRef] [PubMed] [Green Version]
- Meixner, H.; Lampe, U. Metal oxide sensors. Sens. Actuators B Chem. 1996, 33, 198–202. [Google Scholar] [CrossRef]
- Wang, C.; Yin, L.; Zhang, L.; Xiang, D.; Gao, R. Metal Oxide Gas Sensors: Sensitivity and Influencing Factors. Sensors 2010, 10, 2088–2106. [Google Scholar] [CrossRef] [Green Version]
- Eranna, G.; Joshi, B.C.; Runthala, D.P.; Gupta, R.P. Oxide Materials for Development of Integrated Gas Sensors—A Comprehensive Review. Crit. Rev. Solid State Mater. Sci. 2010, 29, 111–188. [Google Scholar] [CrossRef]
- Ali, S.; Gupta, A.; Shafiei, M.; Langford, S.J. Recent Advances in Perylene Diimide-Based Active Materials in Electrical Mode Gas Sensing. Chemosensors 2021, 9, 30. [Google Scholar] [CrossRef]
- Choi, J.H.; Lee, J.; Byeon, M.; Hong, T.E.; Park, H.; Lee, C.Y. Graphene-Based Gas Sensors with High Sensitivity and Minimal Sensor-to-Sensor Variation. ACS Appl. Nano Mater. 2020, 3, 2257–2265. [Google Scholar] [CrossRef]
- Persaud, K.; Dodd, G. Analysis of discrimination mechanisms in the mammalian olfactory system using a model nose. Nature 1982, 299, 352–355. [Google Scholar] [CrossRef] [PubMed]
- Marco, S.; Ortega, A.; Pardo, A.; Samitier, J. Gas identification with tin oxide sensor array and self-organizing maps: Adaptive correction of sensor drifts. IEEE Trans. Instrum. Meas. 1998, 47, 316–321. [Google Scholar] [CrossRef] [Green Version]
- Kohonen, T. Self-organized formation of topologically correct feature maps. Biol. Cybern. 1982, 43, 59–69. [Google Scholar] [CrossRef]
- Arnold, C.; Harms, M.; Goschnick, J. Air quality monitoring and fire detection with the Karlsruhe electronic micronose KAMINA. IEEE Sens. J. 2002, 2, 179–188. [Google Scholar] [CrossRef]
- Bennetts, V.H.; Lilienthal, A.J.; Trincavelli, M. Creating true gas concentration maps in presence of multiple heterogeneous gas sources. In Proceedings of the 2012 IEEE Sensors, Taipei, Taiwan, 28–31 October 2012; pp. 1–4. [Google Scholar] [CrossRef]
- Marco, S.; Gutiérrez-Gálvez, A.; Lansner, A.; Martinez, D.; Rospars, J.P.; Beccherelli, R.; Perera, A.; Pearce, T.C.; Verschure, P.F.M.J.; Persaud, K. A biomimetic approach to machine olfaction, featuring a very large-scale chemical sensor array and embedded neuro-bio-inspired computation. Microsyst Technol 2014, 20, 729–742. [Google Scholar] [CrossRef]
- Burgués, J.; Jiménez-Soto, J.M.; Marco, S. Estimation of the limit of detection in semiconductor gas sensors through linearized calibration models. Anal. Chim. Acta 2018, 1013, 13–25. [Google Scholar] [CrossRef]
- Burgués, J.; Marco, S. Low Power Operation of Temperature-Modulated Metal Oxide Semiconductor Gas Sensors. Sensors 2018, 18, 339. [Google Scholar] [CrossRef] [Green Version]
- Rossi, M.; Brunelli, D. Autonomous Gas Detection and Mapping with Unmanned Aerial Vehicles. IEEE Trans. Instrum. Meas. 2016, 65, 765–775. [Google Scholar] [CrossRef]
- Palacín, J.; Martínez, D.; Clotet, E.; Pallejà, T.; Burgués, J.; Fonollosa, J.; Pardo, A.; Marco, S. Application of an Array of Metal-Oxide Semiconductor Gas Sensors in an Assistant Personal Robot for Early Gas Leak Detection. Sensors 2019, 19, 1957. [Google Scholar] [CrossRef] [Green Version]
- Burgués, J.; Deseada-Esclapez, M.; Doñate, S.; Marco, S. RHINOS: A lightweight portable electronic nose for real-time odor quantification in wastewater treatment plants. iScience 2021, 24, 103371. [Google Scholar] [CrossRef] [PubMed]
- Bishop, C.M. Pattern Recognition and Machine Learning (Information Science and Statistics); Springer: Berlin/Heidelberg, Germany, 2006. [Google Scholar]
- Wold, S.; Ruhe, A.; Wold, H.; Dunn, W.J., III. The Collinearity Problem in Linear Regression. The Partial Least Squares (PLS) Approach to Generalized Inverses. SIAM J. Sci. Stat. Comput. 1984, 5, 735–743. [Google Scholar] [CrossRef] [Green Version]
- Arroyo, P.; Meléndez, F.; Suárez, J.I.; Herrero, J.L.; Rodríguez, S.; Lozano, J. Electronic Nose with Digital Gas Sensors Connected via Bluetooth to a Smartphone for Air Quality Measurements. Sensors 2020, 20, 786. [Google Scholar] [CrossRef] [PubMed] [Green Version]
- Gardner, M.W.; Dorling, S.R. Artificial neural networks (the multilayer perceptron)—A review of applications in the atmospheric sciences. Atmos. Environ. 1998, 32, 2627–2636. [Google Scholar] [CrossRef]
- Burgués, J.; Hernández, V.; Lilienthal, A.J.; Marco, S. Gas distribution mapping and source localization using a 3D grid of metal oxide semiconductor sensors. Sens. Actuators B Chem. 2020, 304, 127309. [Google Scholar] [CrossRef]
- Tiele, A.; Wicaksono, A.; Ayyala, S.K.; Covington, J.A. Development of a Compact, IoT-Enabled Electronic Nose for Breath Analysis. Electronics 2020, 9, 84. [Google Scholar] [CrossRef] [Green Version]
- Ballabio, D.; Consonni, V. Classification tools in chemistry. Part 1: Linear models. PLS-DA. Anal. Methods 2013, 5, 3790–3798. [Google Scholar] [CrossRef]
- Fan, H.; Hernandez Bennetts, V.; Schaffernicht, E.; Lilienthal, A.J. Towards Gas Discrimination and Mapping in Emergency Response Scenarios Using a Mobile Robot with an Electronic Nose. Sensors 2019, 19, 685. [Google Scholar] [CrossRef] [Green Version]
- Wold, S.; Sjöström, M.; Eriksson, L. PLS-regression: A basic tool of chemometrics. Chemom. Intell. Lab. Syst. 2001, 58, 109–130. [Google Scholar] [CrossRef]
- Gongora, A.; Chaves, D.; Jaenal, A.; Monroy, J.; Gonzalez-Jimenez, J. Toward the generation of smell maps: Matching electro-chemical sensor information with human odor perception. Front. Artif. Intell. Appl. 2018, 310, 134–145. [Google Scholar] [CrossRef]
- Monroy, J.G.; Gonzalez-Jimenez, J. Gas classification in motion: An experimental analysis. Sens. Actuators B Chem. 2017, 240, 1205–1215. [Google Scholar] [CrossRef]
- Schleif, F.M.; Hammer, B.; Monroy, J.G.; Jimenez, J.G.; Blanco-Claraco, J.L.; Biehl, M.; Petkov, N. Odor recognition in robotics applications by discriminative time-series modeling. Pattern Anal. Appl. 2016, 19, 207–220. [Google Scholar] [CrossRef]
- Fonollosa, J.; Fernández, L.; Gutiérrez-Gálvez, A.; Huerta, R.; Marco, S. Calibration transfer and drift counteraction in chemical sensor arrays using Direct Standardization. Sens. Actuators B Chem. 2016, 236, 1044–1053. [Google Scholar] [CrossRef] [Green Version]
- Vapnik, V. The Nature of Statistical Learning Theory; Springer: New York, NY, USA, 1995. [Google Scholar]
- Vries, R.; Brinkman, P.; van der Schee, M.P.; Fens, N.; Dijkers, E.; Bootsma, S.K.; de Jongh, F.H.C.; Sterk, P.J. Integration of electronic nose technology with spirometry: Validation of a new approach for exhaled breath analysis. J. Breath Res. 2015, 9, 046001. [Google Scholar] [CrossRef]
- González-Arjona, D.; González, A.G. Adaptation of linear discriminant analysis to second level-pattern recognition classification. Anal. Chim. Acta 1998, 363, 89–95. [Google Scholar] [CrossRef]
- Fonollosa, J.; Sheik, S.; Huerta, R.; Marco, S. Reservoir computing compensates slow response of chemosensor arrays exposed to fast varying gas concentrations in continuous monitoring. Sens. Actuators B Chem. 2015, 215, 618–629. [Google Scholar] [CrossRef]
- Natschläger, T.; Maass, W.; Markram, H. The “Liquid Computer”: A Novel Strategy for Real-Time Computing on Time Series. Telematik 2002, 8, 39–43. [Google Scholar]
- Rossi, M.; Brunelli, D.; Adami, A.; Lorenzelli, L.; Menna, F.; Remondino, F. Gas-Drone: Portable gas sensing system on UAVs for gas leakage localization. In Proceedings of the 2014 IEEE SENSORS, Valencia, Spain, 2–5 November 2014; pp. 1431–1434. [Google Scholar] [CrossRef]
- Sanchez-Garrido, C.; Monroy, J.G.; Gonzalez-Jimenez, J. A configurable smart e-nose for spatio-temporal olfactory analysis. In Proceedings of the 2014 IEEE SENSORS, Valencia, Spain, 2–5 November 2014; pp. 1968–1971. [Google Scholar] [CrossRef]
- Monroy, J.G.; Gonzalez-Jimenez, J.; Sanchez-Garrido, C. Monitoring household garbage odors in urban areas through distribution maps. In Proceedings of the 2014 IEEE Sensors, Valencia, Spain, 2–5 November 2014; pp. 1364–1367. [Google Scholar] [CrossRef]
- Bennetts, V.H.; Schaffernicht, E.; Pomareda, V.; Lilienthal, A.J.; Marco, S.; Trincavelli, M. Combining Non Selective Gas Sensors on a Mobile Robot for Identification and Mapping of Multiple Chemical Compounds. Sensors 2014, 14, 17331–17352. [Google Scholar] [CrossRef]
- Savarese, M.; Caporaso, N.; Parisini, C. Application of an Electronic Nose for the Evaluation of Rancidity and Shelf live in Virgin Olive Oil. In Proceedings of the Electronic International Interdisciplinary Conference (EIIC 2013), Virtual, 2–6 September 2013; pp. 361–366. [Google Scholar]
- Monroy, J.G.; Lilienthal, A.J.; Blanco, J.-L.; Gonzalez-Jimenez, J.; Trincavelli, M. Probabilistic gas quantification with MOX sensors in Open Sampling Systems—A Gaussian Process approach. Sens. Actuators B Chem. 2013, 188, 298–312. [Google Scholar] [CrossRef] [Green Version]
- Vergara, A.; Vembu, S.; Ayhan, T.; Ryan, M.A.; Homer, M.L.; Huerta, R. Chemical gas sensor drift compensation using classifier ensembles. Sens. Actuators B Chem. 2012, 166–167, 320–329. [Google Scholar] [CrossRef]
- Thayananthan, A.; Navaratnam, R.; Stenger, B.; Torr, P.H.S.; Cipolla, R. Multivariate Relevance Vector Machines for Tracking. In Proceedings of the Computer Vision–ECCV 2006, Graz, Austria, 7–13 May 2006; pp. 124–138. [Google Scholar] [CrossRef]
- Aguilera, T.; Lozano, J.; Paredes, J.A.; Álvarez, F.J.; Suárez, J.I. Electronic Nose Based on Independent Component Analysis Combined with Partial Least Squares and Artificial Neural Networks for Wine Prediction. Sensors 2012, 12, 8055–8072. [Google Scholar] [CrossRef] [PubMed]
- Jutten, C.; Herault, J. Blind separation of sources, part I: An adaptive algorithm based on neuromimetic architecture. Signal Processing 1991, 24, 1–10. [Google Scholar] [CrossRef]
- Brudzewski, K.; Osowski, S.; Dwulit, A. Recognition of Coffee Using Differential Electronic Nose. IEEE Trans. Instrum. Meas. 2012, 61, 1803–1810. [Google Scholar] [CrossRef]
- Haddi, Z.; Amari, A.; Alami, H.; El Bari, N.; Llobet, E.; Bouchikhi, B. A portable electronic nose system for the identification of cannabis-based drugs. Sens. Actuators B Chem. 2011, 155, 456–463. [Google Scholar] [CrossRef]
- Gonzalez-Jimenez, J.; Monroy, J.G.; Blanco, J.L. The Multi-Chamber Electronic Nose—An Improved Olfaction Sensor for Mobile Robotics. Sensors 2011, 11, 6145–6164. [Google Scholar] [CrossRef]
- Brudzewski, K.; Osowski, S.; Ulaczyk, J. Differential electronic nose of two chemo sensor arrays for odor discrimination. Sens. Actuators B Chem. 2010, 145, 246–249. [Google Scholar] [CrossRef]
- Guo, D.; Zhang, D.; Li, N.; Zhang, L.; Yang, J. A Novel Breath Analysis System Based on Electronic Olfaction. IEEE Trans. Biomed. Eng. 2010, 57, 2753–2763. [Google Scholar] [CrossRef]
- Mildner-Szkudlarz, S.; Jenen, H.H. Detection of olive oil adulteration with rapeseed and sunflower oils using MOS electronic nose and SPME-MS. J. Food Qual. 2010, 33, 21–41. [Google Scholar] [CrossRef]
- Lilienthal, A.J.; Reggente, M.; Trincavelli, M.; Blanco, J.L.; Gonzalez, J. A statistical approach to gas distribution modelling with mobile robots—The Kernel DM+V algorithm. In Proceedings of the 2009 IEEE/RSJ International Conference on Intelligent Robots and Systems, St. Louis, MO, USA, 10–15 October 2009; pp. 570–576. [Google Scholar] [CrossRef] [Green Version]
- Pearson, K. On Lines and Planes of Closest Fit to Systems of Points in Space. Lond. Edinb. Dublin Philos. Mag. J. Sci. 1901, 2, 559–572. [Google Scholar] [CrossRef] [Green Version]
- Fix, E.; Hodges, J.L. Discriminatory Analysis. Nonparametric Discrimination: Consistency Properties; Technical Report 4; USAF School of Aviation Medicine: Randolph Field, TX, USA, 1951. [Google Scholar]


| Parameters | Register Name<bit> | Register Values and/or Range | ||
| (1) | Oversampling (T) | Ctrl_meas<7:5> | 0: Skipped 1: OSx1 2: OSx2 | 3: OSx4 4: OSx8 5: OSx16 |
| Oversampling (P) | Ctrl_hum<4:2> | |||
| Oversampling (H) | Ctrl_hum<2:0> | |||
| (2) | IIR filter coefficient (T-P) | Config<4:2> | 0: coefficient = 0 1: coefficient = 1 2: coefficient = 3 3: coefficient = 7 | 4: coefficient = 15 5: coefficient = 31 6: coefficient = 63 7: coefficient = 127 |
| (3) | Heater off (G) | Ctrl_gas_0<3> | 1: Off–0: On | |
| Enable gas conversion (G) | Ctrl_1<4> | 1: On–0: Off | ||
| Heat up duration (G) | Gas_wait_x<7:0> | Value representing from 1 ms to 4032 ms | ||
| Target heater temperature (G) | Res_heat_x<7:0> | Value representing from 200 °C to 400 °C | ||
| gasRange | const_array1 Value | const_array2 Value |
|---|---|---|
| 0 | 1 | 8,000,000 |
| 1 | 1 | 4,000,000 |
| 2 | 1 | 2,000,000 |
| 3 | 1 | 1,000,000 |
| 4 | 1 | 499,500.4995 |
| 5 | 0.99 | 248,262.1648 |
| 6 | 1 | 125,000 |
| 7 | 0.992 | 63,004.03226 |
| 8 | 1 | 31,281.28128 |
| 9 | 1 | 15,625 |
| 10 | 0.998 | 7812.5 |
| 11 | 0.995 | 3906.25 |
| 12 | 1 | 1953.125 |
| 13 | 0.99 | 976.5625 |
| 14 | 1 | 488.28125 |
| 15 | 1 | 244.140625 |
| Parameters | Register Values |
|---|---|
| Heater off (G) | 0: Heater On |
| Enable gas conversion (G) | 1: Run Gas |
| Heat up duration (G) | Value from 1 ms to 4032 ms |
| Target heater temperature (G) | Value from 200 °C to 400 °C |
| Sensor ID | Target Heater Temperature (°C) | Heat Up Duration (ms) |
|---|---|---|
| 1 | 200 | 150 |
| 2 | 212 | 150 |
| 3 | 224 | 150 |
| 4 | 240 | 150 |
| 5 | 250 | 150 |
| 6 | 260 | 150 |
| 7 | 280 | 150 |
| 8 | 300 | 150 |
| 9 | 320 | 150 |
| 10 | 330 | 150 |
| 11 | 340 | 150 |
| 12 | 350 | 150 |
| 13 | 360 | 150 |
| 14 | 370 | 150 |
| 15 | 380 | 150 |
| 16 | 400 | 150 |
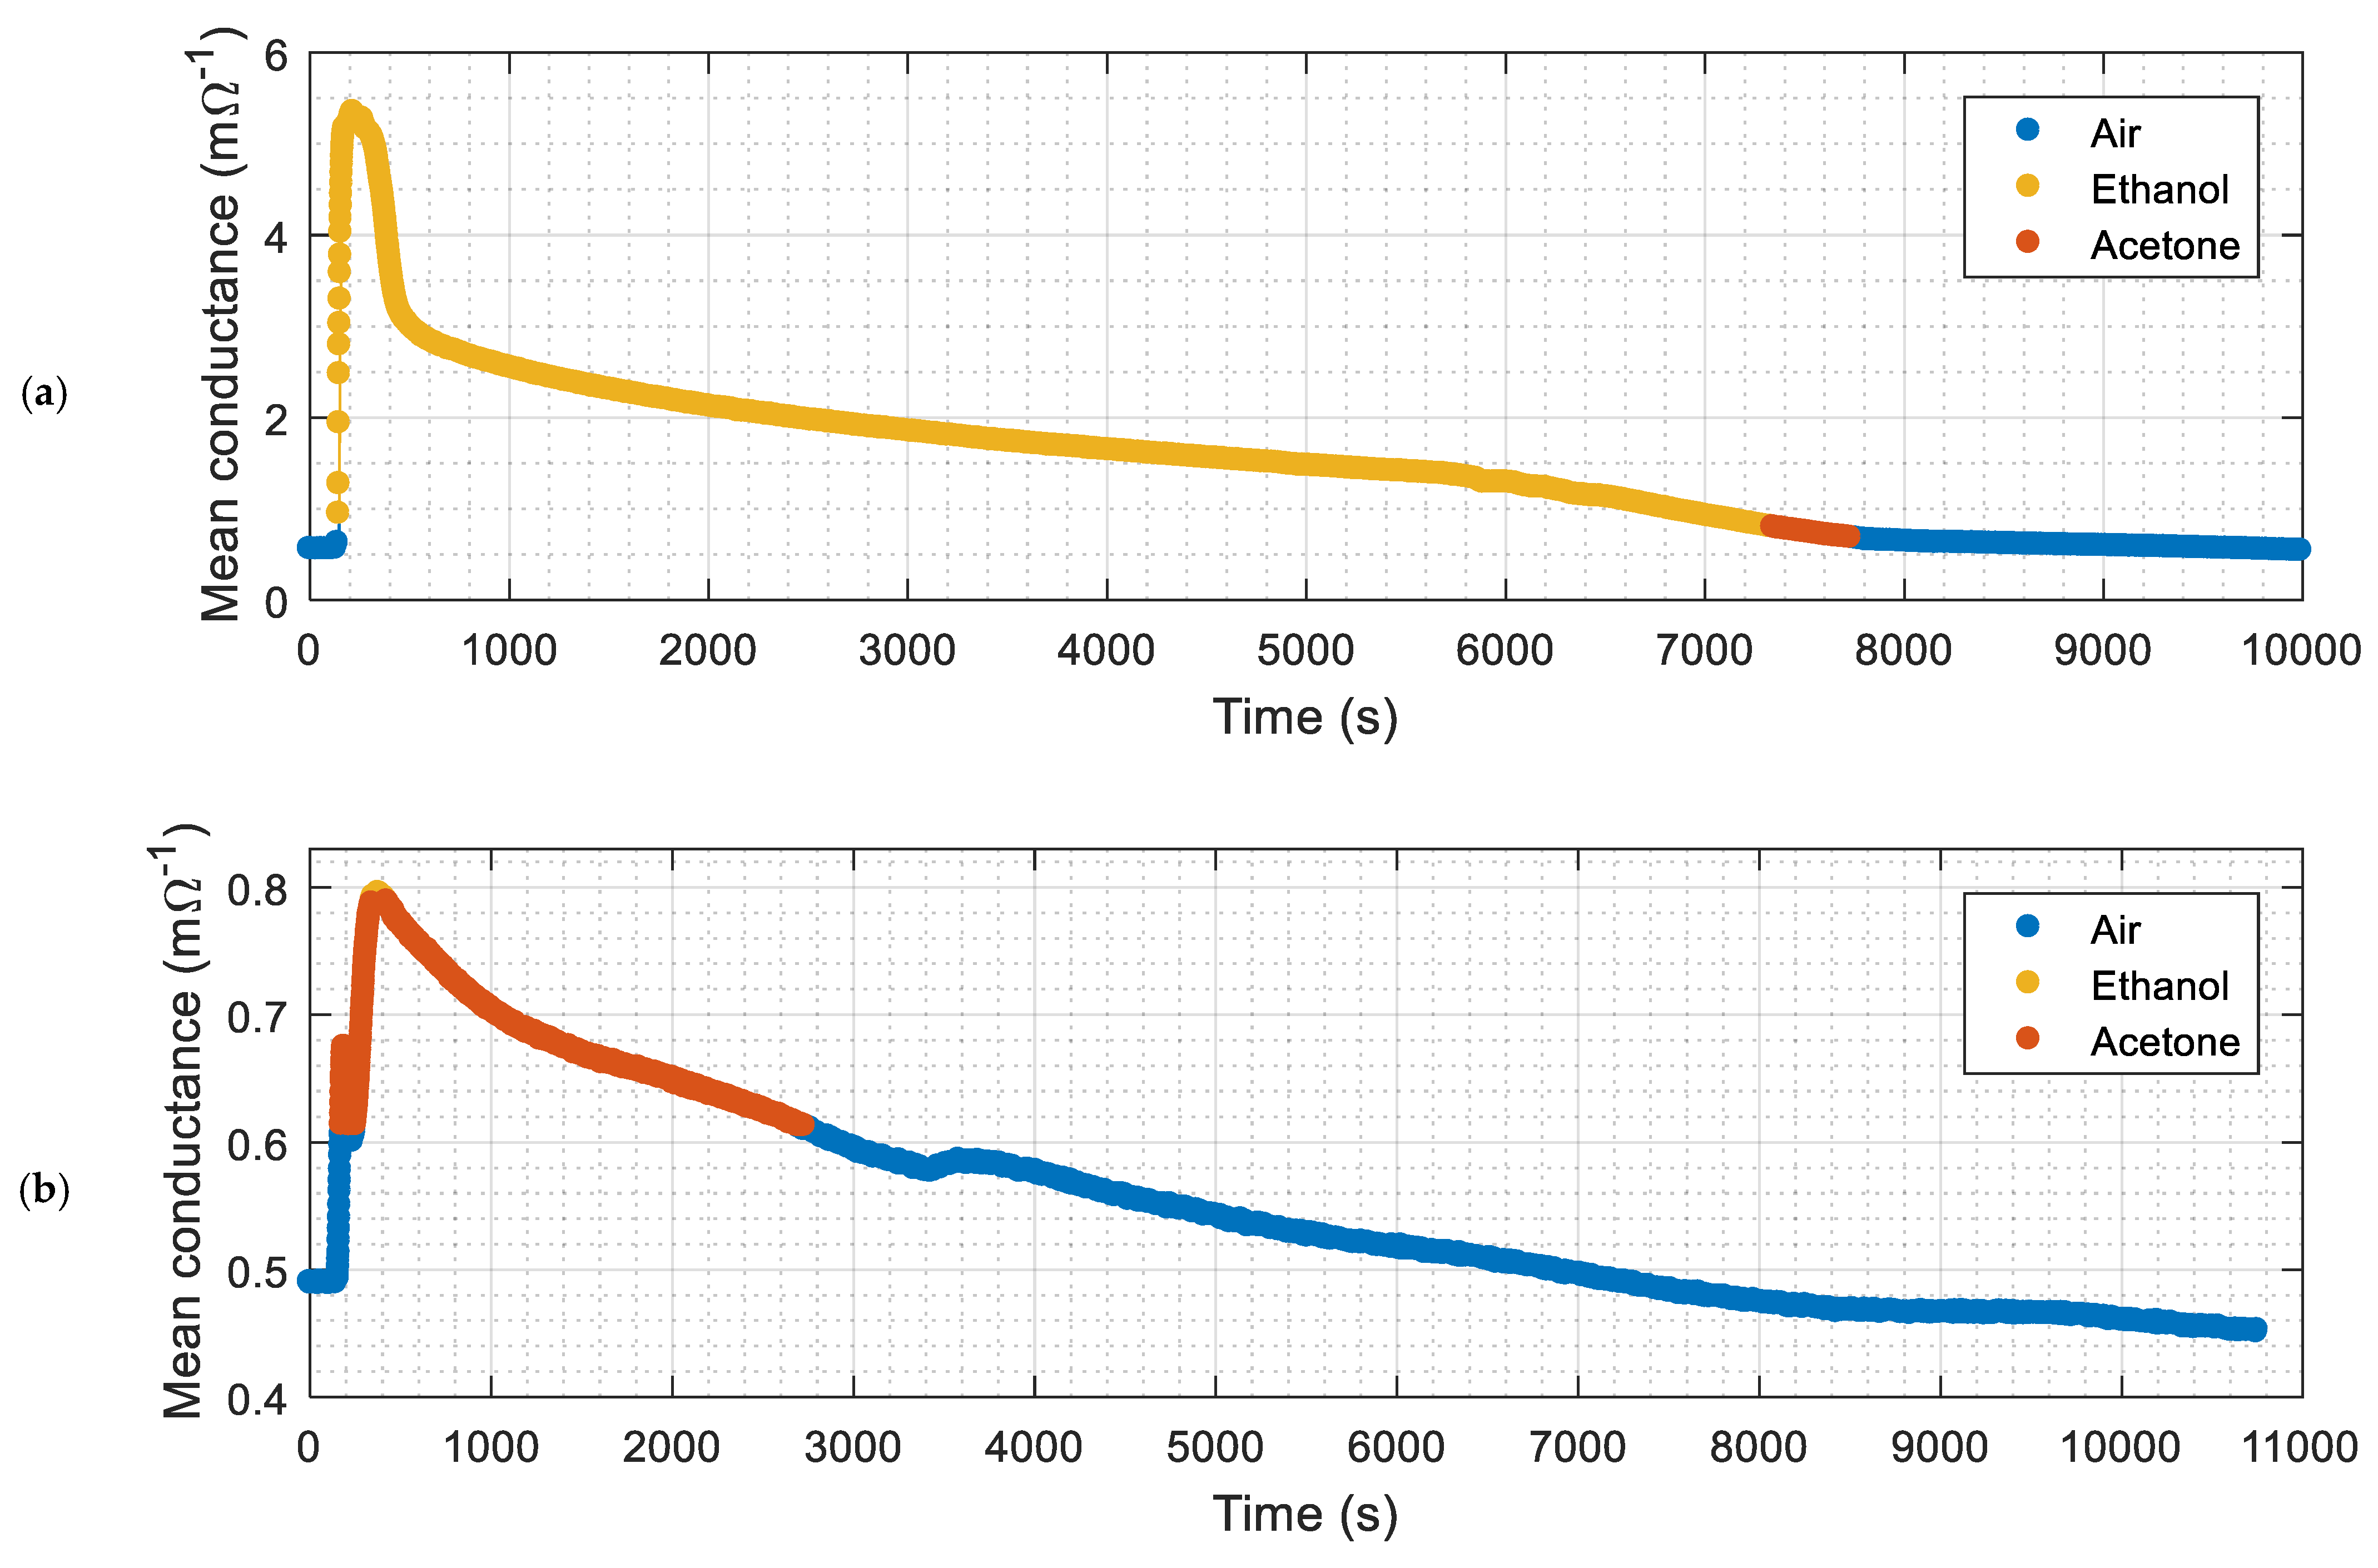
| Experiment | Volatile | Classifier Output (%) | Number of Samples | Success Rate (%) | |||
|---|---|---|---|---|---|---|---|
| Ethanol | Acetone | Total | Hit | Miss | |||
| - | Ethanol | 100.00% | 0.00% | 4073 | 4073 | 0 | 100.00% |
| Figure 8a | Ethanol | 94.90% | 5.10% | 6215 | 5898 | 317 | 94.90% |
| - | Acetone | 0.00% | 100.00% | 1971 | 1971 | 0 | 100.00% |
| Figure 8b | Acetone | 3.03% | 96.97% | 2047 | 1985 | 62 | 96.97% |
| Average | 14,306 | 13,927 | 379 | 97.35% | |||
| Experiment | Volatile | Classifier Output (%) | Number of Samples | Success Rate (%) | |||
|---|---|---|---|---|---|---|---|
| Ethanol | Acetone | Total | Hit | Miss | |||
| - | Ethanol | 70.65% | 29.35% | 4201 | 2968 | 1233 | 70.65% |
| - | Ethanol | 70.95% | 29.05% | 3349 | 2376 | 973 | 70.95% |
| - | Acetone | 9.24% | 90.76% | 4046 | 3672 | 374 | 90.76% |
| - | Acetone | 25.48% | 74.52% | 3375 | 2515 | 860 | 74.52% |
| Average | 14,971 | 11,531 | 3440 | 77.02% | |||
Publisher’s Note: MDPI stays neutral with regard to jurisdictional claims in published maps and institutional affiliations. |
© 2022 by the authors. Licensee MDPI, Basel, Switzerland. This article is an open access article distributed under the terms and conditions of the Creative Commons Attribution (CC BY) license (https://creativecommons.org/licenses/by/4.0/).
Share and Cite
Palacín, J.; Rubies, E.; Clotet, E.; Martínez, D. Classification of Two Volatiles Using an eNose Composed by an Array of 16 Single-Type Miniature Micro-Machined Metal-Oxide Gas Sensors. Sensors 2022, 22, 1120. https://doi.org/10.3390/s22031120
Palacín J, Rubies E, Clotet E, Martínez D. Classification of Two Volatiles Using an eNose Composed by an Array of 16 Single-Type Miniature Micro-Machined Metal-Oxide Gas Sensors. Sensors. 2022; 22(3):1120. https://doi.org/10.3390/s22031120
Chicago/Turabian StylePalacín, Jordi, Elena Rubies, Eduard Clotet, and David Martínez. 2022. "Classification of Two Volatiles Using an eNose Composed by an Array of 16 Single-Type Miniature Micro-Machined Metal-Oxide Gas Sensors" Sensors 22, no. 3: 1120. https://doi.org/10.3390/s22031120
APA StylePalacín, J., Rubies, E., Clotet, E., & Martínez, D. (2022). Classification of Two Volatiles Using an eNose Composed by an Array of 16 Single-Type Miniature Micro-Machined Metal-Oxide Gas Sensors. Sensors, 22(3), 1120. https://doi.org/10.3390/s22031120