
Compact Sphere-Shaped Airflow Vector Sensor Based on MEMS Differential Pressure Sensors

 ,
, 
Abstract
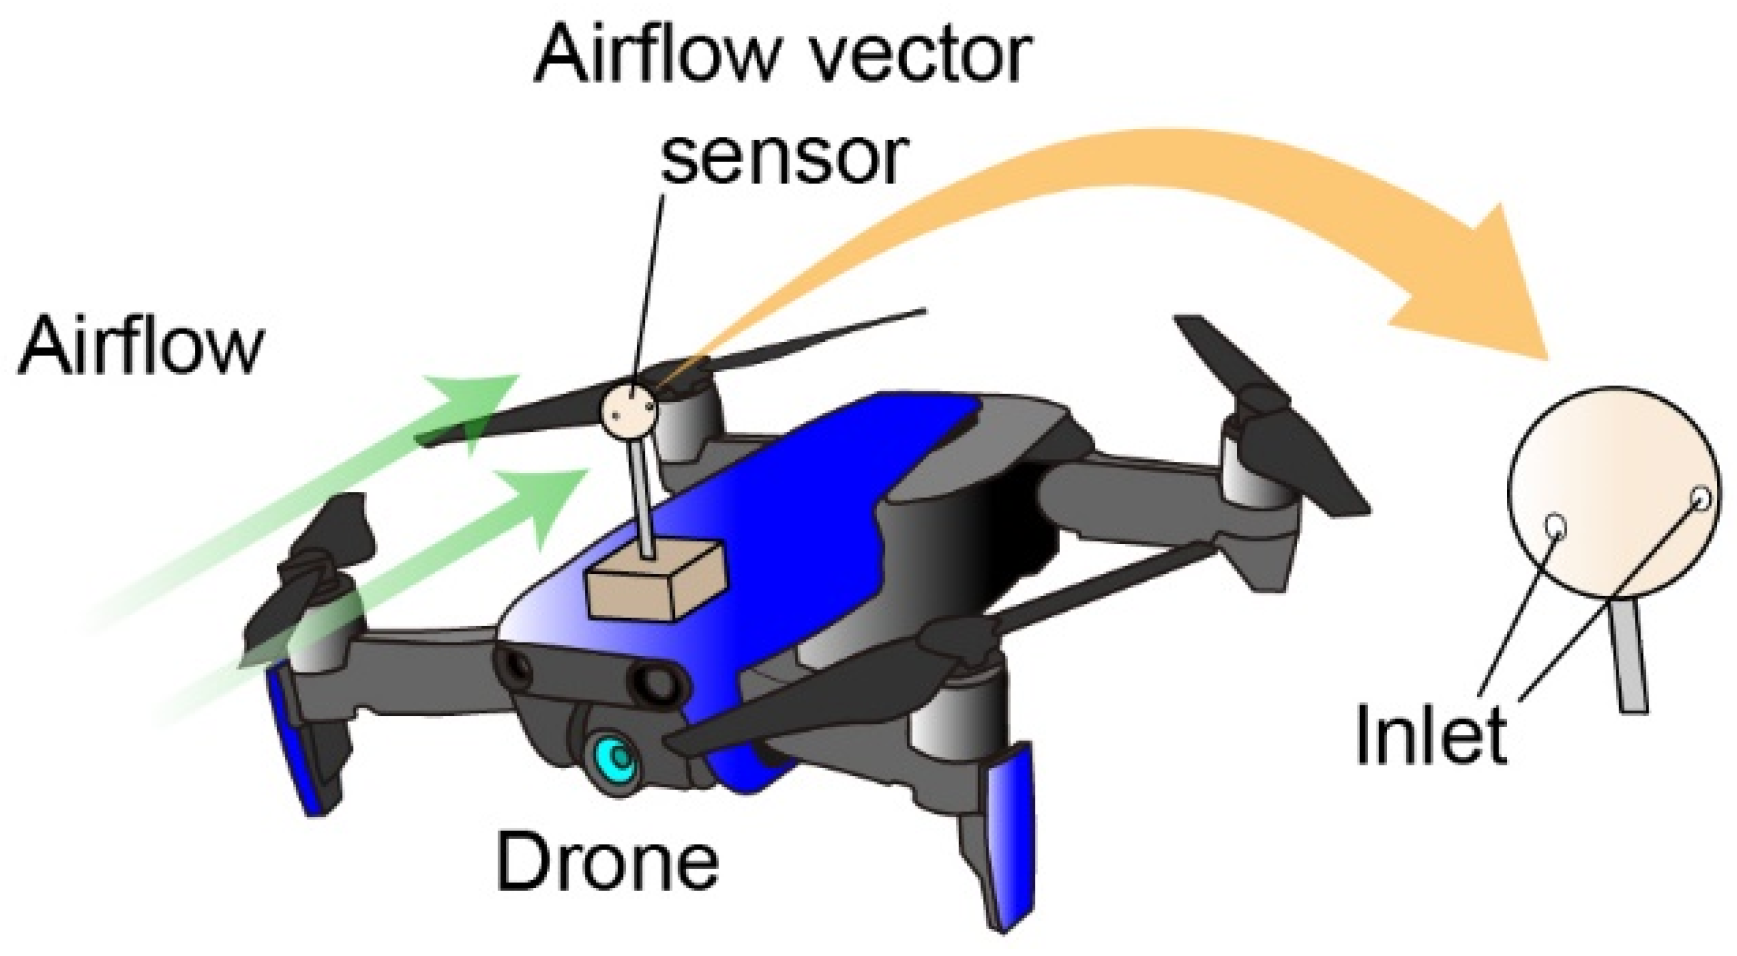
:1. Introduction
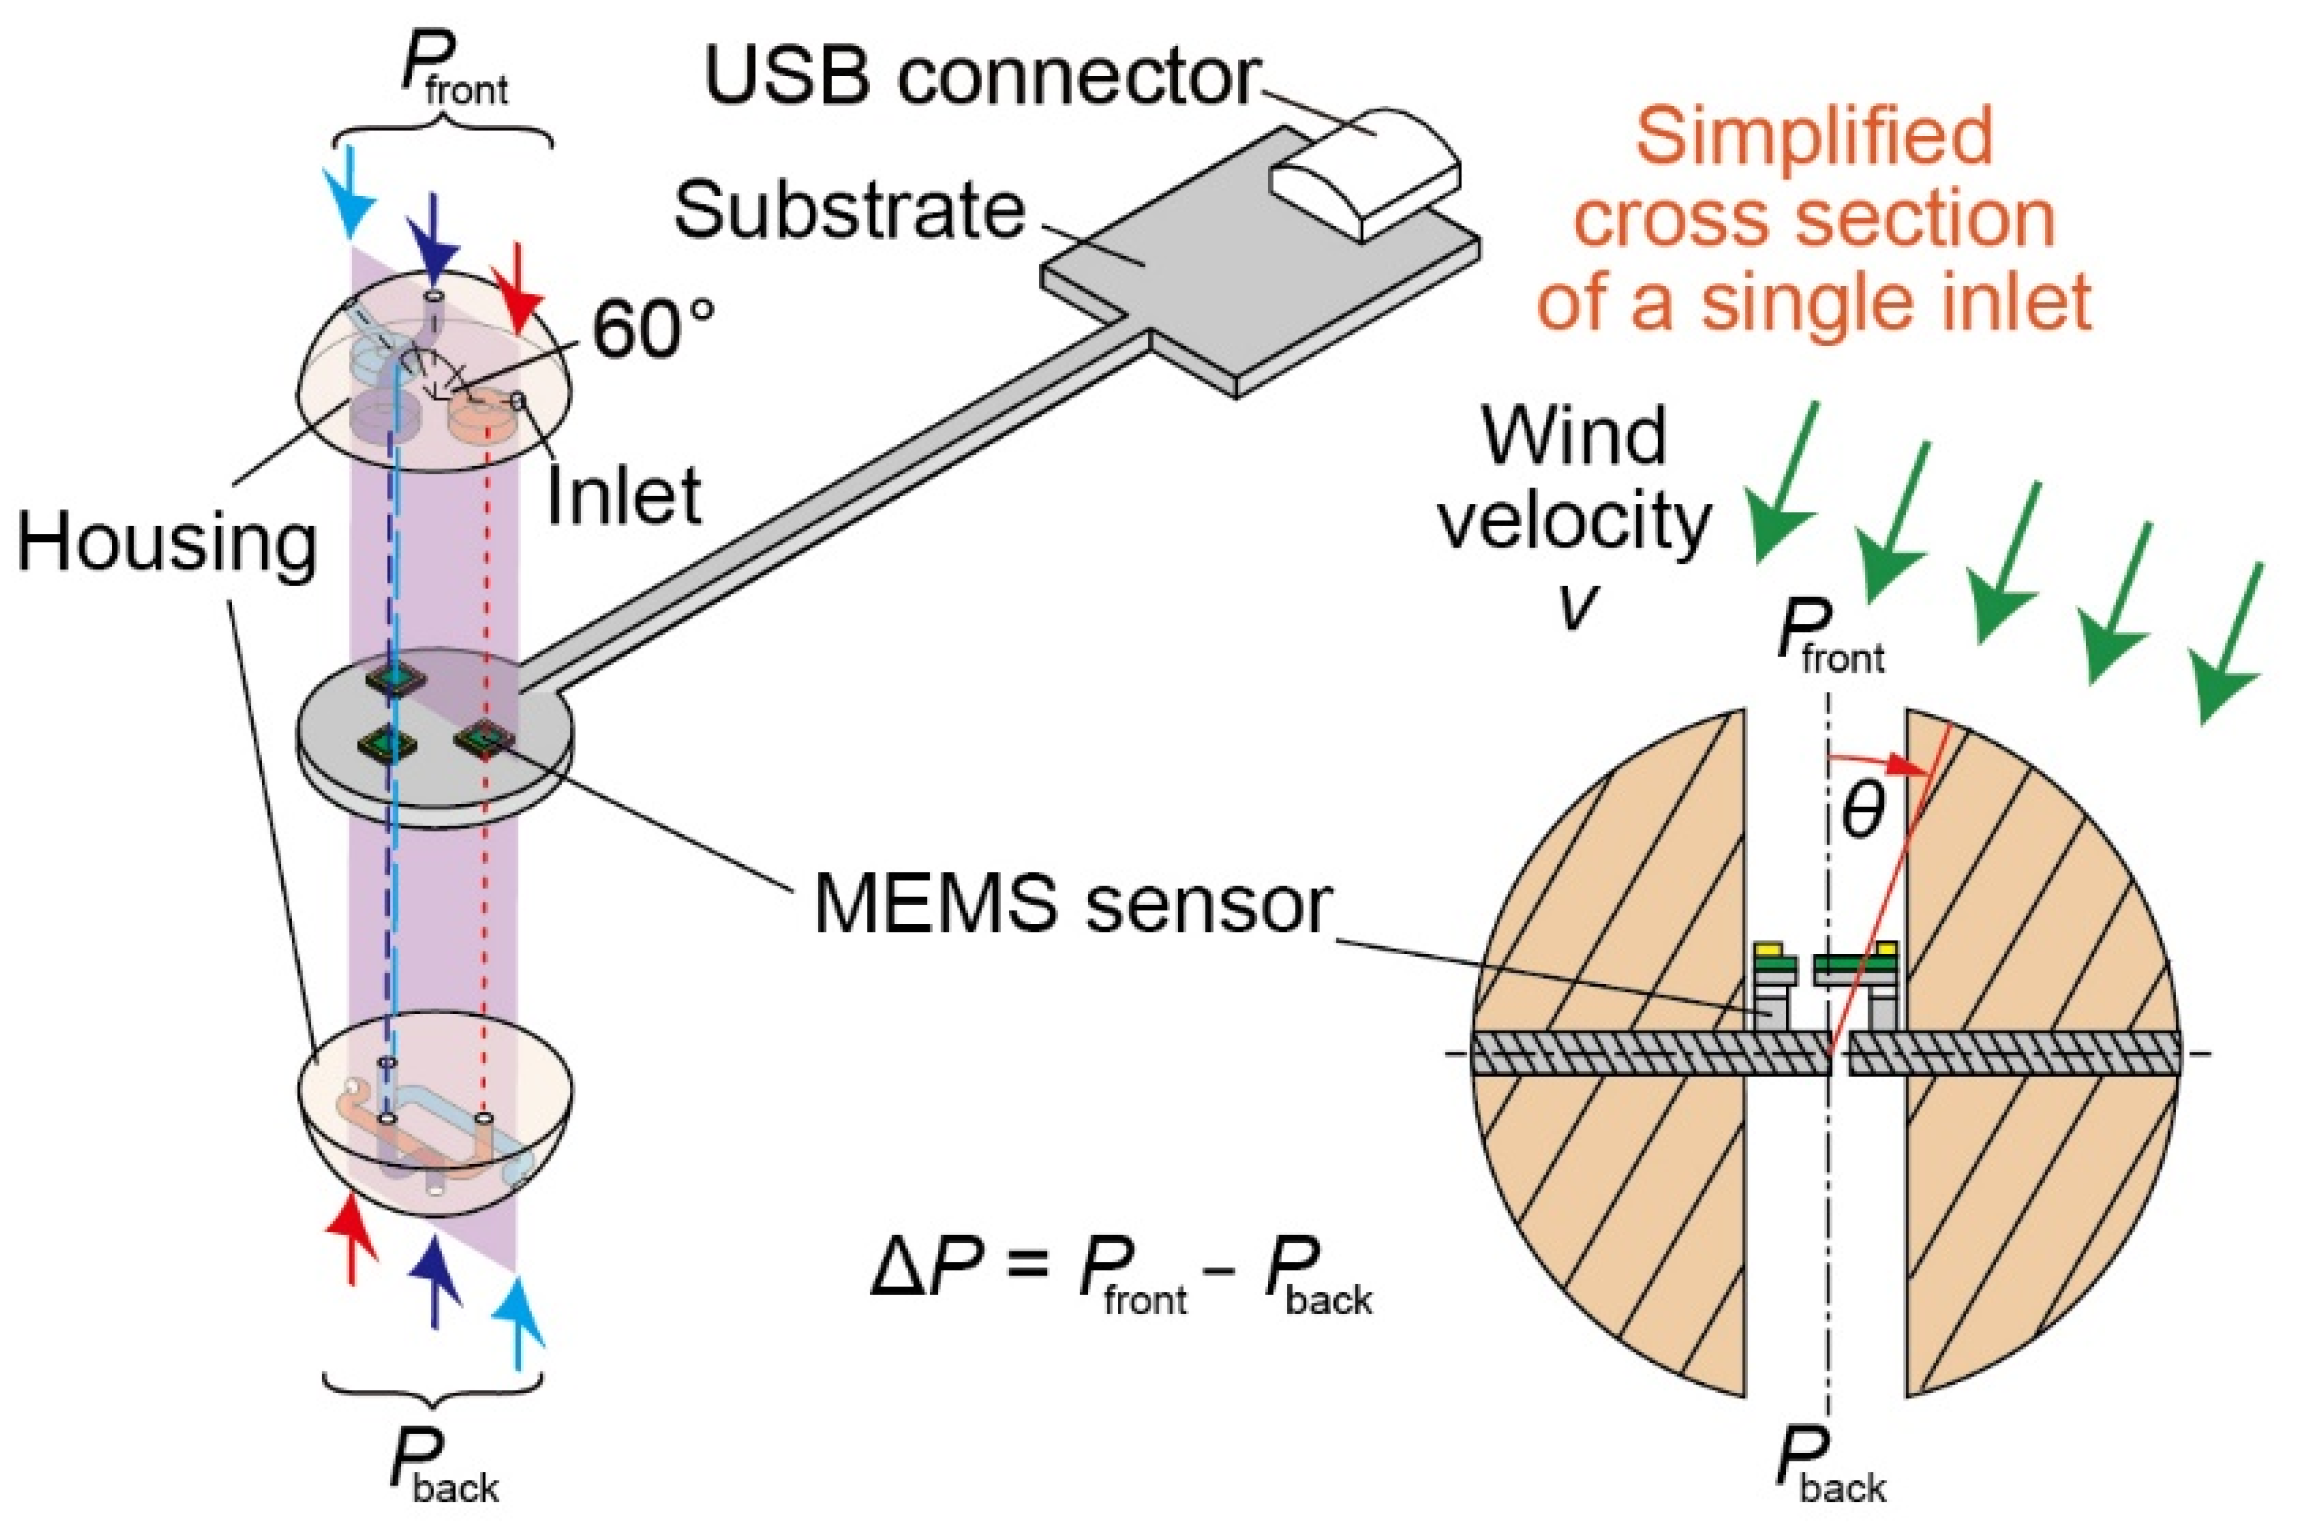
2. Design and Principle
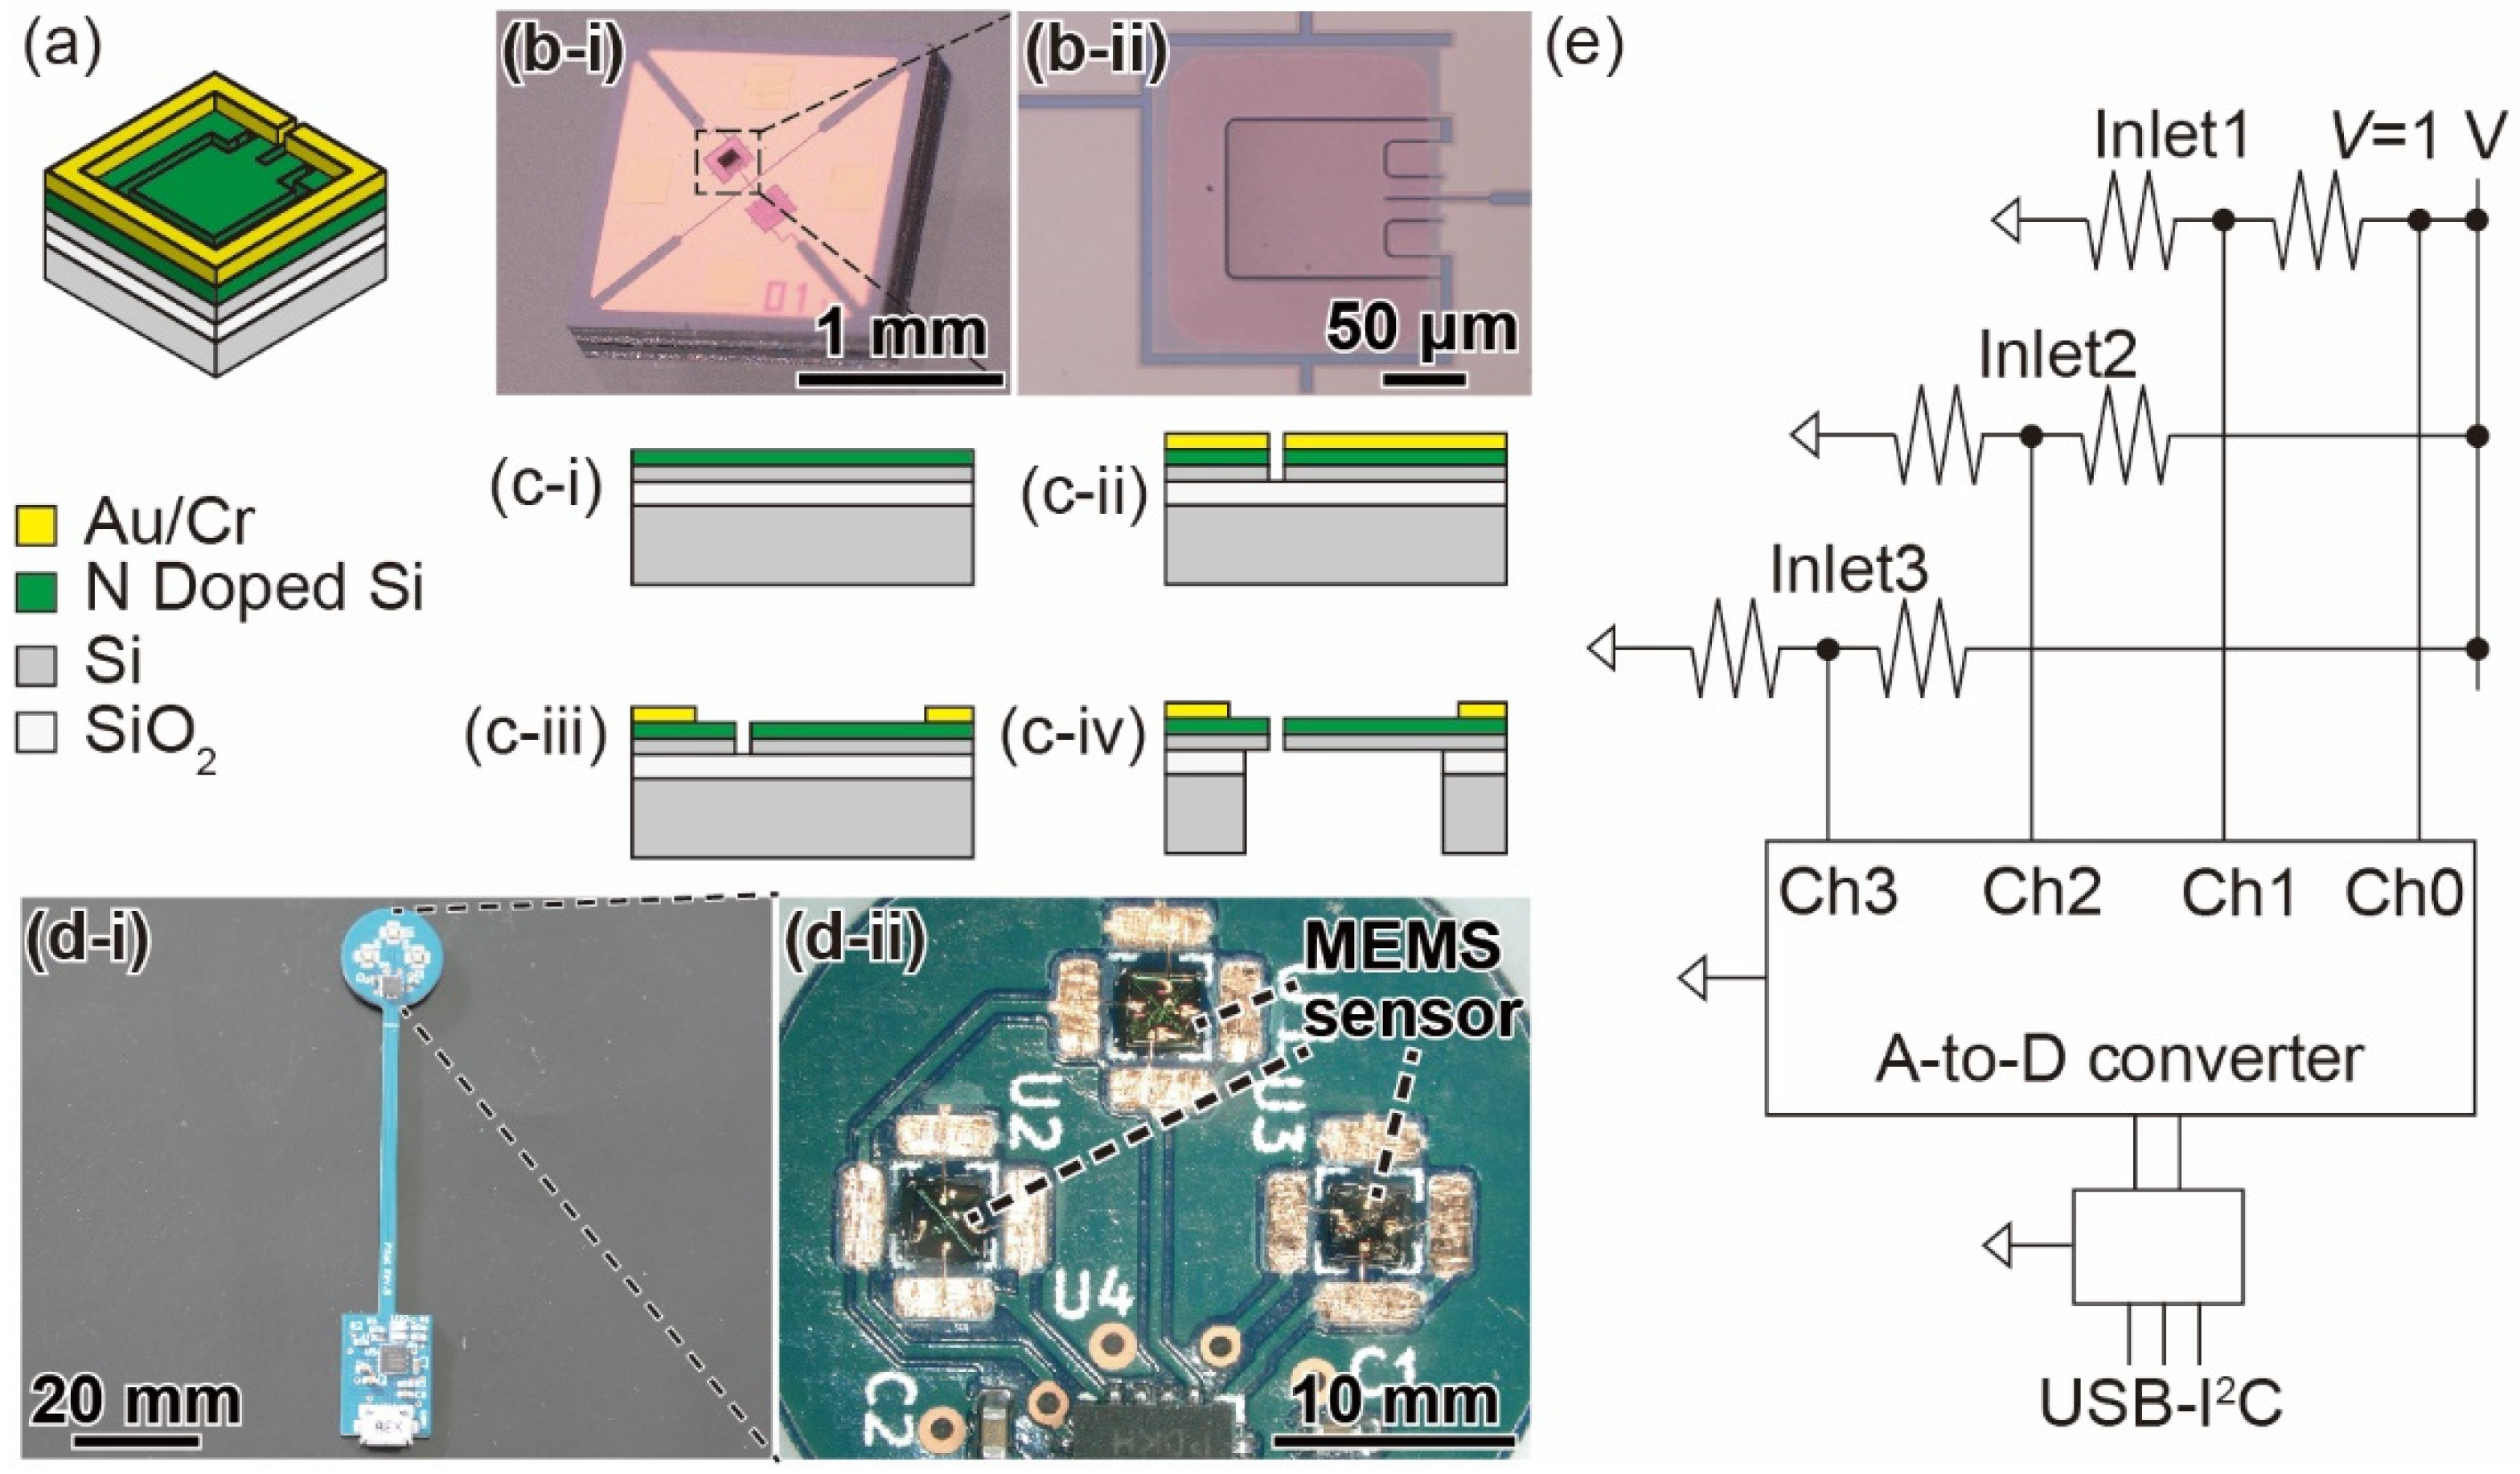
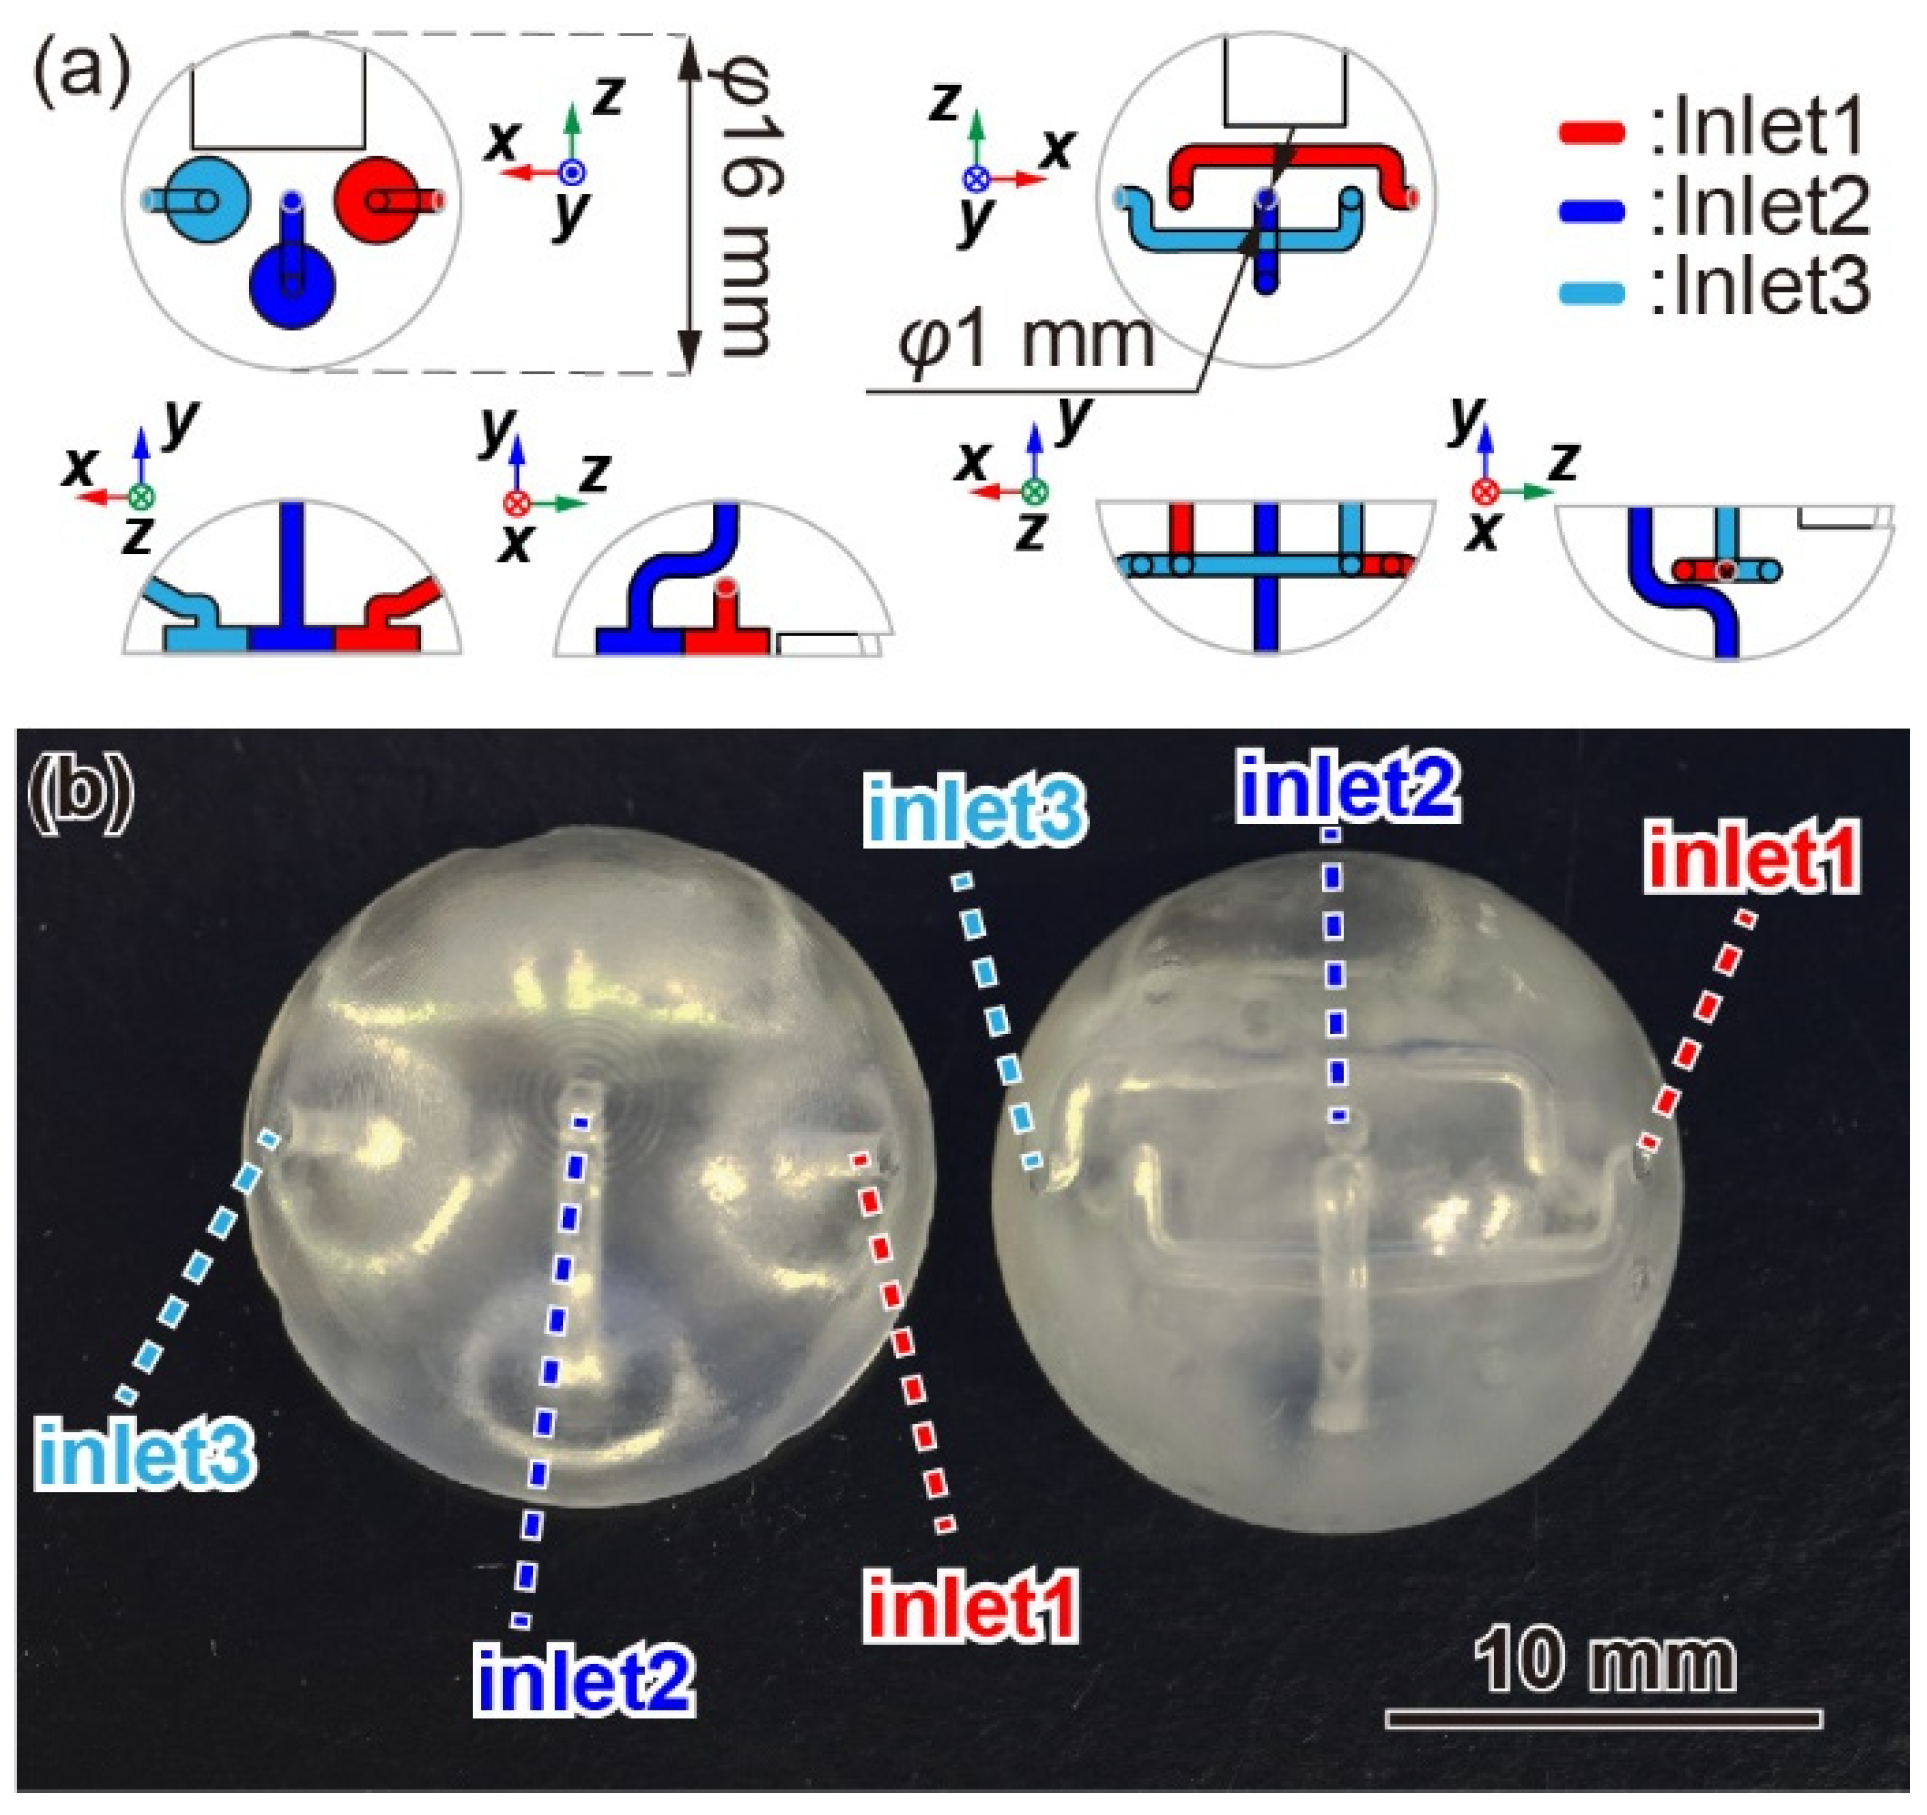
2.1. Sensor Design
2.2. Airflow Detection Principle
3. Fabrication and Assembly
3.1. MEMS Sensor Chip and Circuit Design
3.2. Sensor Housing
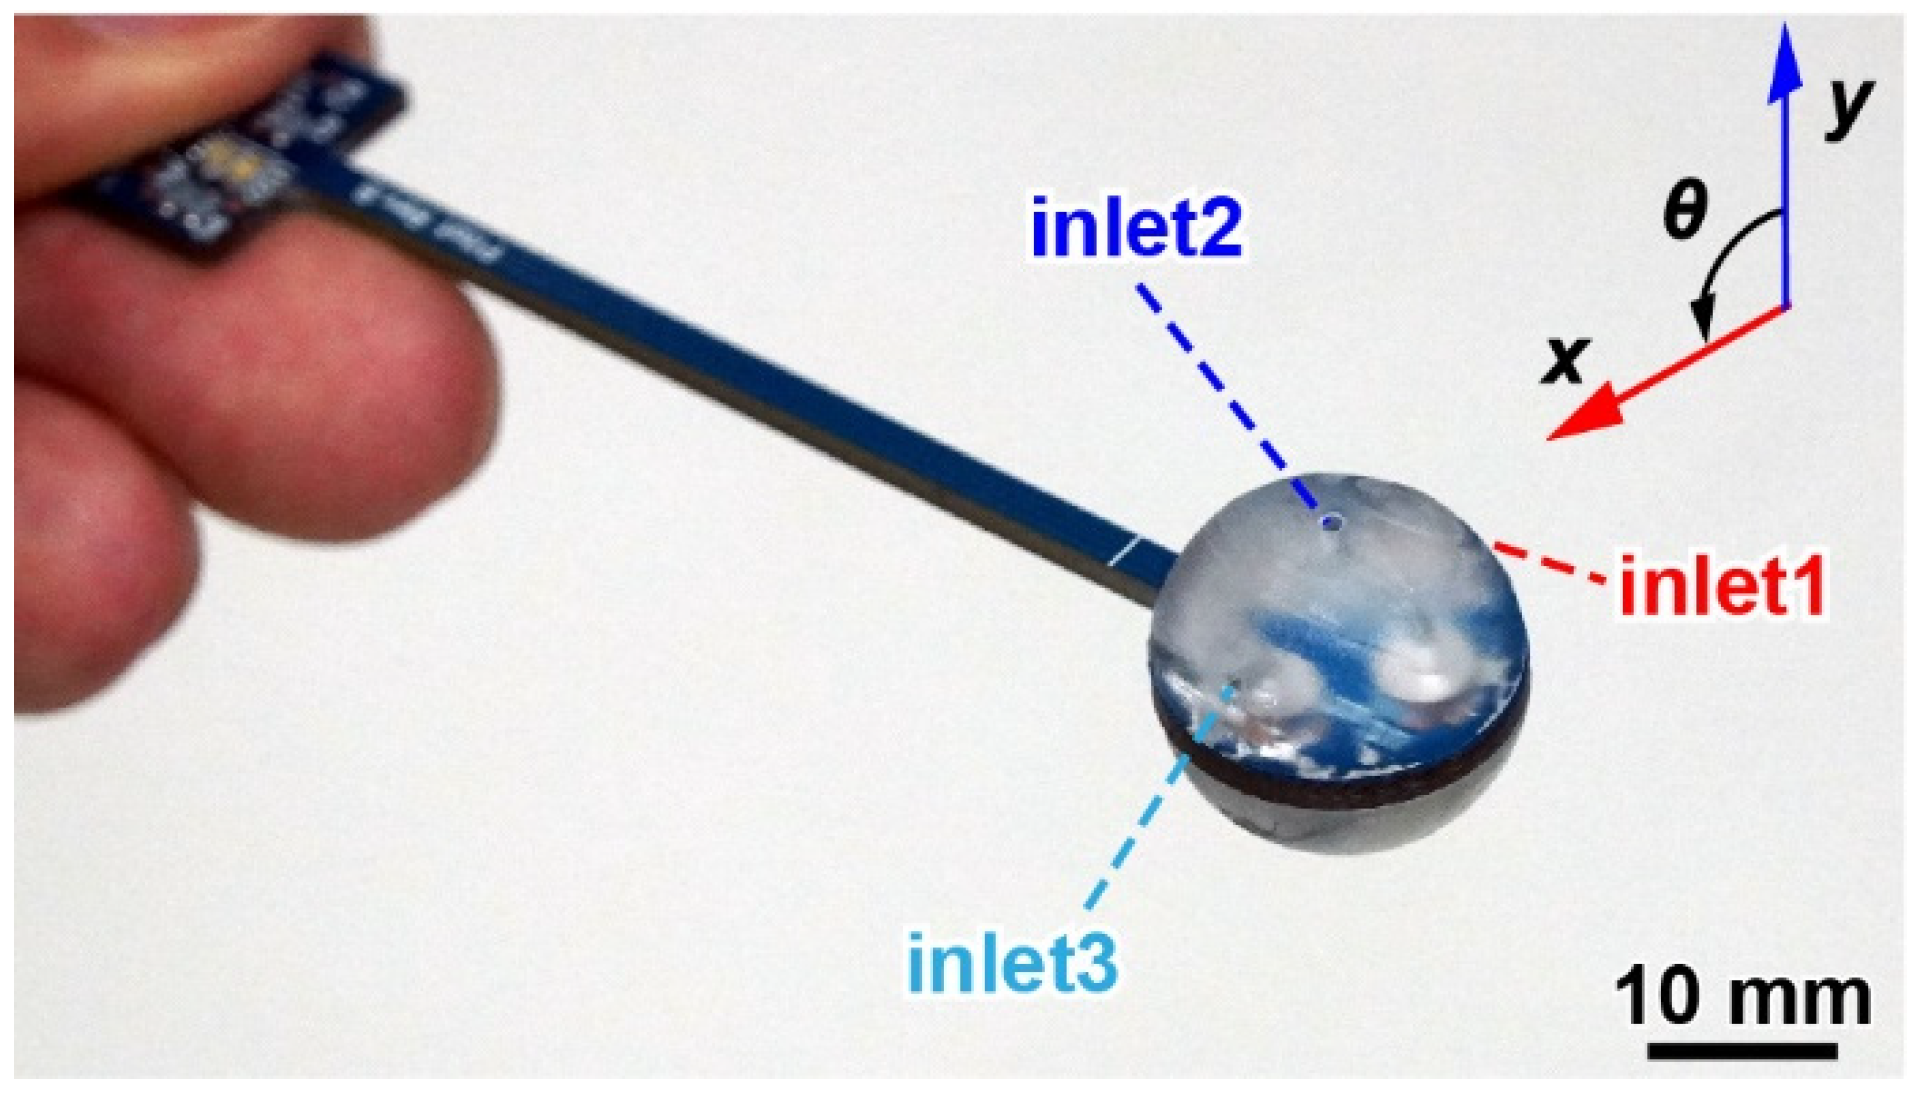
3.3. Sensor Assembly
4. Experiment and Results
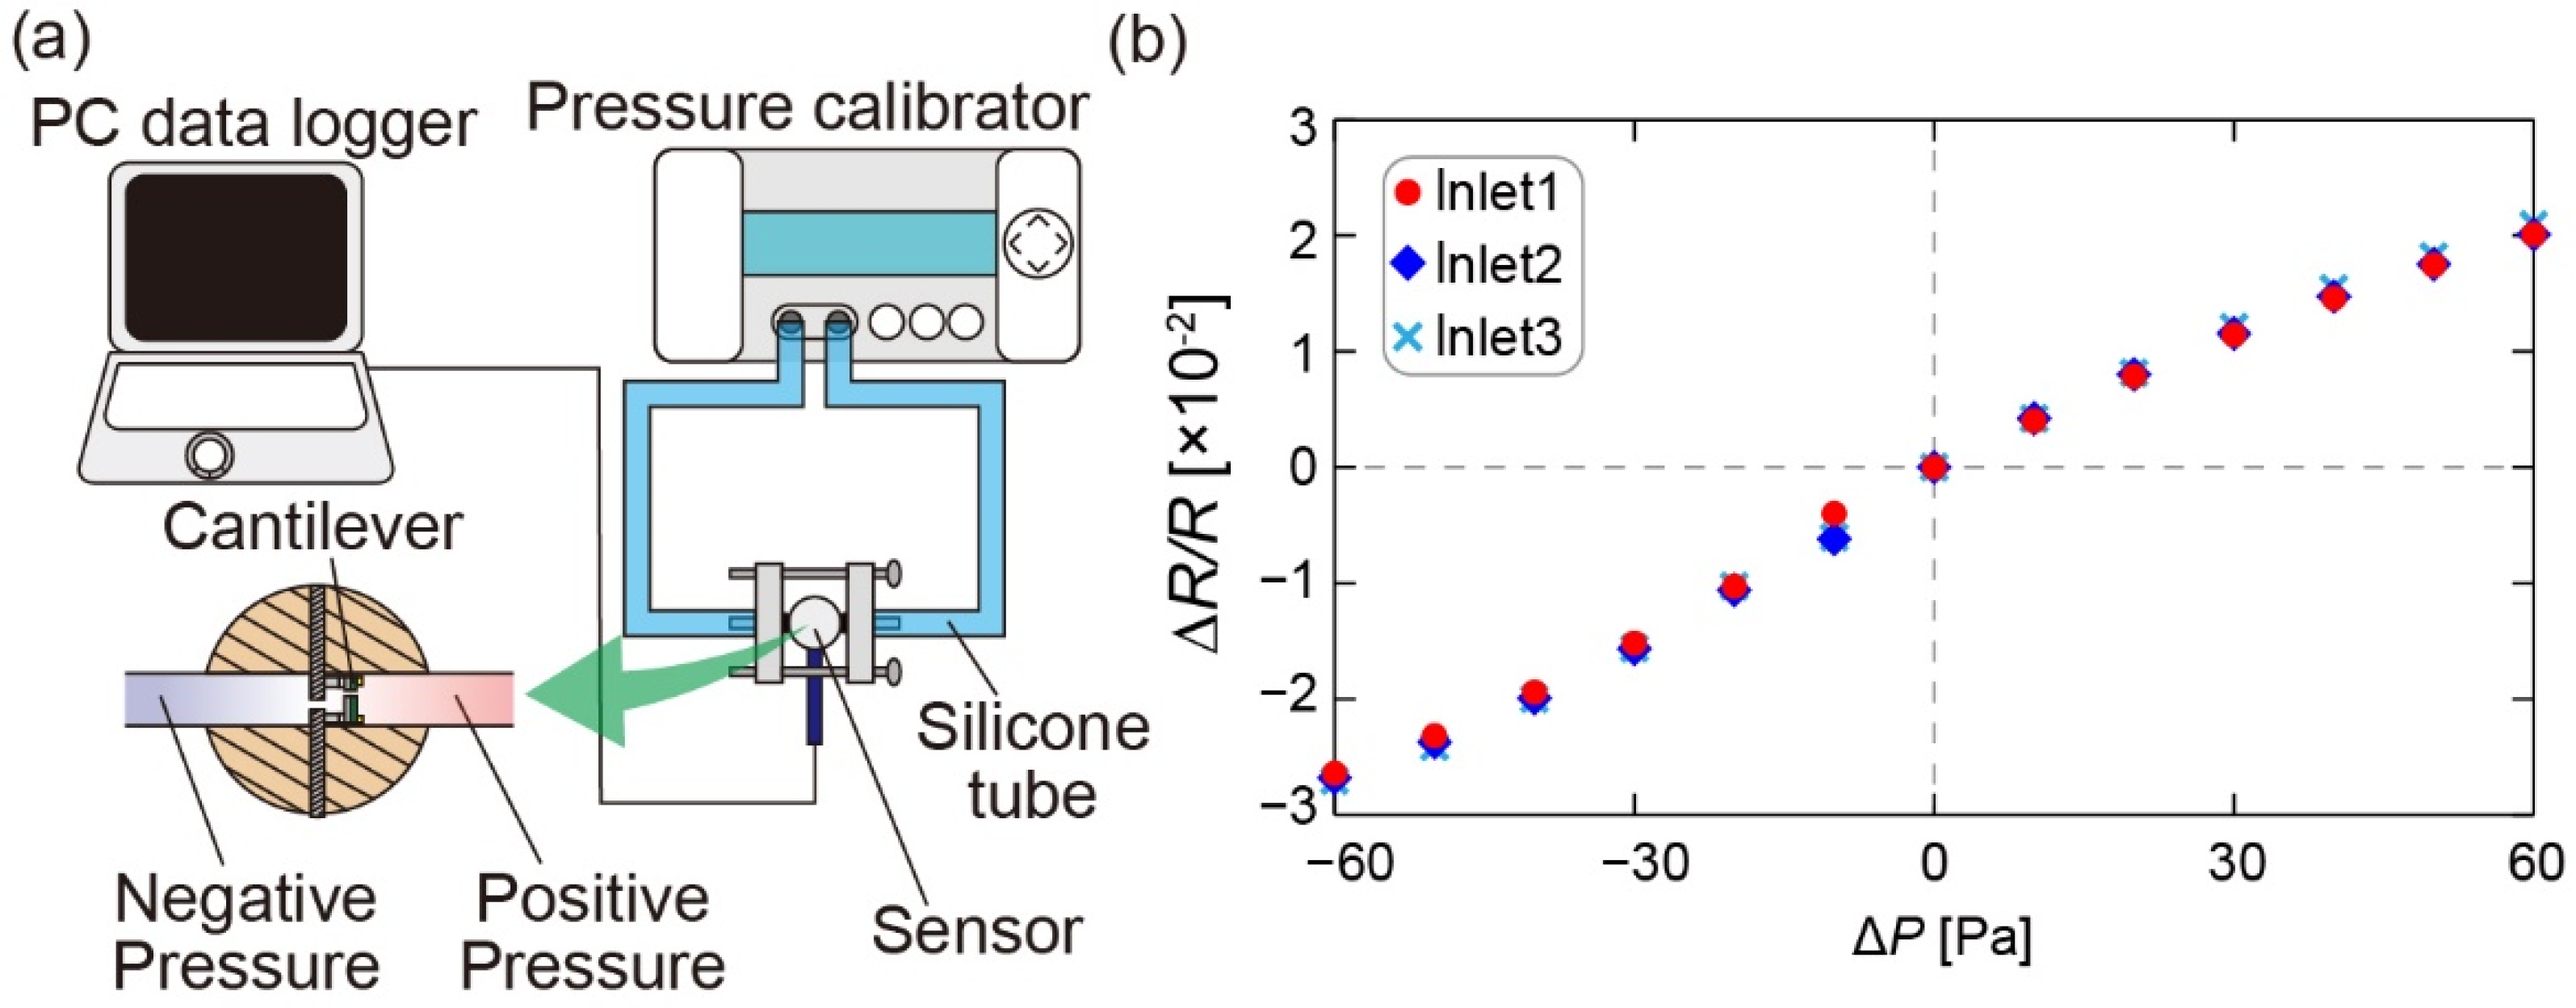
4.1. Differential Pressure Calibration
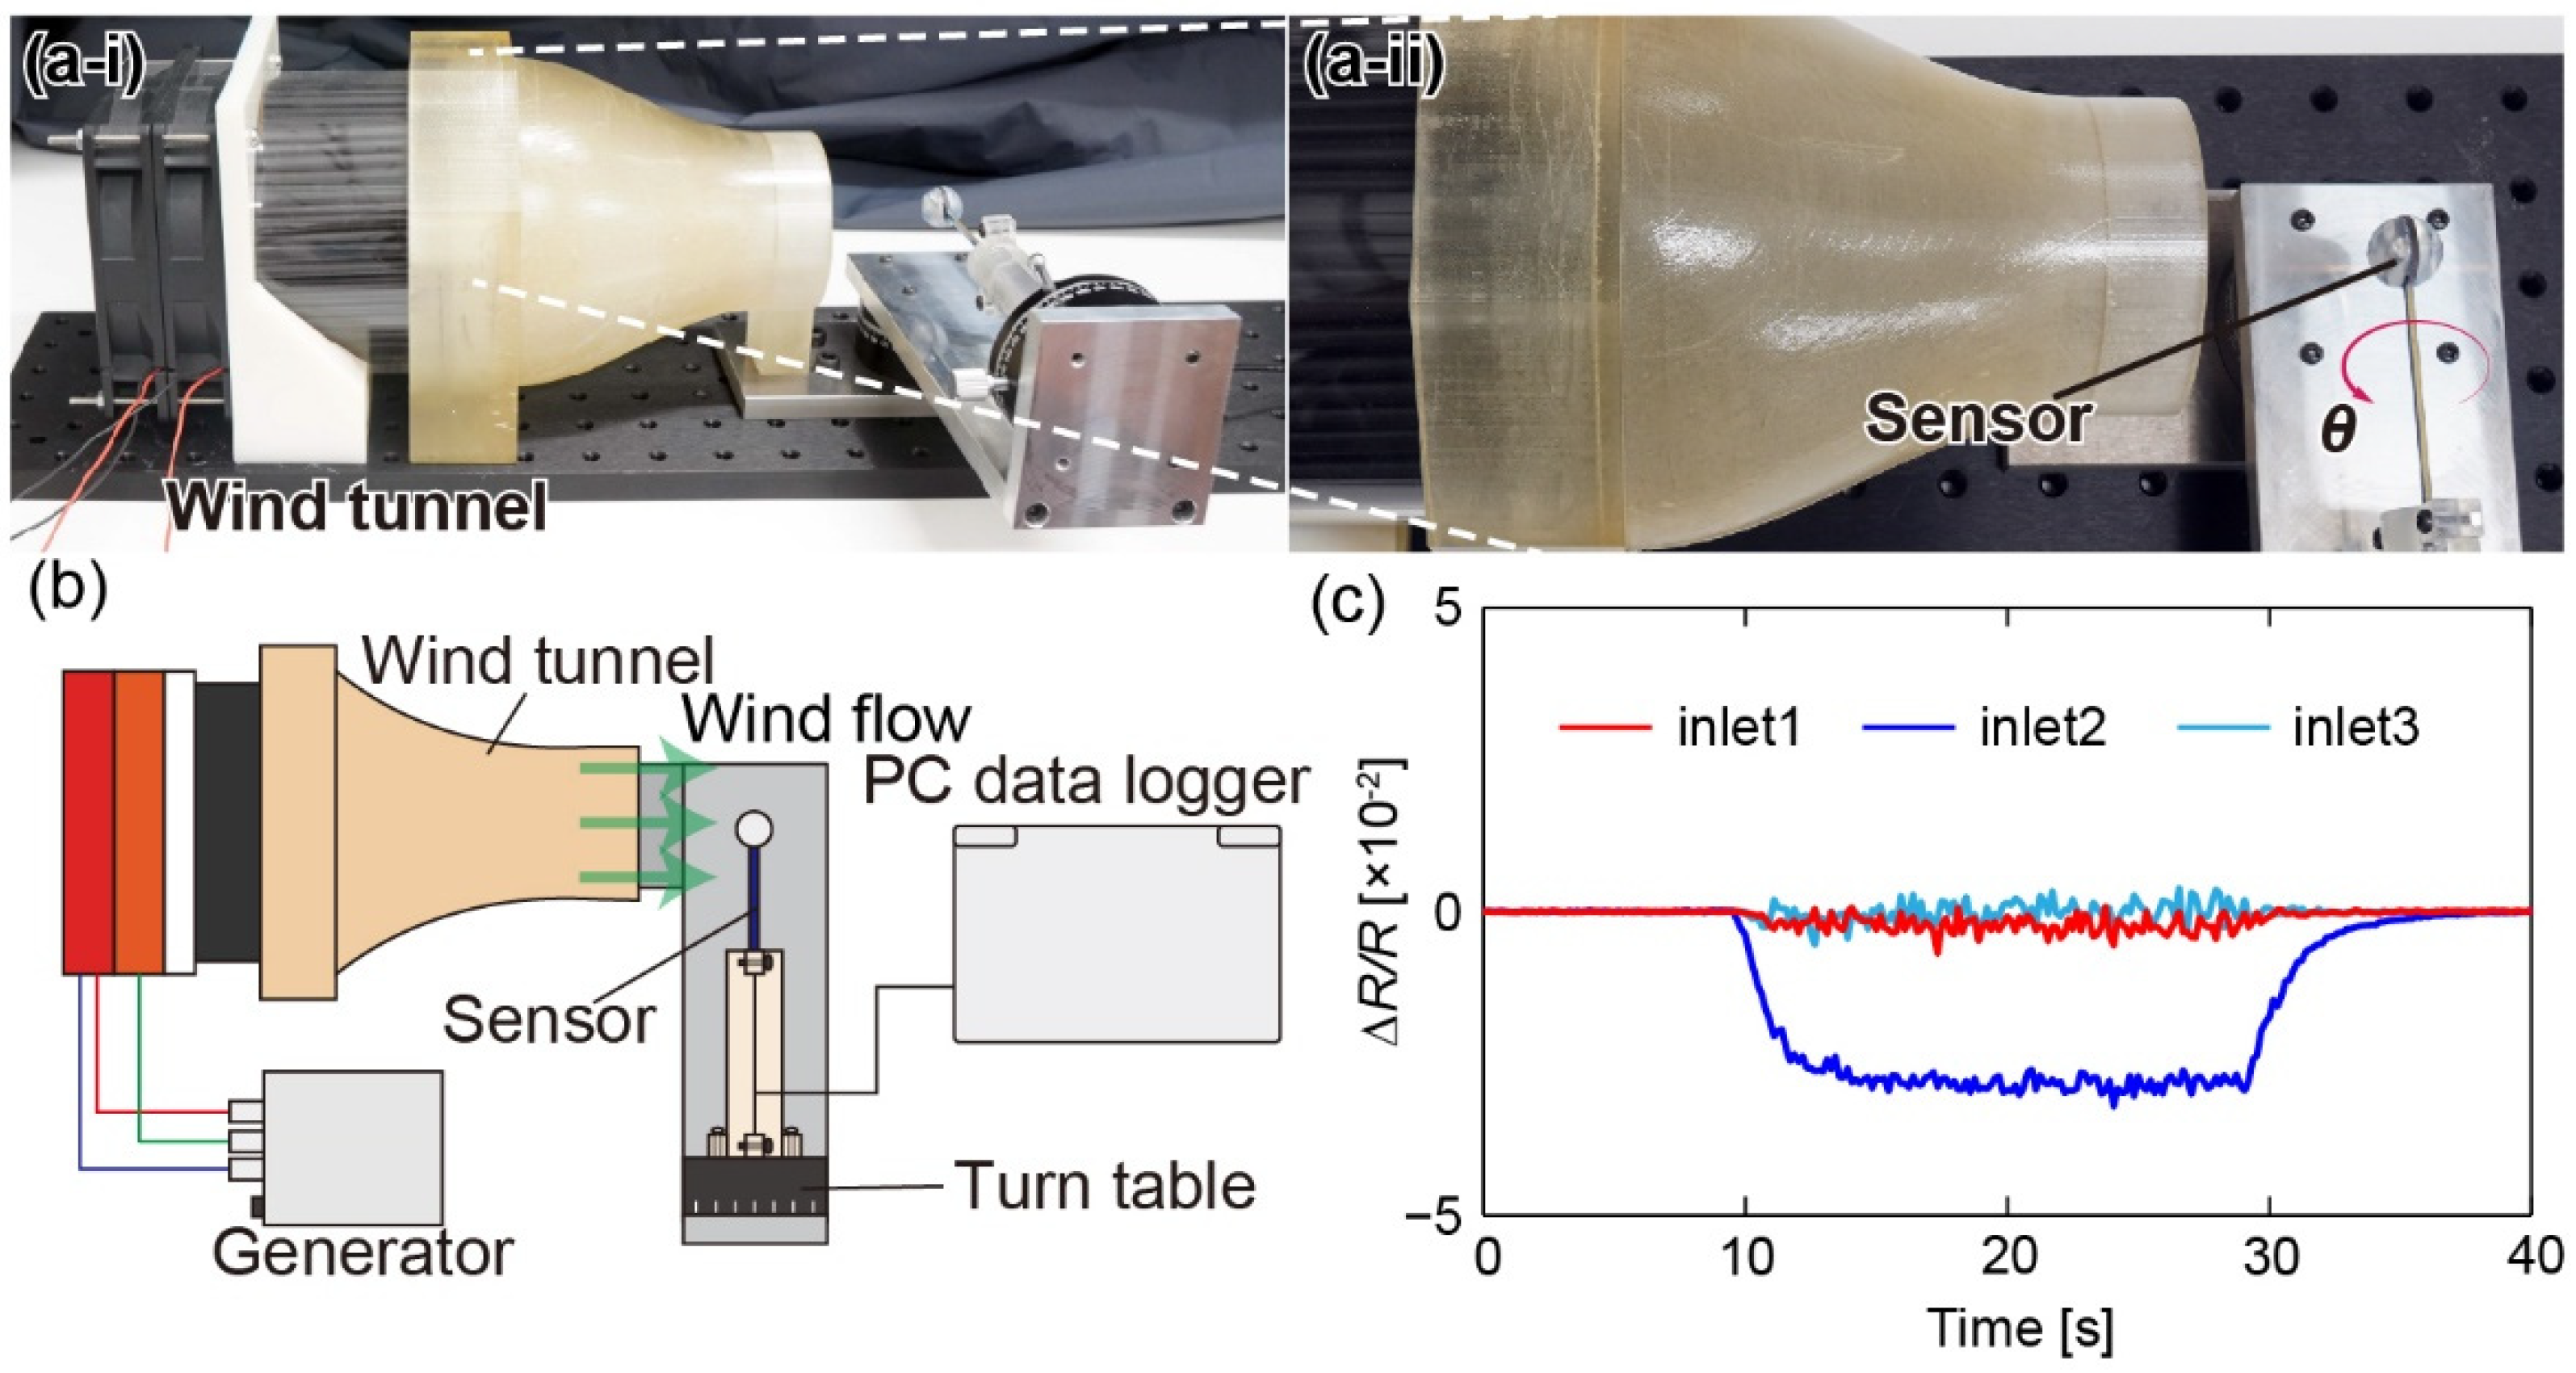
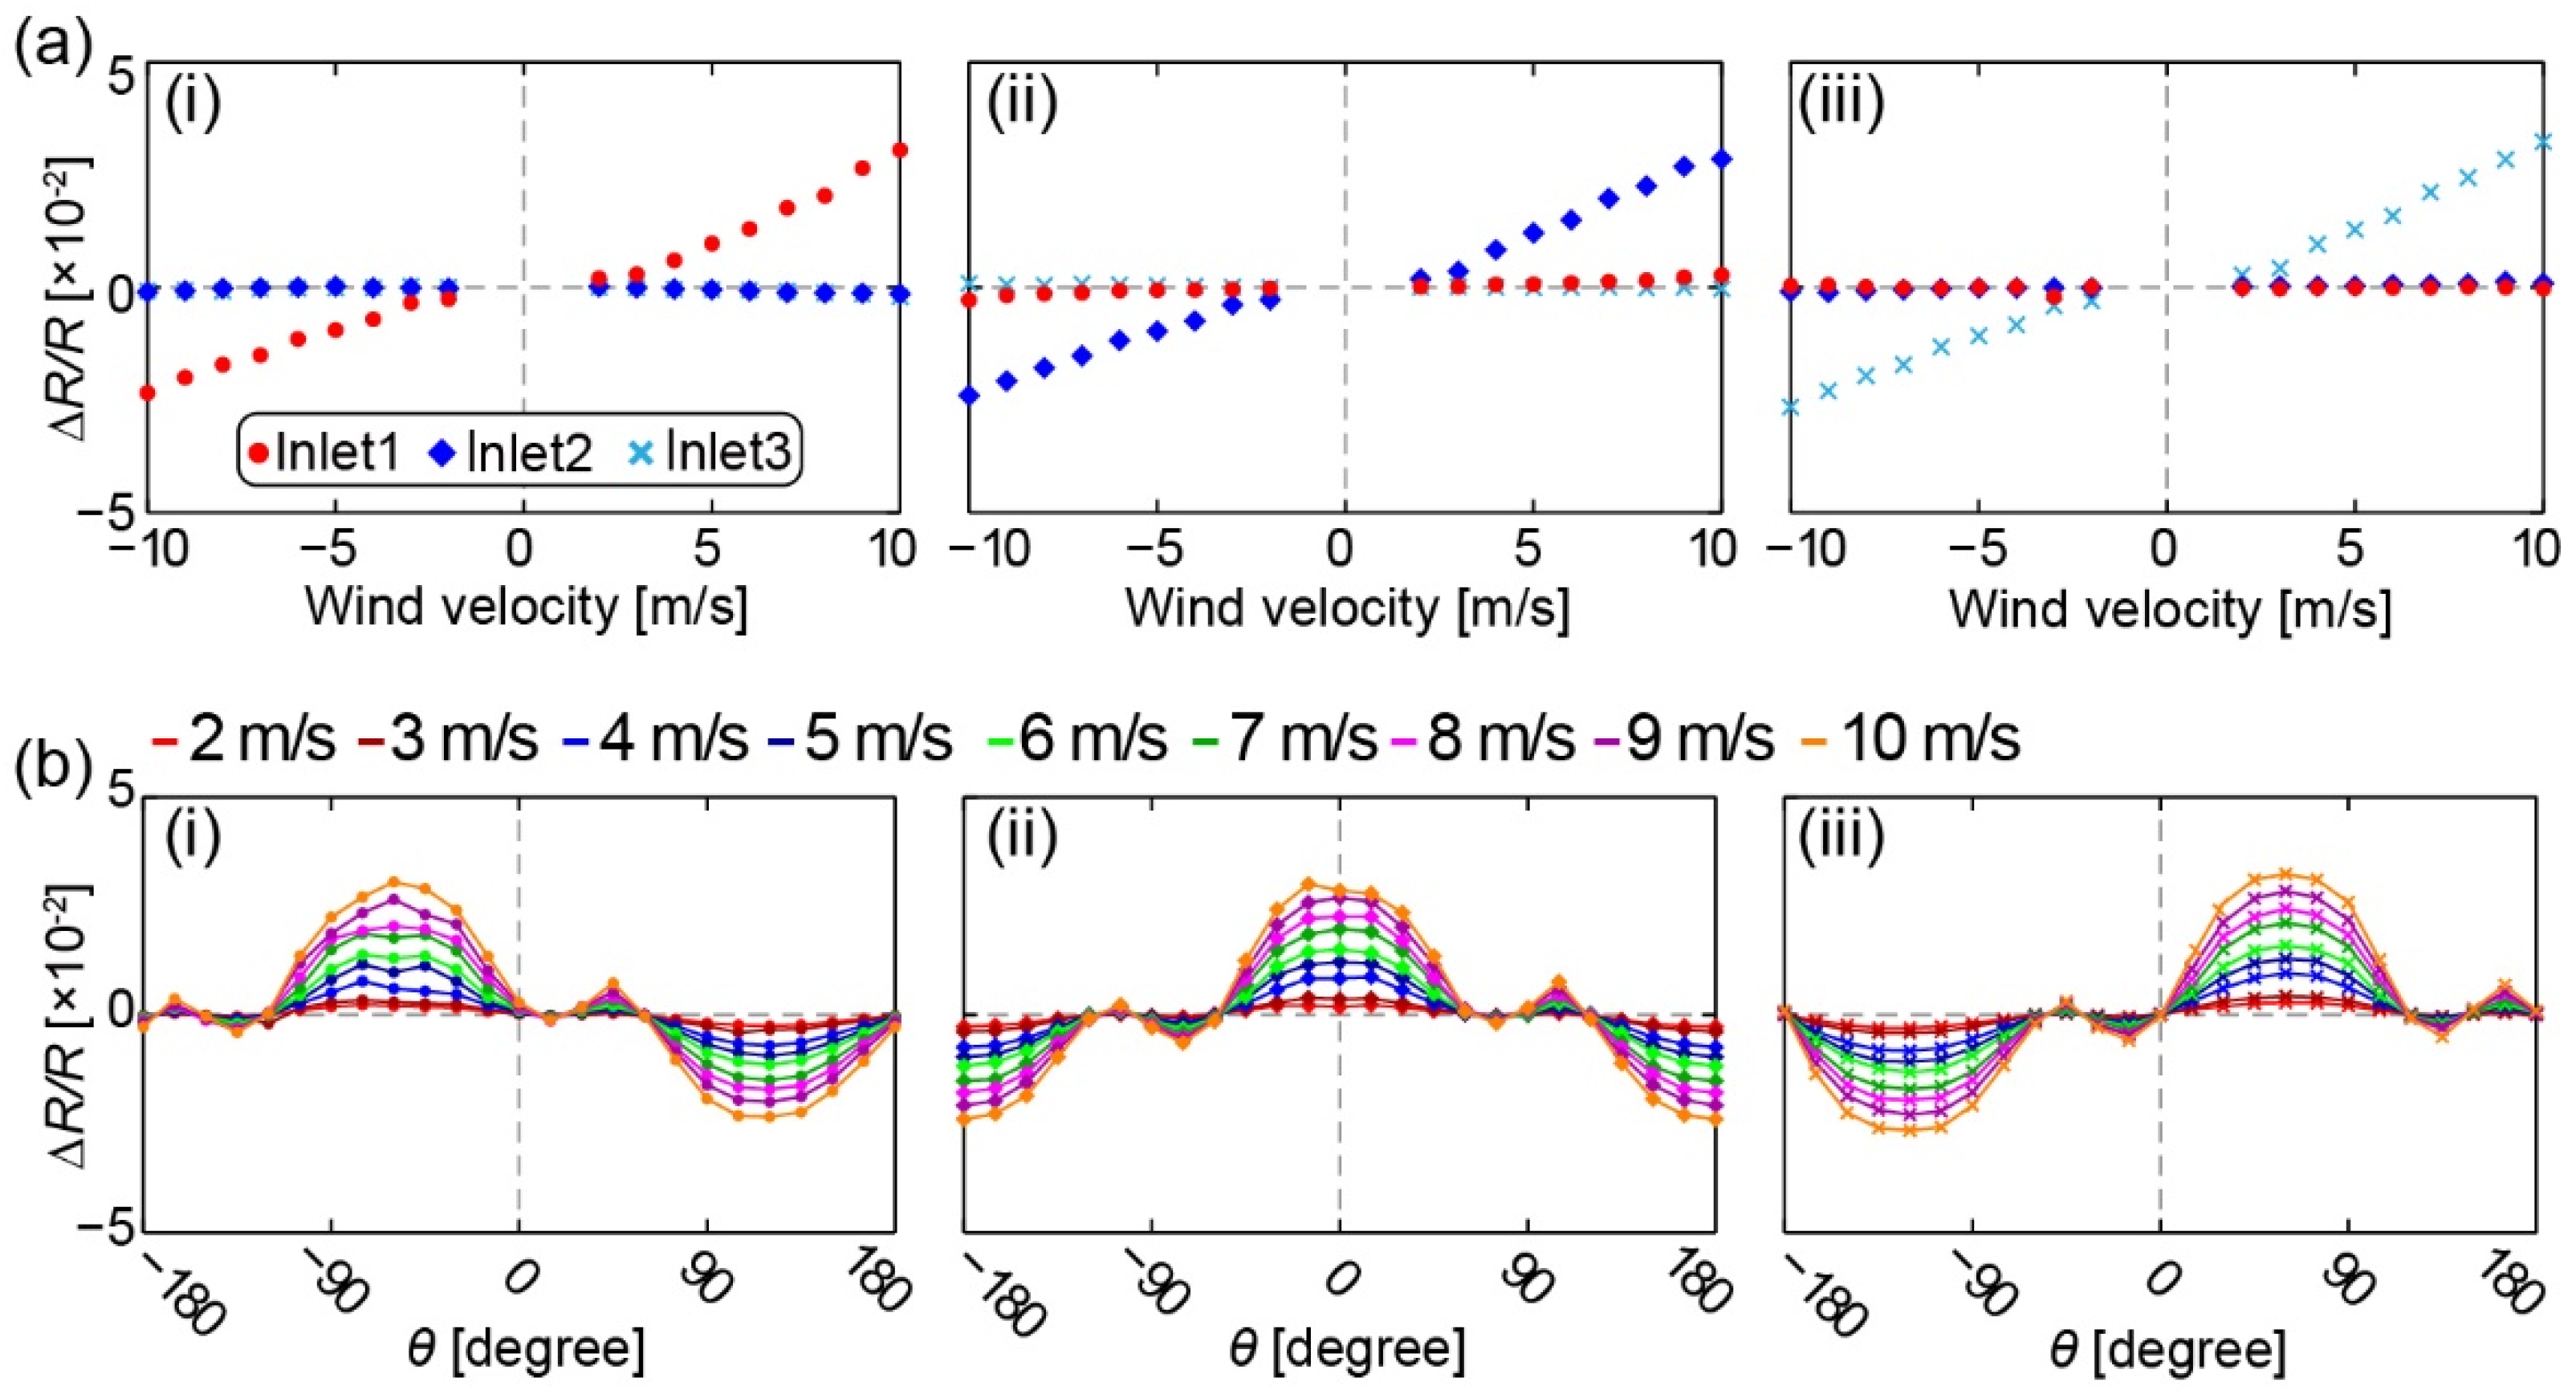
4.2. Wind Tunnel Test
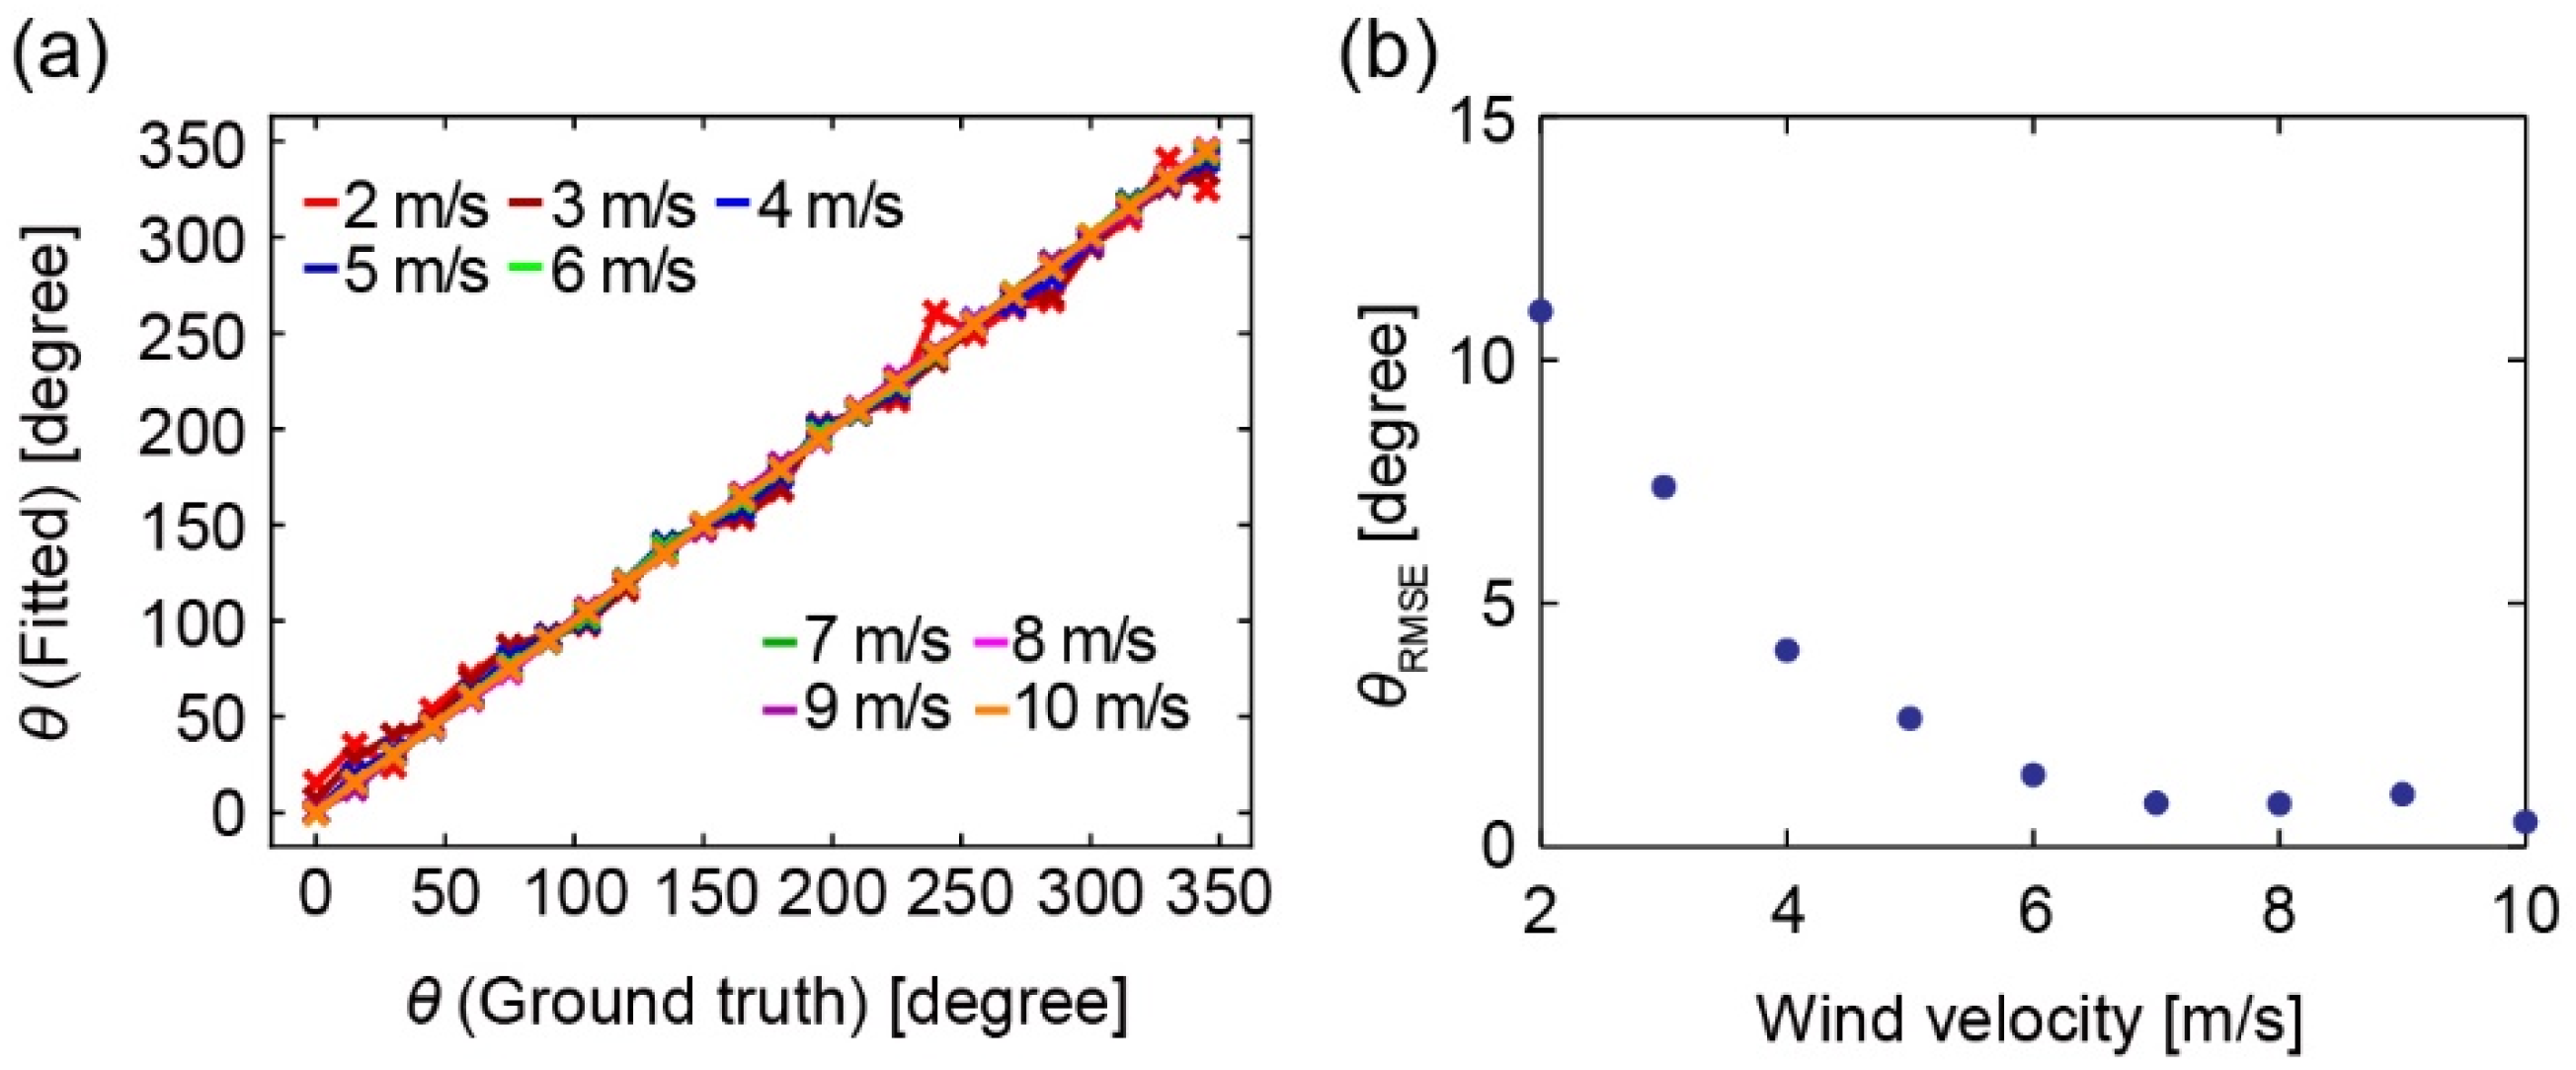
4.3. Conversion to Wind Velocity and Angle
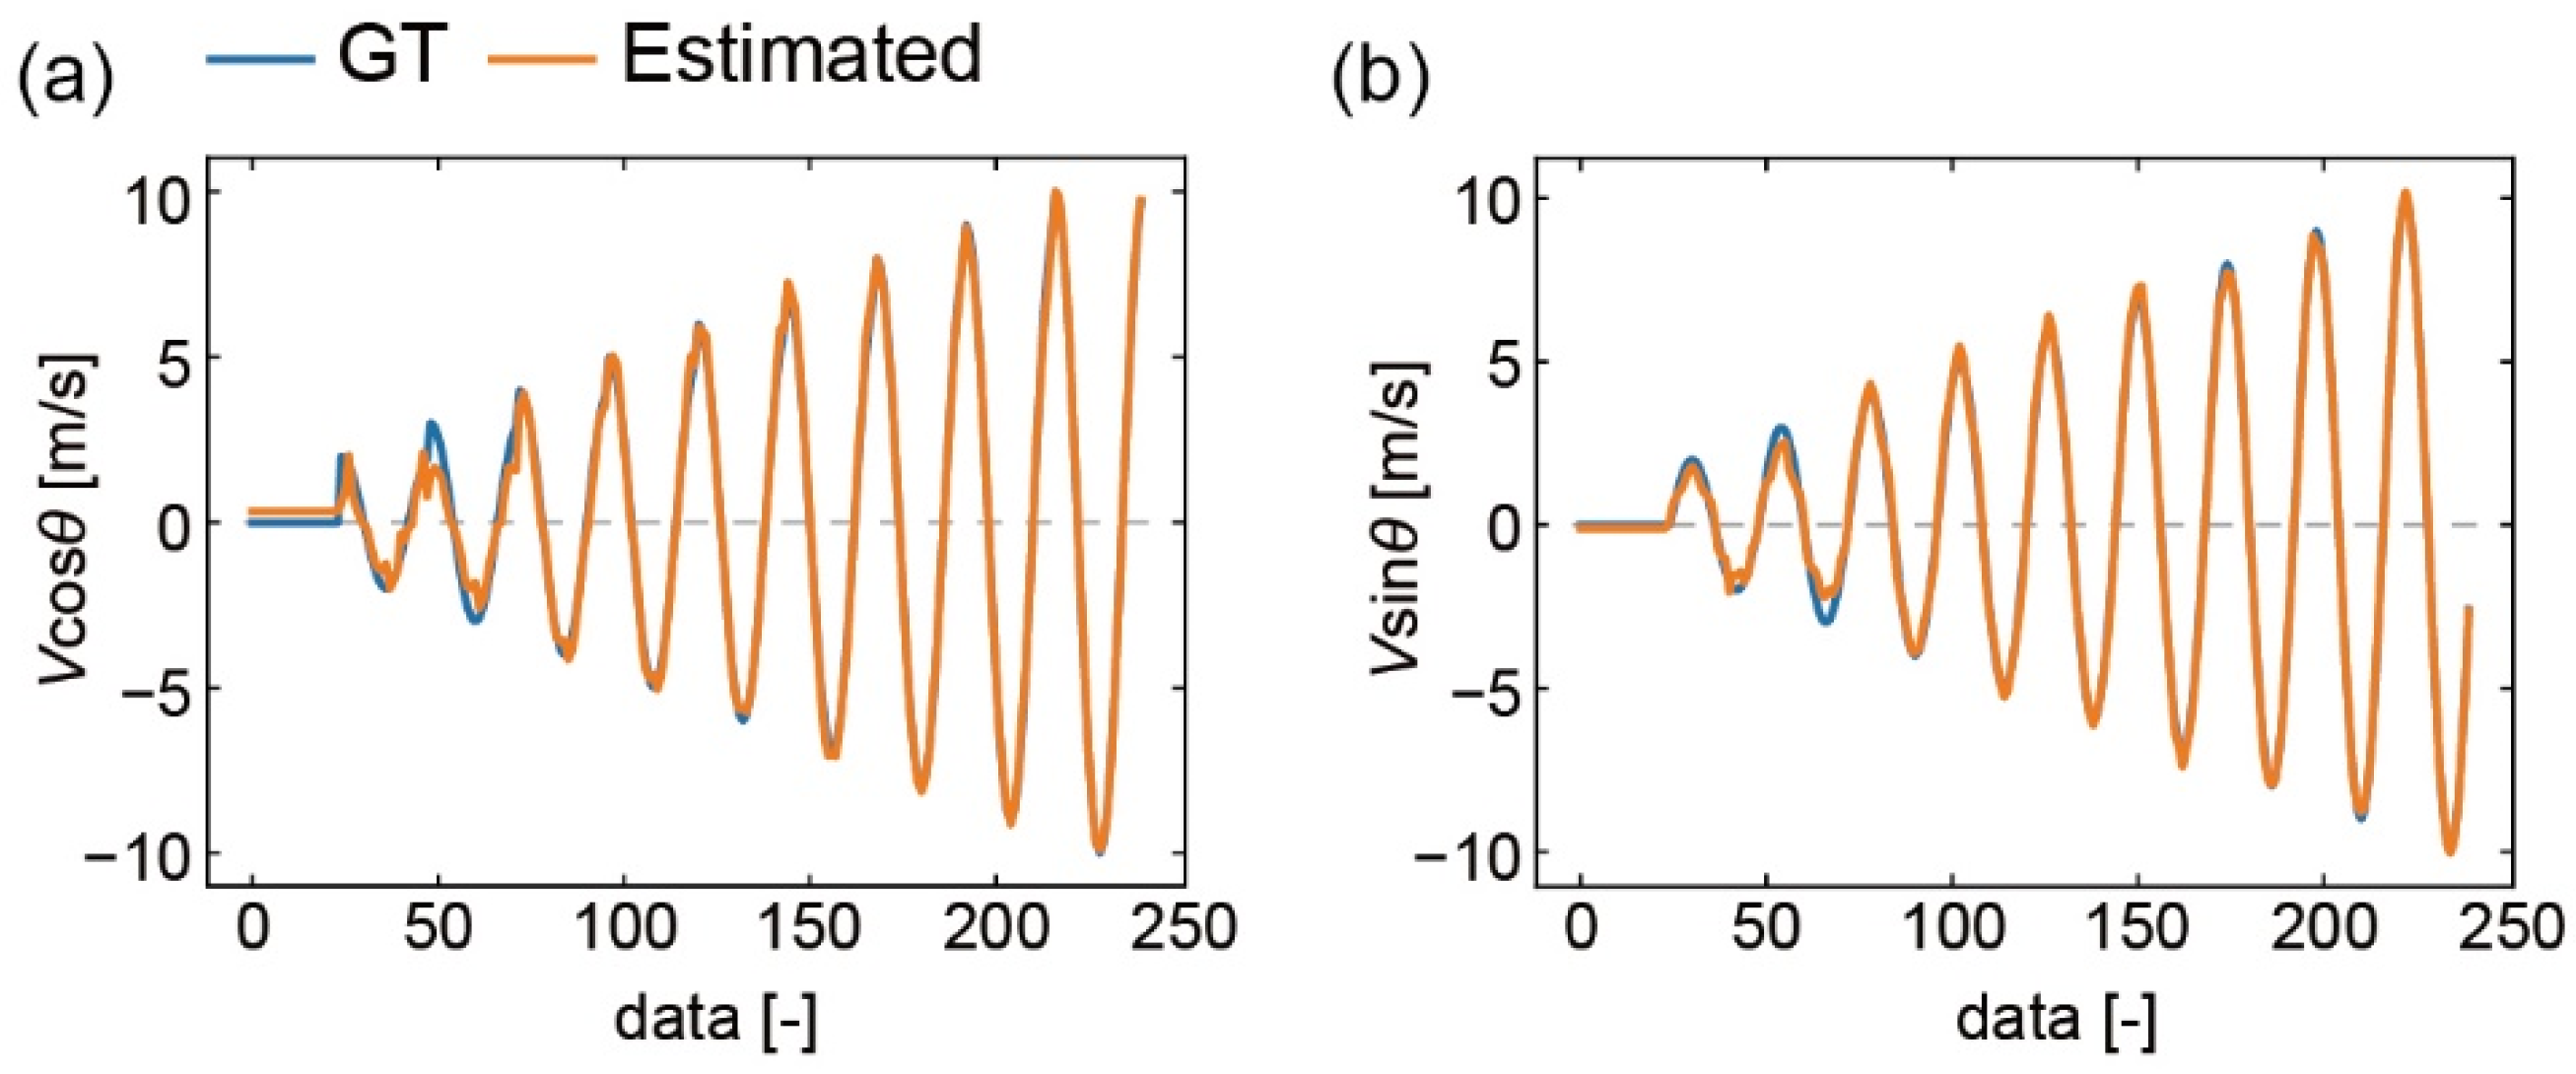
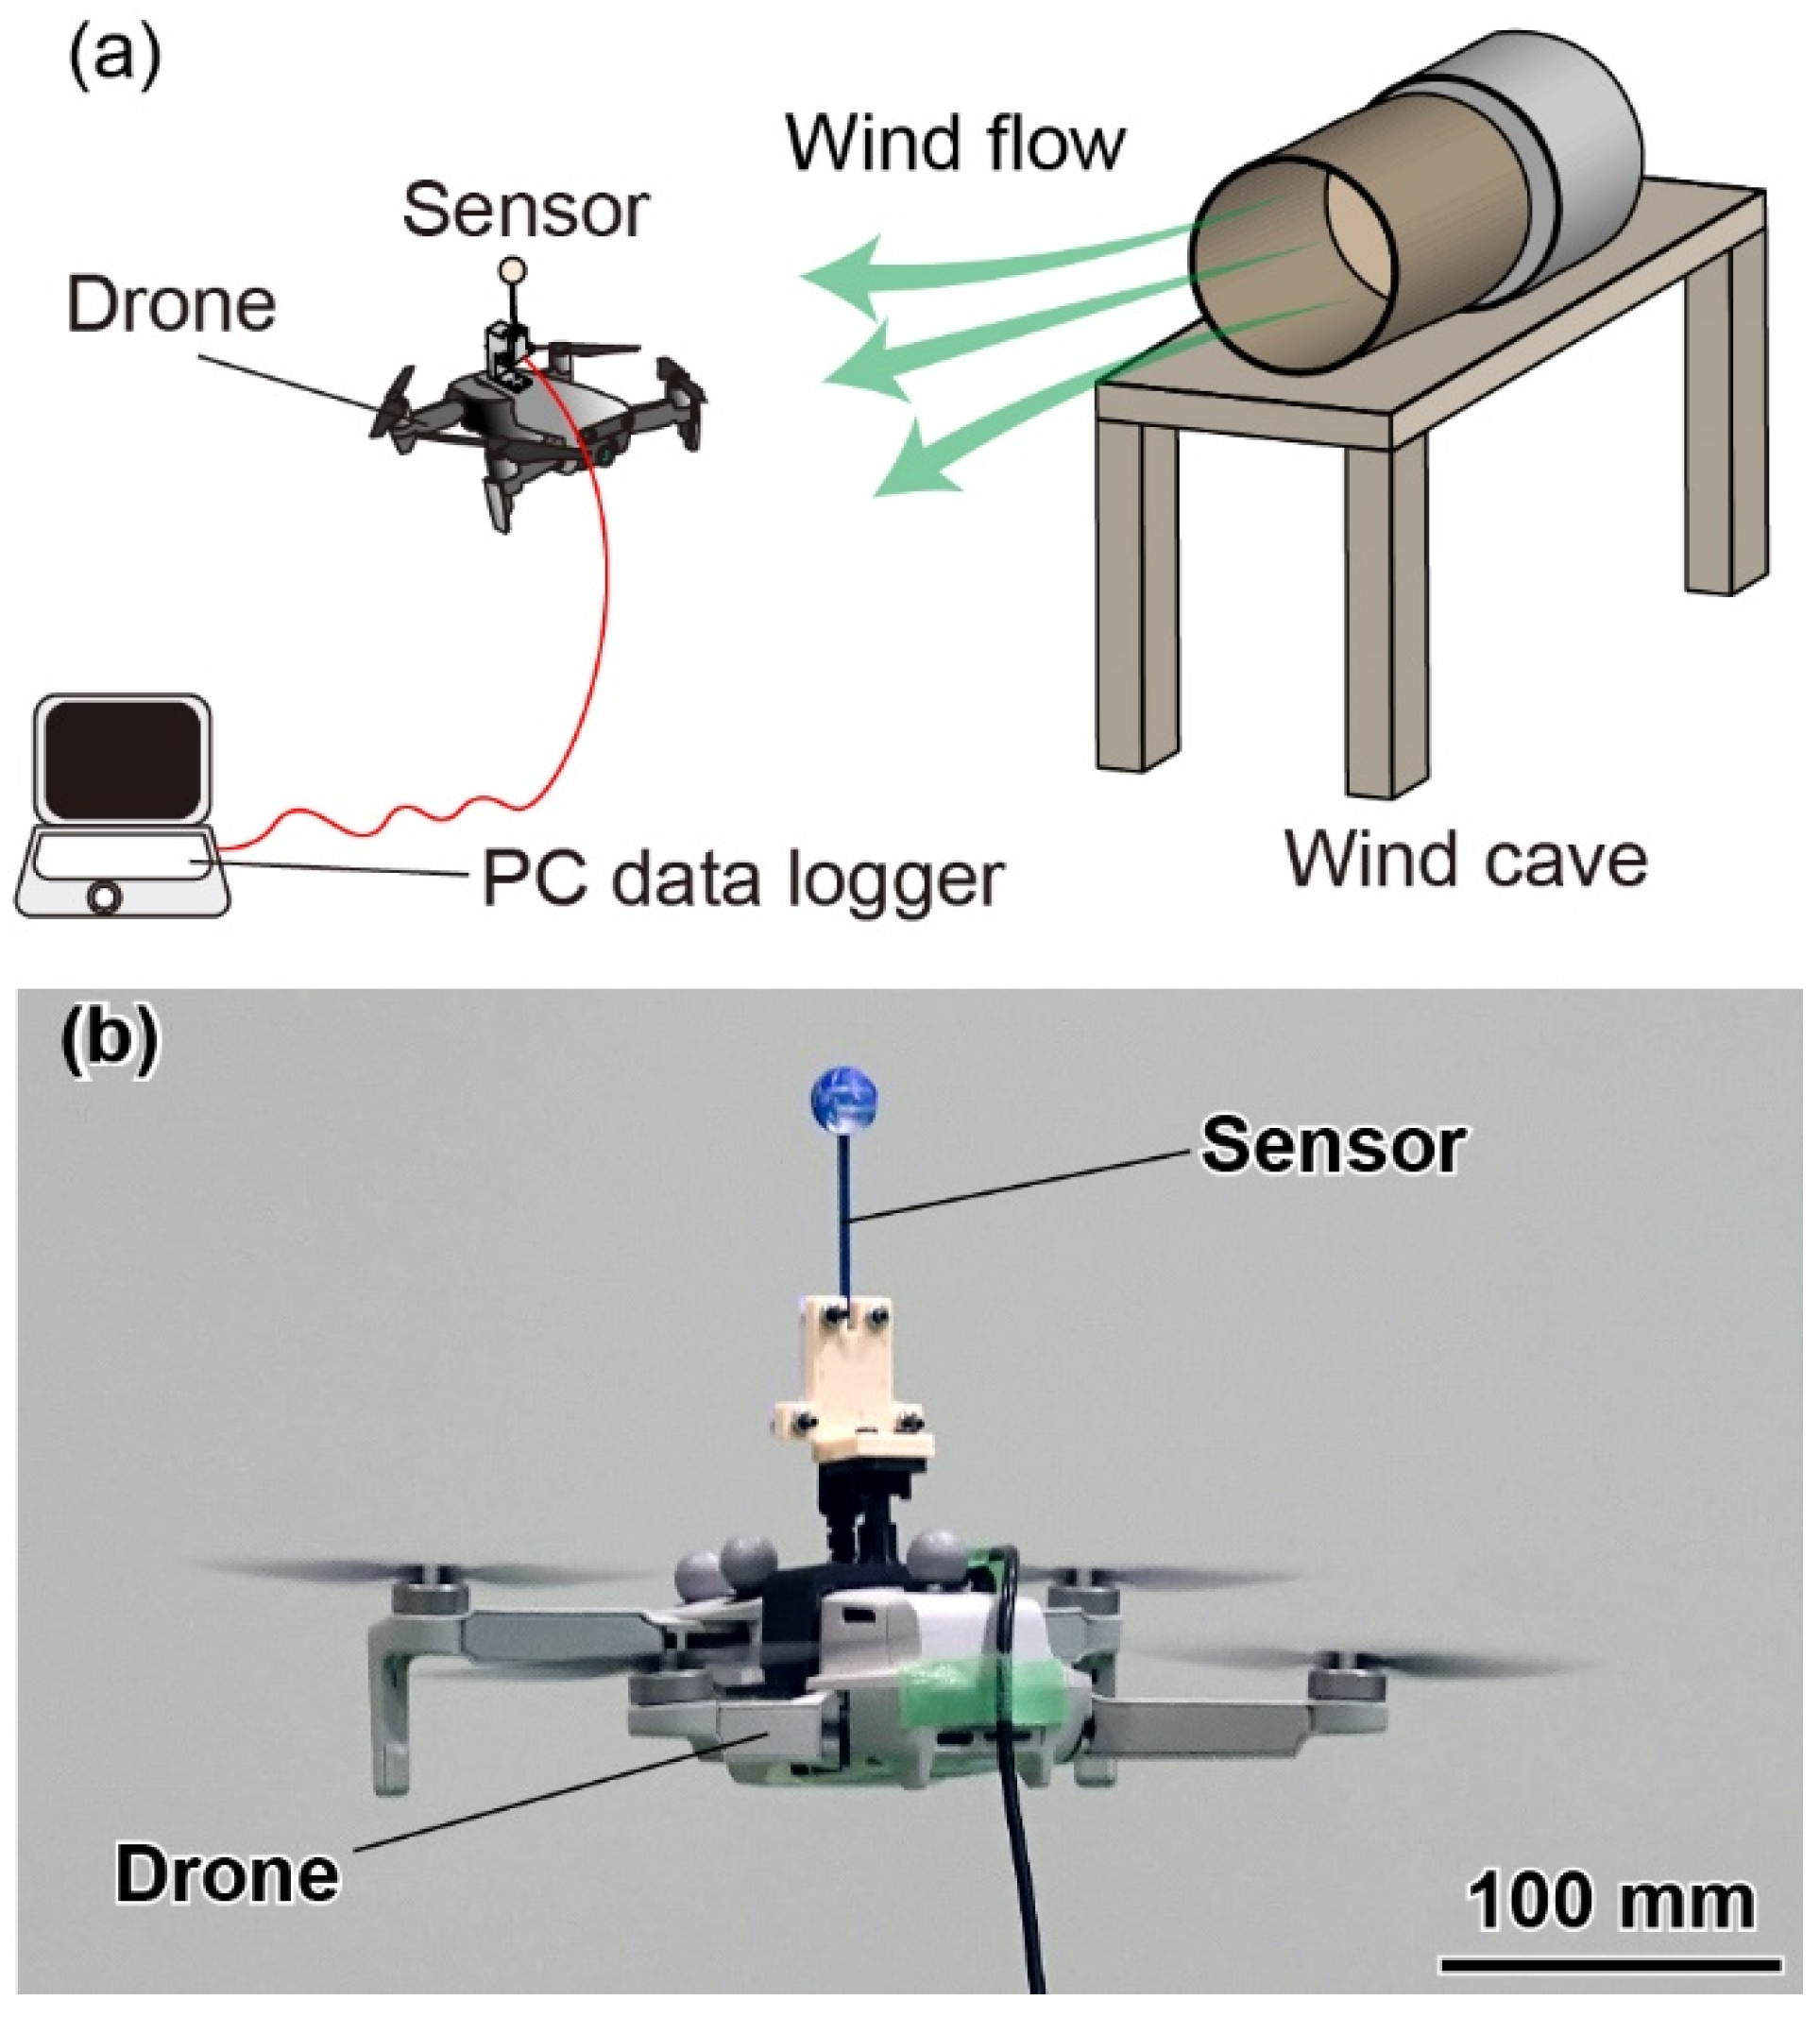
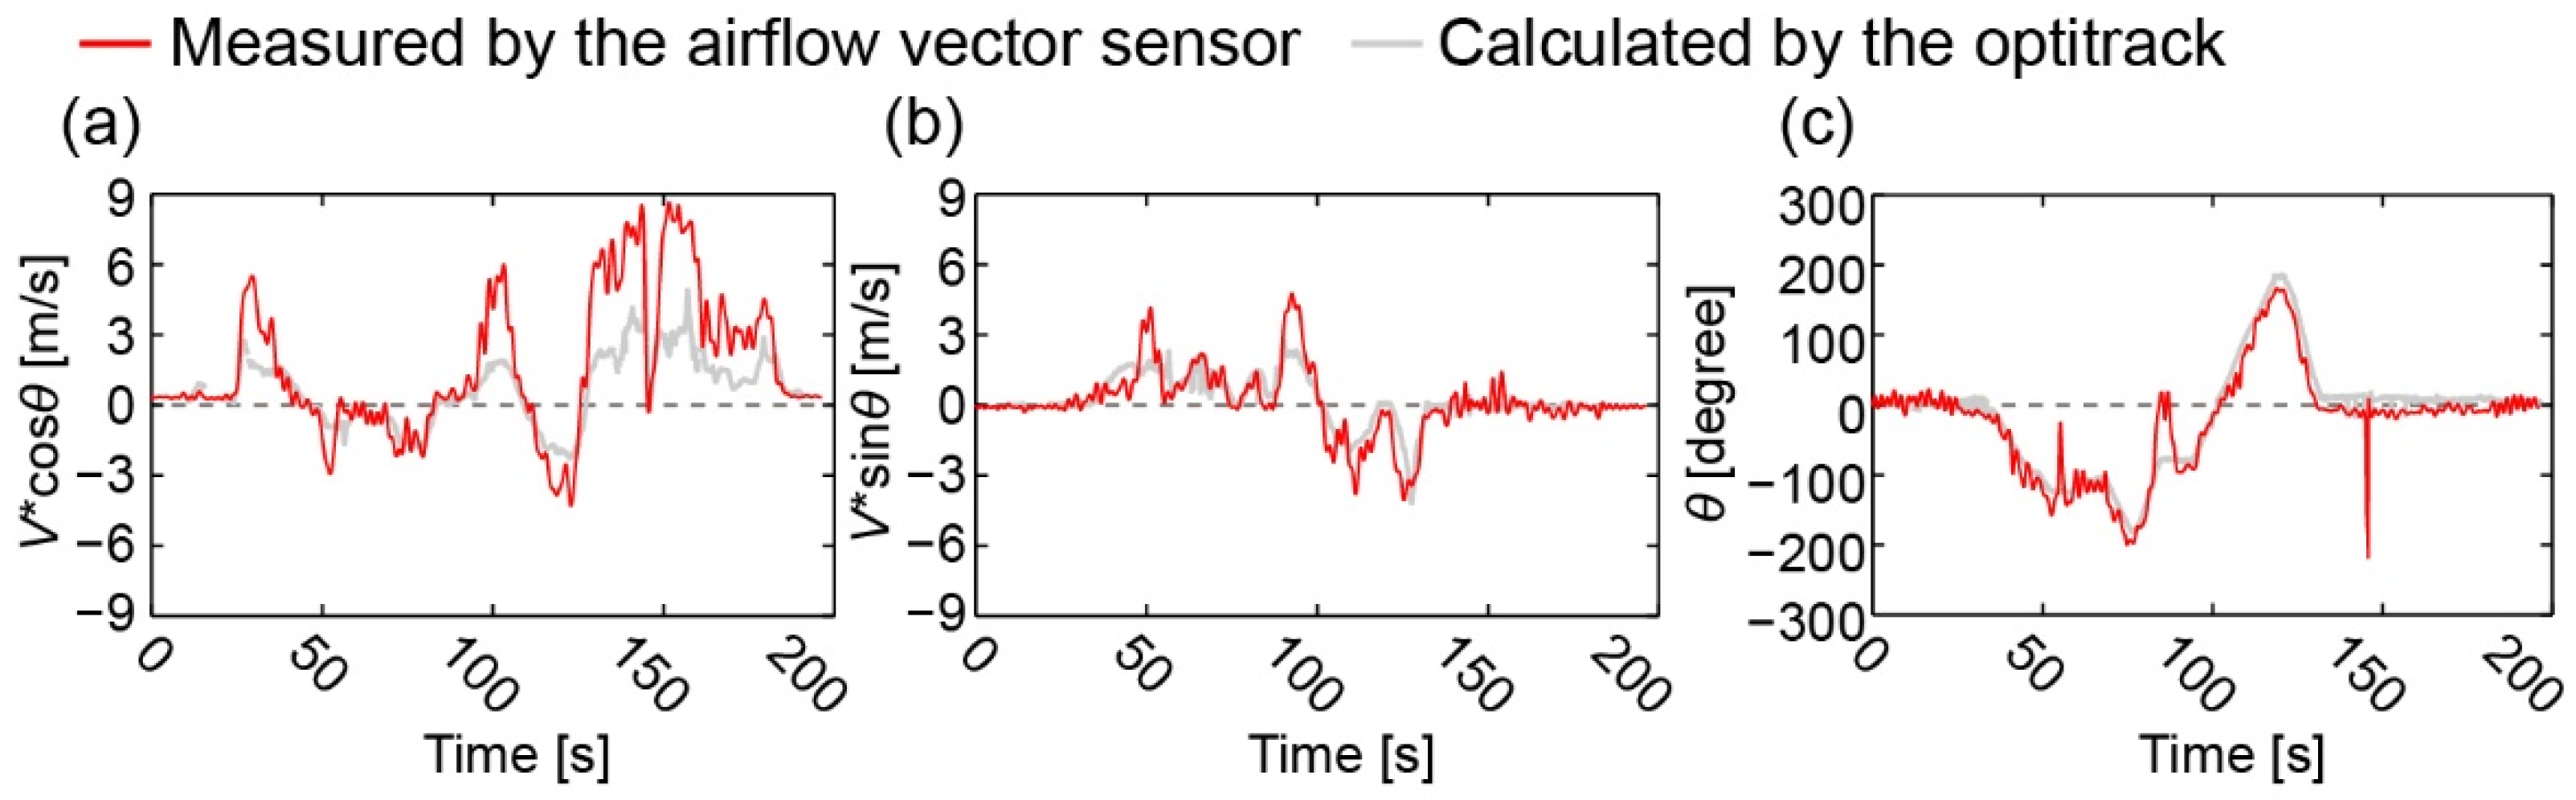
4.4. Drone Demonstration
5. Conclusions
Supplementary Materials
Author Contributions
Funding
Institutional Review Board Statement
Informed Consent Statement
Data Availability Statement
Conflicts of Interest
References
- Scott, J.E.; Scott, C.H. Drone delivery models for healthcare. In Proceedings of the 50th Hawaii International Conference on System Sciences, Hilton Waikoloa Village, HI, USA, 4–7 January 2017; pp. 3297–3304. [Google Scholar] [CrossRef] [Green Version]
- Kim, S.J.; Lim, G.J.; Cho, J.; Côté, M.J. Drone-Aided Healthcare Services for Patients with Chronic Diseases in Rural Areas. J. Intell. Robot. Syst. Theory Appl. 2017, 88, 163–180. [Google Scholar] [CrossRef]
- Namani, S.; Gonen, B. Smart agriculture based on IoT and cloud computing. In Proceedings of the 2020 3rd International Conference on Information and Computer Technologies (ICICT), San Jose, CA, USA, 9–12 March 2020; pp. 553–556. [Google Scholar] [CrossRef]
- Schofield, O.B.; Lorenzen, K.H.; Ebeid, E. Cloud to Cable: A Drone Framework for Autonomous Power line Inspection. In Proceedings of the 2020 23rd Euromicro Conference on Digital System Design (DSD), Kranj, Slovenia, 26–28 August 2020; pp. 503–509. [Google Scholar] [CrossRef]
- Kalaitzakis, M.; Vitzilaios, N.; Rizos, D.C.; Sutton, M.A. Drone-Based StereoDIC: System Development, Experimental Validation and Infrastructure Application. Exp. Mech. 2021, 61, 981–996. [Google Scholar] [CrossRef]
- Robinson, T.R. (Ed.) On a New Anemometer; Royal Irish Academy: Dublin, Ireland, 1869; Volume 4, pp. 566–572. Available online: https://www.jstor.org/stable/20520369 (accessed on 27 January 2022).
- Kim, S.; Kubicek, R.; Paris, A.; Tagliabue, A.; How, J.P.; Bergbreiter, S. A whisker-inspired fin sensor for multi-directional airflow sensing. In Proceedings of the 2020 IEEE/RSJ International Conference on Intelligent Robots and Systems (IROS), Las Vegas, NV, USA, 24 October–24 January 2021; pp. 1330–1337. [Google Scholar] [CrossRef]
- Lynnworth, L.C.; Liu, Y. Ultrasonic flowmeters: Half-century progress report, 1955–2005. Ultrasonics 2006, 44, e1371–e1378. [Google Scholar] [CrossRef] [PubMed]
- Arens, E.; Ghahramani, A.; Przybyla, R.; Andersen, M.; Min, S.; Peffer, T.; Raftery, P.; Zhu, M.; Luu, V.; Zhang, H. Measuring 3D indoor air velocity via an inexpensive low-power ultrasonic anemometer. Energy Build. 2020, 211, 109805. [Google Scholar] [CrossRef] [Green Version]
- Anemometry, H.; Comte-bellot, G. Hot-wire anemometry. Annu. Rev. Fluid Mech. 1976, 8, 209–231. [Google Scholar]
- Sadeghi, M.M.; Peterson, R.L.; Najafi, K. Air flow sensing using micro-wire-bonded hair-like hot-wire anemometry. J. Micromech. Microeng. 2013, 23, 085017. [Google Scholar] [CrossRef]
- Klopfenstein, R. Air velocity and flow measurement using a Pitot tube. ISA Trans. 1998, 37, 257–263. [Google Scholar] [CrossRef]
- Liu, C.; Du, L.; Zhao, Z.; Fang, Z.; Li, L. A directional anemometer based on MEMS differential pressure sensors. In Proceedings of the The 9th IEEE International Conference on Nano/Micro Engineered and Molecular Systems (NEMS), Waikiki Beach, HI, USA, 13–16 April 2014; pp. 517–520. [Google Scholar] [CrossRef]
- Bruschi, P.; Dei, M.; Piotto, M. A low-power 2-D wind sensor based on integrated flow meters. IEEE Sens. J. 2009, 9, 1688–1696. [Google Scholar] [CrossRef]
- Piotto, M.; Pennelli, G.; Bruschi, P. Fabrication and characterization of a directional anemometer based on a single chip MEMS flow sensor. Microelectron. Eng. 2011, 88, 2214–2217. [Google Scholar] [CrossRef]
- Bruschi, P.; Piotto, M.; Dell’Agnello, F.; Ware, J.; Roy, N. Wind Speed and Direction Detection by Means of Solid-state Anemometers Embedded on Small Quadcopters. Procedia Eng. 2016, 168, 802–805. [Google Scholar] [CrossRef]
- Minh-Dung, N.; Takahashi, H.; Kuwana, K.; Takahata, T.; Matsumoto, K.; Shimoyama, I. 3D airflow velocity vector sensor. In Proceedings of the 2011 IEEE 24th International Conference on Micro Electro Mechanical Systems, Cancun, Mexico, 23–27 January 2011; pp. 513–516. [Google Scholar] [CrossRef]
- Eckman, R.M.; Dobosy, R.J.; Auble, D.L.; Strong, T.W.; Crawford, T.L. A pressure-sphere anemometer for measuring turbulence and fluxes in hurricanes. J. Atmos. Ocean. Technol. 2007, 24, 994–1007. [Google Scholar] [CrossRef]
- Jing, X.M.; Lu, J.Y.; Miao, J.M.; Hans, H.; Rahman, H.A.; Pan, S.S.; Norford, L.; Centre, T.S. Hot-Film Sensors for 2-D Environmental Airflow Monitoring; Singapore Center for Environmental Sensing and Modeling (CENSAM), Singapore-MIT Alliance for Research and Department, School of Mechanical and Aerospace Engineering, Nanyang Technological University: Singapore, 2011; pp. 96–99. [Google Scholar]
- Gao, S.; Yi, Z.; Ye, Y.; Qin, M.; Huang, Q.A. Configuration of a Self-Heated Double Wheatstone Bridge for 2-D Wind Sensors. J. Microelectromech. Syst. 2019, 28, 125–130. [Google Scholar] [CrossRef]
- Zhu, Y.Q.; Chen, B.; Qin, M.; Huang, J.Q.; Huang, Q.A. Development of a self-packaged 2D MEMS thermal wind sensor for low power applications. J. Micromech. Microeng. 2015, 25, 085011. [Google Scholar] [CrossRef]
- Ye, Y.; Yi, Z.; Gao, S.; Qin, M.; Huang, Q.A. Octagon-Shaped 2-D Micromachined Thermal Wind Sensor for High-Accurate Applications. J. Microelectromech. Syst. 2018, 27, 739–747. [Google Scholar] [CrossRef]
- Leoni, A.; Barile, G.; Muttillo, M.; Pantoli, L.; Stornelli, V.; Ferri, G.; Paolucci, R.; Vita, L. Di A Spherical Directional Anemometer Sensor System. Proceedings 2017, 1, 388. [Google Scholar] [CrossRef] [Green Version]
- Hoerner, S.H. Fluid—Dynamic Drag; Hoerner: Midland Park, NJ, USA, 1965. [Google Scholar]
- Takahashi, H.; Dung, N.M.; Matsumoto, K.; Shimoyama, I. Differential pressure sensor using a piezoresistive cantilever. J. Micromech. Microeng. 2012, 22, 055015. [Google Scholar] [CrossRef]
- Takahashi, H.; Nakai, A.; Shimoyama, I. Waterproof airflow sensor for seabird bio-logging using a highly sensitive differential pressure sensor and nano-hole array. Sens. Actuators A Phys. 2018, 281, 243–249. [Google Scholar] [CrossRef]
- Takahashi, H.; Naruoka, M.; Inada, Y.; Sato, K. Seabird biologging system with compact waterproof airflow sensor. J. Robot. Mechatron. 2021, 33, 466–474. [Google Scholar] [CrossRef]


Publisher’s Note: MDPI stays neutral with regard to jurisdictional claims in published maps and institutional affiliations. |
© 2022 by the authors. Licensee MDPI, Basel, Switzerland. This article is an open access article distributed under the terms and conditions of the Creative Commons Attribution (CC BY) license (https://creativecommons.org/licenses/by/4.0/).
Share and Cite
Haneda, K.; Matsudaira, K.; Noda, R.; Nakata, T.; Suzuki, S.; Liu, H.; Takahashi, H. Compact Sphere-Shaped Airflow Vector Sensor Based on MEMS Differential Pressure Sensors. Sensors 2022, 22, 1087. https://doi.org/10.3390/s22031087
Haneda K, Matsudaira K, Noda R, Nakata T, Suzuki S, Liu H, Takahashi H. Compact Sphere-Shaped Airflow Vector Sensor Based on MEMS Differential Pressure Sensors. Sensors. 2022; 22(3):1087. https://doi.org/10.3390/s22031087
Chicago/Turabian StyleHaneda, Kotaro, Kenei Matsudaira, Ryusuke Noda, Toshiyuki Nakata, Satoshi Suzuki, Hao Liu, and Hidetoshi Takahashi. 2022. "Compact Sphere-Shaped Airflow Vector Sensor Based on MEMS Differential Pressure Sensors" Sensors 22, no. 3: 1087. https://doi.org/10.3390/s22031087
APA StyleHaneda, K., Matsudaira, K., Noda, R., Nakata, T., Suzuki, S., Liu, H., & Takahashi, H. (2022). Compact Sphere-Shaped Airflow Vector Sensor Based on MEMS Differential Pressure Sensors. Sensors, 22(3), 1087. https://doi.org/10.3390/s22031087