
Analysis of Signal Processing Methods to Reject the DC Offset Contribution of Static Reflectors in FMCW Radar-Based Vital Signs Monitoring
 , ,
, ,  ,
,  and
and
Abstract
:1. Introduction
2. Methods
2.1. Radar Signal Modelling
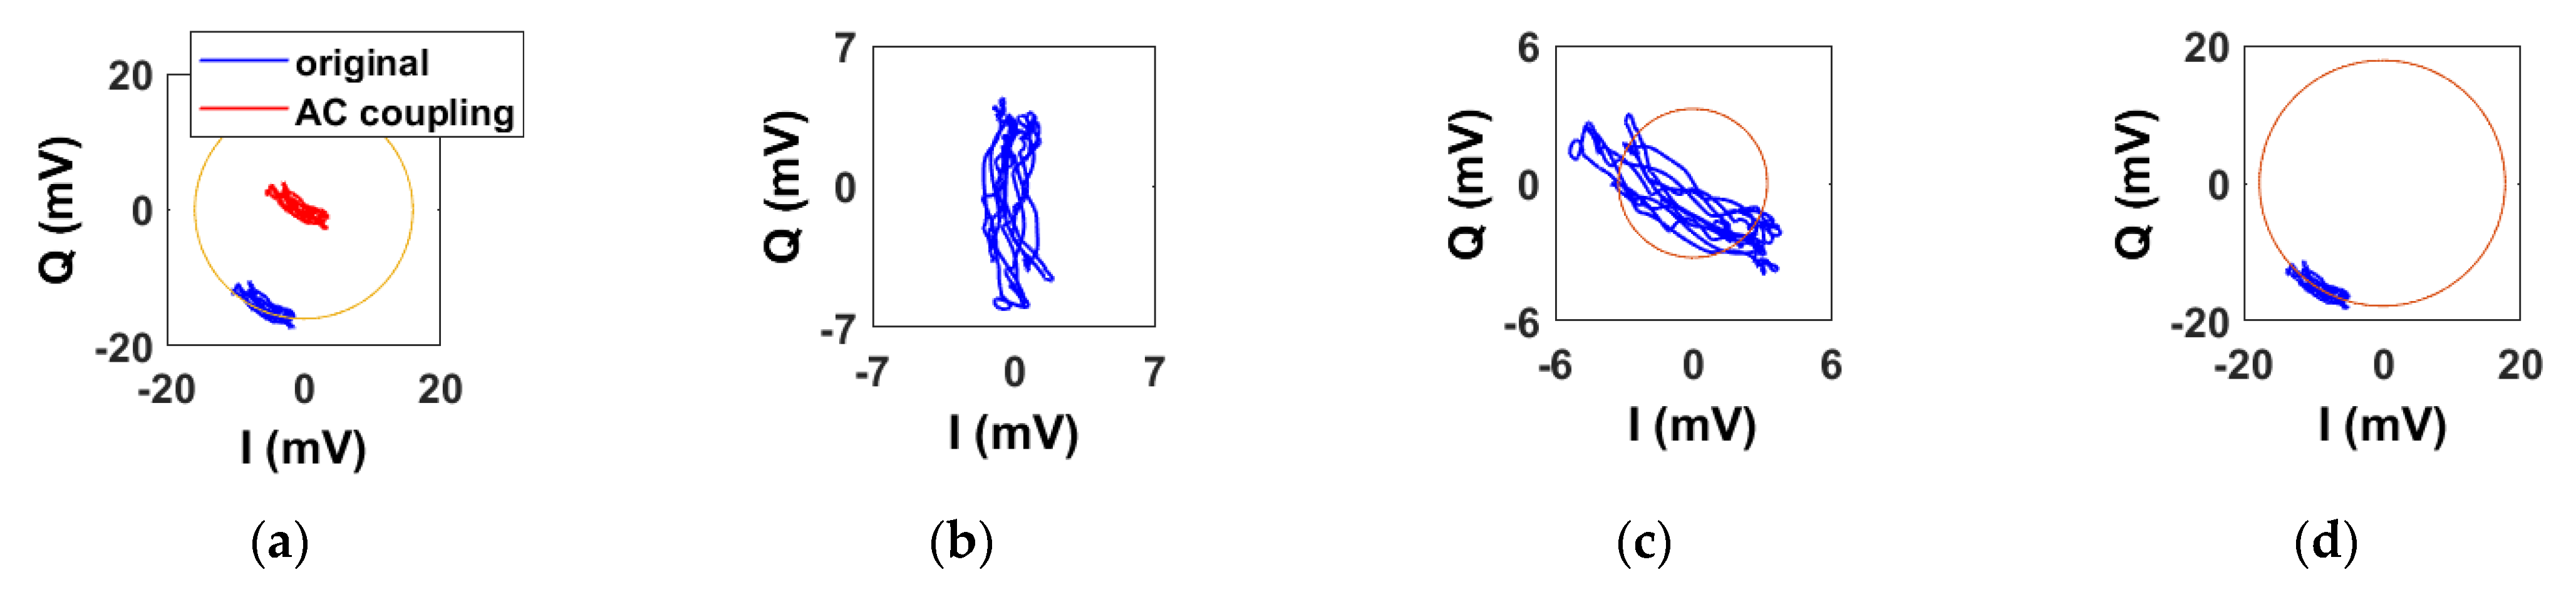
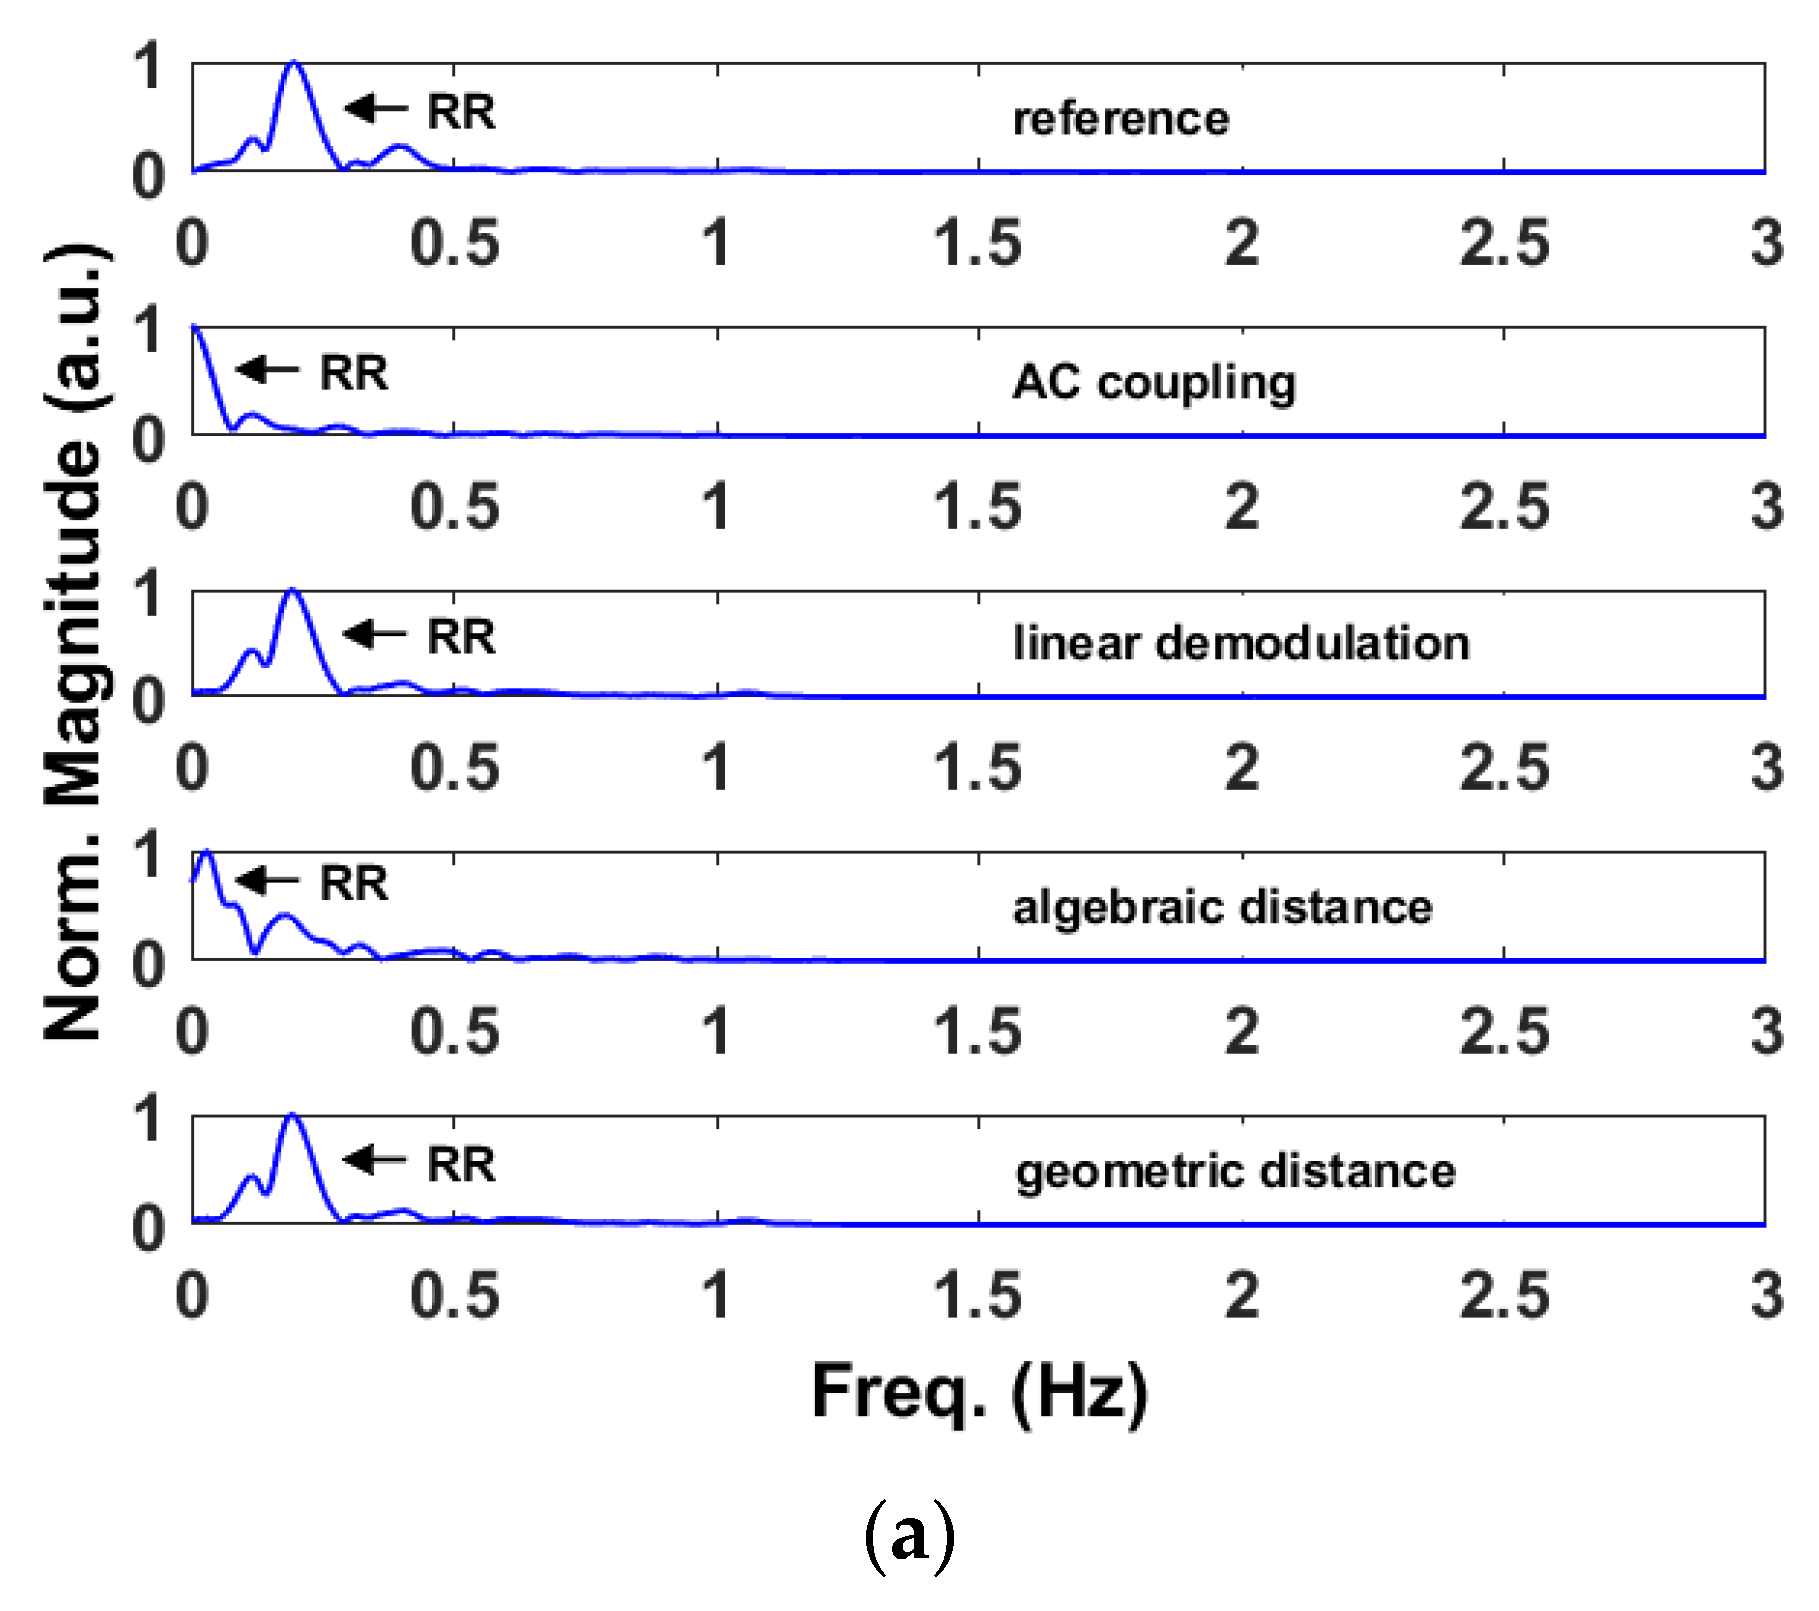
2.2. AC-Coupling
2.3. Linear Demodulation
- 1.
- Removing the mean values of x1 and x2 and combining into a matrix = [x1-mean(x1), x2-mean(x2)];
- 2.
- Calculating the covariance matrix of ;
- 3.
- Obtaining the matrix E whose columns are the eigenvectors of the covariance matrix;
- 4.
- Multiplying the transpose of E by . The result is a matrix containing the principal components listed in descending order depending on the eigenvalues. The first principal component is the demodulated signal.
2.4. Minimizing the Algebraic Distance
2.5. Minimizing the Geometric Distance
3. Material
3.1. Radar Sensors
3.2. Reference Sensor
4. Experimental Validation
4.1. Signal Processing for Vital Sign Extraction and Data Collection
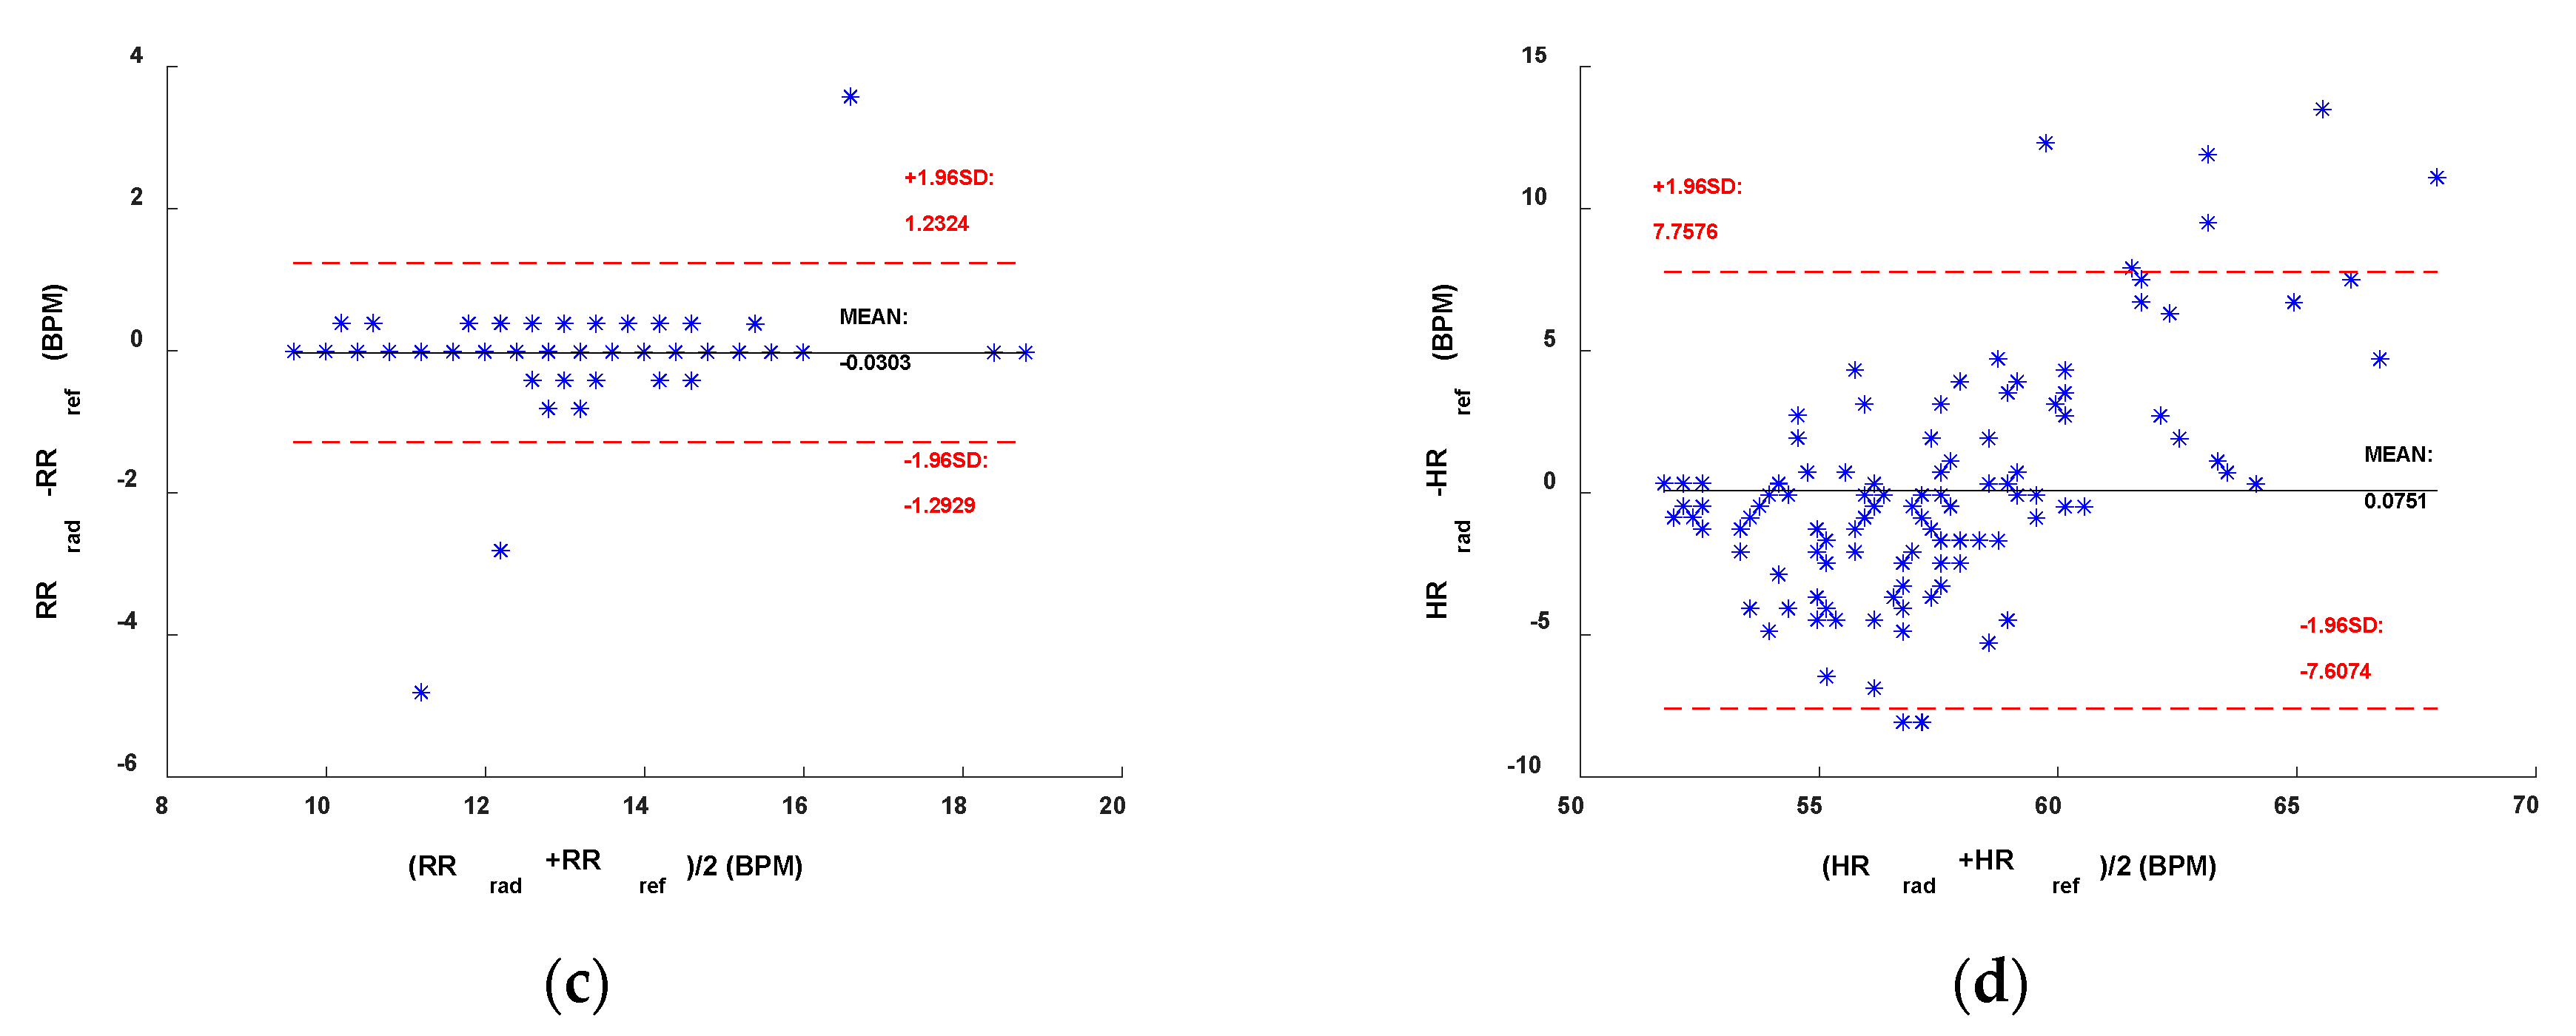
4.2. Results
5. Discussion
5.1. Sub-10 GHz Radar
5.2. mmWave Radar
5.3. Comparison with the State-of-the-Art
6. Conclusions
Author Contributions
Funding
Institutional Review Board Statement
Informed Consent Statement
Data Availability Statement
Conflicts of Interest
References
- Li, C.; Lubecke, V.M.; Boric-Lubecke, O.; Lin, J. Sensing of Life Activities at the Human-Microwave Frontier. IEEE J. Microw. 2021, 1, 66–78. [Google Scholar] [CrossRef]
- Schreurs, D.; Mercuri, M. Contactless medical sensing. In Proceedings of the 2015 IEEE MTT-S International Microwave Symposium (IMS), Phoenix, AZ, USA, 17–22 May 2015; pp. 1–4. [Google Scholar]
- Ahmed, S.; Park, J.; Cho, S.H. Effects of Receiver Beamforming for Vital Sign Measurements Using FMCW Radar at Various Distances and Angles. Sensors 2022, 22, 6877. [Google Scholar] [CrossRef] [PubMed]
- Saho, K.; Hayashi, S.; Tsuyama, M.; Meng, L.; Masugi, M. Machine Learning-Based Classification of Human Behaviors and Falls in Restroom via Dual Doppler Radar Measurements. Sensors 2022, 22, 1721. [Google Scholar] [CrossRef]
- Zhang, X.; Yang, X.; Ding, Y.; Wang, Y.; Zhou, J.; Zhang, L. Contactless Simultaneous Breathing and Heart Rate Detections in Physical Activity Using IR-UWB Radars. Sensors 2021, 21, 5503. [Google Scholar] [CrossRef] [PubMed]
- Yoo, S.; Ahmed, S.; Kang, S.; Hwang, D.; Lee, J.; Son, J.; Cho, S.H. Radar Recorded Child Vital Sign Public Dataset and Deep Learning-Based Age Group Classification Framework for Vehicular Application. Sensors 2021, 21, 2412. [Google Scholar] [CrossRef]
- Mercuri, M.; Russo, P.; Glassee, M.; Castro, I.D.; De Greef, E.; Rykunov, M.; Bauduin, M.; Bourdoux, A.; Ocket, I.; Crupi, F.; et al. Automatic radar-based 2-D localization exploiting vital signs signatures. Sci. Rep. 2022, 12, 7651. [Google Scholar] [CrossRef]
- Nallabolu, P.; Zhang, L.; Hong, H.; Li, C. Human presence sensing and gesture recognition for smart home applications with moving and stationary clutter suppression using a 60-ghz digital beamforming fmcw radar. IEEE Access 2021, 9, 72857–72866. [Google Scholar] [CrossRef]
- Liu, J.; Li, Y.; Li, C.; Gu, C.; Mao, J.-F. Accurate Measurement of Human Vital Signs with Linear FMCW Radars Under Proximity Stationary Clutters. IEEE Trans. Biomed. Circuits Syst. 2021, 15, 1393–1404. [Google Scholar] [CrossRef]
- Mercuri, M.; Sacco, G.; Hornung, R.; Zhang, P.; Visser, H.; Hijdra, M.; Liu, Y.-H.; Pisa, S.; van Liempd, B.; Torfs, T. 2-D Localization, Angular Separation and Vital Signs Monitoring Using a SISO FMCW Radar for Smart Long-term Health Monitoring Environments. IEEE Internet Things J. 2021, 8, 11065–11077. [Google Scholar] [CrossRef]
- Mercuri, M.; Lu, Y.; Polito, S.; Wieringa, F.; Liu, Y.-H.; van der Veen, A.-J.; Van Hoof, C.; Torfs, T. Enabling Robust Radar-Based Localization and Vital Signs Monitoring in Multipath Propagation Environments. IEEE Trans. Biomed. Eng. 2021, 68, 3228–3240. [Google Scholar] [CrossRef]
- Liu, Y.-H.; Sheelavant, S.; Mercuri, M.; Babaie, M. An Ultralow Power Burst-Chirp UWB Radar Transceiver for Indoor Vital Signs and Occupancy Sensing in 40-nm CMOS. IEEE Solid-State Circuits Lett. 2019, 2, 256–259. [Google Scholar] [CrossRef]
- Zhengyu, P.; Muñoz-Ferreras, J.M.; Tang, Y.; Liu, C.; Gómez-García, R.; Ran, L.; Li, C. A Portable FMCW Interferometry Radar with Programmable Low-IF Architecture for Localization, ISAR Imaging, and Vital Sign Tracking. IEEE Trans. Microw. Theory Tech. 2017, 65, 1334–1344. [Google Scholar]
- Wang, F.; Zhang, F.; Wu, C.; Wang, B.; Liu, K.J.R. ViMo: Multiperson Vital Sign Monitoring using Commodity Millimeter Wave Radio. IEEE Internet Things J. 2021, 8, 1294–1307. [Google Scholar] [CrossRef]
- Hommes, A.; Shoykhetbrod, A.; Pohl, N. A fast tracking 60 GHz Radar using a frequency scanning antenna. In Proceedings of the 2014 39th International Conference on Infrared, Millimeter, and Terahertz waves (IRMMW THz), Tucson, AZ, USA, 14–19 September 2014; pp. 1–2. [Google Scholar]
- Fang, Z.; Lou, L.; Tang, K.; Wang, W.; Wang, Y.; Guo, T.; Yang, C.; Zheng, Y. Wide Field-of-View Locating and Multimodal Vital Sign Monitoring Based on X-Band CMOS-Integrated Phased-Array Radar Sensor. IEEE Trans. Microw. Theory Tech. 2020, 68, 4054–4065. [Google Scholar] [CrossRef]
- Zakrzewski, M.; Raittinen, H.; Vanhala, J. Comparison of Center Estimation Algorithms for Heart and Respiration Monitoring With Microwave Doppler Radar. IEEE Sens. J. 2012, 12, 627–634. [Google Scholar] [CrossRef]
- Guan, S.; Rice, J.A.; Li, C.; Gu, C. Automated DC Offset Calibration Strategy for Structural Health Monitoring Based on Portable CW Radar Sensor. IEEE Trans. Instrum. Meas. 2014, 63, 3111–3118. [Google Scholar] [CrossRef]
- Cardillo, E.; Caddemi, A. A Review on Biomedical MIMO Radars for Vital Sign Detection and Human Localization. Electronics 2020, 9, 1497. [Google Scholar] [CrossRef]
- Sacco, G.; Piuzzi, E.; Pittella, E.; Pisa, S. An FMCW Radar for Localization and Vital Signs Measurement for Different Chest Orientations. Sensors 2020, 20, 3489. [Google Scholar] [CrossRef]
- Bin-Obadi, A.; Soh, P.J.; Aldayel, O.; Al-Doori, M.H.; Mercuri, M.; Schreurs, D. A Survey on Vital Signs Detection Using Radar Techniques and Processing with FPGA Implementation. IEEE Circuits Syst. Mag. 2021, 21, 41–74. [Google Scholar] [CrossRef]
- Wang, F.; Zeng, X.; Wu, C.; Wang, B.; Liu, K.J.R. mmHRV: Contactless Heart Rate Variability Monitoring Using Millimeter-Wave Radio. IEEE Internet Things J. 2021, 8, 16623–16636. [Google Scholar] [CrossRef]
- Wang, G.; Muñoz-Ferraras, J.-M.; Gu, C.; Li, C.; Gómez- García, R. Application of Linear-Frequency-Modulated Continuous-Wave (LFMCW) Radars for Tracking of Vital Signs. IEEE Trans. Microw. Theory Tech. 2014, 62, 1387–1399. [Google Scholar] [CrossRef]
- Ahmad, A.; Roh, J.C.; Wang, D.; Dubey, A. Vital signs monitoring of multiple people using a FMCW millimeter-wave sensor. In Proceedings of the 2018 IEEE Radar Conference, Oklahoma City, OK, USA, 23–27 April 2018; pp. 1450–1455. [Google Scholar]
- Alizadeh, M.; Shaker, G.; Almeida, J.C.M.D.; Morita, P.P.; Safavi-Naeini, S. Remote monitoring of human vital signs using mm-Wave FMCW radar. IEEE Access 2019, 7, 54958–54968. [Google Scholar] [CrossRef]
- Koda, T.; Sakamoto, T.; Okumura, S.; Taki, H. Noncontact Respiratory Measurement for Multiple People at Arbitrary Locations Using Array Radar and Respiratory-Space Clustering. IEEE Access 2021, 9, 106895–106906. [Google Scholar] [CrossRef]
- Koo, Y.S.; Ren, L.; Wang, Y.; Fathy, A.E. UWB MicroDoppler Radar for human Gait analysis, tracking more than one person, and vital sign detection of moving persons. In Proceedings of the 2013 IEEE MTT-S International Microwave Symposium (IMS), Seattle, WA, USA, 2–7 June 2013; pp. 1–4. [Google Scholar]
- Sakamoto, T.; Imasaka, R.; Taki, H.; Sato, T.; Yoshioka, M.; Inoue, K.; Fukuda, T.; Sakai, H. Feature-Based Correlation and Topological Similarity for Interbeat Interval Estimation Using Ultrawideband Radar. IEEE Trans. Biomed. Eng. 2016, 63, 747–757. [Google Scholar] [PubMed]
- Wang, P.; Qi, F.; Liu, M.; Liang, F.; Xue, H.; Zhang, Y.; Lv, H.; Wang, J. Noncontact Heart Rate Measurement Based on an Improved Convolutional Sparse Coding Method Using IR-UWB Radar. IEEE Access 2019, 7, 158492–158502. [Google Scholar] [CrossRef]
- Zhang, Y.; Li, X.; Qi, R.; Qi, Z.; Zhu, H. Harmonic Multiple Loop Detection (HMLD) Algorithm for Not-Contact Vital Sign Monitoring Based on Ultra-Wideband (UWB) Radar. IEEE Access 2020, 8, 38786–38793. [Google Scholar] [CrossRef]
- Shang, X.; Liu, J.; Li, J. Multiple Object Localization and Vital Sign Monitoring Using IR-UWB MIMO Radar. IEEE Trans. Aerosp. Electron. Syst. 2020, 56, 4437–4450. [Google Scholar] [CrossRef]
- Ahmed, S.; Lee, Y.; Lim, Y.H.; Cho, S.-H.; Park, H.-K.; Cho, S.H. Noncontact assessment for fatigue based on heart rate variability using IR-UWB radar. Sci. Rep. 2022, 12, 14211. [Google Scholar] [CrossRef]
- Li, C.; Lubecke, V.M.; Boric-Lubecke, O.; Lin, J. A Review on Recent Advances in Doppler Radar Sensors for Noncontact Healthcare Monitoring. IEEE Trans. Microw. Theory Tech. 2013, 61, 2046–2060. [Google Scholar] [CrossRef]
- Mercuri, M.; Liu, Y.-H.; Lorato, I.; Torfs, T.; Bourdoux, A.; Van Hoof, C. Frequency-Tracking CW Doppler Radar Solving Small-Angle Approximation and Null Point Issues in Non-Contact Vital Signs Monitoring. IEEE Trans. Biomed. Circuits Syst. 2017, 11, 671–680. [Google Scholar] [CrossRef]
- Gander, W.; Golub, G.H.; Strebel, R. Least squares fitting of circles and ellipses. BIT Numer. Math. 1994, 34, 558–578. [Google Scholar] [CrossRef]
- Nahar, S.; Phan, T.; Quaiyum, F.; Ren, L.; Fathy, A.E.; Kilic, O. An Electromagnetic Model of Human Vital Signs Detection and Its Experimental Validation. IEEE J. Emerg. Sel. Top. Circuits Syst. 2018, 8, 338–349. [Google Scholar] [CrossRef]
- Anitori, L.; de Jong, A.; Nennie, F. FMCW radar for life-sign detection. In Proceedings of the 2009 IEEE Radar Conference, Pasadena, CA, USA, 4–8 May 2009; pp. 1–6. [Google Scholar]


| Parameters | Imec Mercurius V1.1 | IWR6843ISK |
|---|---|---|
| Starting Frequency | 7.3 GHz | 60.645 GHz |
| Total Bandwidth | 750 MHz | 3.7 GHz |
| Chirp Duration | 102.4 µs | 64 µs |
| Fast Time Sampling Rate | 10 MHz | 4 MHz |
| Slow Time Sampling Rate | 325.52 Hz | 20 Hz |
| Range Resolution | 20 cm | 4 cm |
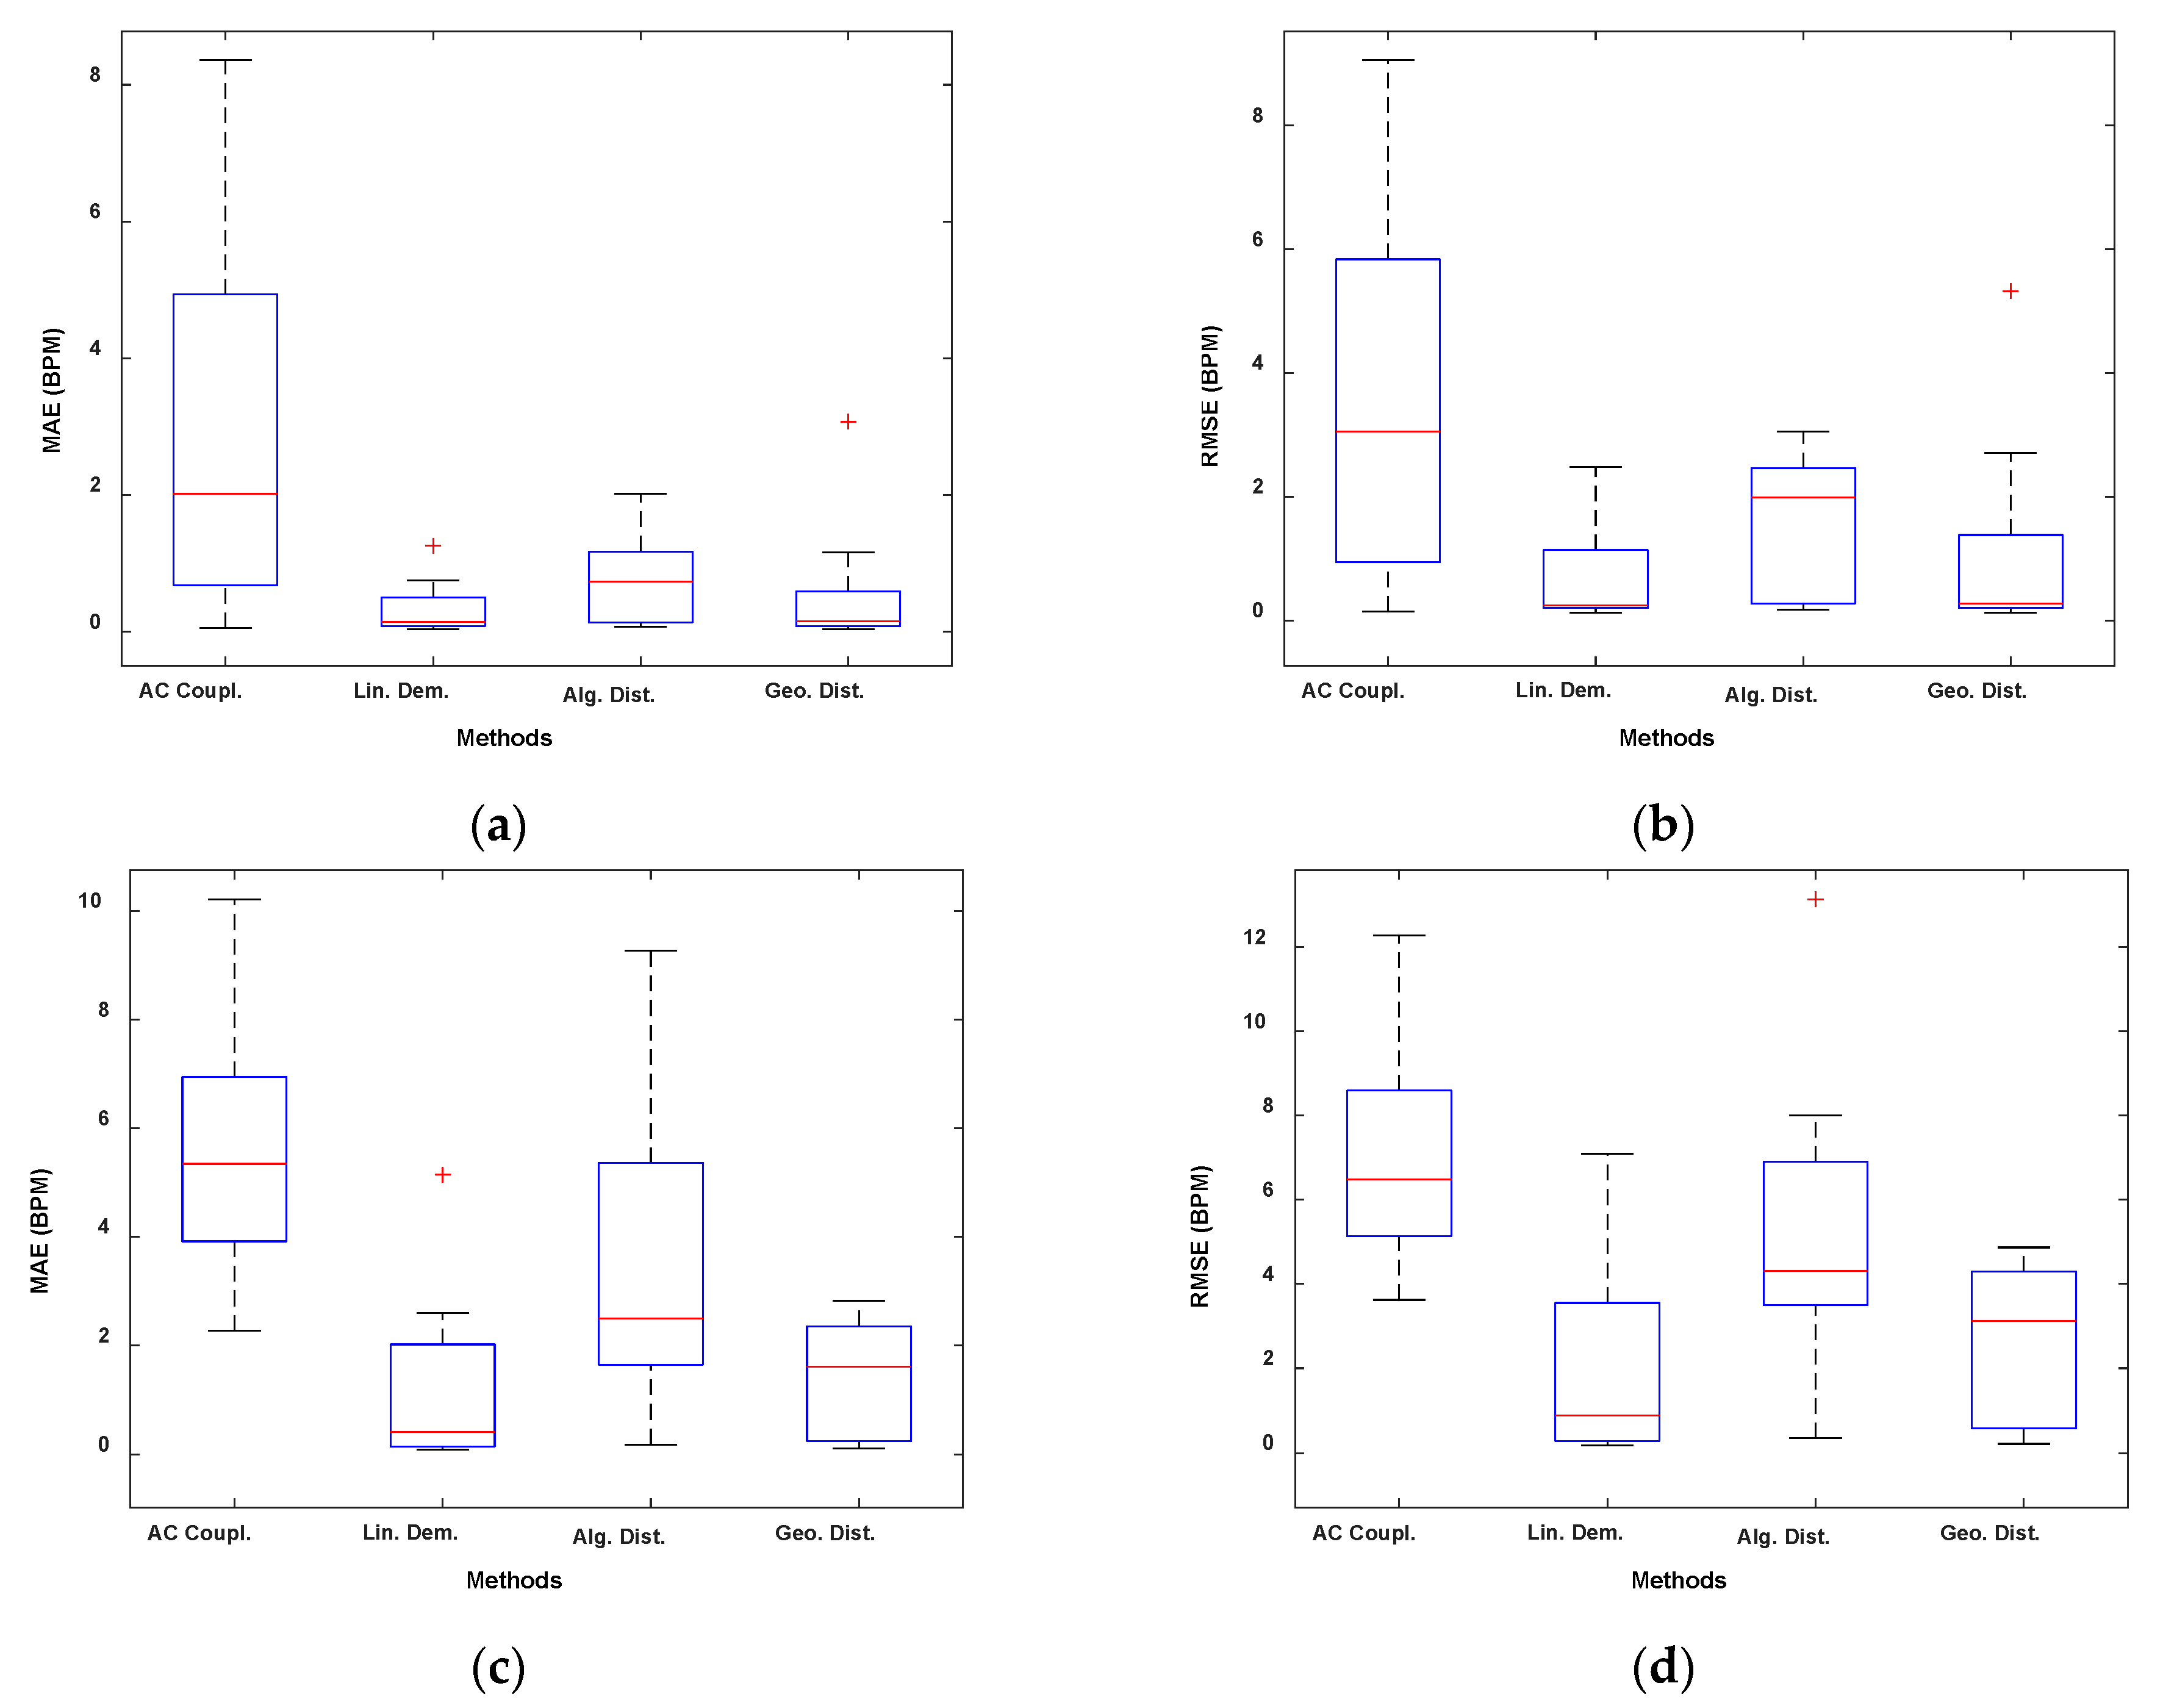
| Errors | AC Coupling | Linear Demodulation | Algebraic Distance | Geometric Distance |
|---|---|---|---|---|
| MAE RR (BPM) | 2.90 | 0.32 | 0.77 | 0.56 |
| RMSE RR (BPM) | 3.62 | 0.70 | 1.63 | 1.12 |
| MAE HR (BPM) | 5.46 | 1.19 | 3.36 | 1.41 |
| RMSE HR (BPM) | 6.97 | 2.07 | 5.06 | 2.55 |
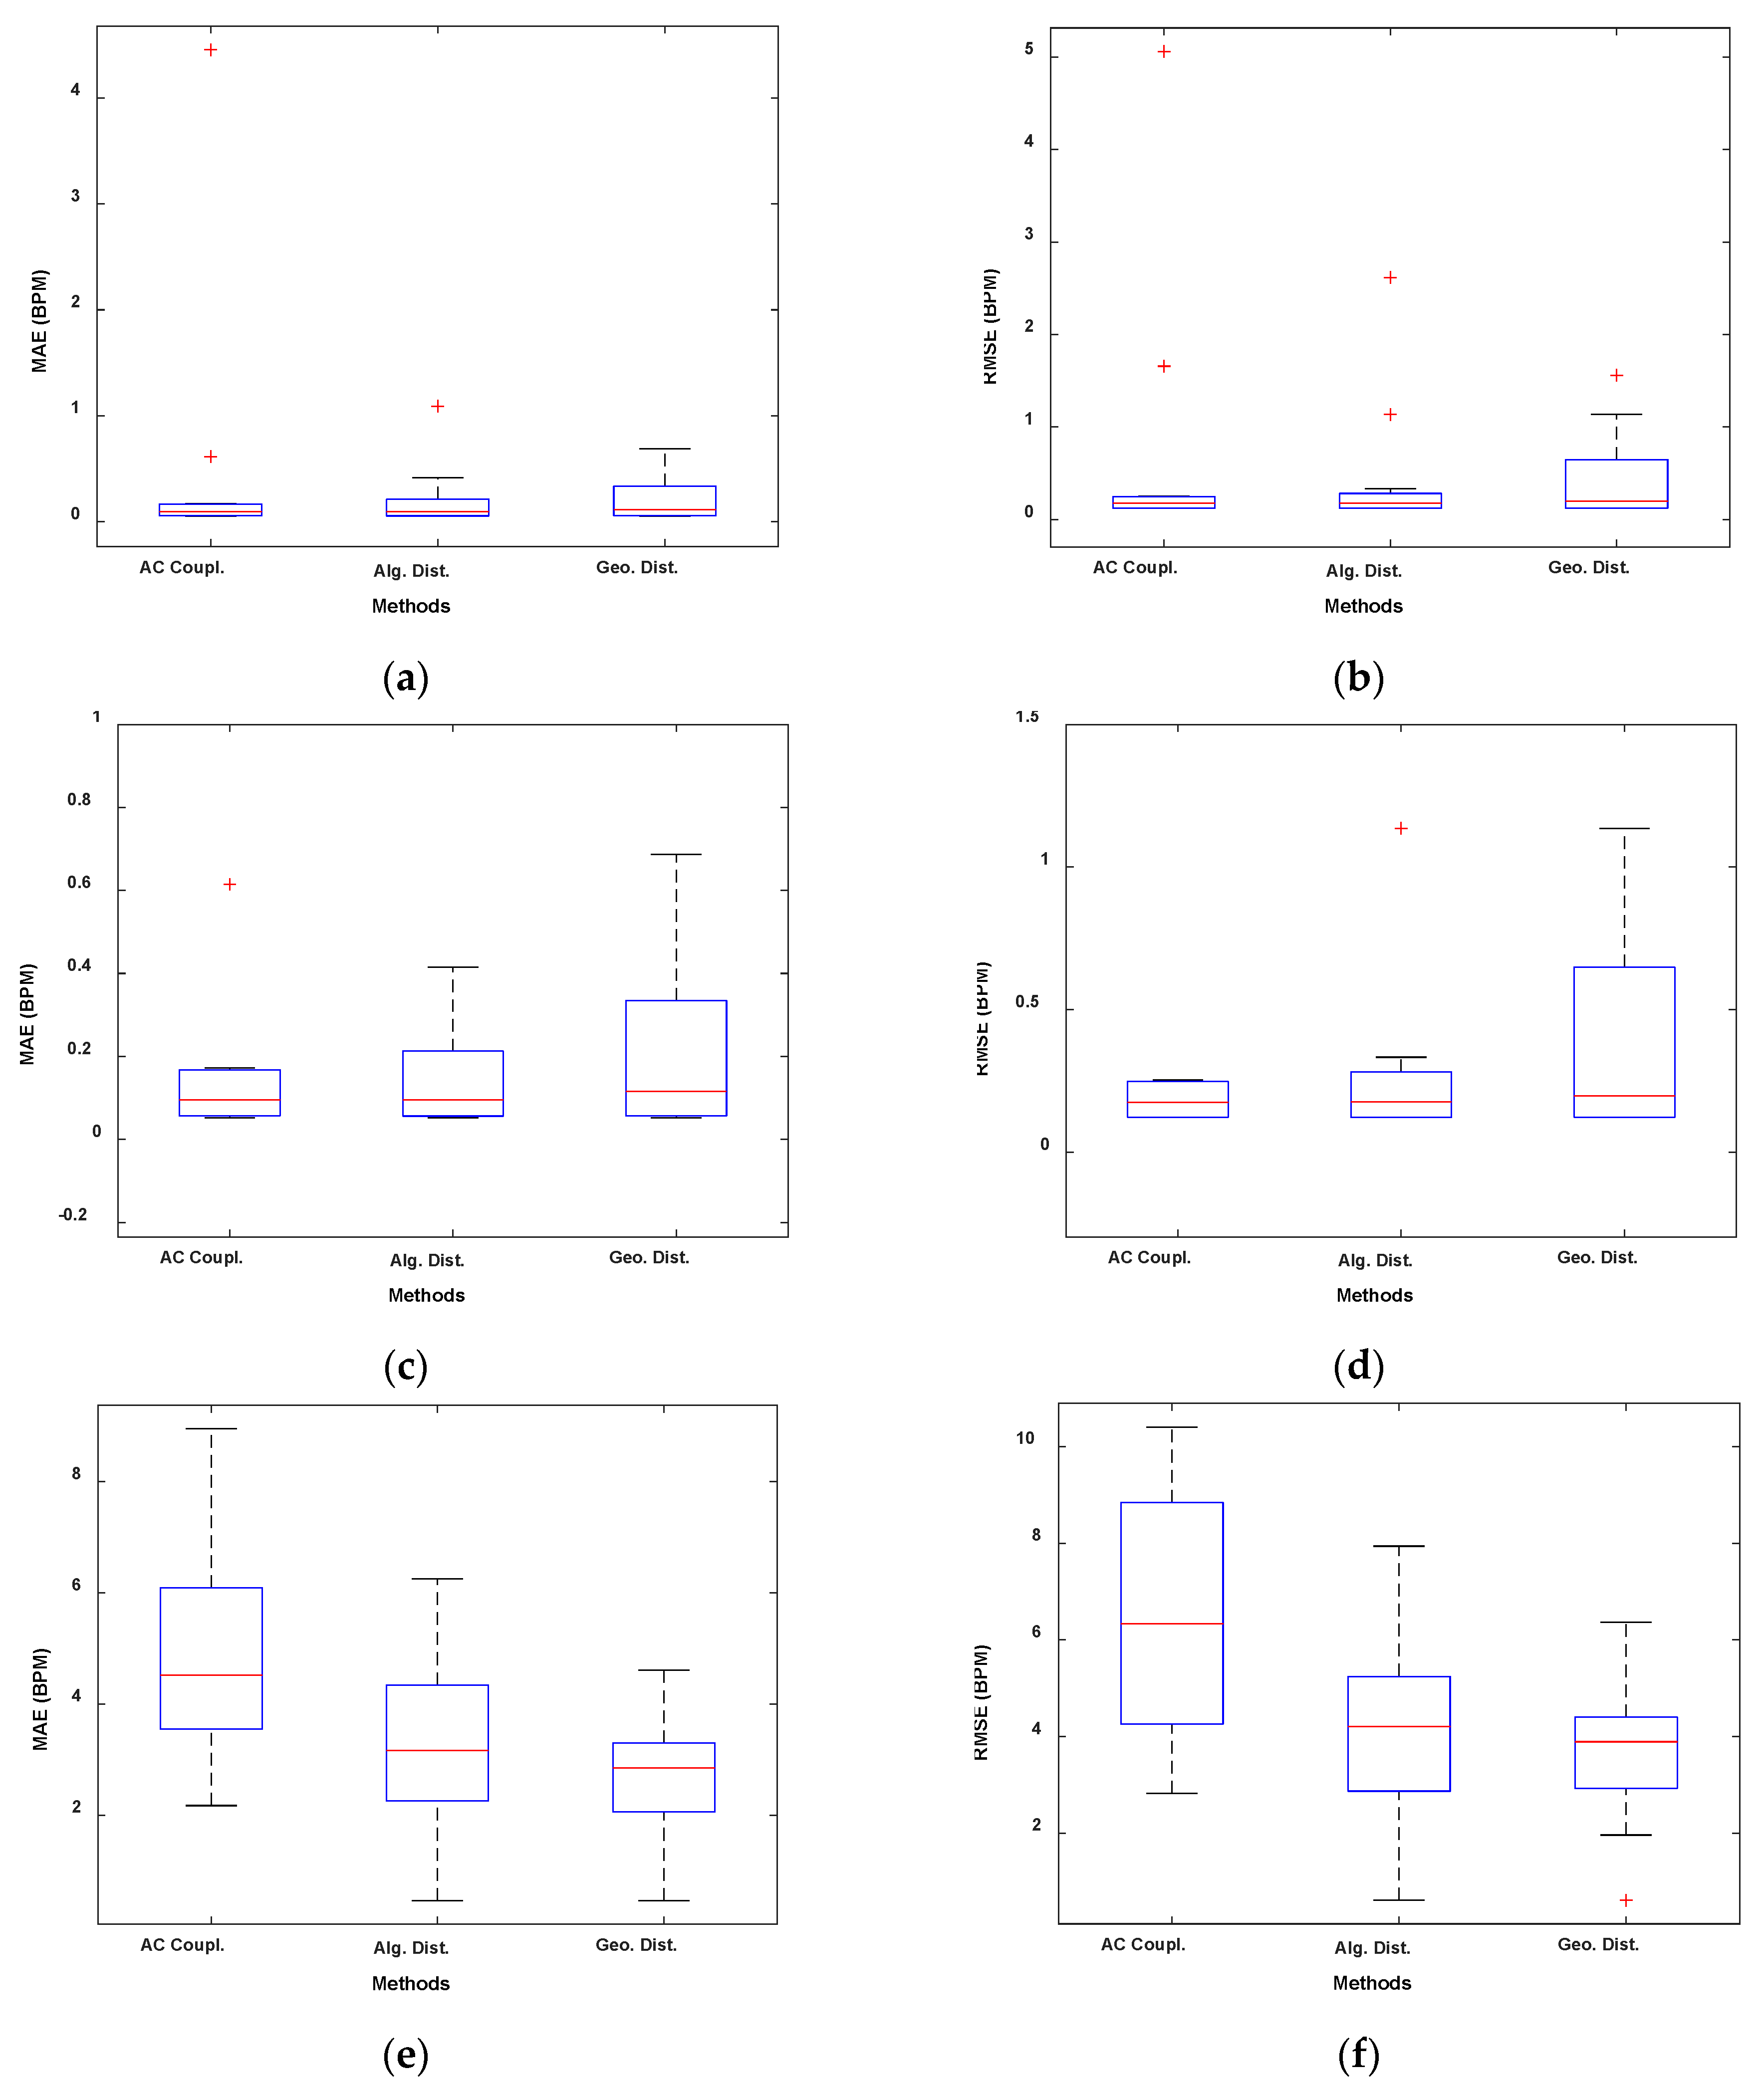
| Errors | AC Coupling | Algebraic Distance | Geometric Distance |
|---|---|---|---|
| MAE RR (BPM) | 0.50 | 0.21 | 0.22 |
| RMSE RR (BPM) | 0.70 | 0.46 | 0.45 |
| MAE HR (BPM) | 4.87 | 3.23 | 2.72 |
| RMSE HR (BPM) | 6.56 | 4.04 | 3.65 |
| Reference | Central Freq. (GHz) | MAE RR (BPM) | RMSE RR (BPM) | MAE HR (BPM) | RMSE HR (BPM) |
|---|---|---|---|---|---|
| [5] | 8.5 | 2.3 | 1.8 | n.a. | n.a. |
| [20] | 5.8 | 0.8 | n.a. | 3.1 | n.a. |
| [36] | 2.5 | 0.71 | 0.72 | 1.04 | 1.11 |
| [37] | 9.6 | n.a. | n.a. | 5.15 | n.a. |
| This work | 7.675 | 0.32 | 0.70 | 1.19 | 2.07 |
| [3] | 61.945 | 1.04 | n.a. | 3.71 | n.a. |
| [14] | 60 | 0.19 | n.a. | 0.92 | n.a. |
| [22] | 60 | n.a. | n.a. | 2.26 | 3.26 |
| [25] | 77 | n.a. | 0.66 | n.a. | 3.60 |
| This work | 62.495 | 0.22 | 0.45 | 2.72 | 3.65 |
Publisher’s Note: MDPI stays neutral with regard to jurisdictional claims in published maps and institutional affiliations. |
© 2022 by the authors. Licensee MDPI, Basel, Switzerland. This article is an open access article distributed under the terms and conditions of the Creative Commons Attribution (CC BY) license (https://creativecommons.org/licenses/by/4.0/).
Share and Cite
Mercuri, M.; Torfs, T.; Rykunov, M.; Laureti, S.; Ricci, M.; Crupi, F. Analysis of Signal Processing Methods to Reject the DC Offset Contribution of Static Reflectors in FMCW Radar-Based Vital Signs Monitoring. Sensors 2022, 22, 9697. https://doi.org/10.3390/s22249697
Mercuri M, Torfs T, Rykunov M, Laureti S, Ricci M, Crupi F. Analysis of Signal Processing Methods to Reject the DC Offset Contribution of Static Reflectors in FMCW Radar-Based Vital Signs Monitoring. Sensors. 2022; 22(24):9697. https://doi.org/10.3390/s22249697
Chicago/Turabian StyleMercuri, Marco, Tom Torfs, Maxim Rykunov, Stefano Laureti, Marco Ricci, and Felice Crupi. 2022. "Analysis of Signal Processing Methods to Reject the DC Offset Contribution of Static Reflectors in FMCW Radar-Based Vital Signs Monitoring" Sensors 22, no. 24: 9697. https://doi.org/10.3390/s22249697
APA StyleMercuri, M., Torfs, T., Rykunov, M., Laureti, S., Ricci, M., & Crupi, F. (2022). Analysis of Signal Processing Methods to Reject the DC Offset Contribution of Static Reflectors in FMCW Radar-Based Vital Signs Monitoring. Sensors, 22(24), 9697. https://doi.org/10.3390/s22249697