
BERT for Activity Recognition Using Sequences of Skeleton Features and Data Augmentation with GAN

 ,
,  , ,
, ,  and
and
Abstract
1. Introduction
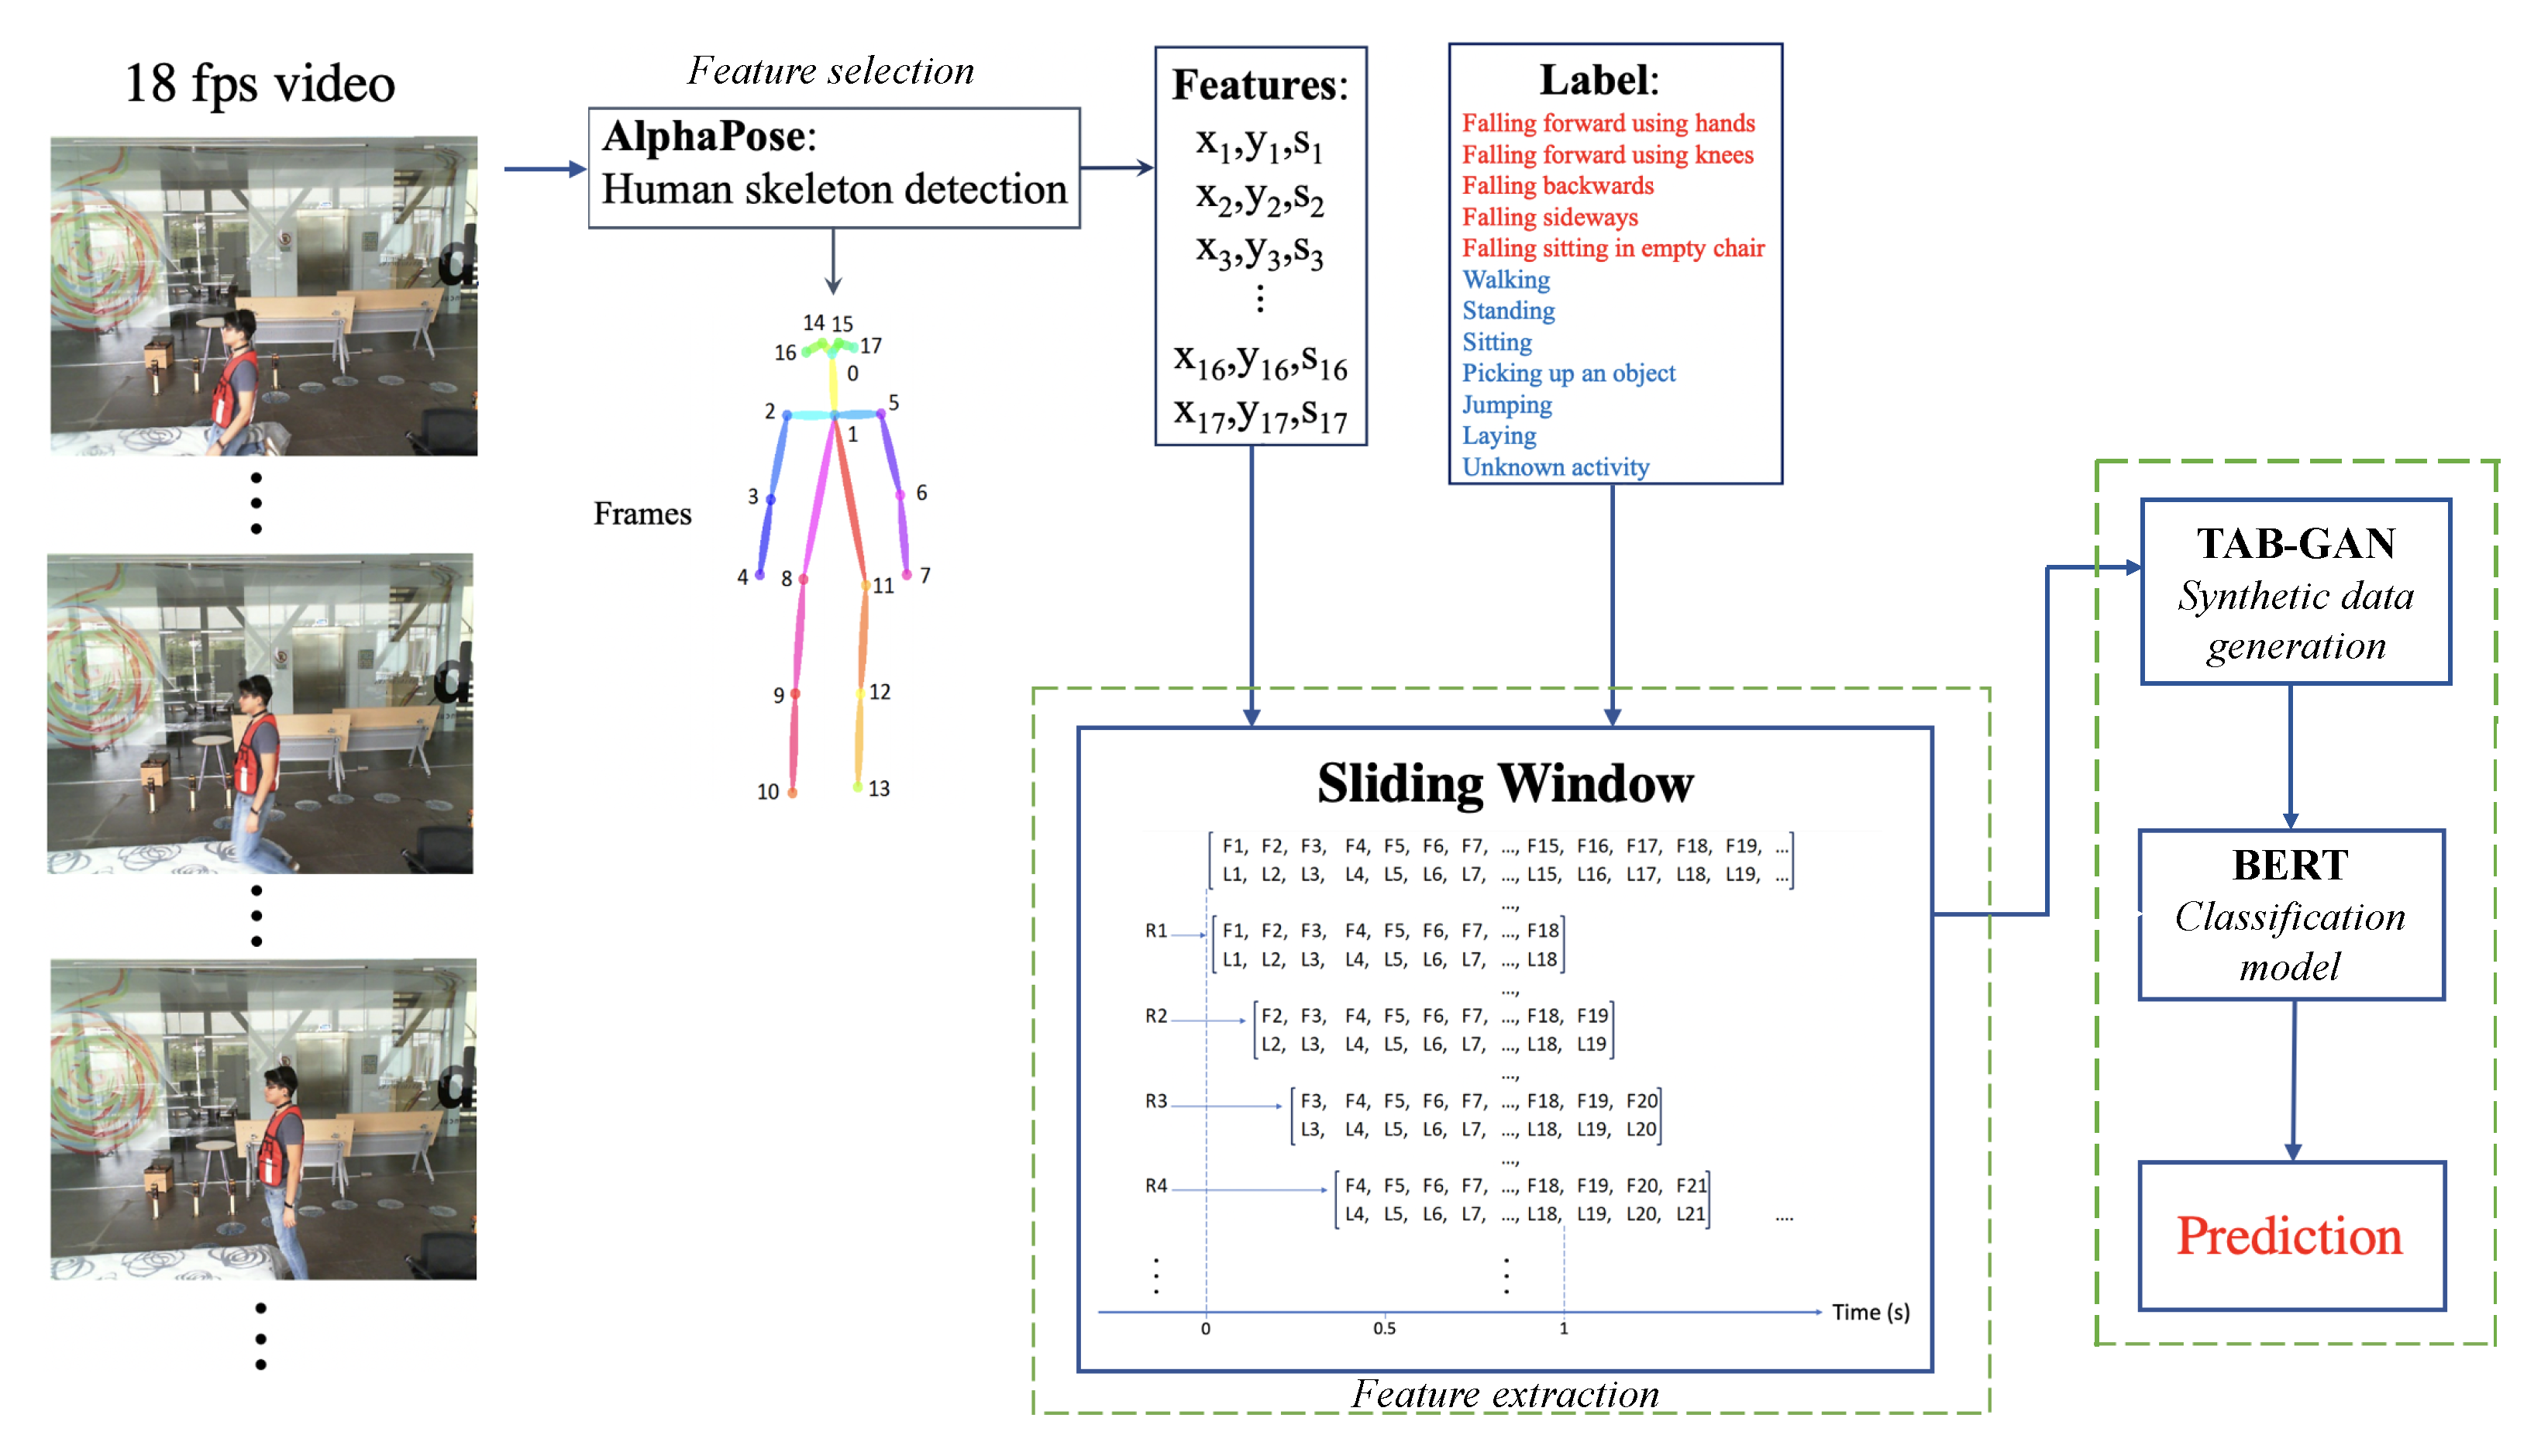
- The use of novel deep neural networks such as BERT transformer networks for the recognition of activities using data of skeleton poses extracted from video images. As far as we know, our approach is the first activity recognition model that uses BERT networks directly with numerical data instead of text. Our proposal suggests that it is possible to use the characteristics of the pose (skeleton) of a person in video images as if it were a sentence (text)—this is how BERT interprets it. The way in which we approach this challenge is described in Section 3.2.
- The development of a direct comparison between the use of machine learning and deep learning models for the recognition of activities using the same methodology and the same dataset.
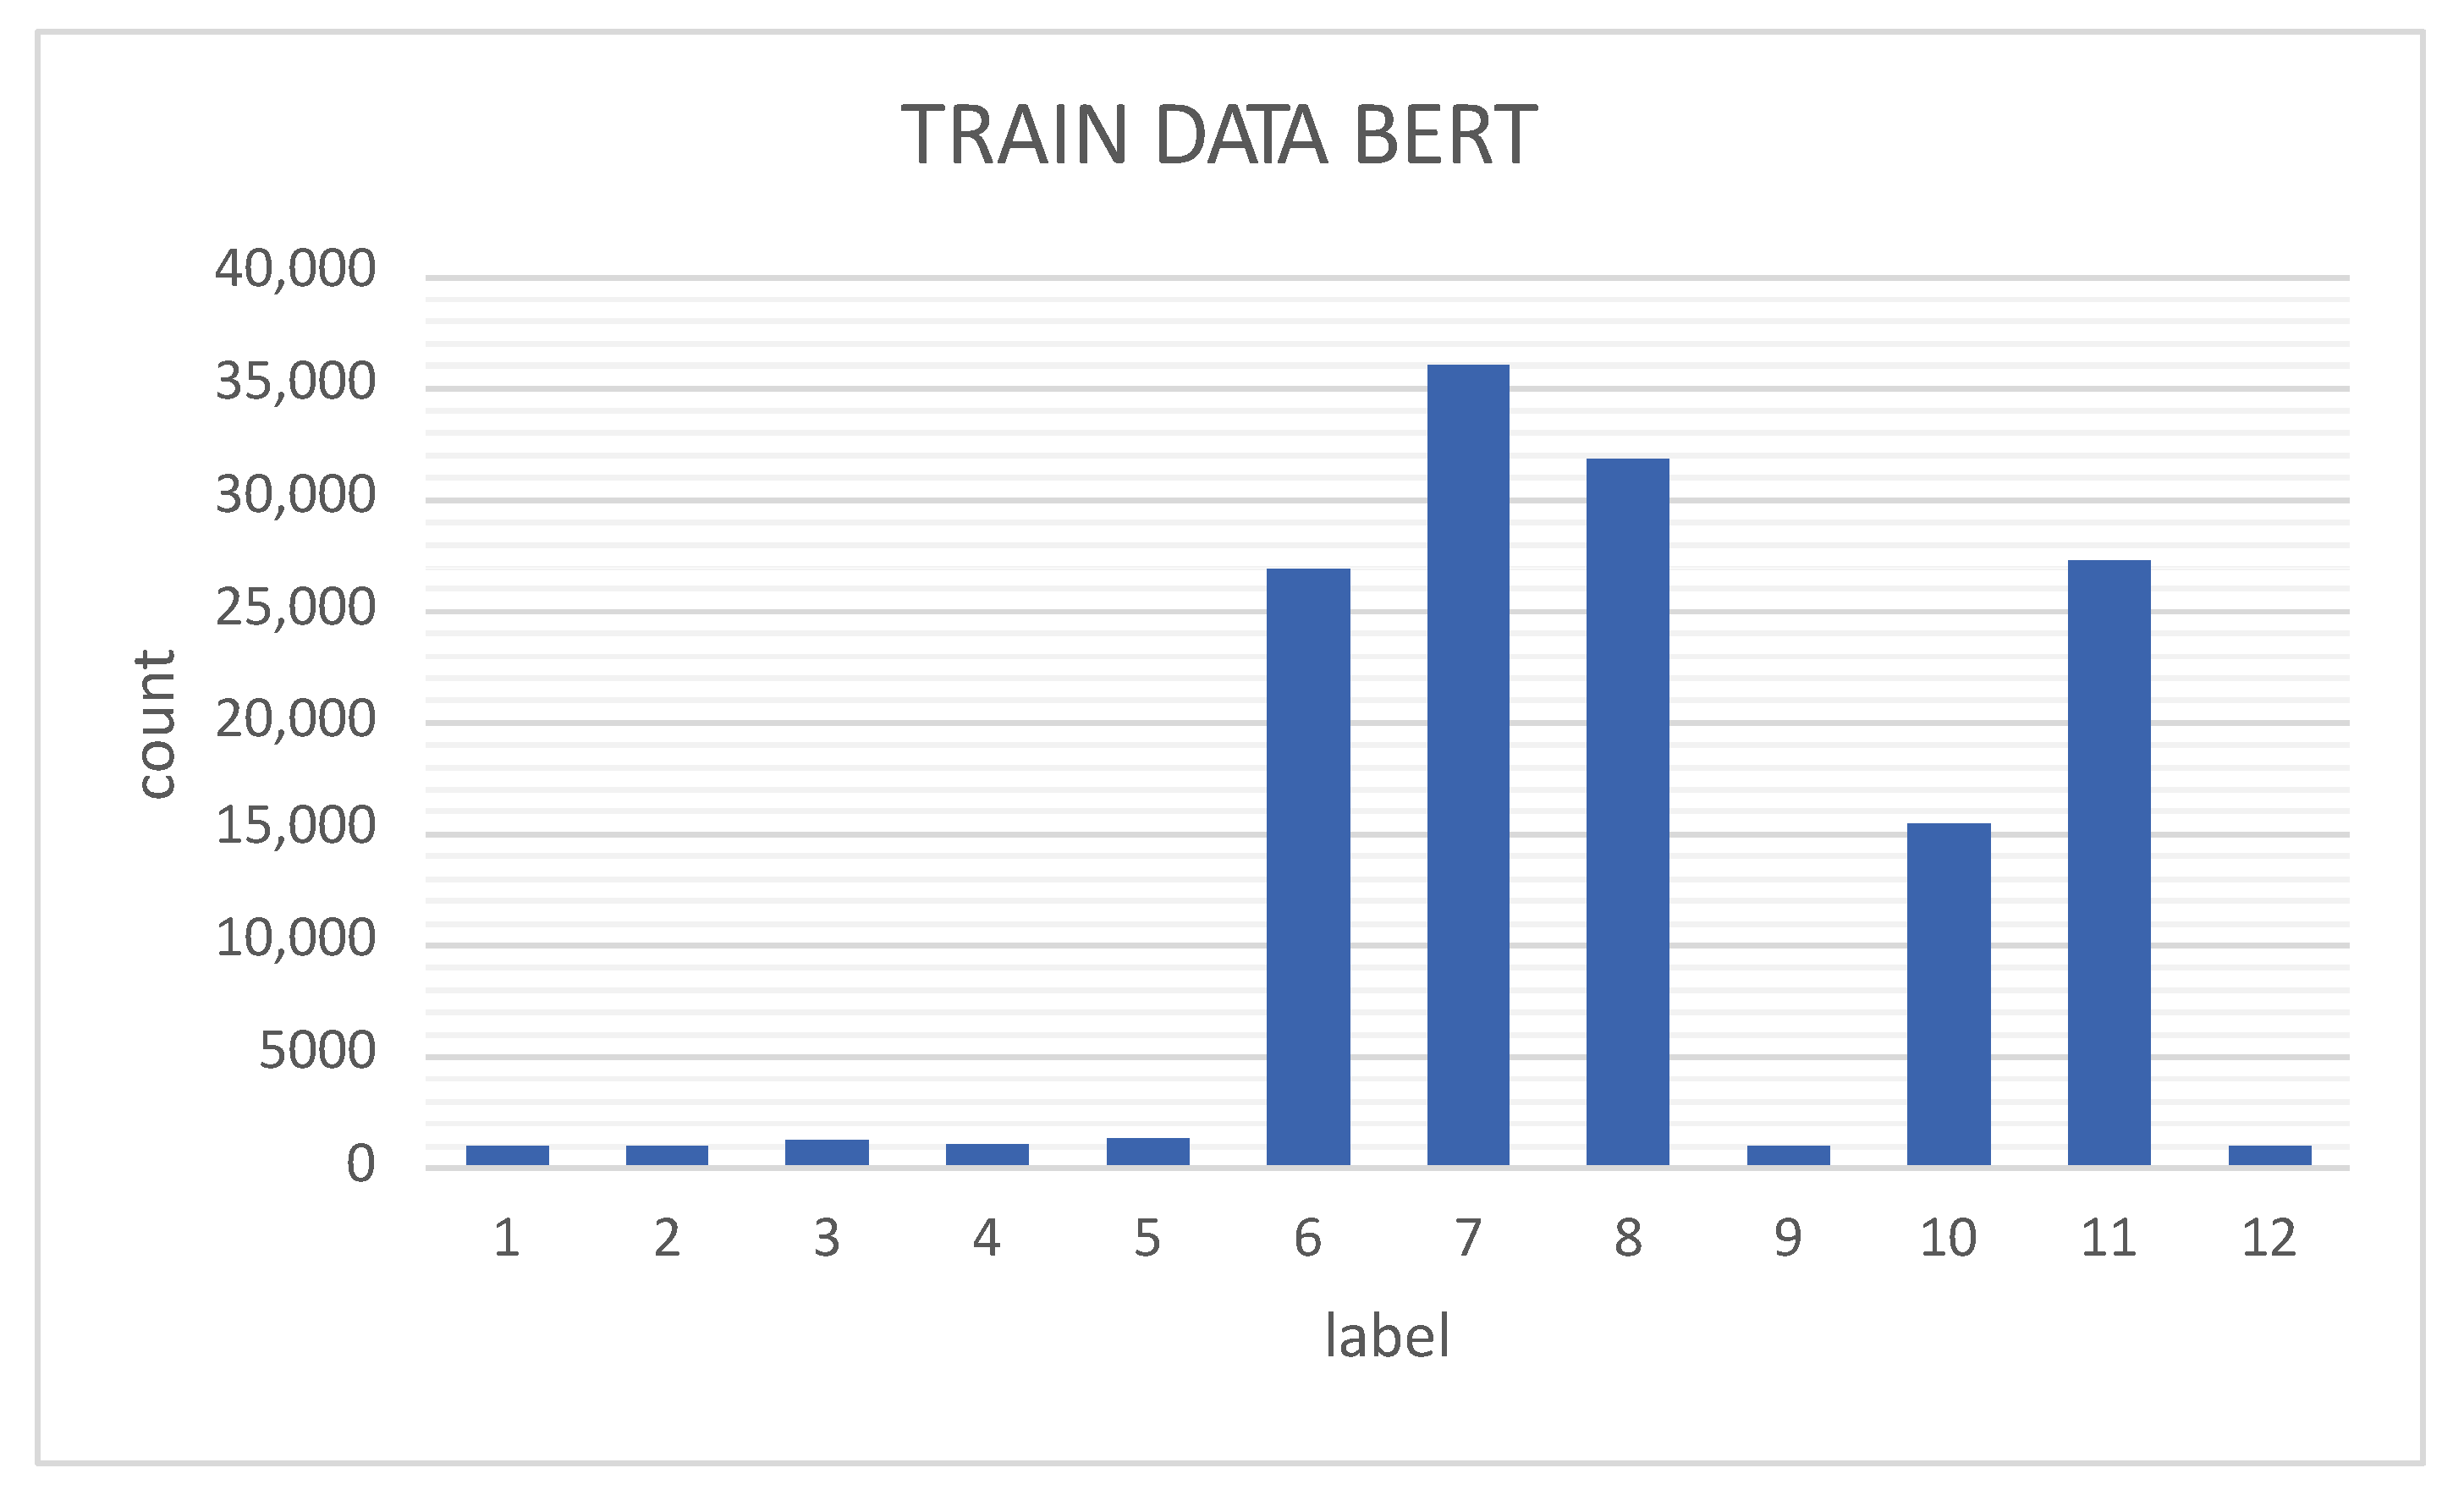
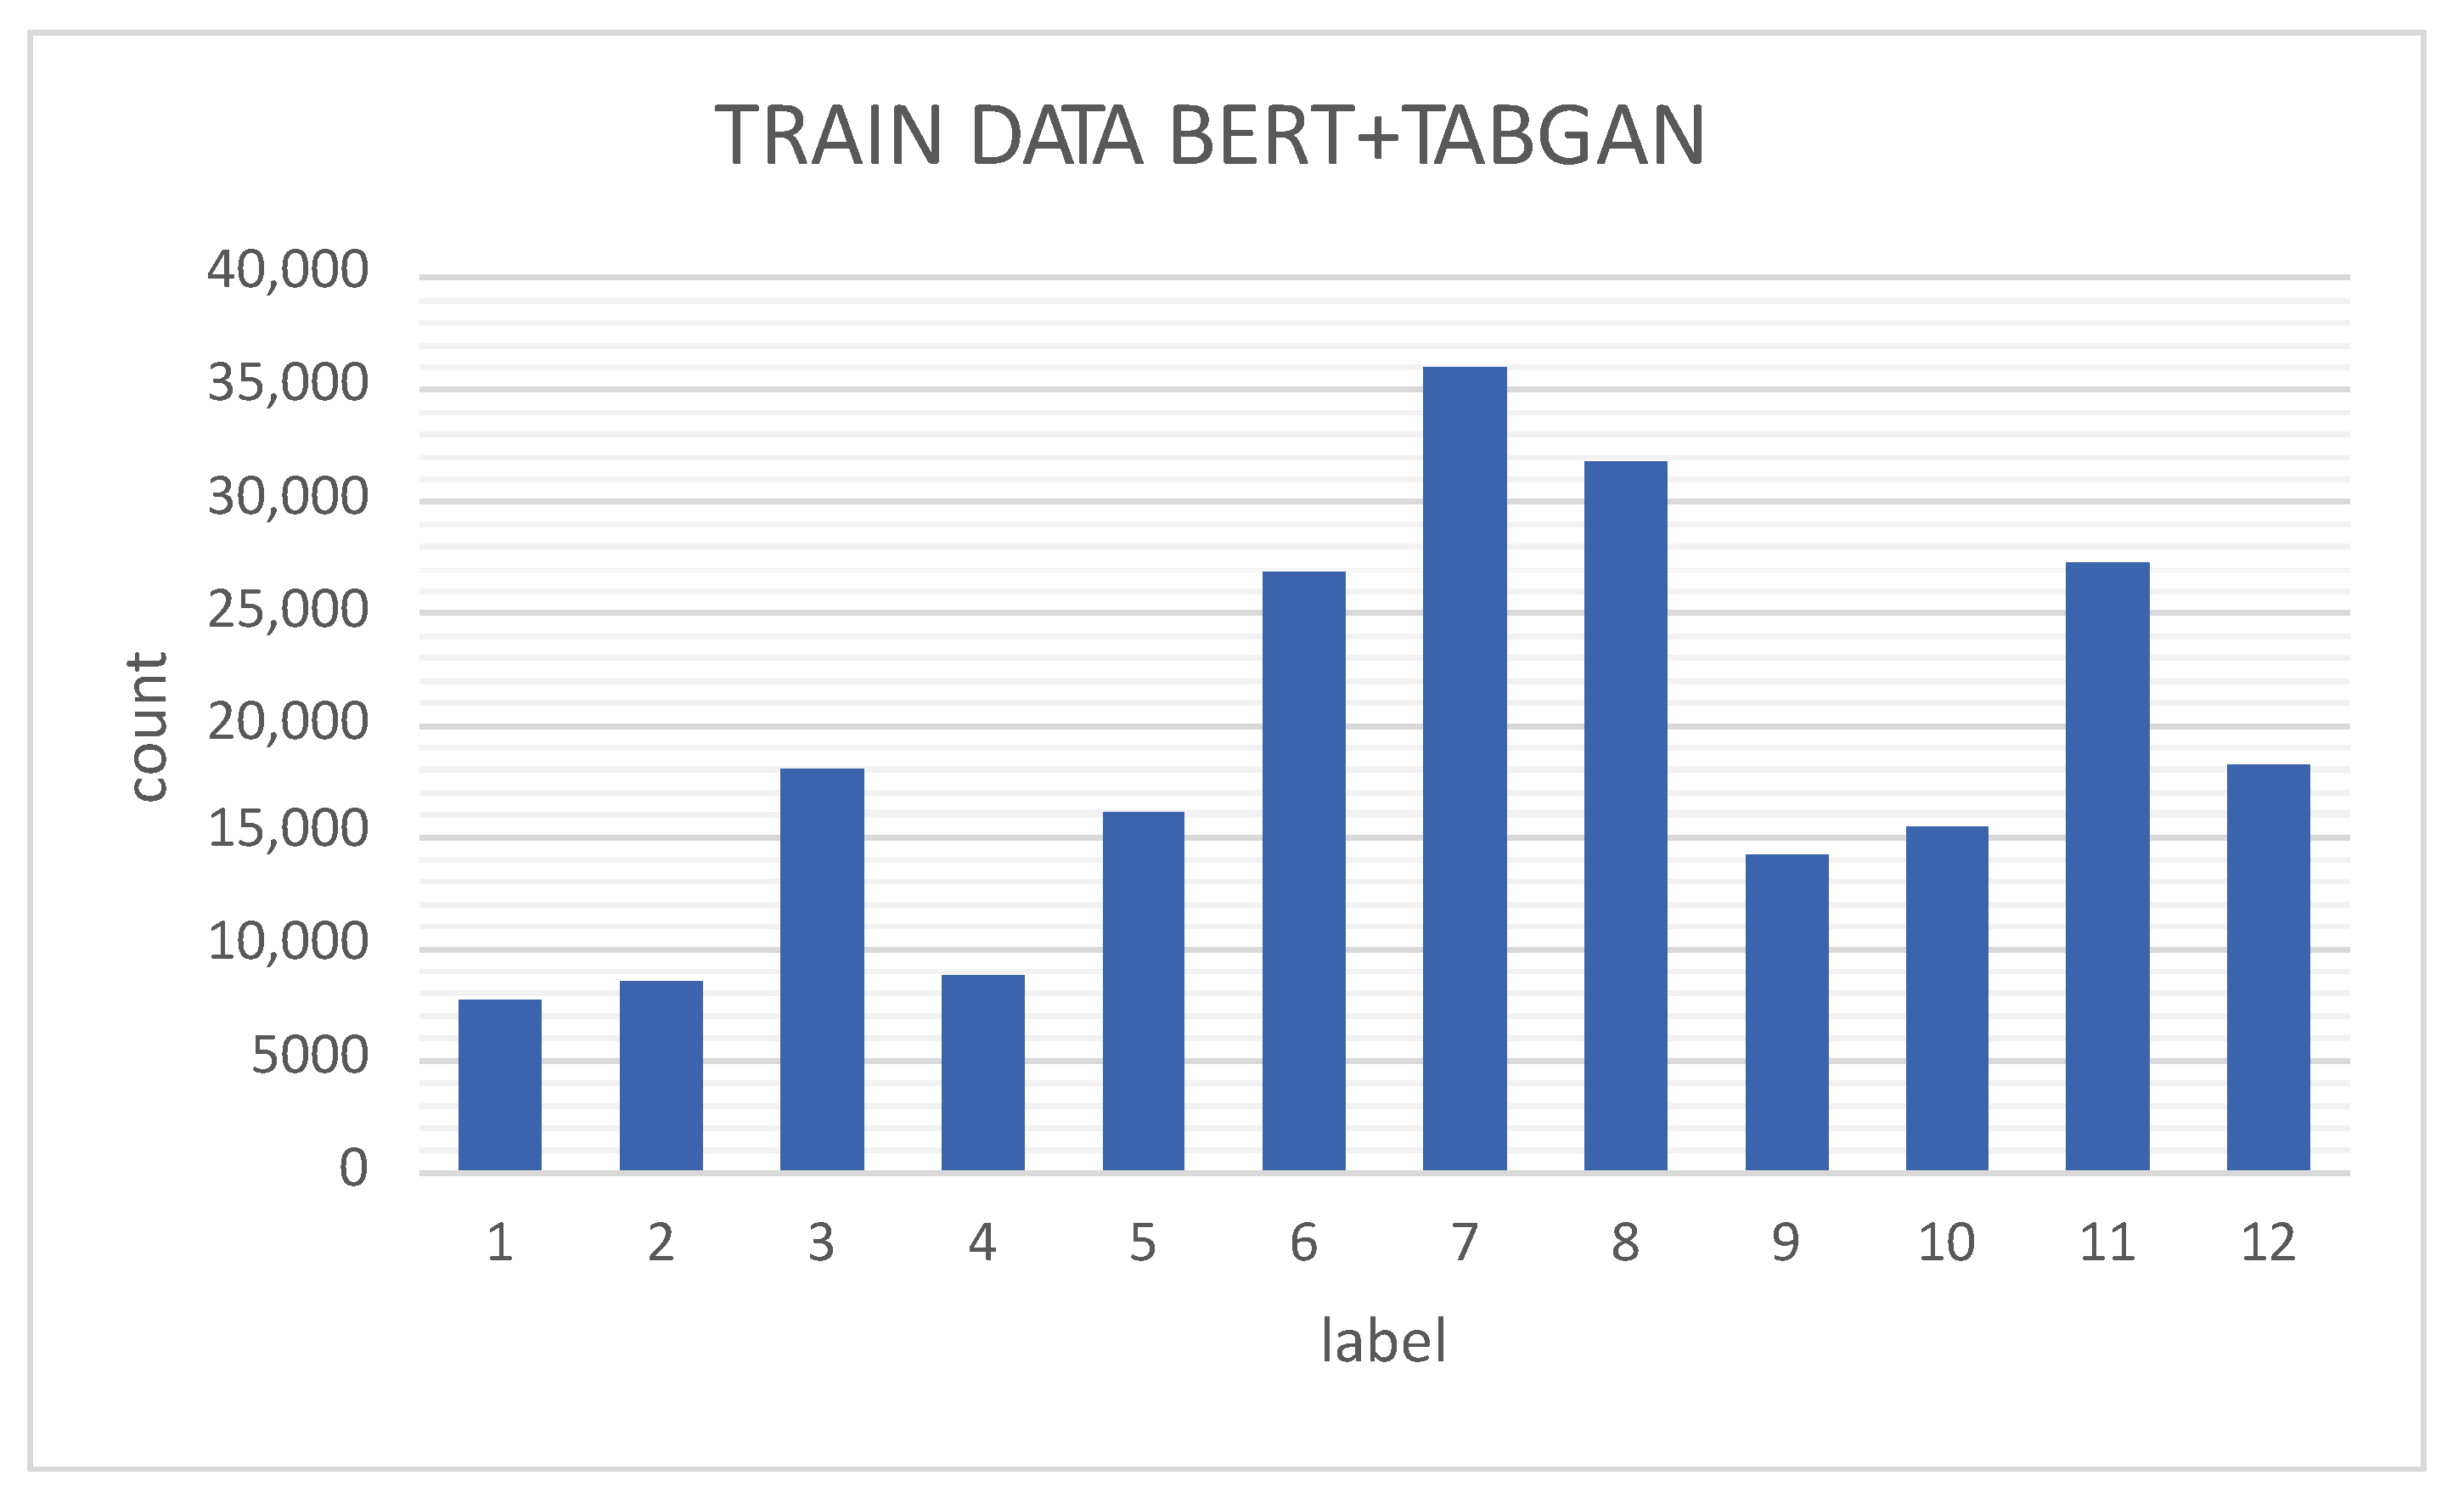
- The use of data augmentation of the activities corresponding to the unbalanced classes demonstrating the hypothesis that it is possible to increase the performance of the BERT model by increasing the data of the unbalanced classes of the UP-Fall set using generative networks. The generation of these artificial data is achieved using GANs, which lead to better activity recognition performance. Performance is then compared with our previously published results for the UP-Fall dataset.
2. Datasets
3. Methodology
3.1. Feature Selection and Extraction
3.1.1. Skeleton Detection
3.1.2. Sliding Windows
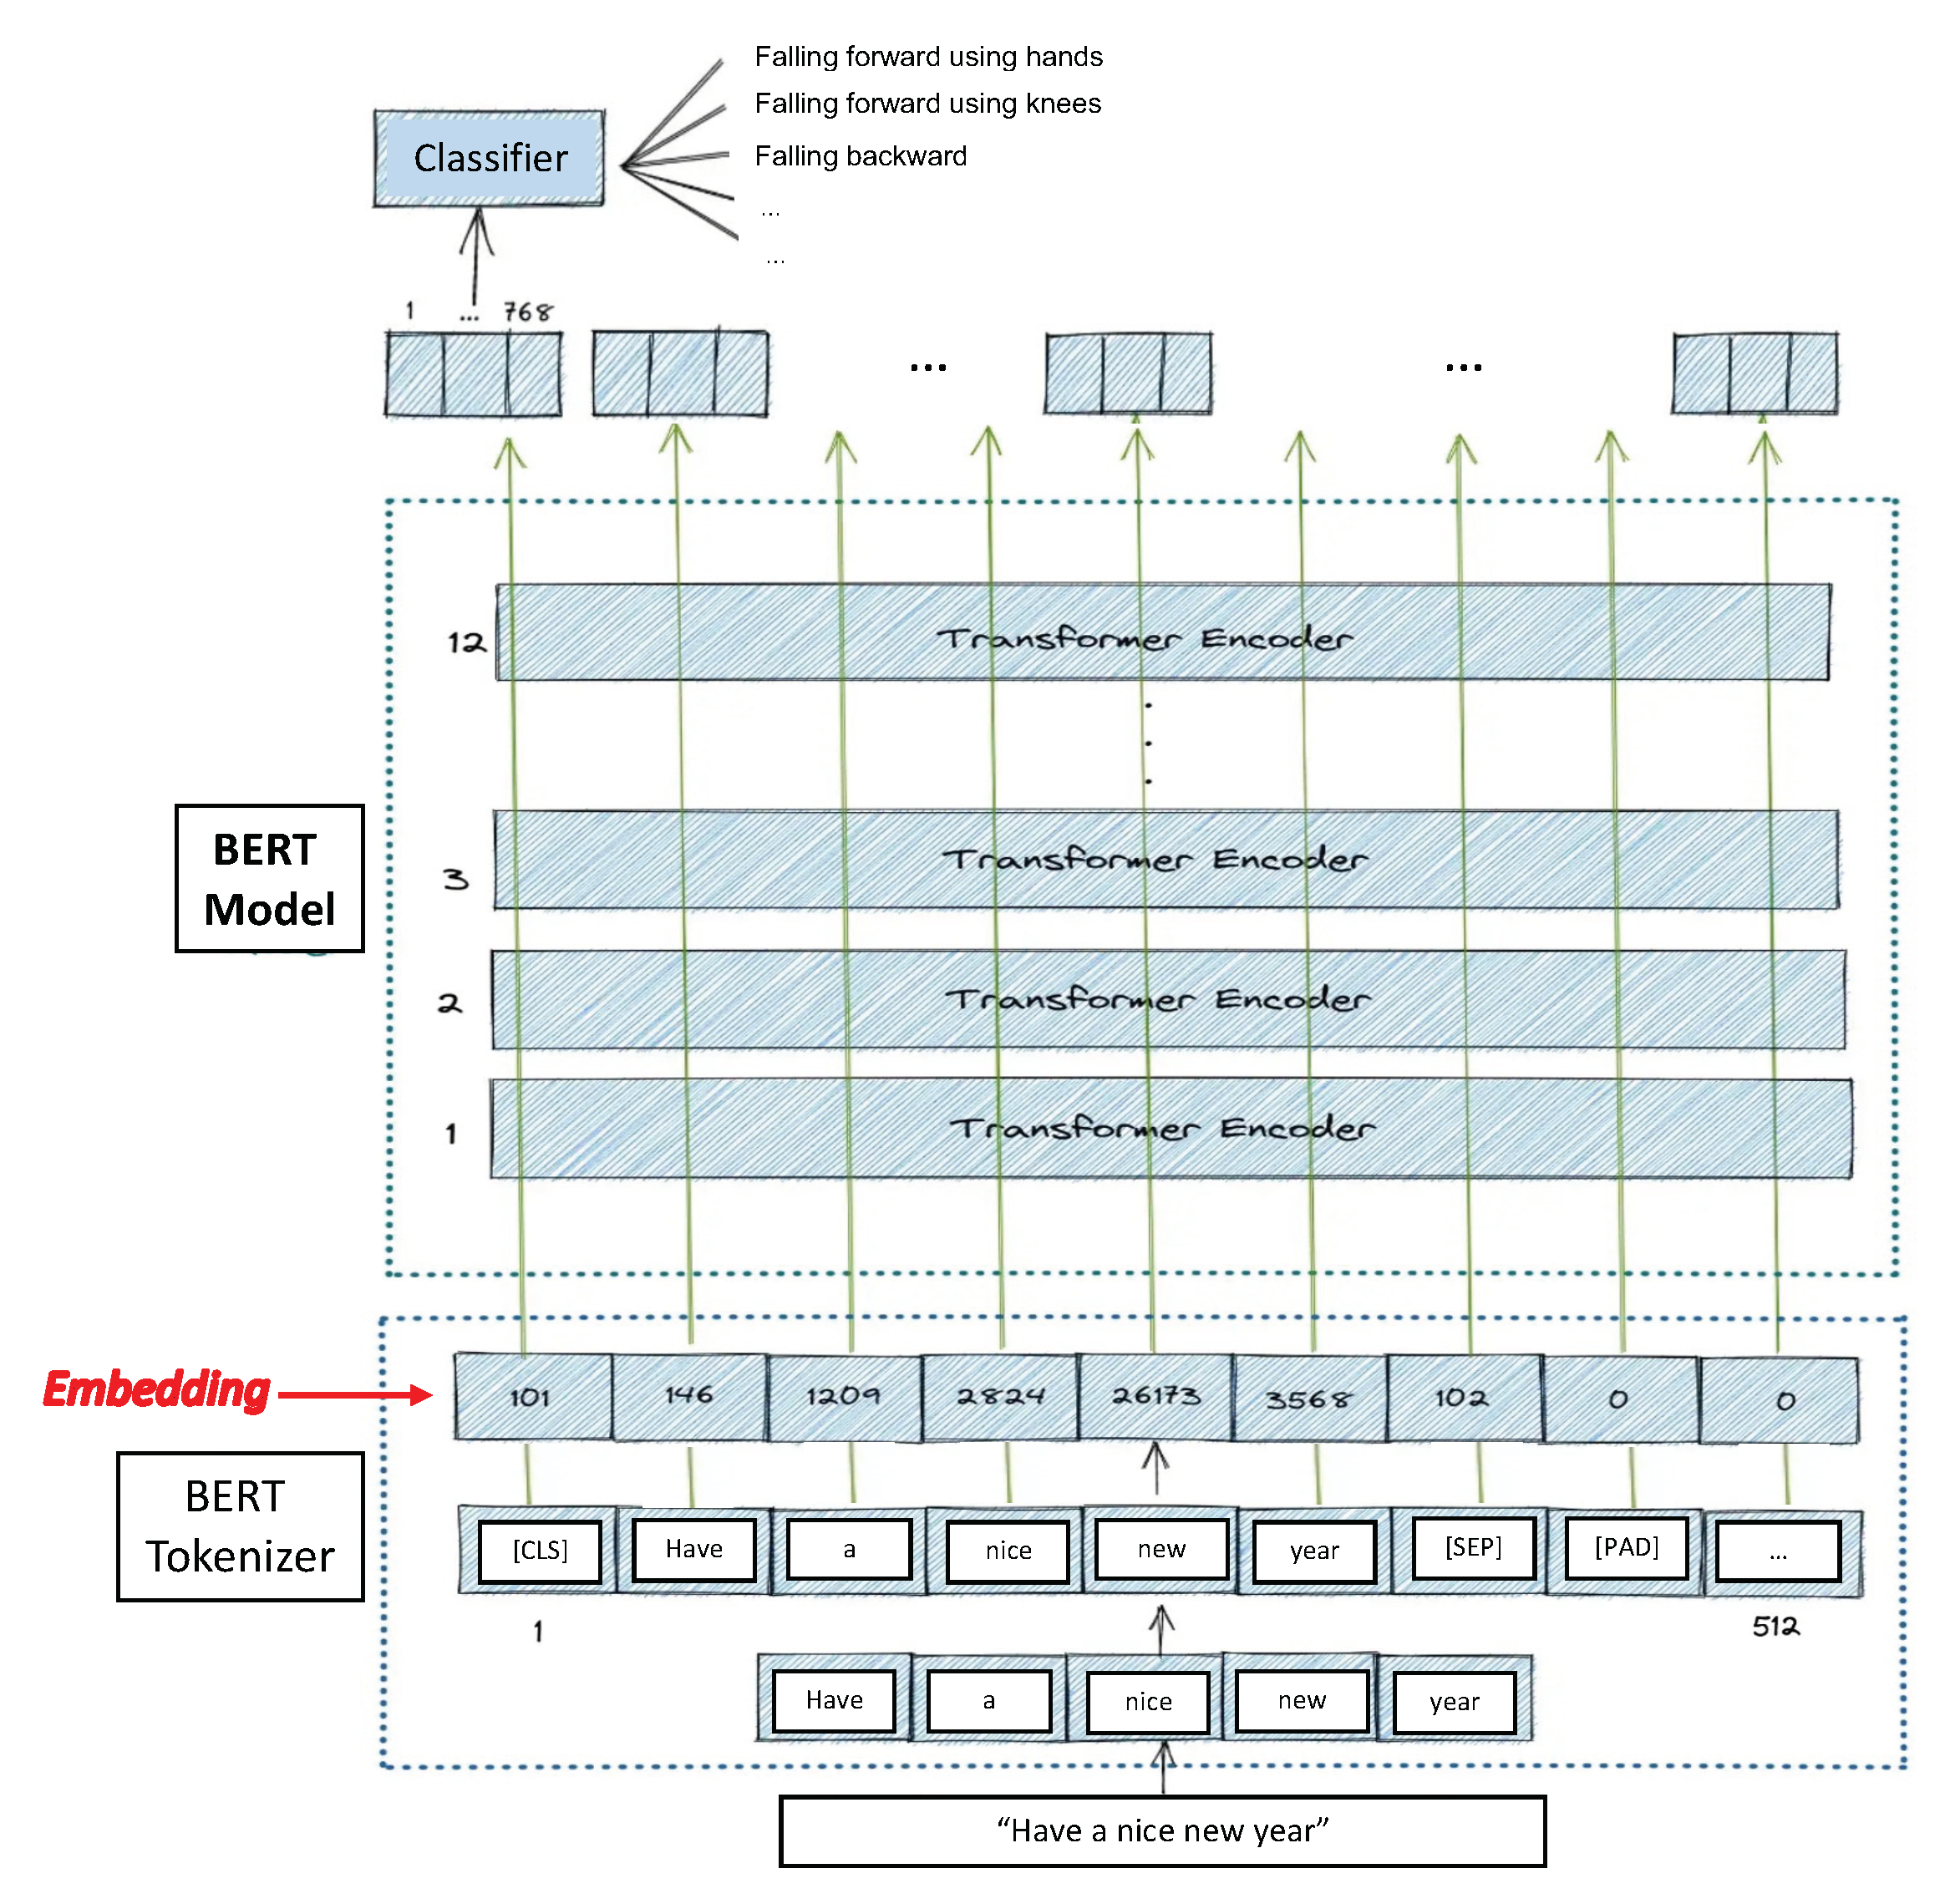
3.2. Classification Model
- The layer number (13 layers): 13 because the first element is the input embedding; the rest are the outputs of each of BERT’s 12 layers.
- The batch number: 1 vector (for each sliding window).
- The word/token number (153 tokens in our vector).
- The hidden unit/feature number (768 features, BERT’s default).
- input_ids: typing.Optional[torch.Tensor] = None.
- attention_mask: typing.Optional[torch.Tensor] = None.
- token_type_ids: typing.Optional[torch.Tensor] = None.
- position_ids: typing.Optional[torch.Tensor] = None.
- head_mask: typing.Optional[torch.Tensor] = None.
- inputs_embeds: typing.Optional[torch.Tensor] = None.
- labels: typing.Optional[torch.Tensor] = None.
- next_sentence_label: typing.Optional[torch.Tensor ] = None.
- output_attentions: typing.Optional[bool] = None.
- output_hidden_states: typing.Optional[bool] = None.
- return_dict: typing.Optional[bool] = None.
- self.drop = nn.Dropout(p = 0.1),
- self.out = nn.Linear(self.bert.config.hidden_size, n_classes),
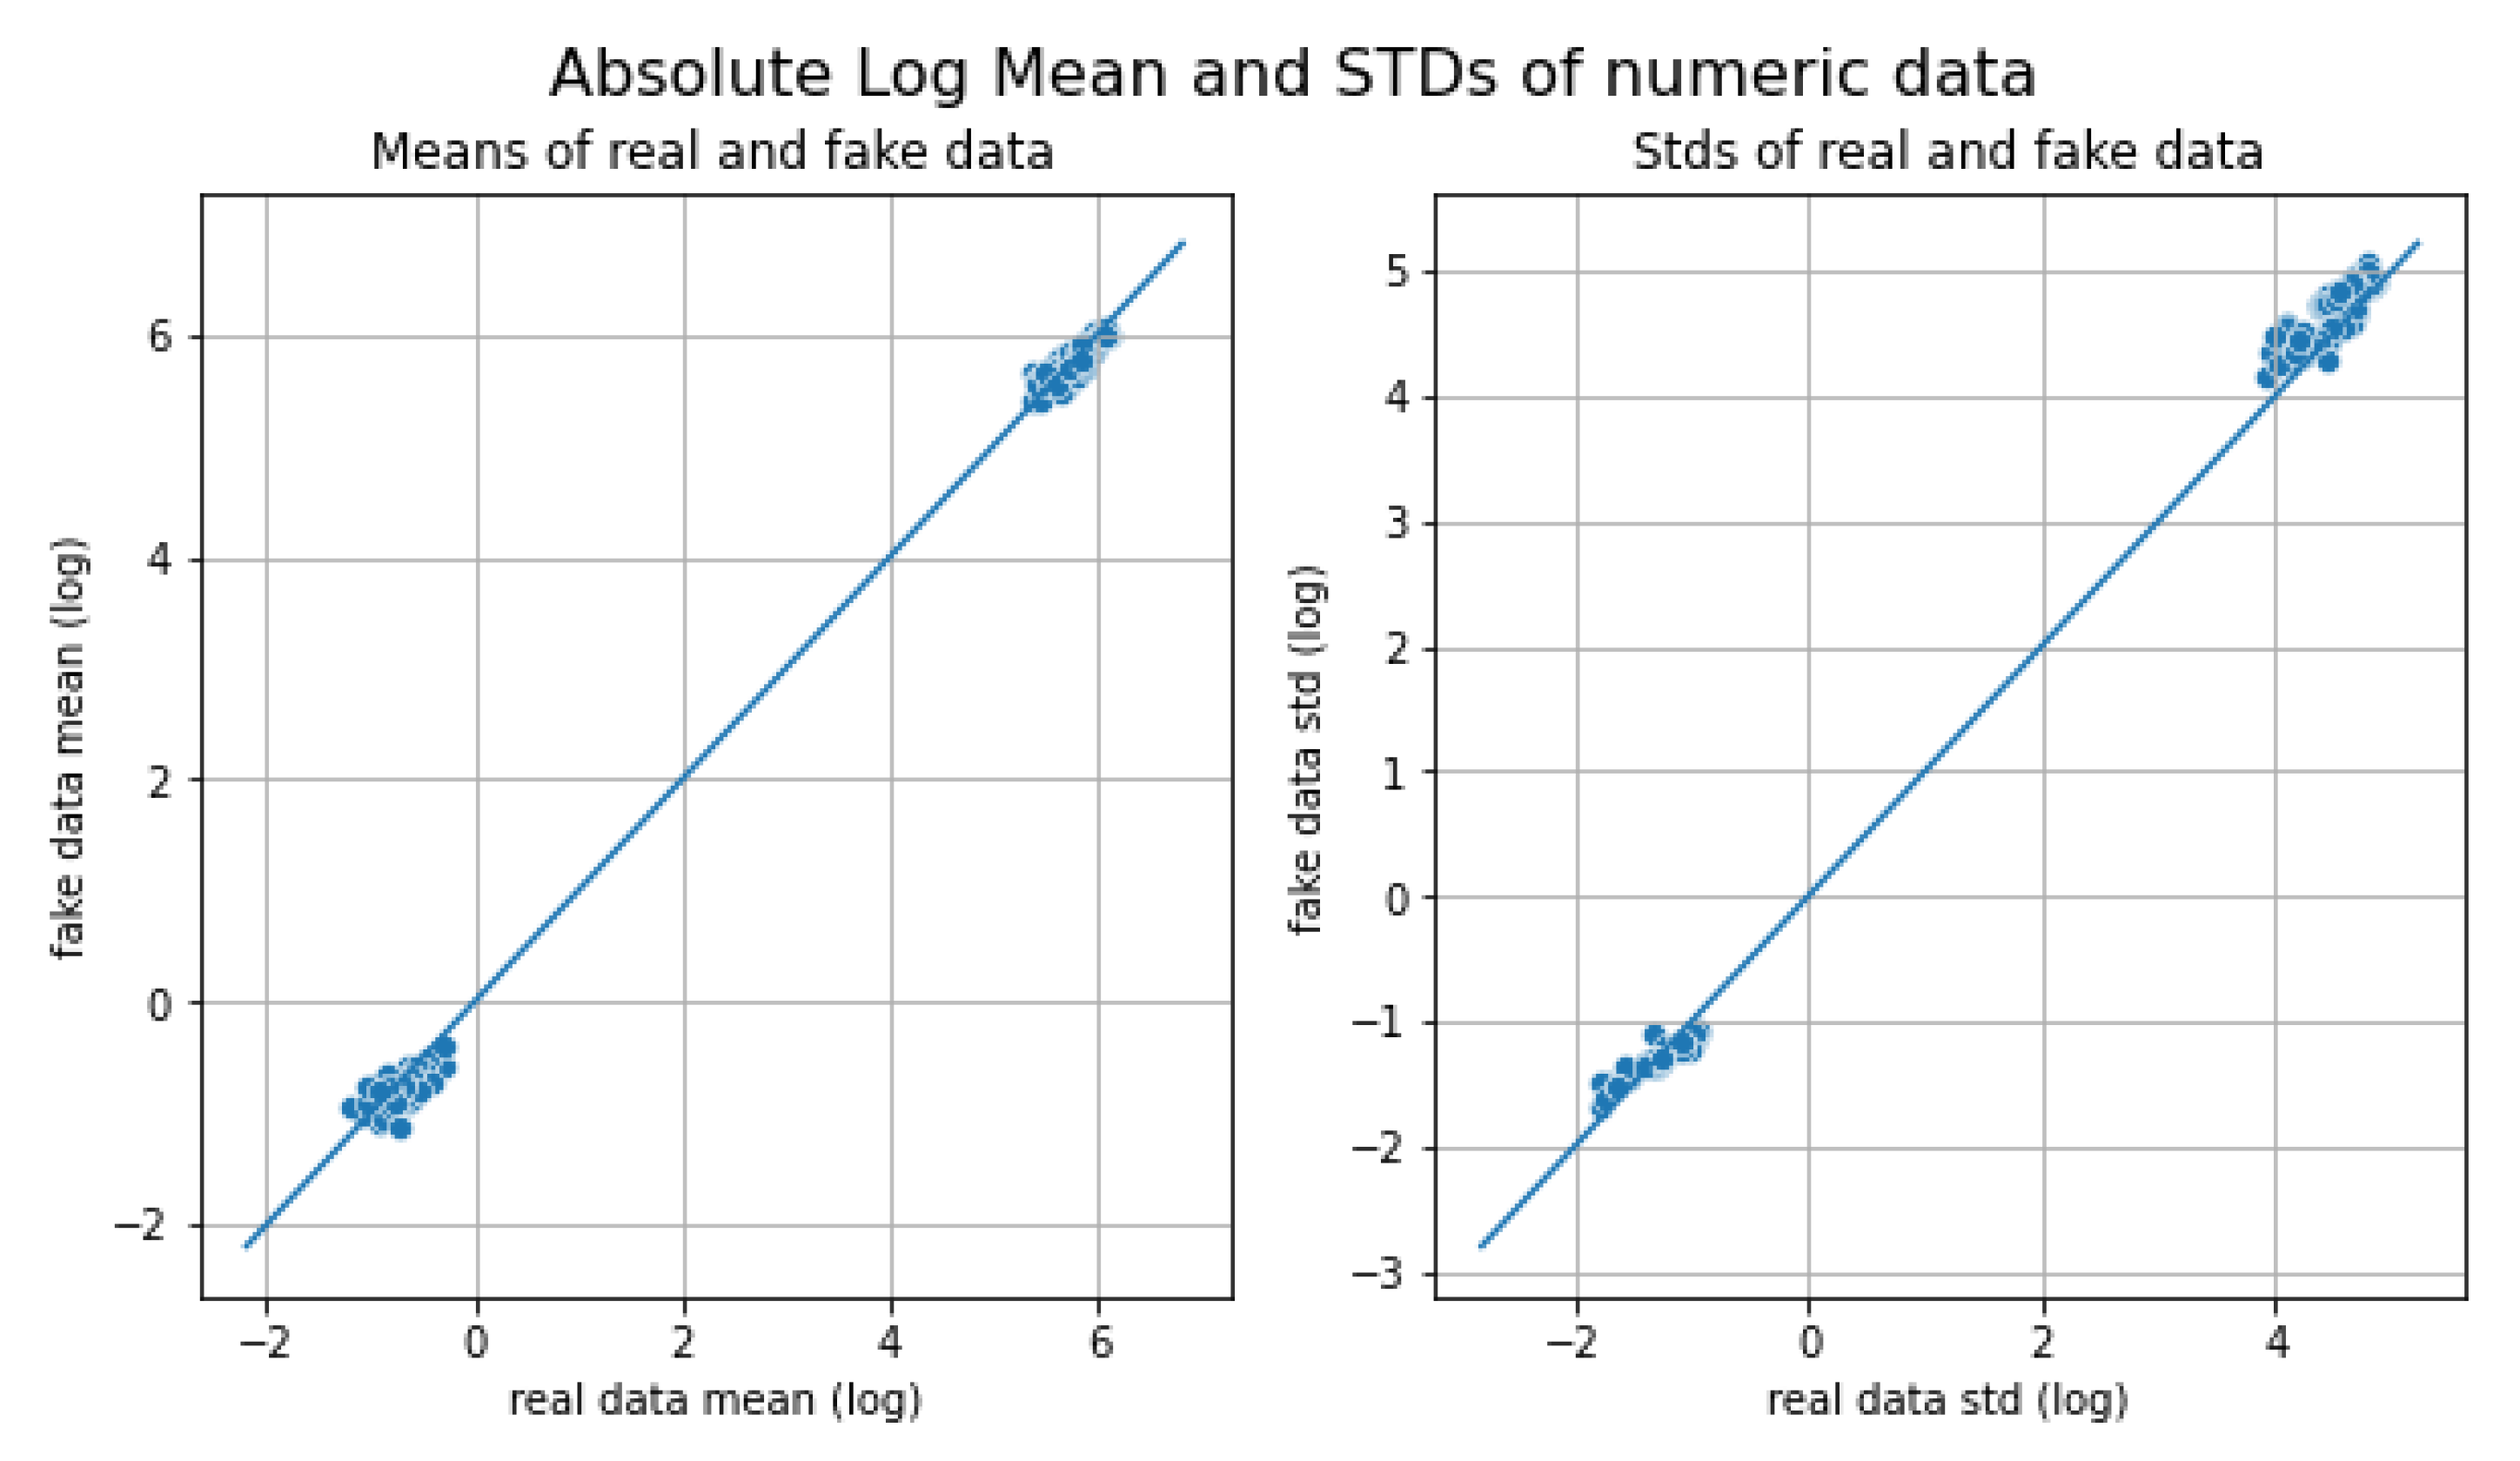
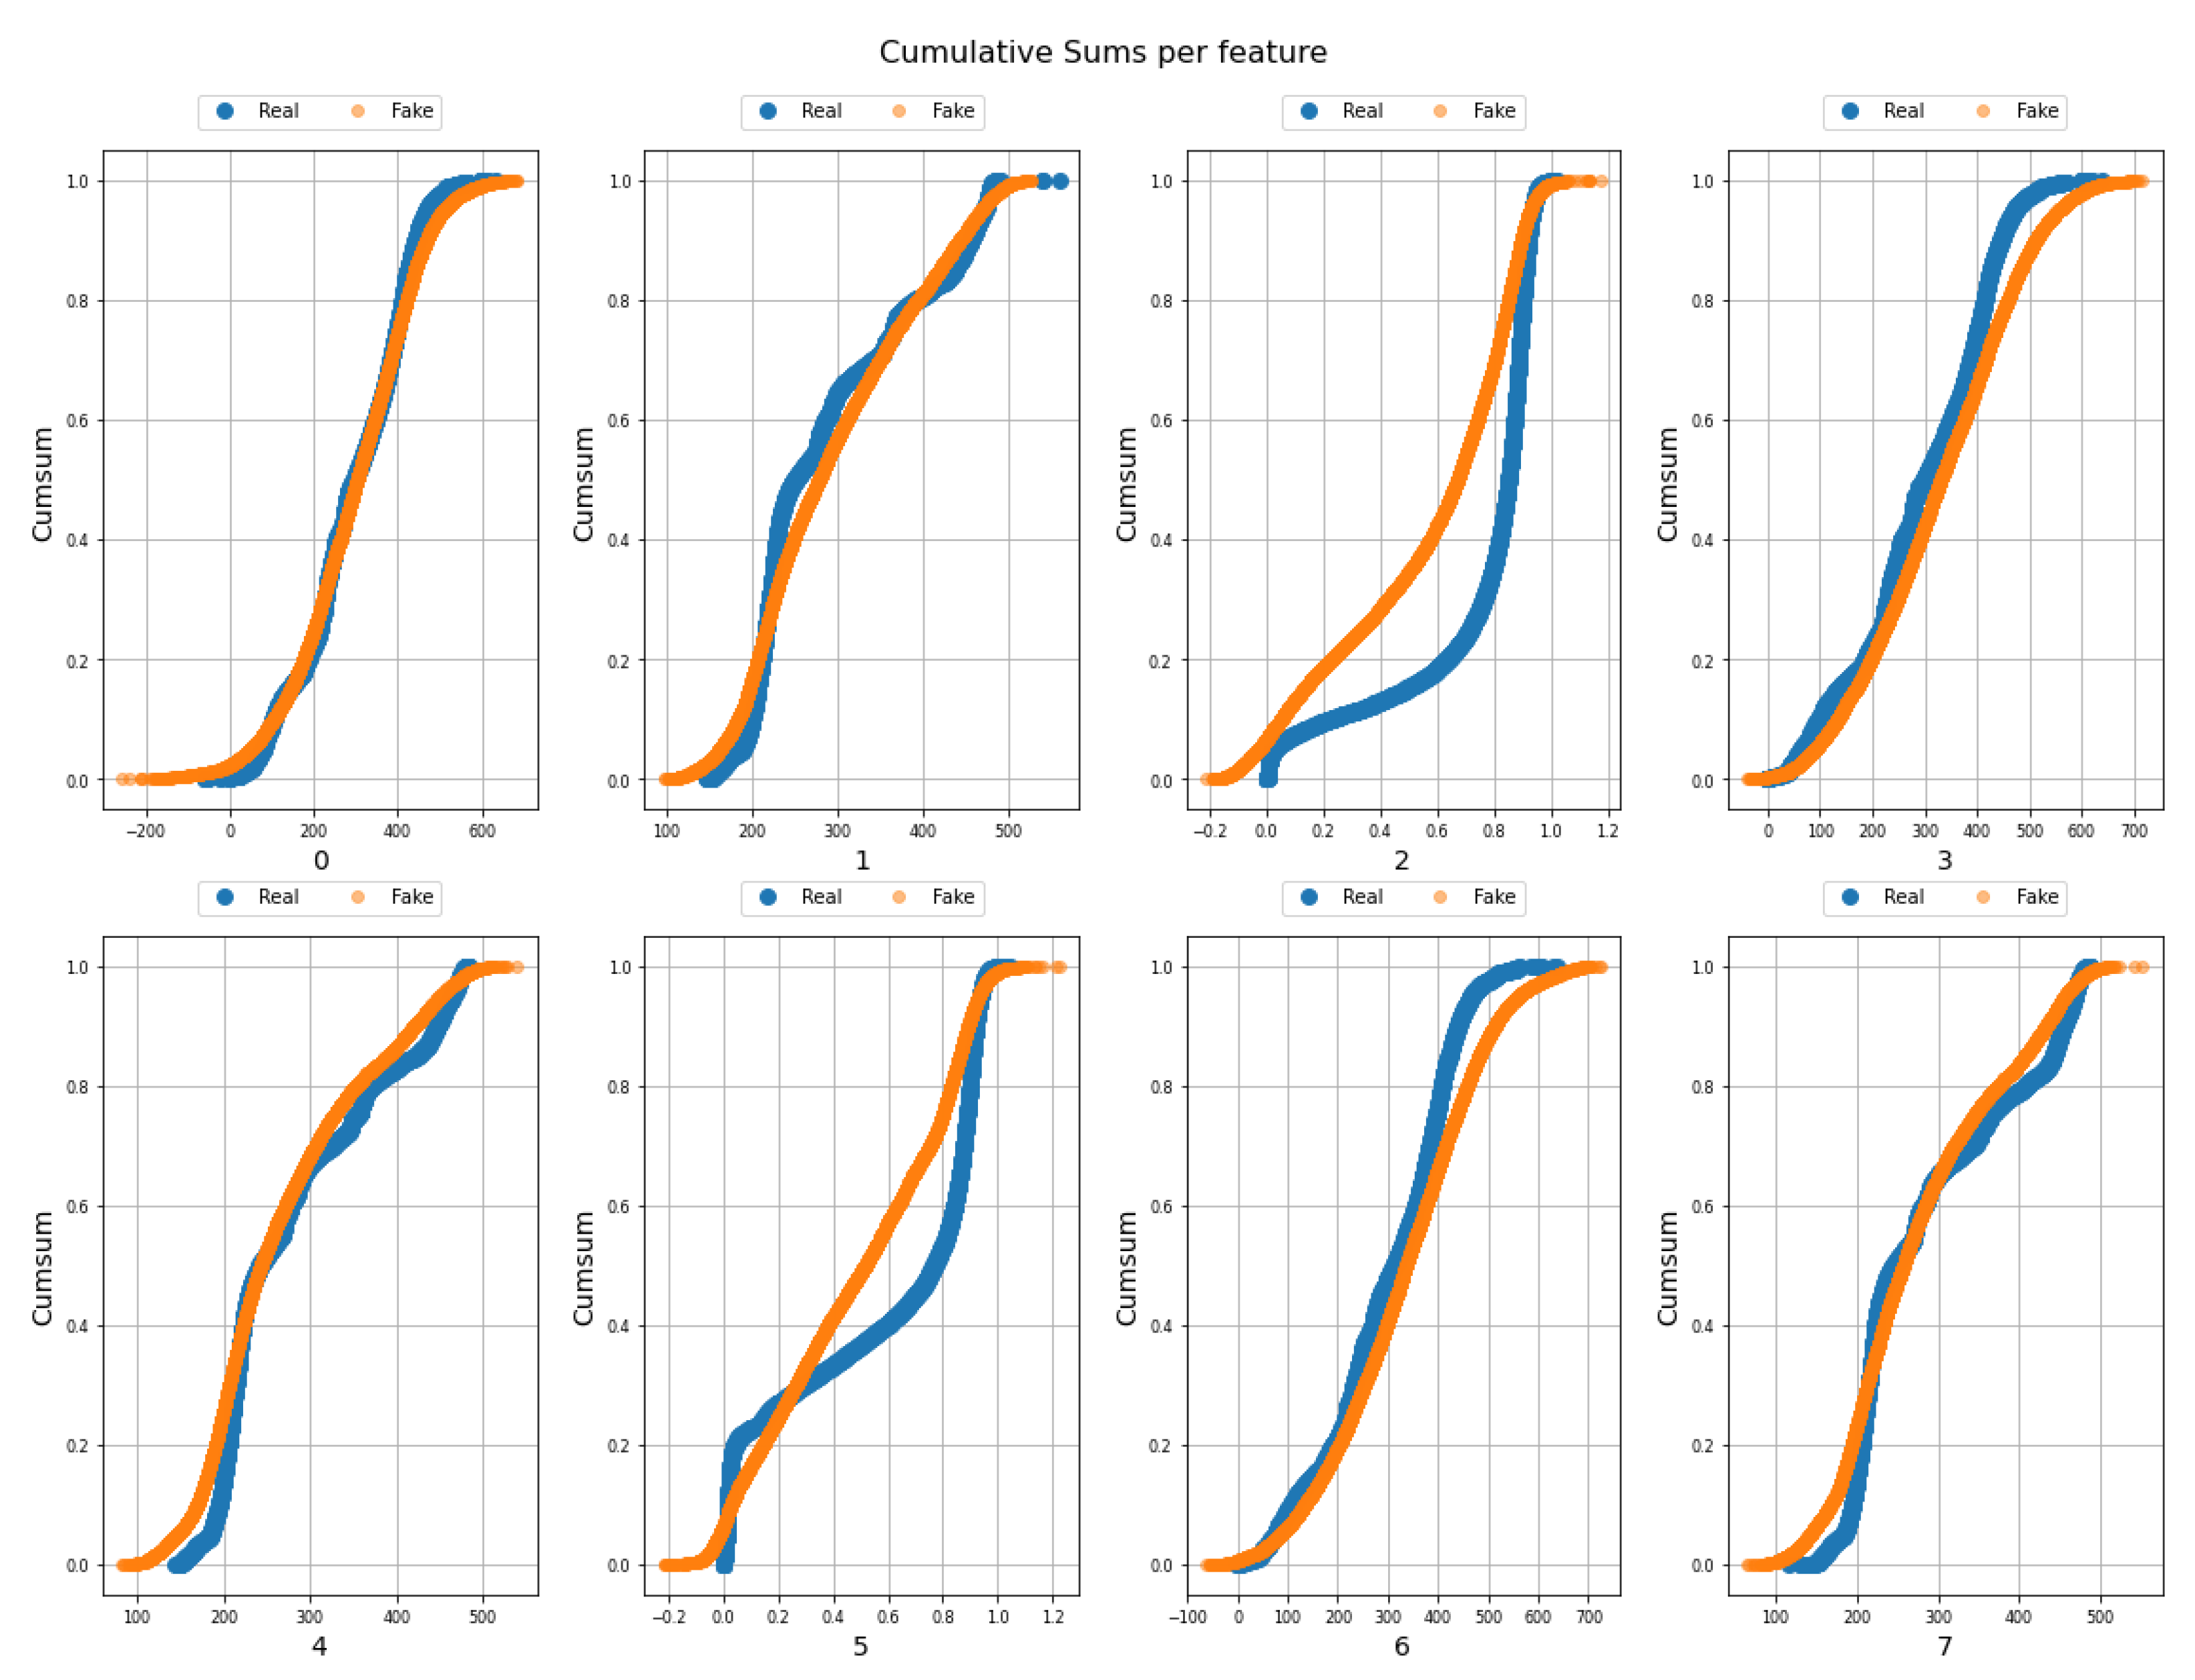
3.3. Synthetic Data Generation
4. Experimental Results
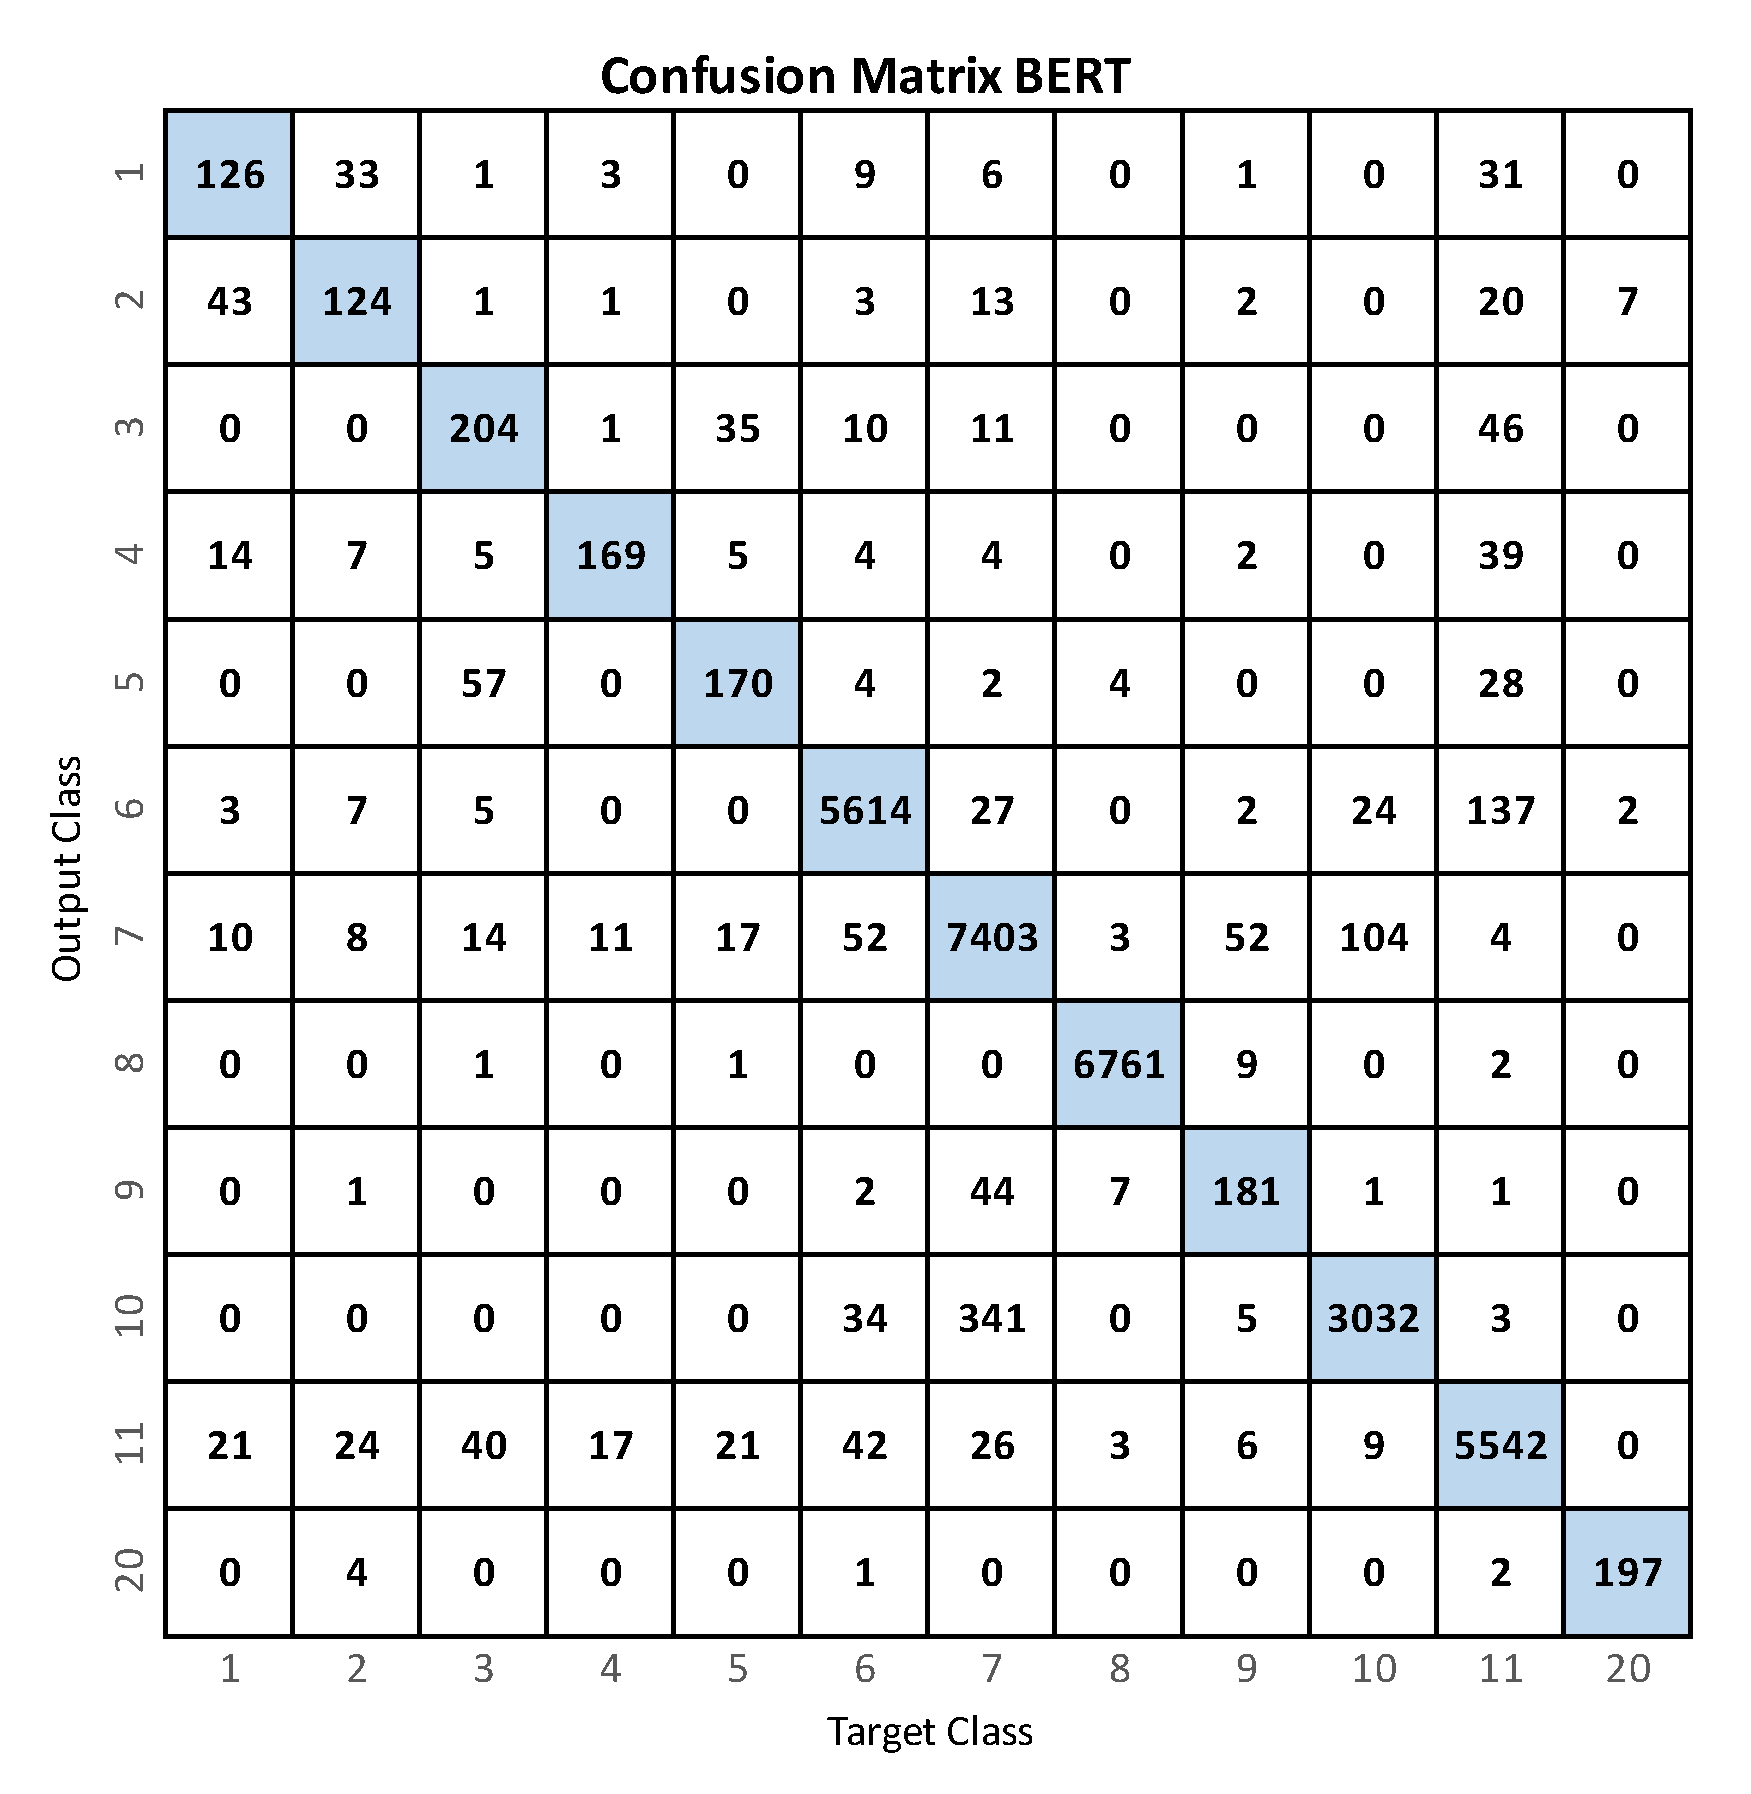
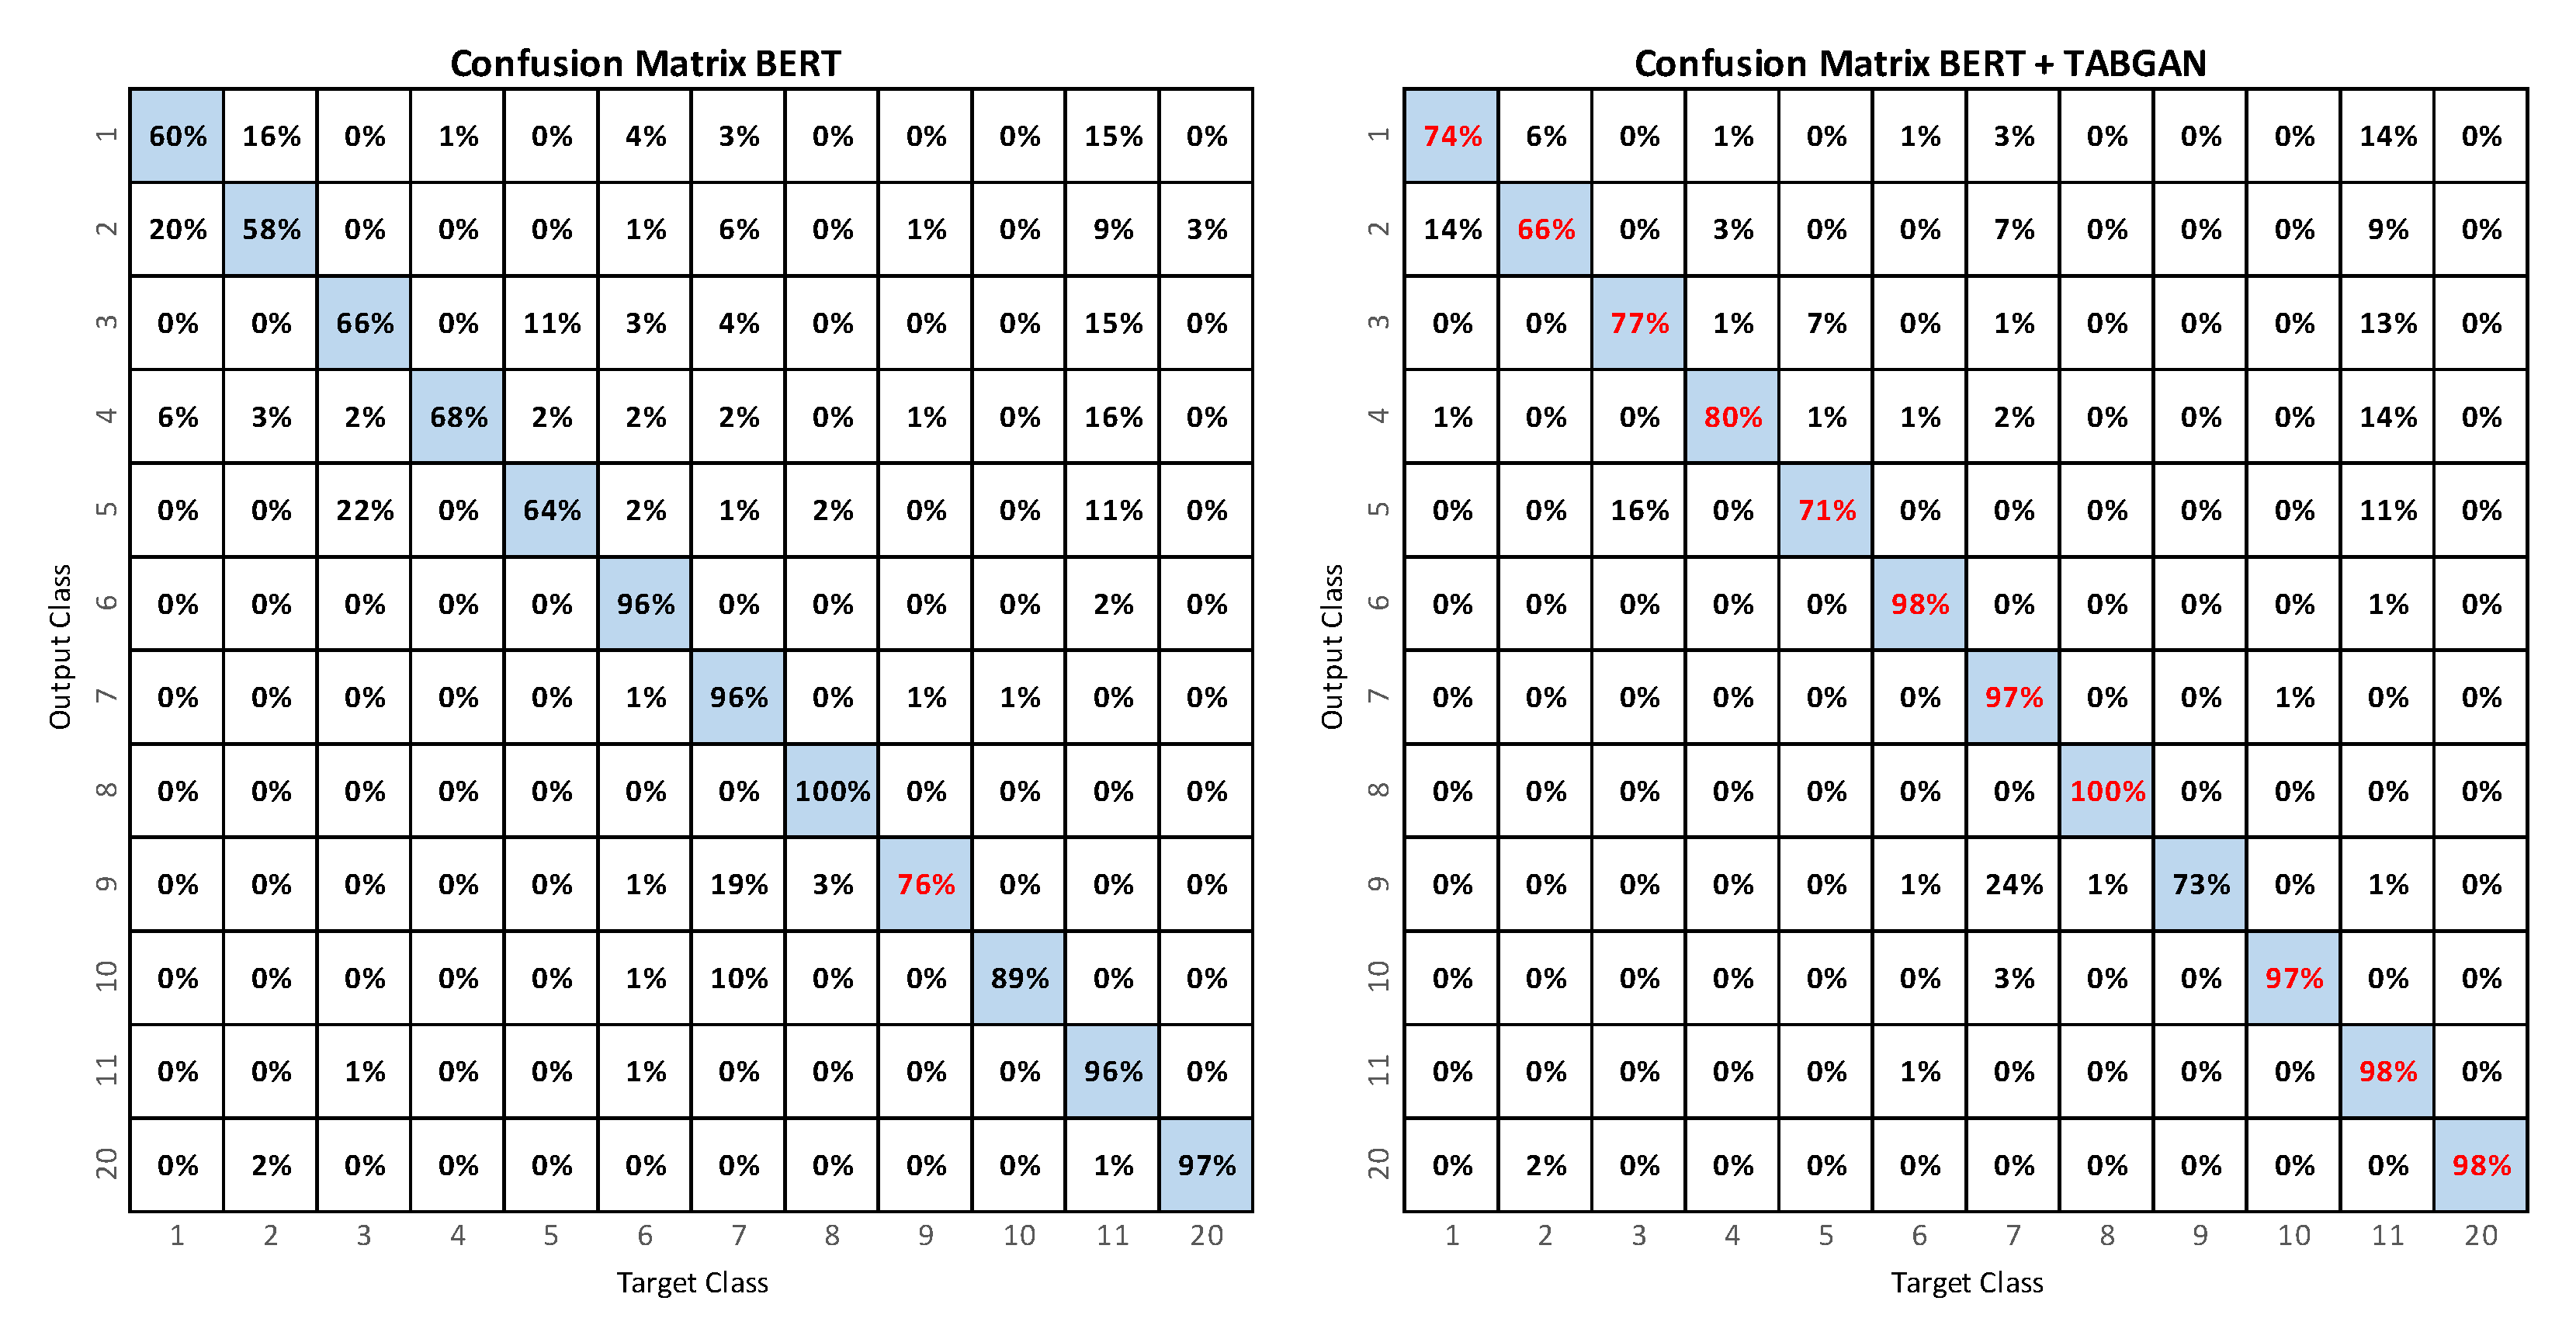
4.1. BERT
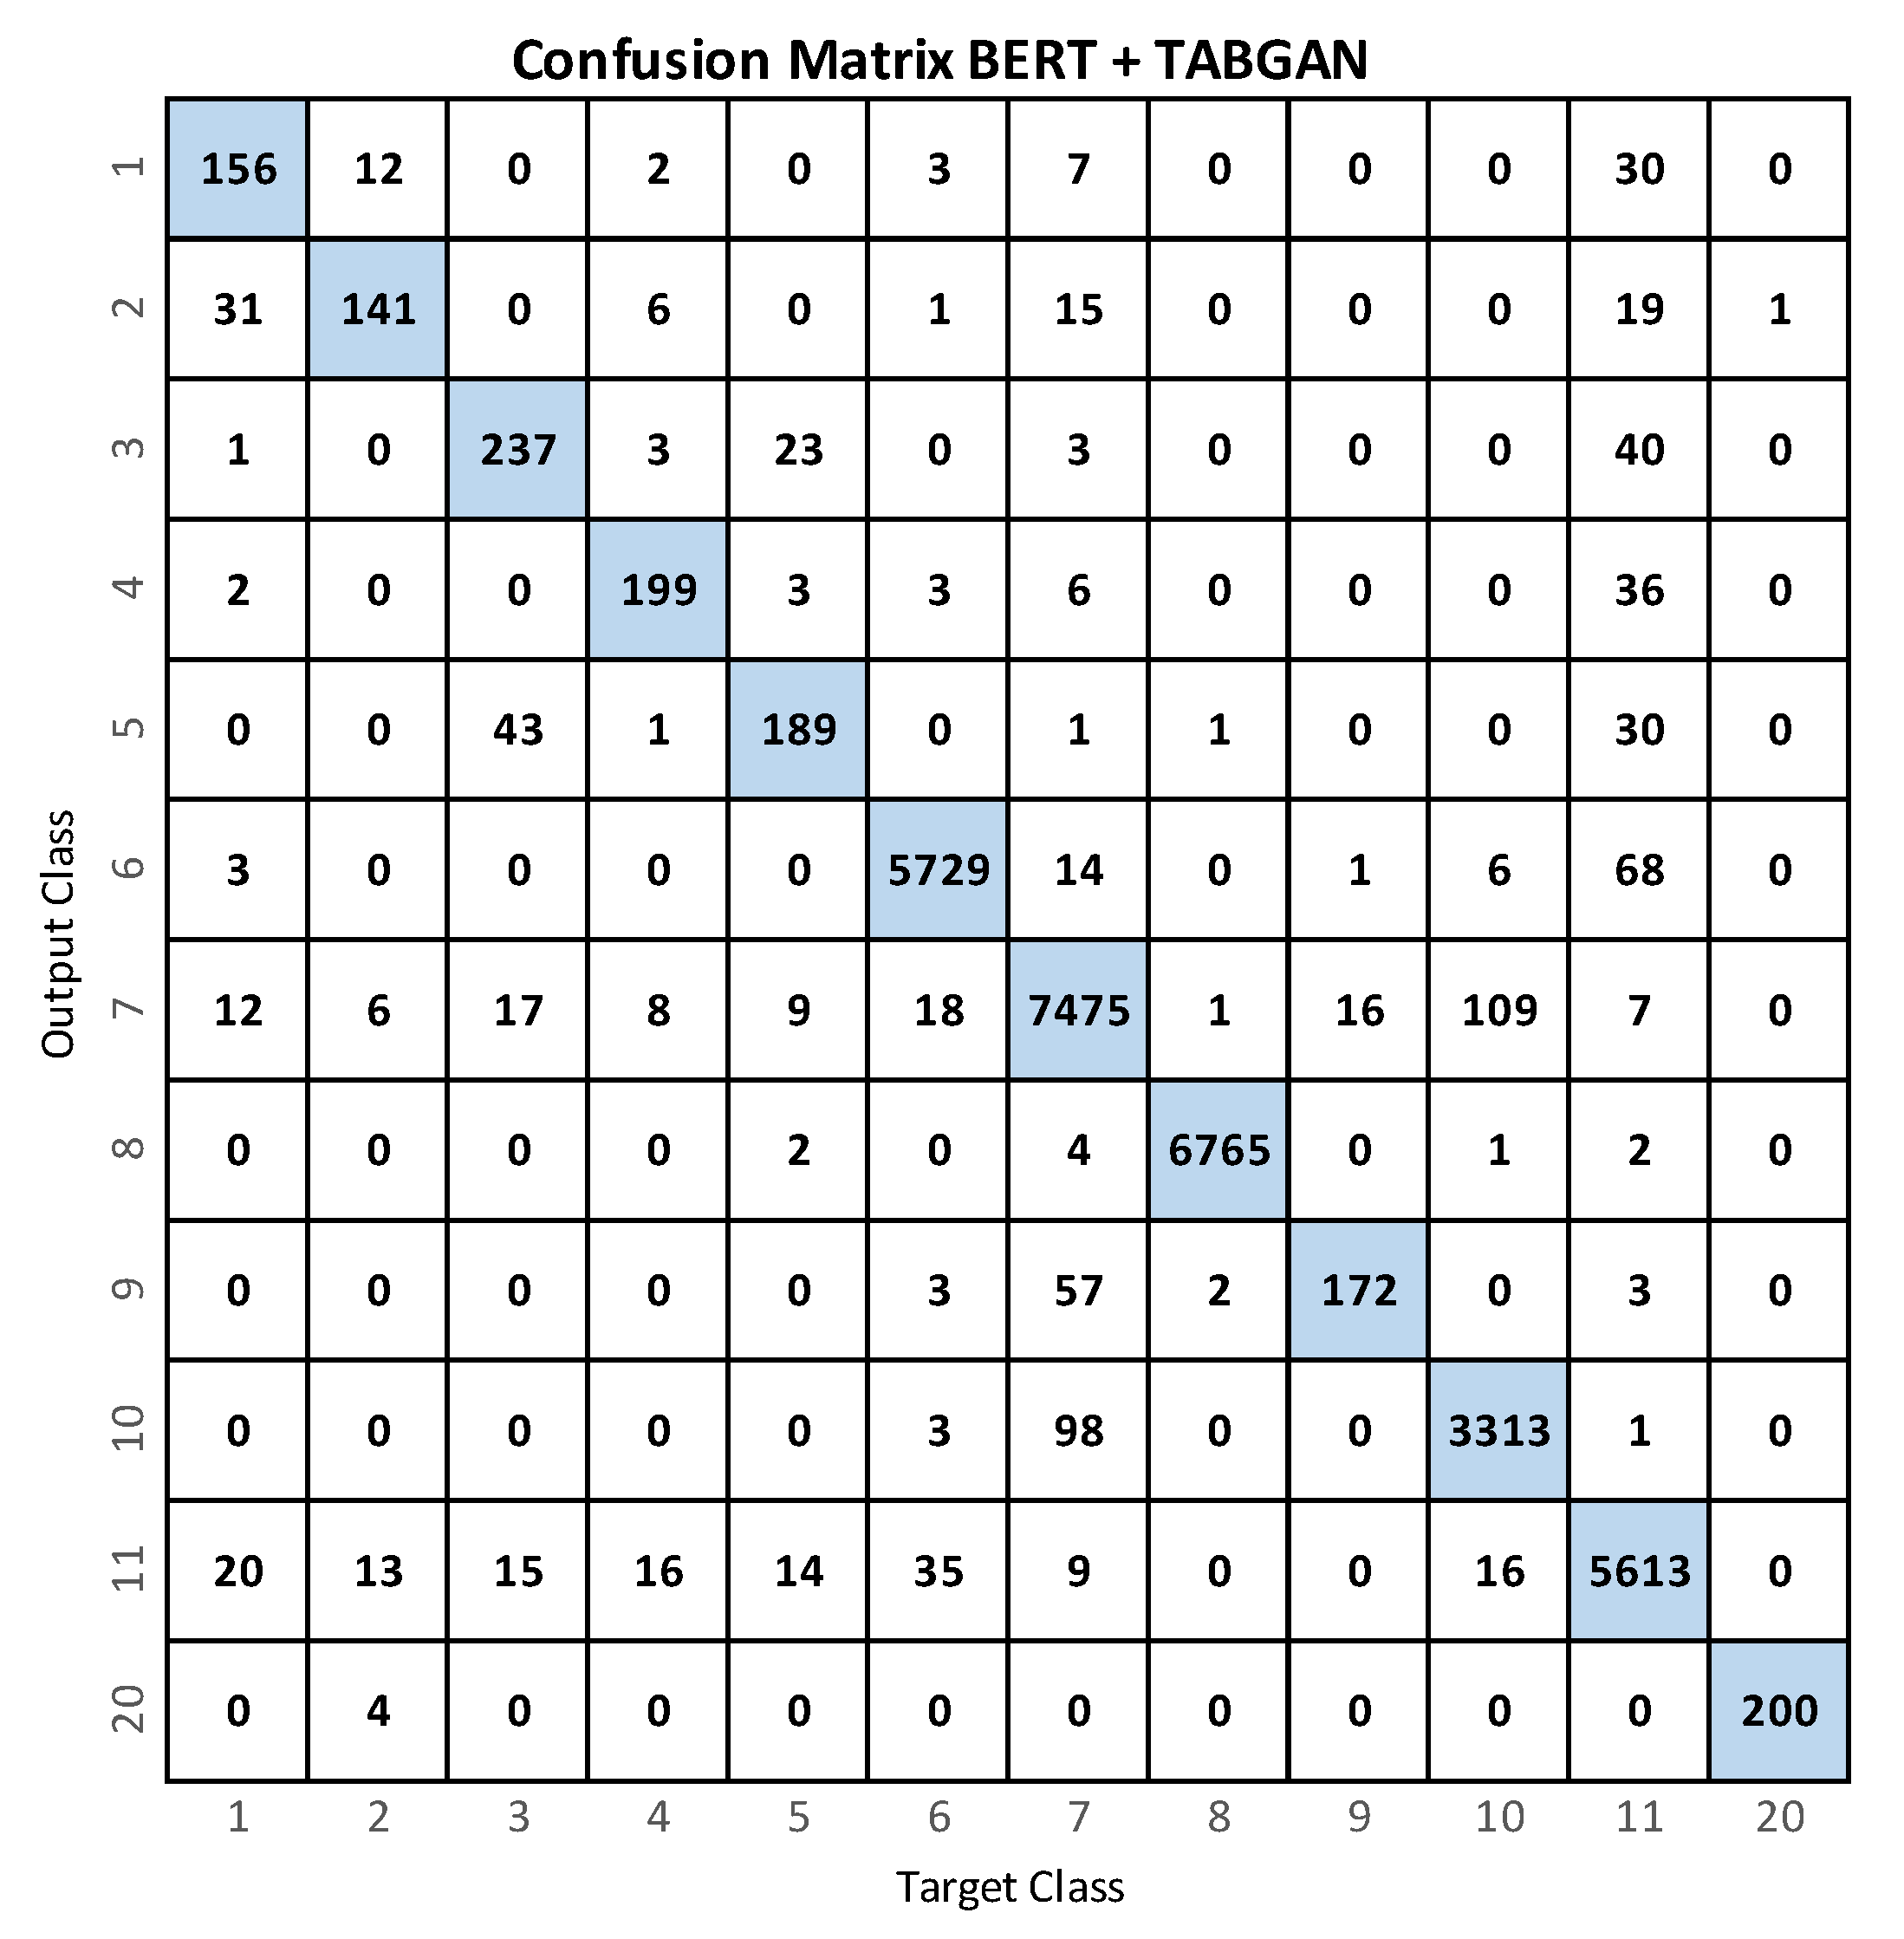
4.2. BERT+TABGAN
5. Conclusions
Author Contributions
Funding
Institutional Review Board Statement
Informed Consent Statement
Data Availability Statement
Conflicts of Interest
References
- Khojasteh, S.B.; Villar, J.R.; Chira, C.; González, V.M.; De la Cal, E. Improving fall detection using an on-wrist wearable accelerometer. Sensors 2018, 18, 1350. [Google Scholar] [CrossRef]
- Liu, Z.; Cao, Y.; Cui, L.; Song, J.; Zhao, G. A benchmark database and baseline evaluation for fall detection based on wearable sensors for the Internet of medical things platform. IEEE Access 2018, 6, 51286–51296. [Google Scholar] [CrossRef]
- Kavya, G.; CT, S.K.; Dhanush, C.; Kruthika, J. Human Fall Detection Using Video Surveillance. ACS J. Sci. Eng. 2021, 1, 1–10. [Google Scholar] [CrossRef]
- Jeong, S.; Kang, S.; Chun, I. Human-skeleton based fall-detection method using LSTM for manufacturing industries. In Proceedings of the 2019 34th IEEE International Technical Conference on Circuits/Systems, Computers and Communications (ITC-CSCC), JeJu, Korea, 23–26 June 2019; pp. 1–4. [Google Scholar]
- Guan, Z.; Li, S.; Cheng, Y.; Man, C.; Mao, W.; Wong, N.; Yu, H. A video-based fall detection network by spatio-temporal joint-point model on edge devices. In Proceedings of the 2021 IEEE Design, Automation & Test in Europe Conference & Exhibition (DATE), Grenoble, France, 1–5 February 2021; pp. 422–427. [Google Scholar]
- Kwolek, B.; Kepski, M. Human fall detection on embedded platform using depth maps and wireless accelerometer. Comput. Methods Programs Biomed. 2014, 117, 489–501. [Google Scholar] [CrossRef]
- Ramirez, H.; Velastin, S.A.; Fabregas, E.; Meza, I.; Makris, D.; Farias, G. Fall detection using human skeleton features. In Proceedings of the 11th International Conference of Pattern Recognition Systems (ICPRS 2021), Online, 15 March 2021; pp. 73–78. [Google Scholar]
- Taufeeque, M.; Koita, S.; Spicher, N.; Deserno, T.M. Multi-camera, multi-person, and real-time fall detection using long short term memory. In Proceedings of the Medical Imaging 2021: Imaging Informatics for Healthcare, Research, and Applications, Orlando, FL, USA, 15–19 February 2021; Volume 11601, pp. 35–42. [Google Scholar]
- Galvão, Y.; Portela, L.; Ferreira, J.; Barros, P.; Fagundes, O.; Fernandes, B. A Framework for Anomaly Identification Applied on Fall Detection. IEEE Access 2021, 9, 77264–77274. [Google Scholar] [CrossRef]
- Kang, Y.K.; Kang, H.Y.; Weon, D.S. Human skeleton keypoints based fall detection using GRU. J. Korea Acad.-Ind. Coop. Soc. 2021, 22, 127–133. [Google Scholar]
- Ramirez, H.; Velastin, S.A.; Aguayo, P.; Fabregas, E.; Farias, G. Human Activity Recognition by Sequences of Skeleton Features. Sensors 2022, 22, 3991. [Google Scholar] [CrossRef] [PubMed]
- Al-Faris, M.; Chiverton, J.; Ndzi, D.; Ahmed, A.I. A review on computer vision-based methods for human action recognition. J. Imaging 2020, 6, 46. [Google Scholar] [CrossRef]
- Dhillon, A.; Verma, G.K. Convolutional neural network: A review of models, methodologies and applications to object detection. Prog. Artif. Intell. 2020, 9, 85–112. [Google Scholar] [CrossRef]
- Yadav, S.K.; Luthra, A.; Tiwari, K.; Pandey, H.M.; Akbar, S.A. ARFDNet: An efficient activity recognition & fall detection system using latent feature pooling. Knowl.-Based Syst. 2022, 239, 107948. [Google Scholar]
- Song, S.; Lan, C.; Xing, J.; Zeng, W.; Liu, J. Spatio-temporal attention-based LSTM networks for 3D action recognition and detection. IEEE Trans. Image Process. 2018, 27, 3459–3471. [Google Scholar] [CrossRef] [PubMed]
- Khan, I.U.; Afzal, S.; Lee, J.W. Human activity recognition via hybrid deep learning based model. Sensors 2022, 22, 323. [Google Scholar] [CrossRef]
- Dai, C.; Liu, X.; Lai, J. Human action recognition using two-stream attention based LSTM networks. Appl. Soft Comput. 2020, 86, 105820. [Google Scholar] [CrossRef]
- Basak, H.; Kundu, R.; Singh, P.K.; Ijaz, M.F.; Woźniak, M.; Sarkar, R. A union of deep learning and swarm-based optimization for 3D human action recognition. Sci. Rep. 2022, 12, 1–17. [Google Scholar]
- Yang, G.; Yang, Y.; Lu, Z.; Yang, J.; Liu, D.; Zhou, C.; Fan, Z. STA-TSN: Spatial-Temporal Attention Temporal Segment Network for action recognition in video. PLoS ONE 2022, 17, e0265115. [Google Scholar] [CrossRef]
- Martínez-Villaseñor, L.; Ponce, H.; Brieva, J.; Moya-Albor, E.; Núñez-Martínez, J.; Peñafort-Asturiano, C. UP-fall detection dataset: A multimodal approach. Sensors 2019, 19, 1988. [Google Scholar] [CrossRef]
- Lucic, M.; Kurach, K.; Michalski, M.; Gelly, S.; Bousquet, O. Are gans created equal? a large-scale study. arXiv 2017, arXiv:1711.10337. [Google Scholar]
- Goodfellow, I.; Pouget-Abadie, J.; Mirza, M.; Xu, B. WardeFarley, D.; Ozair, S.; Courville, A.; Bengio, Y. Generative Adversarial. arXiv 2014, arXiv:1406.2661. [Google Scholar]
- Radford, A.; Metz, L.; Chintala, S. Unsupervised representation learning with deep convolutional generative adversarial networks. arXiv 2015, arXiv:1511.06434. [Google Scholar]
- Fang, H.S.; Xie, S.; Tai, Y.W.; Lu, C. Rmpe: Regional multi-person pose estimation. In Proceedings of the IEEE International Conference on Computer Vision, Venice, Italy, 22–29 October 2017; pp. 2334–2343. [Google Scholar]
- Vaswani, A.; Shazeer, N.; Parmar, N.; Uszkoreit, J.; Jones, L.; Gomez, A.N.; Kaiser, Ł.; Polosukhin, I. Attention is all you need. Adv. Neural Inf. Process. Syst. 2017, 30. [Google Scholar]
- Creswell, A.; White, T.; Dumoulin, V.; Arulkumaran, K.; Sengupta, B.; Bharath, A.A. Generative adversarial networks: An overview. IEEE Signal Process. Mag. 2018, 35, 53–65. [Google Scholar] [CrossRef]
- Viazovetskyi, Y.; Ivashkin, V.; Kashin, E. Stylegan2 distillation for feed-forward image manipulation. In Proceedings of the European Conference on Computer Vision, Glasgow, UK, 23–28 August 2020; Springer: Berlin, Germany, 2020; pp. 170–186. [Google Scholar]
- Xu, L.; Veeramachaneni, K. Synthesizing tabular data using generative adversarial networks. arXiv 2018, arXiv:1811.11264. [Google Scholar]
- Xu, L.; Skoularidou, M.; Cuesta-Infante, A.; Veeramachaneni, K. Modeling tabular data using conditional GAN. arXiv 2019, arXiv:1907.00503. [Google Scholar]
- Ashrapov, I. Tabular GANs for uneven distribution. arXiv 2020, arXiv:2010.00638. [Google Scholar]


| Label | Activity |
|---|---|
| 1 | Falling forward using hands |
| 2 | Falling forward using knees |
| 3 | Falling backward |
| 4 | Falling sideways |
| 5 | Falling sitting in an empty chair |
| 6 | Walking |
| 7 | Standing |
| 8 | Sitting |
| 9 | Picking up an object |
| 10 | Jumping |
| 11 | Laying |
| 12 | Unknown activity |
| Model | Hyperparameters |
|---|---|
| BERT | Epochs = 20 |
| Learning Rate = | |
| Batch size = 16 | |
| Optimizer = AdamW |
| Class | # True | % Dataset | # False | Total | % Dataset |
|---|---|---|---|---|---|
| 1 | 1394 | 0.672 | 17,267 | 18,661 | 6.40 |
| 2 | 1473 | 0.710 | 6731 | 8204 | 2.81 |
| 3 | 1473 | 0.710 | 7533 | 9006 | 3.09 |
| 4 | 1858 | 0.895 | 16,759 | 18,617 | 6.39 |
| 5 | 1560 | 0.752 | 7747 | 9307 | 3.19 |
| 6 | 1863 | 0.898 | 14,784 | 16,647 | 5.71 |
| 7 | 38,570 | 18.588 | 0 | 38,570 | 13.23 |
| 8 | 51,573 | 24.855 | 0 | 51,573 | 17.69 |
| 9 | 45,439 | 21.899 | 0 | 45,439 | 15.58 |
| 10 | 1456 | 0.702 | 13,244 | 14,700 | 5.04 |
| 11 | 22,067 | 10.635 | 0 | 22,067 | 7.57 |
| 12 | 38,771 | 18.685 | 0 | 38,771 | 13.30 |
| Performance of the Proposed Method | |||||||||||||
|---|---|---|---|---|---|---|---|---|---|---|---|---|---|
| Label | 1 | 2 | 3 | 4 | 5 | 6 | 7 | 8 | 9 | 10 | 11 | 12 | Average |
| Accuracy | 99.44 | 99.44 | 99.27 | 99.64 | 99.44 | 98.82 | 97.59 | 99.90 | 99.57 | 98.33 | 98.32 | 99.95 | 99.14 |
| Precision | 58.06 | 59.62 | 62.20 | 83.66 | 68.27 | 97.21 | 93.98 | 99.75 | 69.62 | 95.65 | 94.65 | 95.63 | 81.53 |
| Recall | 60.00 | 57.94 | 66.45 | 67.87 | 64.15 | 96.44 | 96.42 | 99.81 | 76.37 | 88.78 | 96.37 | 96.57 | 80.60 |
| Specificity | 99.71 | 99.73 | 99.60 | 99.89 | 99.74 | 99.36 | 97.98 | 99.93 | 99.74 | 99.50 | 98.77 | 99.97 | 99.49 |
| -Score | 59.02 | 58.77 | 64.25 | 74.94 | 66.15 | 96.83 | 95.18 | 99.78 | 72.84 | 92.09 | 95.50 | 96.10 | 80.95 |
| Support | 210 | 214 | 307 | 249 | 265 | 5821 | 7678 | 6774 | 237 | 3415 | 5751 | 204 | 31,125 |
| Performance of the Proposed Method | |||||||||||||
|---|---|---|---|---|---|---|---|---|---|---|---|---|---|
| Label | 1 | 2 | 3 | 4 | 5 | 6 | 7 | 8 | 9 | 10 | 11 | 12 | Average |
| Accuracy | 99.60 | 99.65 | 99.53 | 99.72 | 99.59 | 99.49 | 98.66 | 99.96 | 99.74 | 99.25 | 98.80 | 99.98 | 99.50 |
| Precision | 69.33 | 80.11 | 75.96 | 84.68 | 78.75 | 98.86 | 97.22 | 99.94 | 91.01 | 96.17 | 95.97 | 99.50 | 88.96 |
| Recall | 74.29 | 65.89 | 77.20 | 79.92 | 71.32 | 98.42 | 97.36 | 99.87 | 72.57 | 97.01 | 97.60 | 98.04 | 85.79 |
| Specificity | 99.78 | 99.89 | 99.76 | 99.88 | 99.83 | 99.74 | 99.09 | 99.98 | 99.94 | 99.52 | 99.97 | 100 | 99.71 |
| -Score | 71.72 | 72.31 | 76.58 | 82.23 | 74.85 | 98.64 | 97.29 | 99.90 | 80.75 | 96.59 | 96.78 | 98.77 | 87.20 |
| Support | 210 | 214 | 307 | 249 | 265 | 5821 | 7678 | 6774 | 237 | 3415 | 5751 | 204 | 31125 |
| Model | RF | SVM | MLP | BERT | BERT |
|---|---|---|---|---|---|
| +GAN | |||||
| in [11] | in [11] | in [11] | Our | Our | |
| Accuracy | 99.91 | 98.60 | 99.28 | 99.14 | 99.50 |
| Precision | 97.73 | 95.60 | 82.71 | 81.53 | 88.96 |
| Recall | 95.60 | 57.40 | 78.97 | 80.60 | 85.79 |
| Specificity | 99.95 | 99.14 | 99.58 | 99.49 | 99.71 |
| -Score | 96.63 | 62.87 | 79.89 | 80.95 | 87.20 |
Disclaimer/Publisher’s Note: The statements, opinions and data contained in all publications are solely those of the individual author(s) and contributor(s) and not of MDPI and/or the editor(s). MDPI and/or the editor(s) disclaim responsibility for any injury to people or property resulting from any ideas, methods, instructions or products referred to in the content. |
© 2023 by the authors. Licensee MDPI, Basel, Switzerland. This article is an open access article distributed under the terms and conditions of the Creative Commons Attribution (CC BY) license (https://creativecommons.org/licenses/by/4.0/).
Share and Cite
Ramirez, H.; Velastin, S.A.; Cuellar, S.; Fabregas, E.; Farias, G. BERT for Activity Recognition Using Sequences of Skeleton Features and Data Augmentation with GAN. Sensors 2023, 23, 1400. https://doi.org/10.3390/s23031400
Ramirez H, Velastin SA, Cuellar S, Fabregas E, Farias G. BERT for Activity Recognition Using Sequences of Skeleton Features and Data Augmentation with GAN. Sensors. 2023; 23(3):1400. https://doi.org/10.3390/s23031400
Chicago/Turabian StyleRamirez, Heilym, Sergio A. Velastin, Sara Cuellar, Ernesto Fabregas, and Gonzalo Farias. 2023. "BERT for Activity Recognition Using Sequences of Skeleton Features and Data Augmentation with GAN" Sensors 23, no. 3: 1400. https://doi.org/10.3390/s23031400
APA StyleRamirez, H., Velastin, S. A., Cuellar, S., Fabregas, E., & Farias, G. (2023). BERT for Activity Recognition Using Sequences of Skeleton Features and Data Augmentation with GAN. Sensors, 23(3), 1400. https://doi.org/10.3390/s23031400