Article

Flat Photonic Crystal Fiber Plasmonic Sensor for Simultaneous Measurement of Temperature and Refractive Index with High Sensitivity

1
School of Information Science and Engineering, University of Jinan, Jinan 250022, China
2
Shandong Provincial Key Laboratory of Network-Based Intelligent Computing, Jinan 250022, China
*
Author to whom correspondence should be addressed.
Sensors 2022, 22(23), 9028; https://doi.org/10.3390/s22239028
Submission received: 2 November 2022 / Revised: 19 November 2022 / Accepted: 20 November 2022 / Published: 22 November 2022
(This article belongs to the Special Issue Sensors Based on Photonic Crystal Fiber)

Abstract

:
A compact temperature-refractive index (RI) flat photonic crystal fiber (PCF) sensor based on surface plasmon resonance (SPR) is presented in this paper. Sensing of temperature and RI takes place in the x- and y- polarization, respectively, to avoid the sensing crossover, eliminating the need for matrix calculation. Simultaneous detection of dual parameters can be implemented by monitoring the loss spectrum of core modes in two polarizations. Compared with the reported multi-function sensors, the designed PCF sensor provides higher sensitivities for both RI and temperature detection. A maximum wavelength sensitivity of −5 nm/°C is achieved in the temperature range of −30–40 °C. An excellent optimal wavelength sensitivity of 17,000 nm/RIU is accomplished in the RI range of 1.32–1.41. The best amplitude sensitivity of RI is up to 354.39 RIU−1. The resolution of RI and temperature sensing is 5.88 × 10⁻⁶ RIU and 0.02 °C, respectively. The highest value of the figure of merit (FOM) is 216.74 RIU−1. In addition, the flat polishing area of the gold layer reduces the manufacturing difficulty. The proposed sensor has the characteristics of high sensitivity, simple structure, good fabrication repeatability, and flexible operation. It has potential in medical diagnosis, chemical inspection, and many other fields.

1. Introduction

Optical fiber sensing technology has great potential for development in bio-chemical detection, environmental monitoring, medical diagnosis, and many more fields [1,2,3,4,5,6] due to its small size, low cost, anti-electromagnetic interference, and structural stability. Photonic Crystal Fiber (PCF) is composed of core and cladding with periodically arranged air holes that control the propagation of light. The flexible geometry arrangement of the PCF enables it to provide desirable characteristics [7]. In addition, the air holes can be selectively filled with materials such as thermo-sensitive liquid and analyte to realize various parameter sensing. Compared with traditional optical fibers, PCF sensors combined with surface plasmon resonance (SPR) have the advantages of real-time detection, flexible design, and high sensitivity. With the development of SPR-PCF sensors, the detection of a single parameter, such as refractive index (RI), temperature, etc., has gradually grown into maturity. A D-shaped PCF-SPR sensor proposed by Meng X et al. [8] shows a double confinement loss (CL) peak and an unchangeable spectrum trough that indicates the extreme stability of the sensor. Siddik A B et al. [9] reported a dual-core PCF temperature sensor. Under the temperature range of 0–60 °C, the sensor shows a flat sensitivity of 2.25 nm/°C.
However, if the detection of multiple parameters is desired, operators need to cascade several single-parameter sensing devices. The complex setup greatly increases the difficulty of operation as well as the manufacturing cost. Therefore, multi-parameter sensors were developed. Many studies have reported possible structures for simultaneous measurement of two or more parameters such as RI, temperature, magnetic field, seawater salinity, strain, voltage, etc. By filling the PCF structure with materials that are sensitive to different parameters in different positions, the simultaneous sensing of multiple parameters can be realized in multiple channels. The D-shaped PCF proposed by Zhang Y et al. [10] realizes simultaneous sensing of the RI and seawater temperature. Calculating the wavelength sensitivity of the RI and temperature, the maximum values of 1228 nm/RIU and −1.06 nm/°C were obtained, respectively. In 2018, Yong et al. [11] proposed a C-type grapefruit micro-structured fiber for the measurement of seawater temperature and salinity, with a maximum response sensitivity of 1.402 nm/‰ and −7.609 nm/°C for salinity and temperature, respectively. The detection of multiple parameters often has the problem of cross-sensitivity, which increases the difficulty of separating multiple signals. The proposed structure above uses the transfer matrix to express metrics such as sensitivity, resolution, etc., of each parameter, which makes the processing of parameters complicated. The D-shaped RI and temperature sensor proposed by Chen A et al. [12] separates the detection of the two parameters in the x- and y-polarizations, respectively, and avoids the crossover of signals. However, the obtained maximum sensitivity is only 3940 nm/RIU and 1.075 nm/°C, respectively. The simple D-shaped coreless fiber sensor based on SPR proposed by Li B et al. [13] can measure the liquid RI and ambient temperature in real-time. The optimal sensitivity reaches 12,530 nm/RIU and −3.465 nm/°C, respectively. The above configuration of structures is comparatively concise. Nevertheless, the acquired sensitivity is unideal. In conclusion, improving the sensing performance of the structure design is required.
In this paper, we propose and illustrate a compact RI-temperature PCF plasmonic sensor. The RI detection channel is designed as a flat surface and coated with a gold layer. The temperature detection channel is coated with a gold layer and filled with toluene to improve the sensitivity of temperature detection. Separated sensing in x- and y-polarization of dual-parameter averts sensitivity crossover. Simultaneous detection is implemented simply by monitoring the polarized guiding light direction. The optimized structure accomplishes the maximum wavelength sensitivity of −5 nm/°C in the temperature range of −30–40 °C. The resonance wavelength of temperature sensing shows great linearity. An excellent optimal wavelength sensitivity of 17,000 nm/RIU is achieved in the RI range of 1.32–1.41. The proposed sensor shows an ideal detecting resolution of 0.02 °C and 5.88 × 10⁻⁶ RIU for temperature and RI, respectively. The best amplitude sensitivity can be up to 354.39 RIU−1. The highest value of the figure of merit (FOM) is 216.74 RIU−1. The fabrication tolerance and manufacturing process of the sensor are also investigated in the paper. Owing to its high sensitivity, flexible operation, and superior performance, the sensor exhibits great potential in environmental monitoring, chemical inspection, and many other fields.

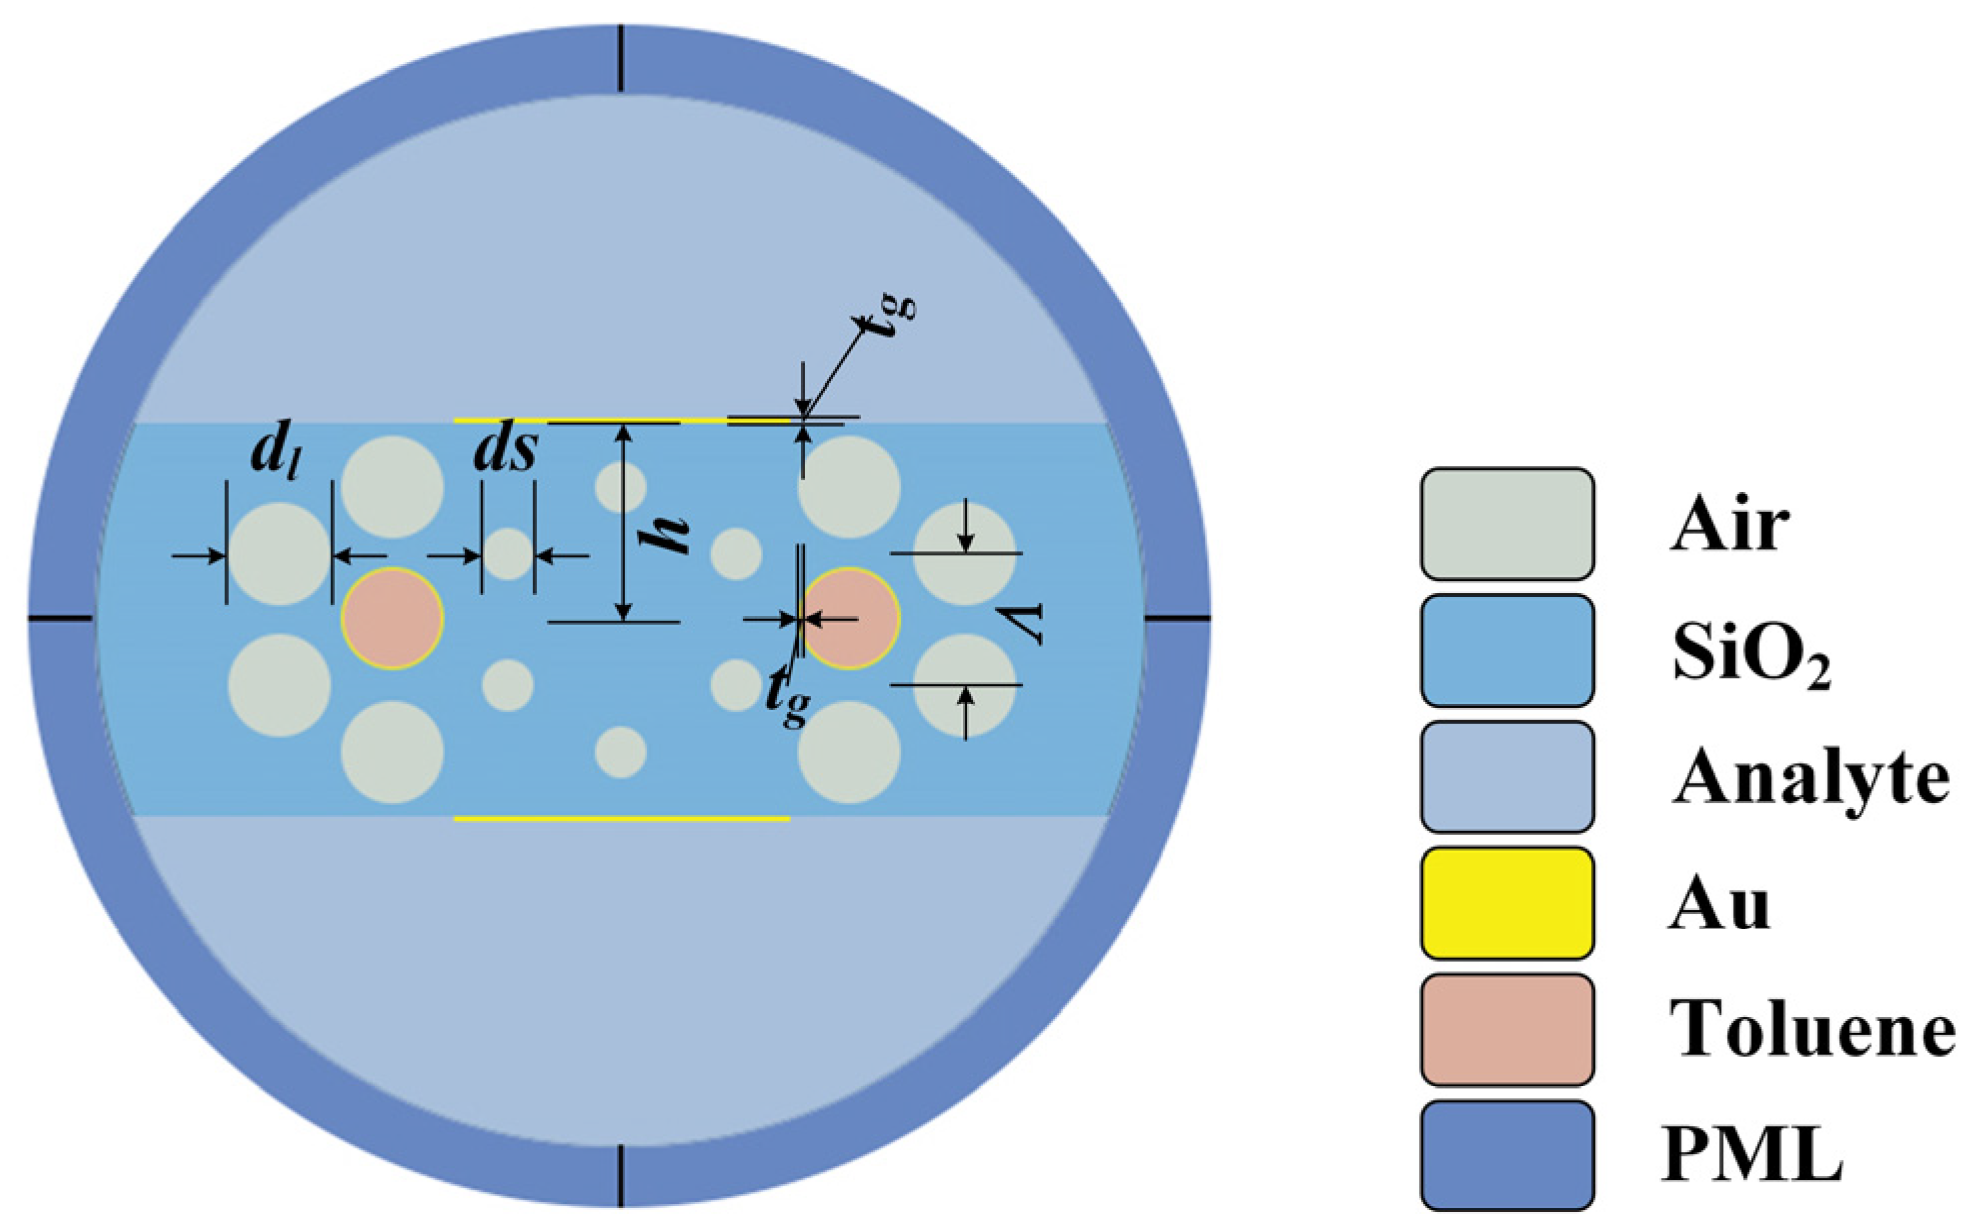
2. Theory and Model Design

A cross-section view of the proposed PCF sensor is shown in Figure 1. The air holes of PCF are composed of a three-layer hexagonal arrangement, and the interval of adjacent air holes is mentioned as pitch, which is denoted by Λ. The air hole in the core area is omitted. Therefore, the light wave propagates in the fiber core according to the principle of total internal reflection (TIR) theory. The diameter ds of the innermost air holes is small, while the diameter dl of the air holes in the outer two layers is relatively large. Ten air holes in the upper and lower parts, respectively, are omitted for the deposition of the metal film and analyte filling. The gold layer is deposited at a distance h from the fiber core to implement the detection of RI. Analyte with variable RI is filled in the upper and lower D-shaped regions in the fiber structure. Analyte liquid is in direct contact with the gold film, achieving the sensitive detection of RI. The thickness of the gold layer is marked as tg. The flat polishing of gold film greatly reduces the difficulty of manufacturing. In addition, the two air holes that are close to the fiber core in the second layer are deposited with a gold film; the thickness is also tg. The temperature-sensitive liquid toluene is filled in the two air holes to accomplish the real-time sensitive detection of the ambient temperature. This structural design enables the sensing of the analyte RI and the ambient temperature to be performed in y-polarization and x-polarization, respectively, avoiding the crossover of the dual parameter detection. The optimized structural parameters are ds = 0.9 μm, dl = 1.6 μm, Λ = 2 μm, h = 3.1 μm, and tg = 50 nm. We analyze the sensing characteristics of the sensor by monitoring incident light wavelength, the step of which is set as 5 nm. Theoretical simulation of the proposed structure is implemented by the finite element method (FEM). In order to make the unwanted modes leak from the fiber cladding and further diminish the leakage loss, a 1-μm-thick Perfect Matching Layer (PML) is used outside the PCF as an absorbing boundary condition. In addition, the scattering boundary condition is configured in order to better replicate the external environment. Free triangular mesh is used to divide the proposed sensor structure. The model is divided into 27,878 mesh elements in total, with 202,427 degrees of freedom.
Figure 2 shows the experimental setup of the microsensor. A broadband light source (BBS) emits a light signal in the wavelength range of 500–1500 nm. The output signal passes through the polarizer controller. A polarized light signal is then transmitted to the designed sensor through a single-mode fiber (SMF). Part of the light energy is lost in the interaction with the analyte. The splicing method can be employed to couple the proposed PCF with SMF. Filling and removal of the analyte can be accomplished using a microinjecting pump. The remaining optical signal is transmitted into another SMF, which is coupled to the optical spectrum analyzer (OSA). The spectrum is recorded and presented by the OSA.
The material RI of the sensor component varies with different temperatures, causing a removal in the phase matching conditions. The resonance wavelength changes between the RI of the core-guided mode and the SPP mode. This variation is reflected in the absorption spectrum. By observing the loss spectrum, sensitive temperature and RI sensing are implemented. The RI of the PCF background material fused silica can be derived from Sellmeier’s Equation [14],
n λ = A + B ( 1 C / λ 2 ) + D ( 1 E / λ 2 )
where λ is the wavelength of the current operating light in a vacuum environment. A = 1.31552 + 0.690754 × 10⁻⁵ T, B = 0.788404 + 0.235835 × 10⁻⁴ T, C = 0.0110199 + 0.584758 × 10⁻⁶ T, D = 0.91316 + 0.548368 × 10⁻⁶, and E = 100.
The free electron gas model of the Drude model is used to describe the movement law of electrons inside of the metal, and the complex dielectric constant of gold is computed as [15]:
ε ω = ε 1 + i ε 2 = ε ω p 2 ω ω + i ω c
where ε = 9.75 is the dielectric constant of Au at infinite frequency, ω p = 1.36 × 10 16 is the plasma frequency of gold in units of rad/s, and ω c = 1.45 × 10 14 is the collision frequency at T 0 = 298.15   K [16]. The optical properties of metal are determined by plasma frequency [17] and collision frequency [18,19].
Considering the effect of temperature change on the thickness of the metal layer, Equation (3) is introduced [20]:
t g = t g 0 1 + γ ( T T 0 )
where tg0 is the thickness of the gold film at room temperature T 0 = 298.15 K . γ′ is the corrected thermal expansion coefficient and is derived from:
γ = γ 1 + μ 1 μ
where the linear expansion coefficient γ = 1.42 × 10⁻⁵ K−1, μ = 0.42 is the Poisson’s number of the film material. γ is replaced by γ′, for the expansion of the gold layer is only in the normal direction.
Liquid toluene is chosen as the temperature detection material for its large thermo-optical coefficient and is selectively filled into the air holes in the second layer that are close to the fiber core. RI of the liquid toluene n T o l u e n e can be expressed as [21]:
n T o l u e n e = n T o l u e n e T 0 = 20 ° C + α T o l u e n e × ( T T 0 )
where the thermal-optical coefficient of the RI for toluene α T o l u e n e = 5.273 × 10 4 [22]. The RI of toluene at T0 = 20 °C can be written as [23]:
n T o l u e n e = 1.474775 + 6990.31 / λ 2 + 2.1776 × 10 8 / λ 4
The CL of the core mode is determined to analyze the sensing performance, which strongly relates to the imaginary part of RI. CL can be calculated as follows [24]:
α loss = 8.686 × 2 π λ Im n eff × 10 4 dB / cm
where Im n eff refers to the imaginary part of mode RI. By analyzing the dependence of RI and mode CL, the transmission mechanism of the designed PCF-SPR sensor can be revealed.

3. Results and Discussion
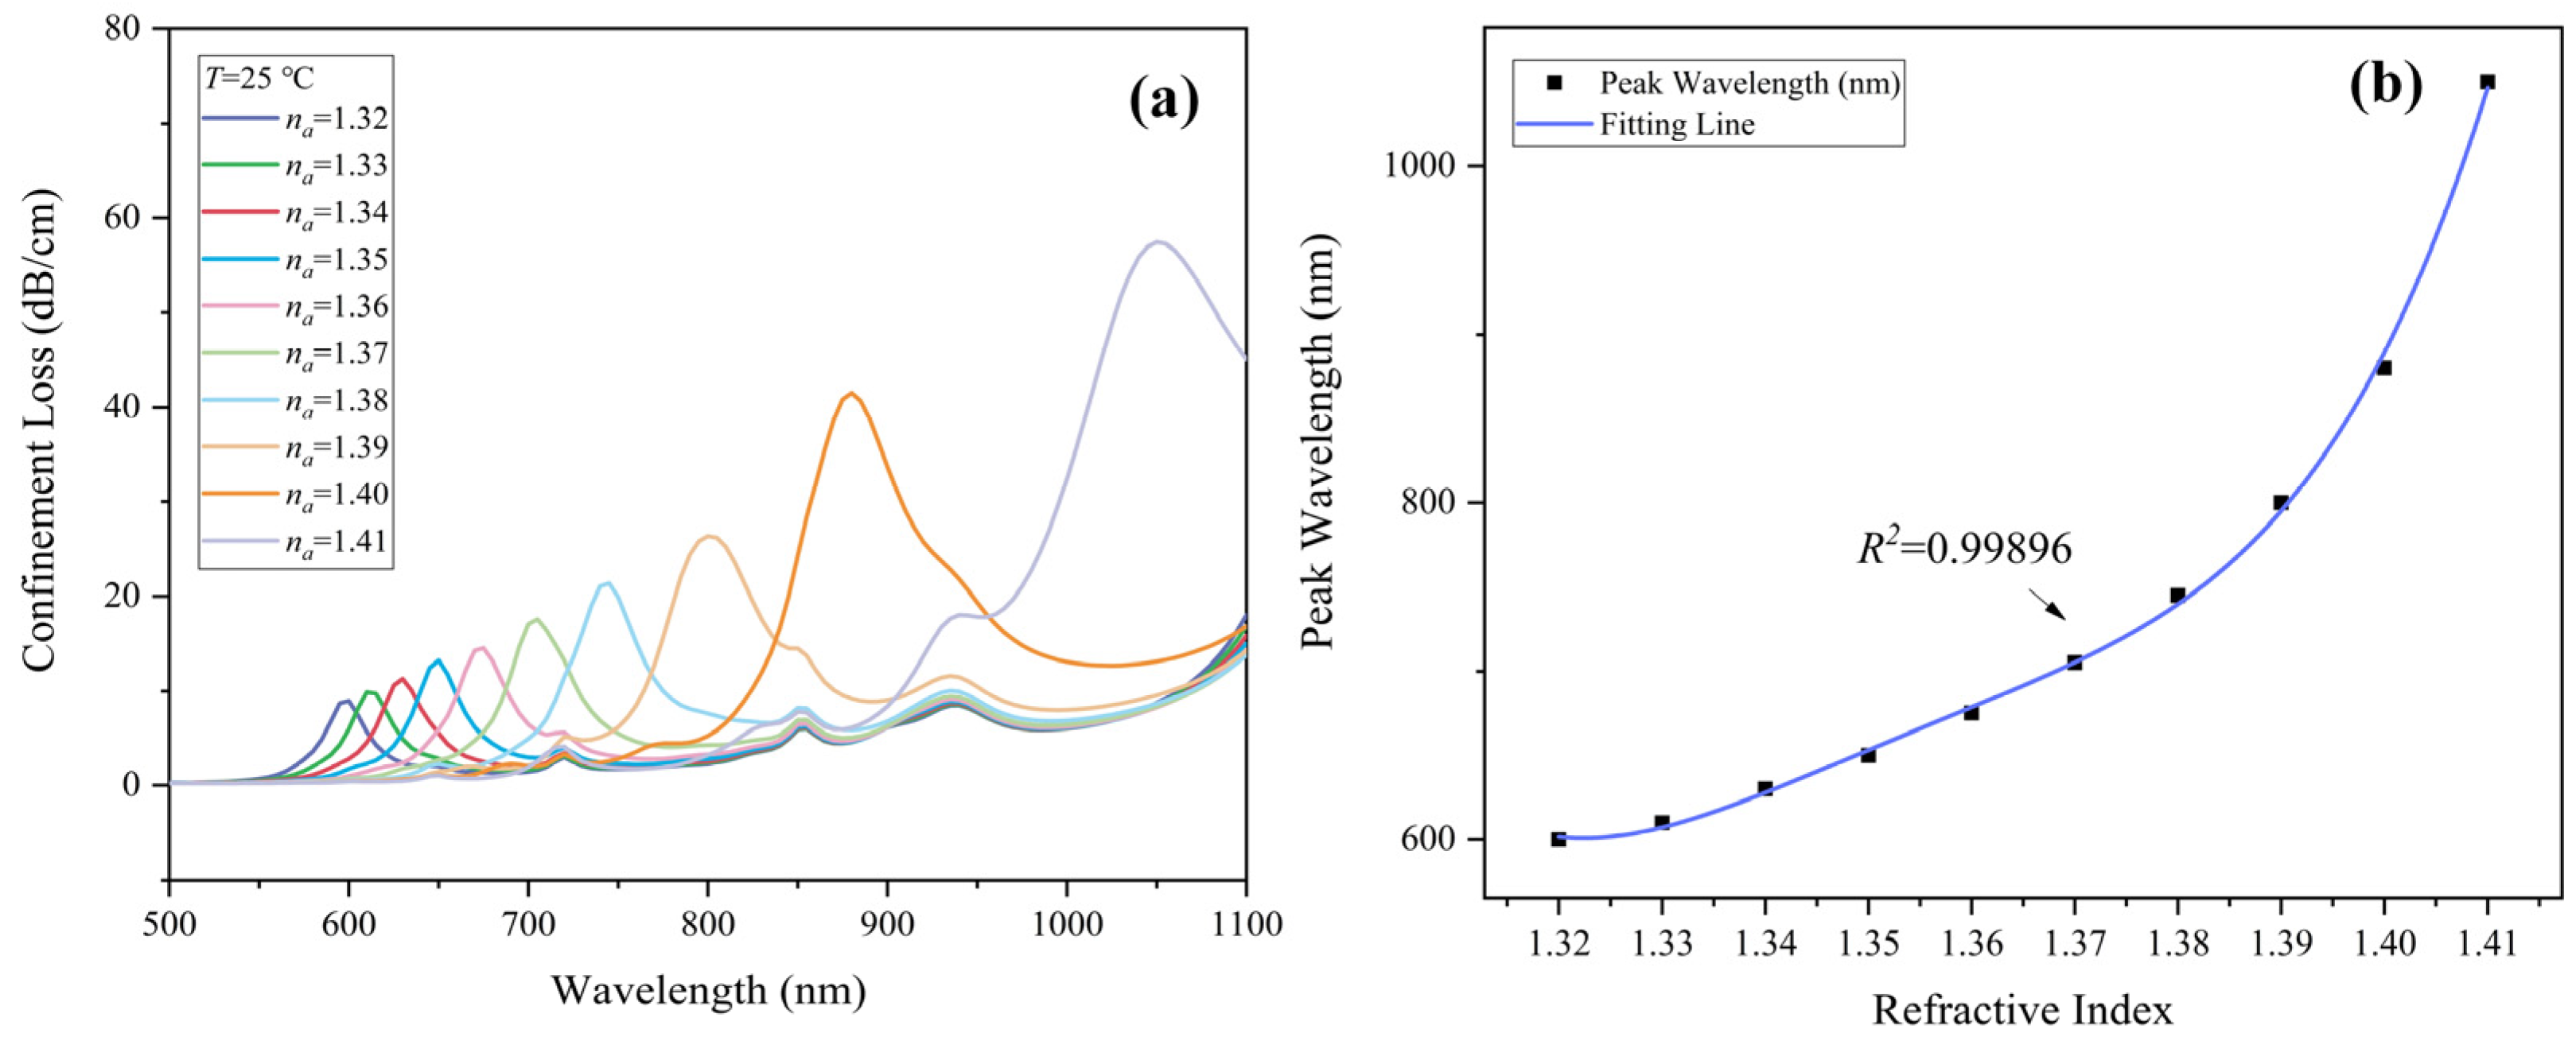
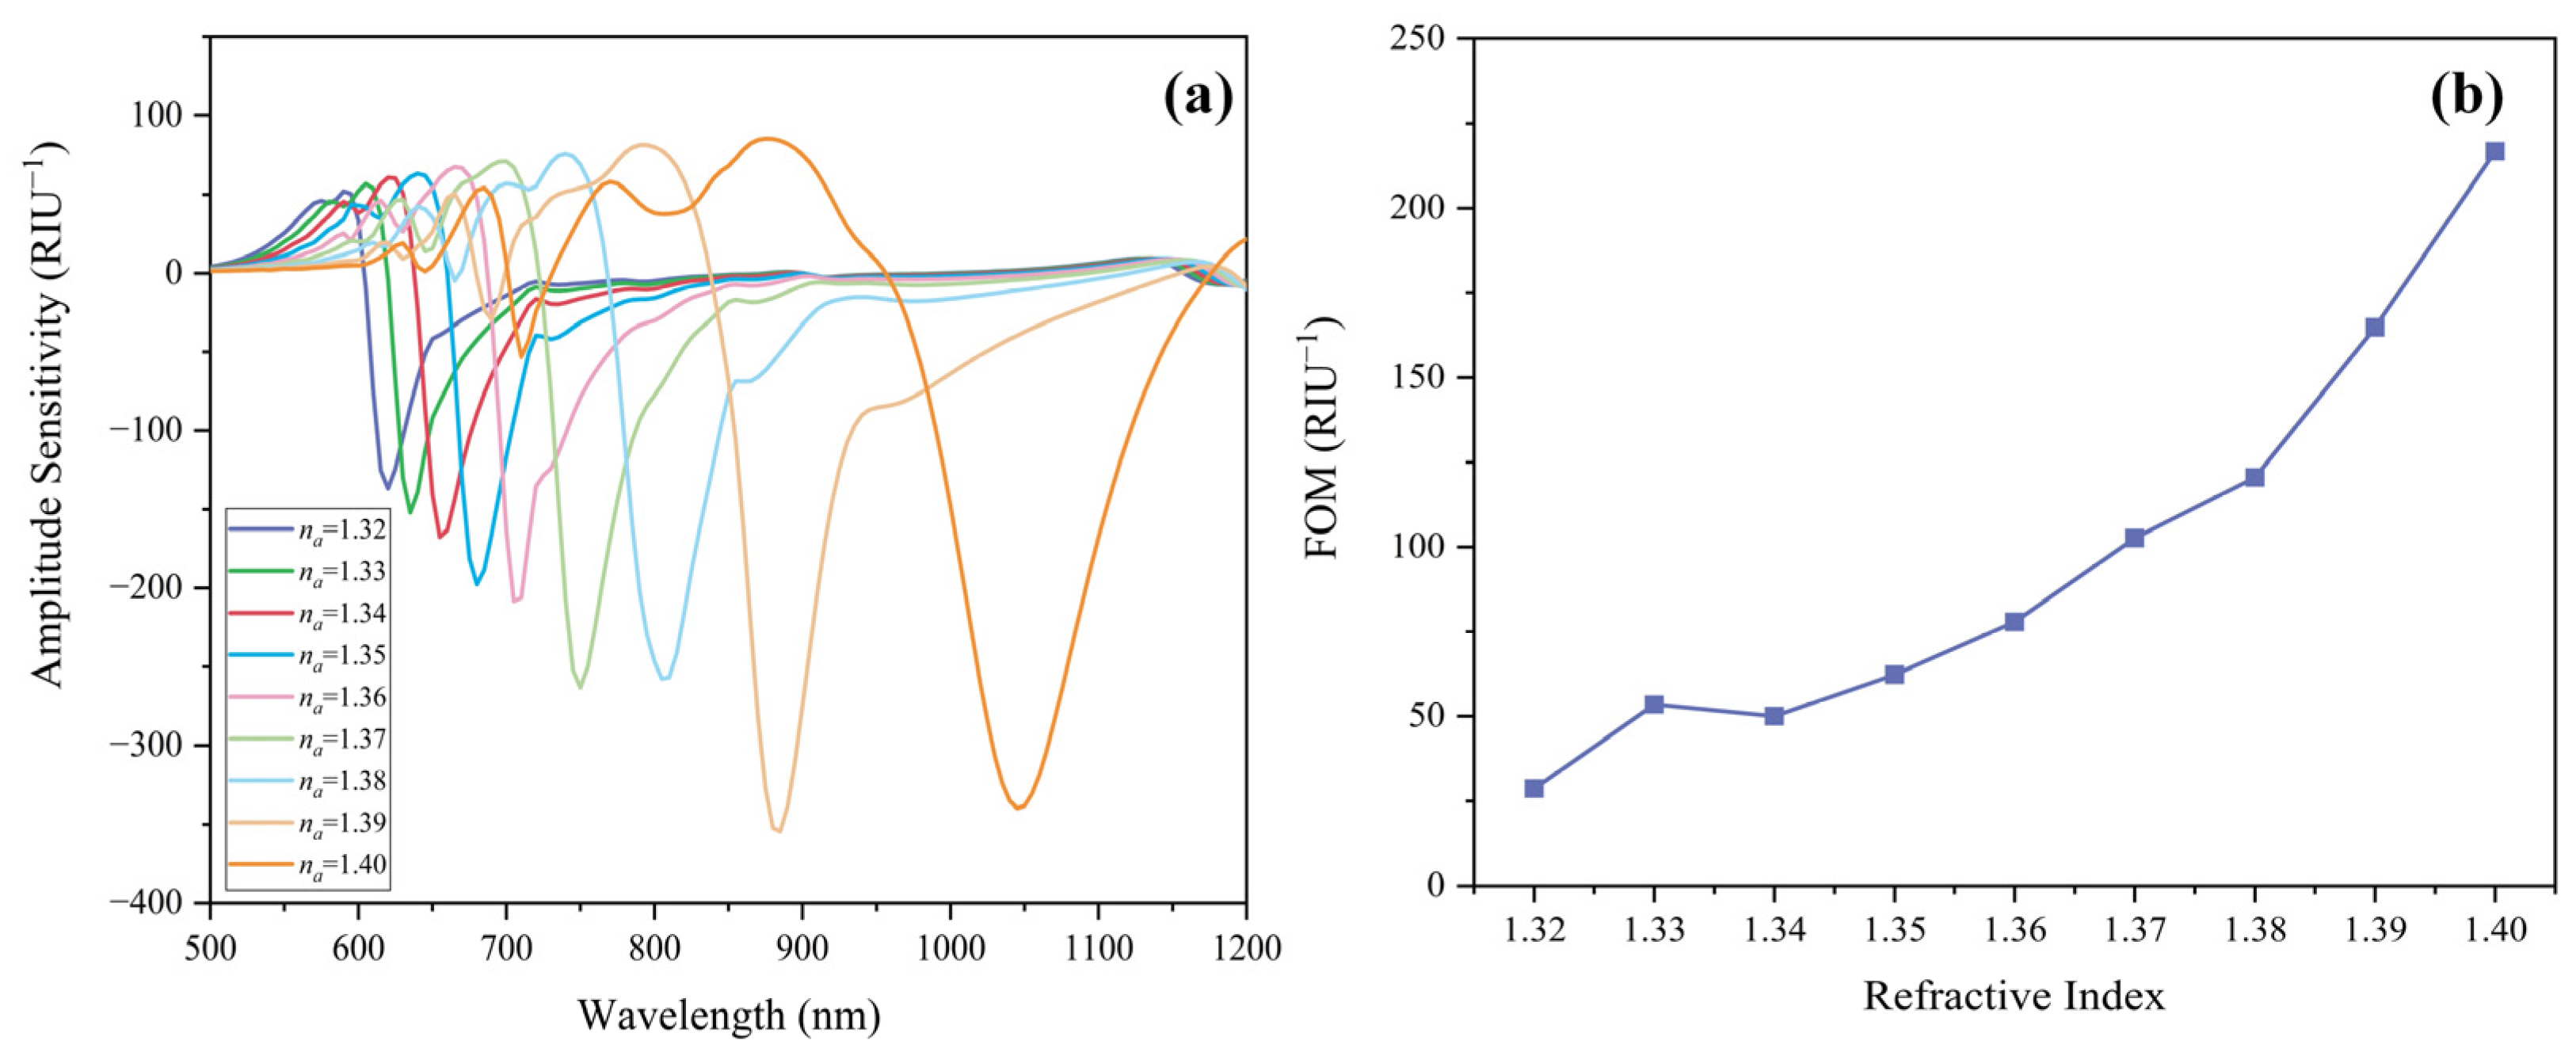
Figure 3a,b represent the dispersion relationship of core modes in y- and x-polarization with SPP modes. The solid black line is the CL of the mode propagating in the core, the blue dotted line in Figure 3a,b is the real part of the core mode RI in y- and x-polarization, respectively, and the red dotted line is the real part of the SPP mode RI. It can be seen from Figure 3 that when the RI of the core mode and the SPP mode is equal, the SPR is excited, and a peak appears in the CL spectrum. Inset (i) is the electric field distribution and direction when the core mode is well confined in the core and the CL is relatively low. Inset (ii) is the electric field distribution and direction of the SPP mode in the two detecting channels. As shown in inset (iii), when SPR occurs, the energy of the core mode is transferred to the SPP mode at the resonance wavelength. When the analyte RI or the ambient temperature changes, the position of the resonance wavelength shifts accordingly. Sensitive detecting of the dual parameter can be achieved by observing the change in resonance wavelength. As is illustrated in Figure 3, under RI = 1.36, T = 20 °C, in y-polarization and x-polarization, the core mode and the SPP mode excite SPR at the wavelength of 675 nm and 1245 nm, respectively.

3.1. RI Sensing

The peaks of the CL in y-polarization are used to probe the RI change of the analyte. By observing the position of the CL spectrum peak, the analyte RI can be determined accordingly. In Figure 4a, as the analyte RI increases, the position of the CL attenuation peak shifts to a larger wavelength, indicating a red-shift. In order to evaluate the sensitivity of the reported sensor, the wavelength interrogation method is introduced. Wavelength sensitivity is expressed as [25]:
S λ n a , λ = Δ λ peak Δ n a nm / RIU
where Δ λ peak refers to the shift of peak wavelength under adjacent analyte RIs. The variant of analyte RI is denoted by Δ n a . At T = 25 °C, the sensor achieved an optimal wavelength sensitivity of 17,000 nm/RIU when the analyte RI varies from 1.40 to 1.41, which is superior to the prior results among sensors in this category. Furthermore, when the analyte RI changes from 1.32 to 1.40 in steps of 0.01, SPR occurred at 600, 610, 630, 650, 675, 705, 745, 800, and 880 nm, respectively, corresponding to sensitivities of 1000, 2000, 2000, 2500, 3000, 4000, 5500, and 8000 nm/RIU. As shown in Figure 4b, taking the phase matching (resonance) points of core mode and SPP mode, polynomial fitting gives the extremely high fitting coefficient R2 of 0.99896.
Resolution describes the minimum indices change that a sensor can resolve. The resolution of RI is defined as [26]:
R RI n a , λ = Δ n a × Δ λ min / Δ λ peak RIU
where Δ n a is the change in the adjacent analyte RI, Δ λ min represents the smallest spectrum resolution, which is usually set as 0.1 nm, Δ λ peak refers to the shift wavelength of the resonance peak. According to Equation (9), the resolution is 5.88 × 10⁻⁶ RIU when analyte RI alters from 1.40 to 1.41.
Similarly, the amplitude sensitivities of the flat PCF sensor for na varies from 1.32 to 1.40 are calculated, and the results are plotted and depicted in Figure 5a. Amplitude sensitivity can be obtained by [27]:
S A RIU 1 = 1 α λ , n a α λ , n a n a
where α λ , n a indicates the mode CL, α λ , n a refers to the difference of CL between the adjacent analyte RI. Amplitude sensitivity reaches a maximum value of 354.39 RIU−1 at 885 nm when RI increases from 1.39 to 1.40. When the analyte RI changes from 1.32 to 1.41 in steps of 0.01, the corresponding amplitude sensitivity is 136.67, 152.05, 140.25, 197.70, 208.32, 263.07, 257.38, 354.39, and 339.80 RIU−1, respectively.
Another important index FOM is calculated in our work. FOM indicates the sharpness of the CL peak and evaluates the detecting accuracy. FOM is defined as [28]:
FOM RIU 1 = S λ n a , λ FWHM nm
where S λ n a , λ is the wavelength sensitivity. FWHM nm denotes the full width at half maxima. FOM combines FWHM and signal-to-noise ratio (SNR). For higher sensitivity, the FOM is required to be as large as possible. In Figure 5b, an ideal FOM of 216.74 RIU−1 is obtained at analyte RI = 1.40.

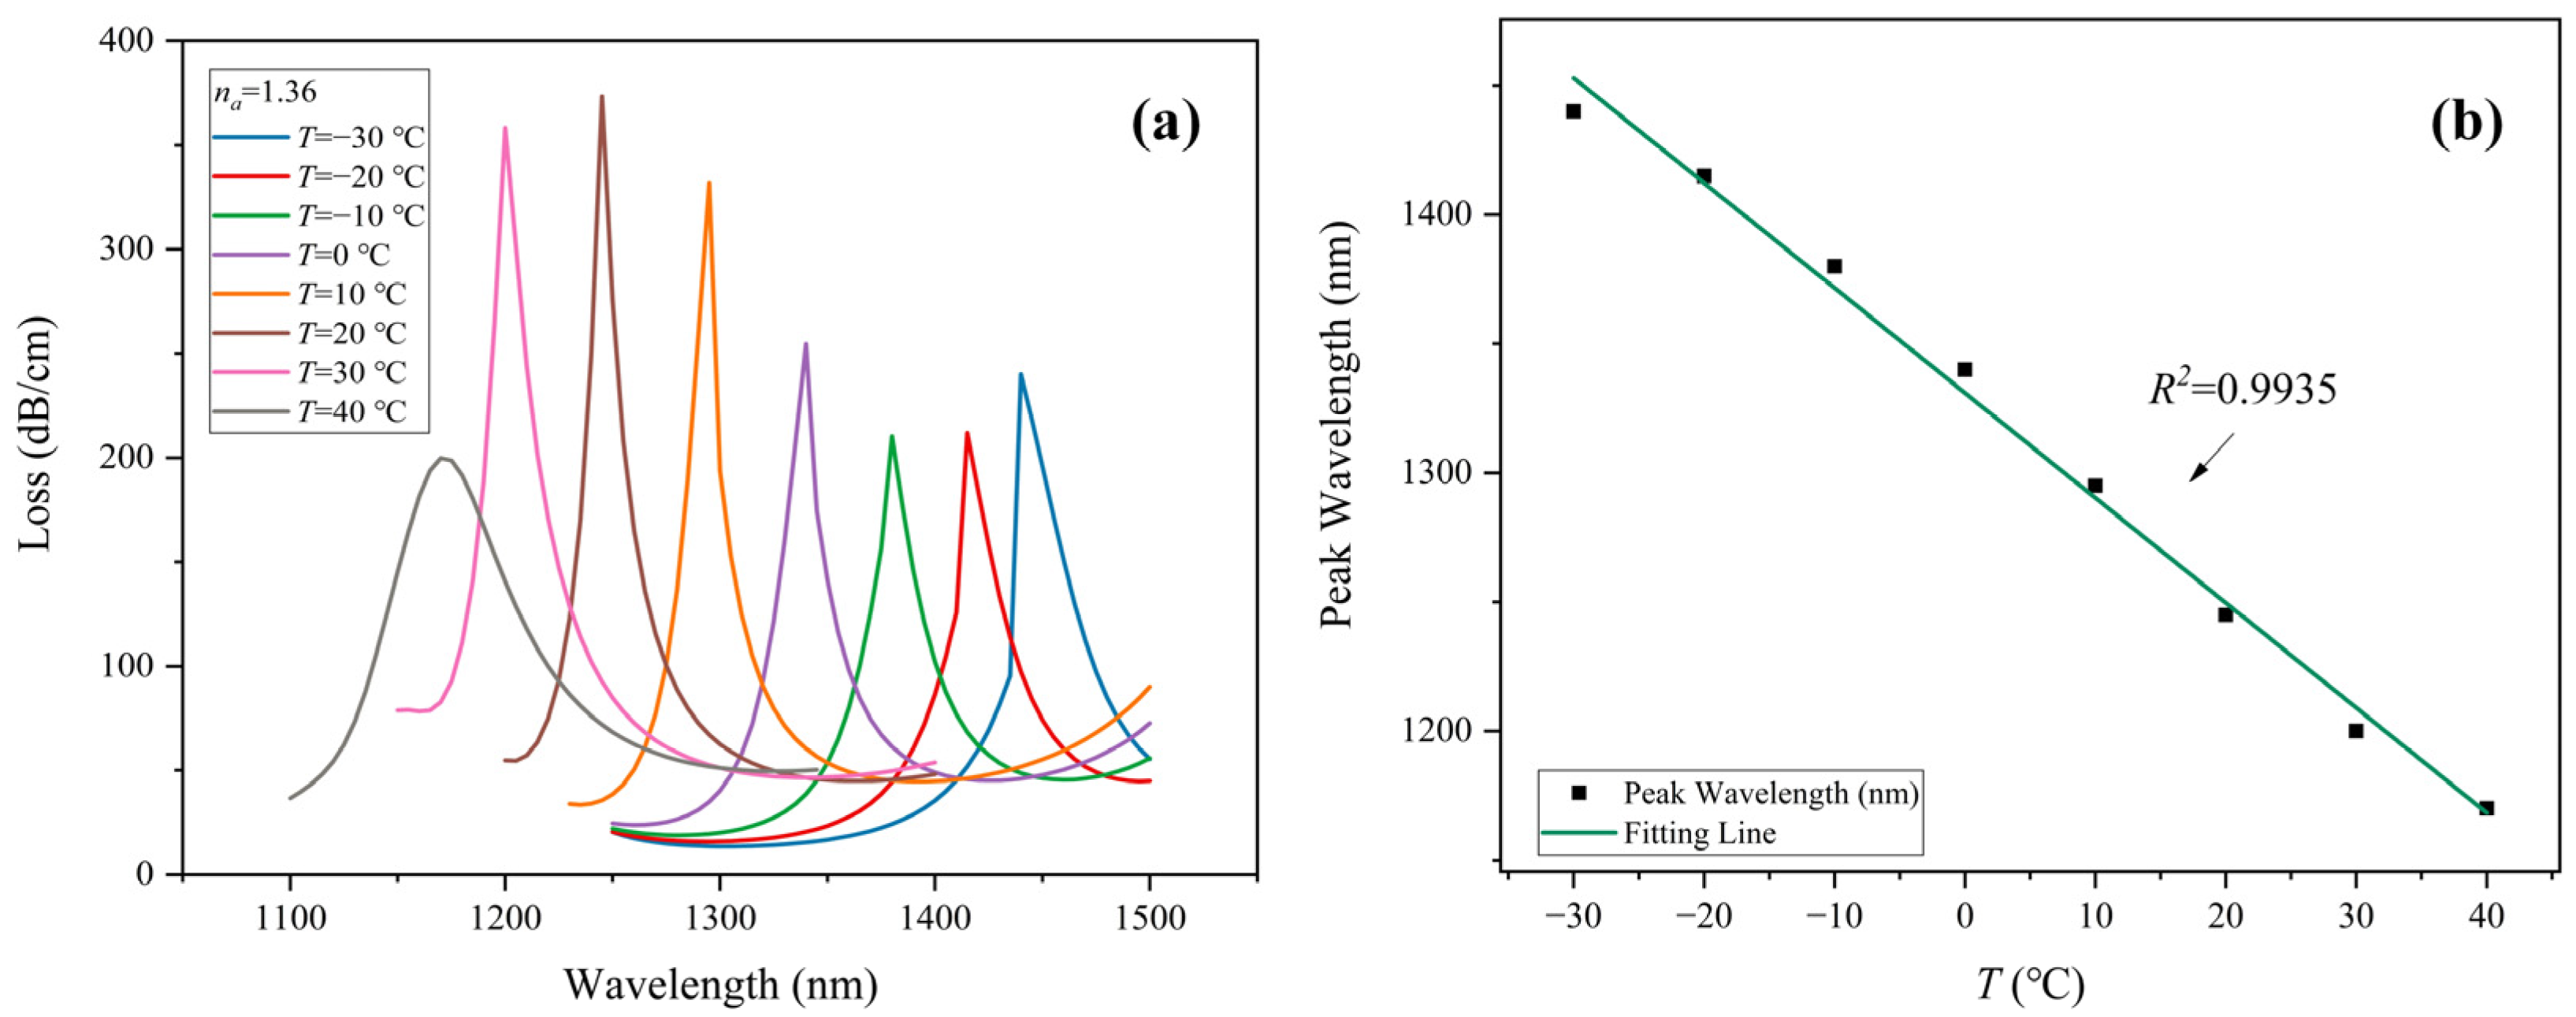
3.2. Temperature Sensing

Figure 6a shows the loss spectrum of the PCF-SPR sensor at −30–40 °C. Analyte RI is fixed at 1.36. Corresponding to a temperature of −30, −20, −10, 0, 10, 20, 30, and 40 °C, SPR appears at a wavelength of 1440, 1415, 1380, 1340, 1295, 1245, 1200, and 1170 nm, respectively. As the temperature increases, the resonance wavelength shows a blue-shift towards a smaller wavelength, for the RI of liquid toluene becomes smaller as the temperature increases. The SPR occurring at the surface of the gold layer correspondingly shifts to a shorter wavelength with increasing temperature. The wavelength sensitivity of temperature detection is calculated as follows [29]:
S λ T , λ = Δ λ peak Δ T nm / ° C
where Δ λ peak refers to the shift of peak wavelength under adjacent temperature T. The variant of temperature is denoted by Δ T . The proposed sensor achieves wavelength sensitivity of −2.5, −3.5, −4.0, −4.5, −5.0, −4.5, and −3.0 nm/°C for the environment temperature varying from −30 °C to 40 °C in steps of 10 °C, respectively. The best sensitivity of −5.0 nm/°C is obtained as temperature diverse from 10 °C to 20 °C. As shown in Figure 6b, the fitting result of the resonance wavelength shows good linearity with an excellent R2 of 0.9935.
The resolution of temperature is defined as [30]:
R T T , λ = Δ T × Δ λ min / Δ λ peak ° C
where Δ T is the change of the ambient temperature, Δ λ min denotes the smallest spectrum resolution, which is also set as 0.1 nm. Δ λ peak refers to the shift wavelength of the resonance peak when temperature varies. According to Equation (13), the resolution is 0.02 °C when the temperature changes from 10 °C to 20 °C. It is worth mentioning that the reason we choose −30–40 °C as the temperature detecting range is for the consideration of both toluene characteristics and sensing performance. The melting and boiling point of liquid toluene is −94.9 °C and 110.6 °C, respectively [31]. Toluene remains chemically stable in this temperature range when sealed. Additionally, the reported sensor shows good sensitivity and peak wavelength linearity within the ambient temperature range from −30 °C to 40 °C.

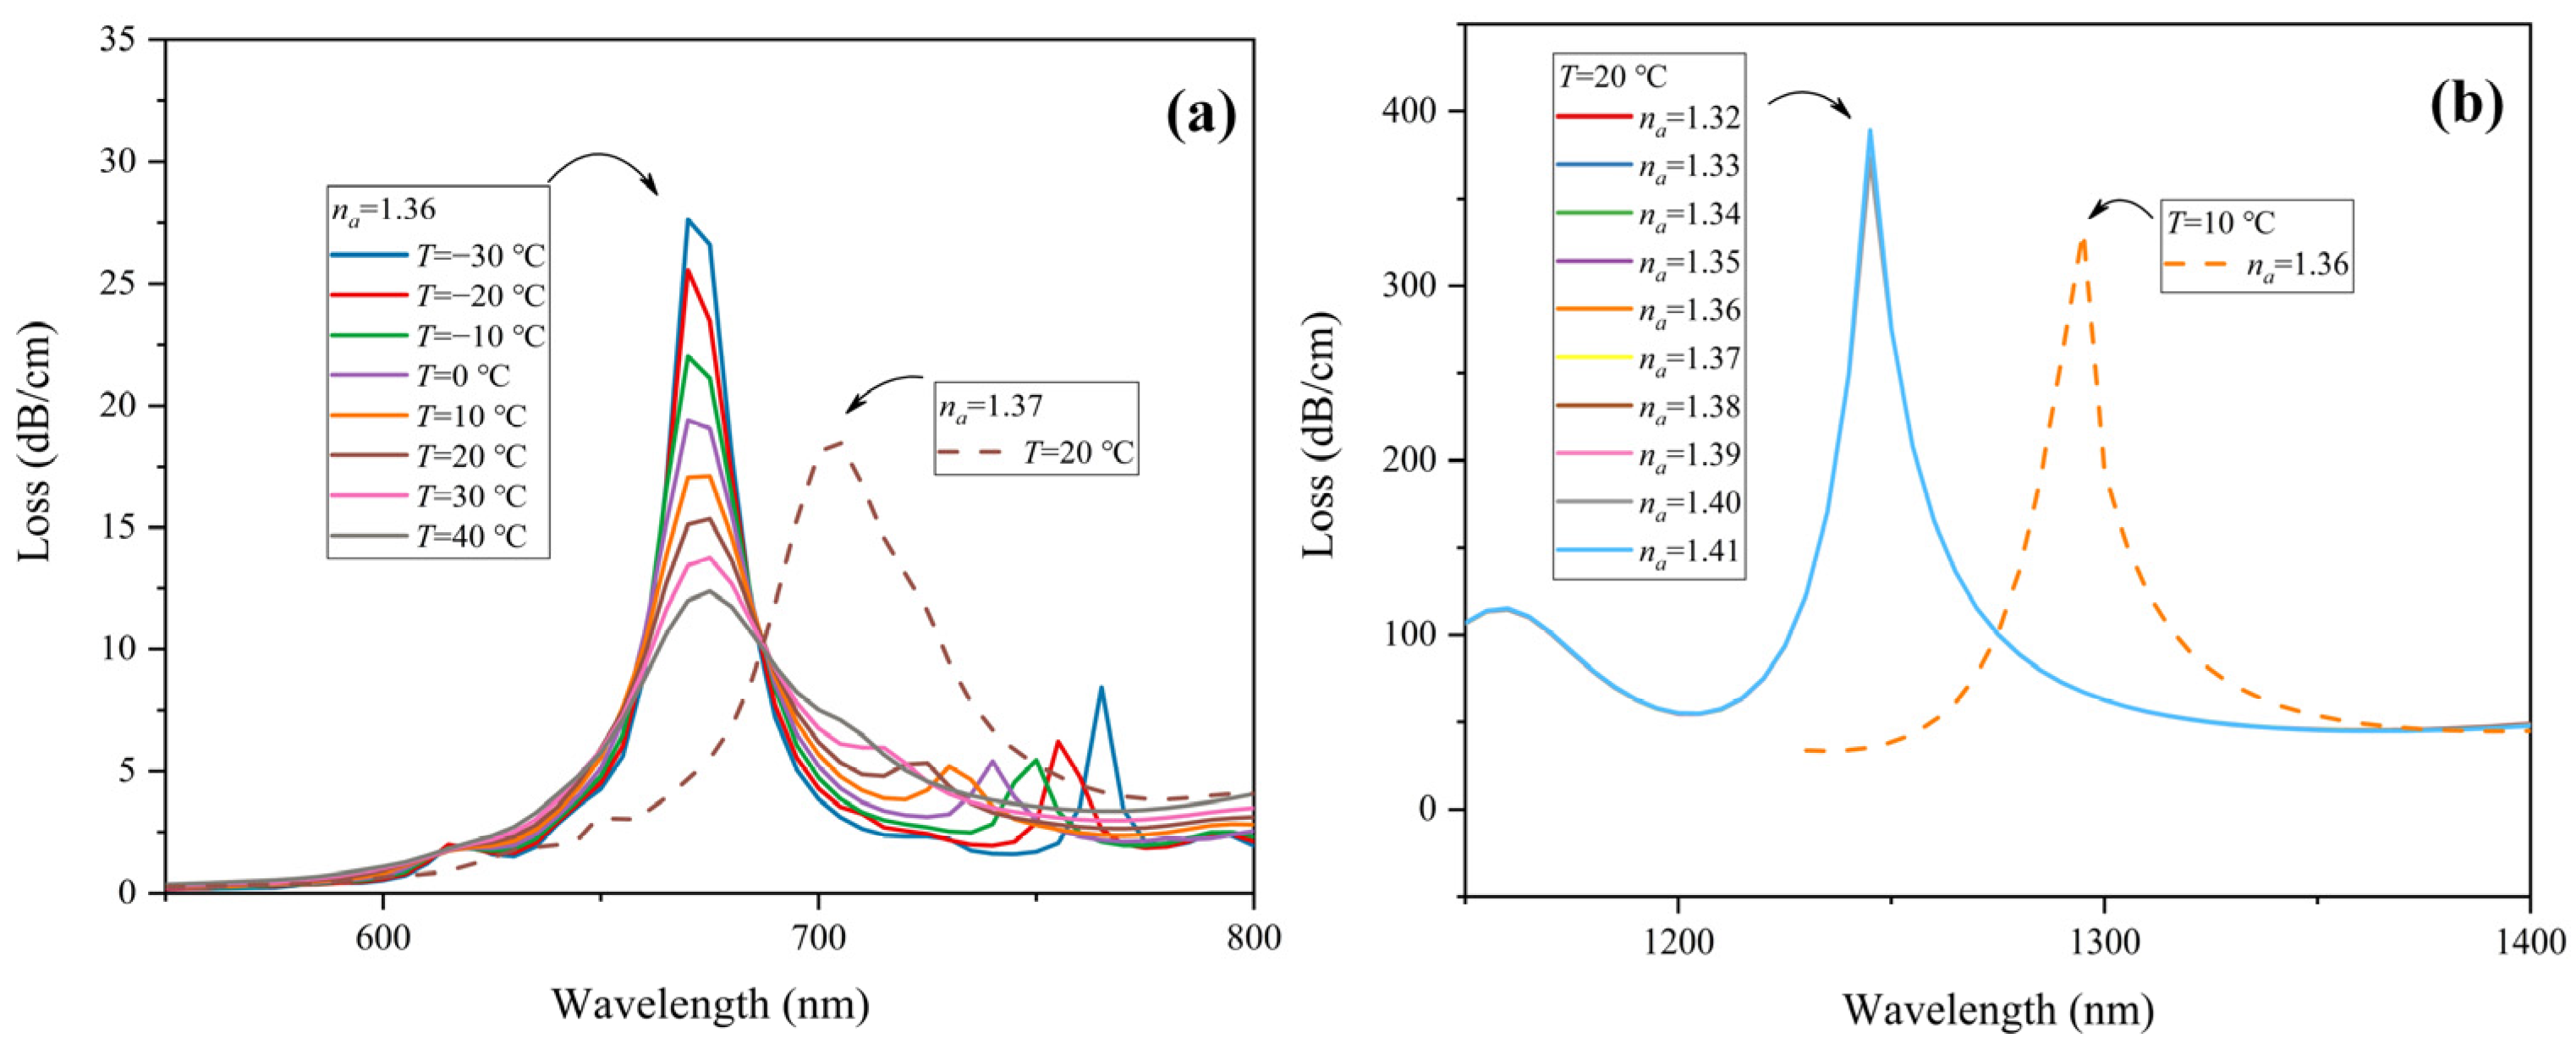
3.3. Independence Analysis of Dual Parameter Sensing

The crosstalk between the two sensing channels should be considered in dual-parameter measurement sensors. In this part, we analyze the performance in the two sensing channels under different temperatures and analyte RI. Firstly, the analyte RI is fixed at 1.36 with the ambient temperature varying from −30 °C to 40 °C. The CL spectrum of the RI sensing channel is drawn in Figure 7a. As the temperature alters, core mode loss in y-polarization only has a slight change in amplitude, while the resonance wavelength barely changes and is fixed at 675 nm. For comparison, the CL spectrum of the y-polarization core mode when the analyte RI is 1.37 at 20 °C is also plotted in Figure 7a. The core mode loss in y-polarization has a greater change in amplitude; the peak wavelength also red-shifts from 675 nm to 705 nm. Therefore, the RI sensing region is insensitive to temperature. Next, the ambient temperature remains constant at 20 °C; the analyte RI is modified from 1.32 to 1.41. As can be seen in Figure 7b, the core mode loss in x-polarization stays the same. Similarly, when the analyte RI is 1.36 and the ambient temperature is 10 °C, the loss spectrum of the x-polarization core mode is depicted in Figure 7b. It can be found that the peak wavelength red-shifts from 1245 nm to 1295 nm. Therefore, the temperature sensing channel is insensitive to the analyte RI. Given the above, the RI sensing channel and temperature sensing channel are independent during measurement, which helps avoid sensitivity crossover and simplifies the detecting process.

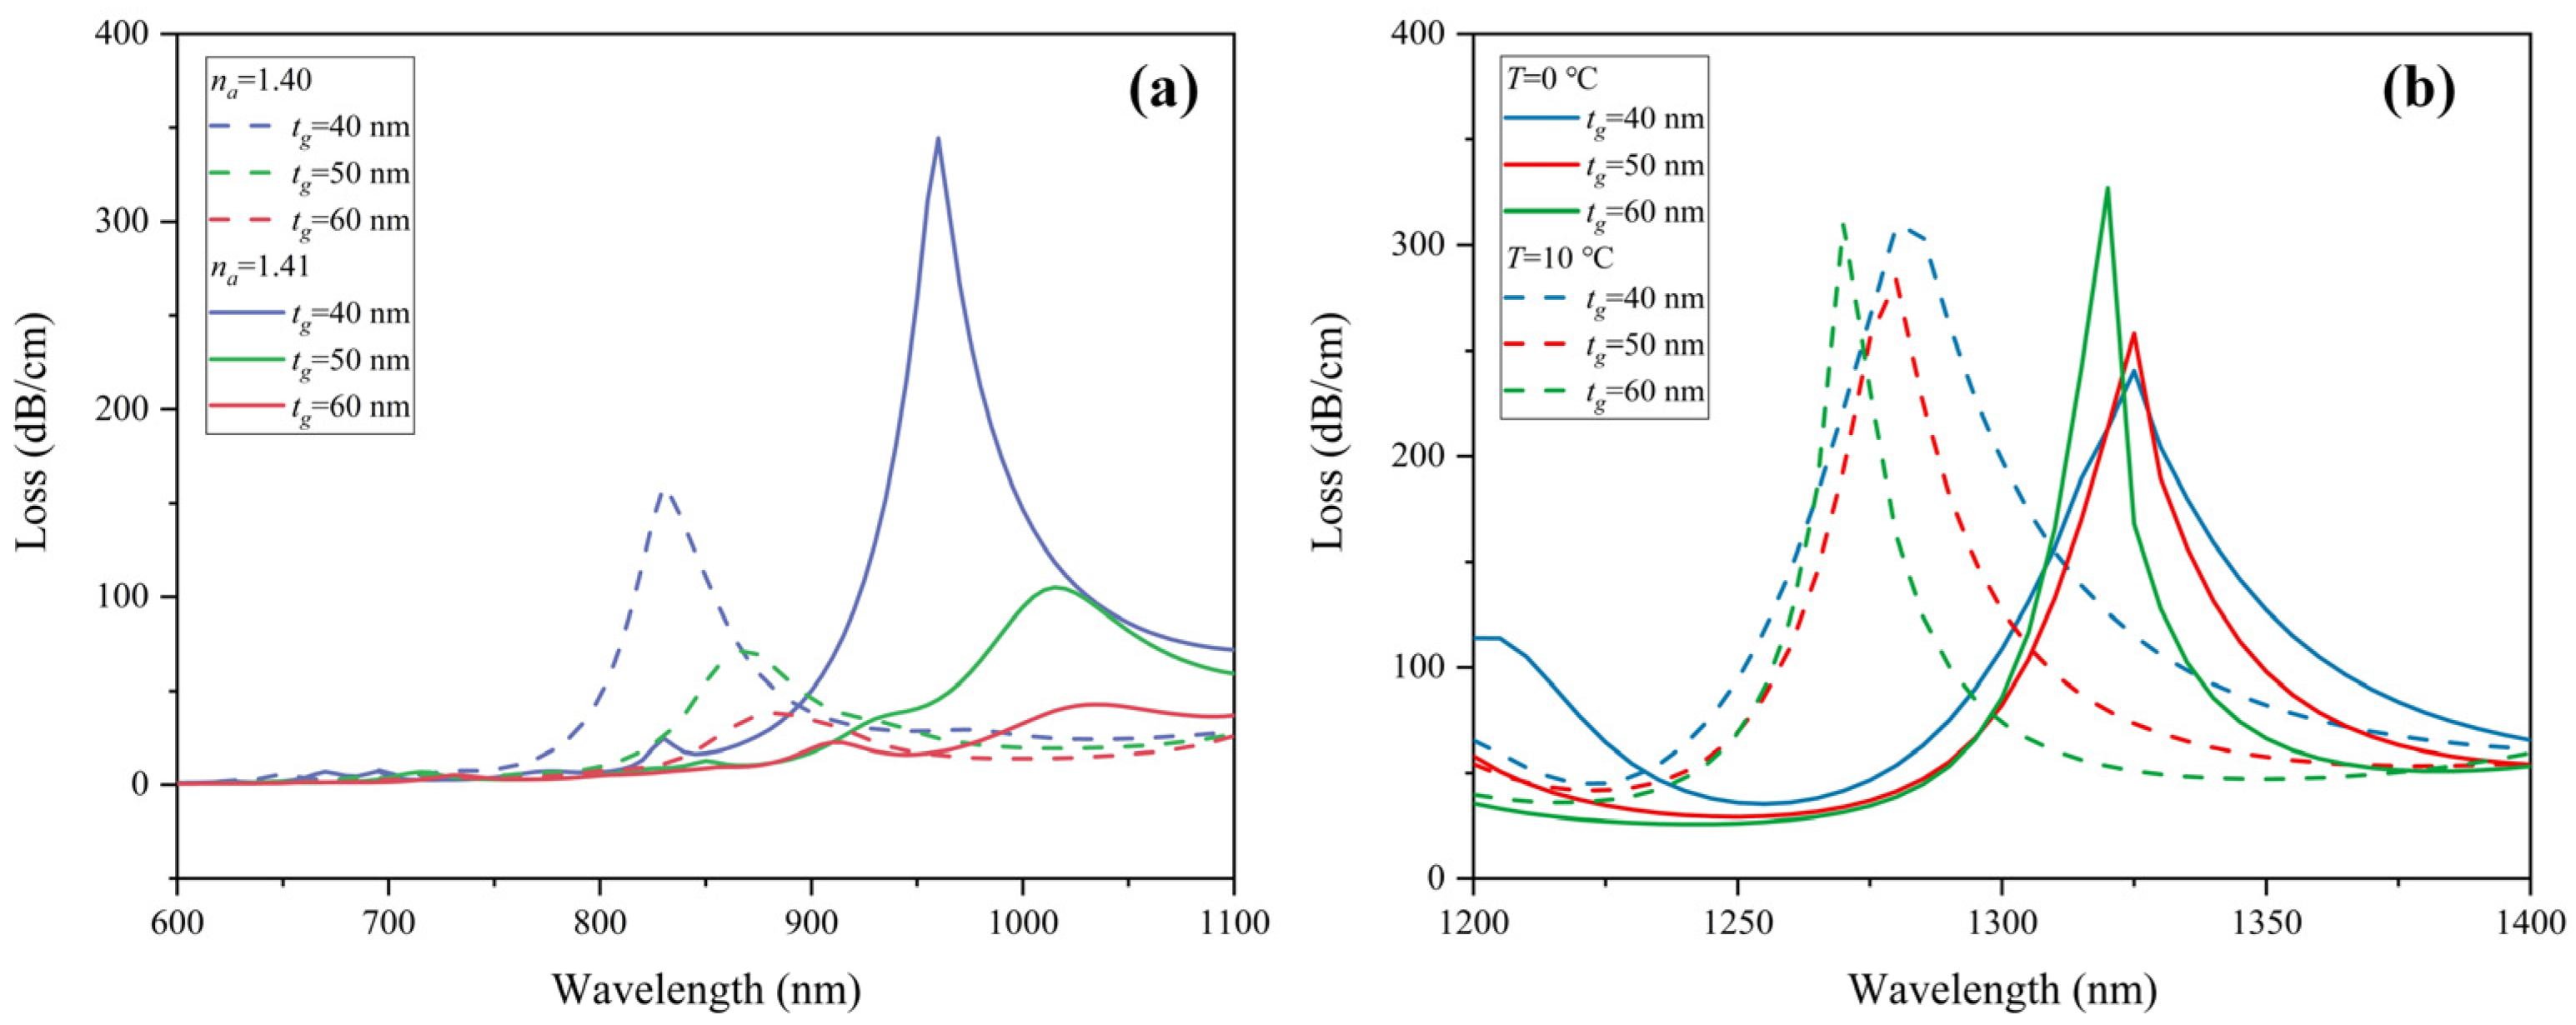
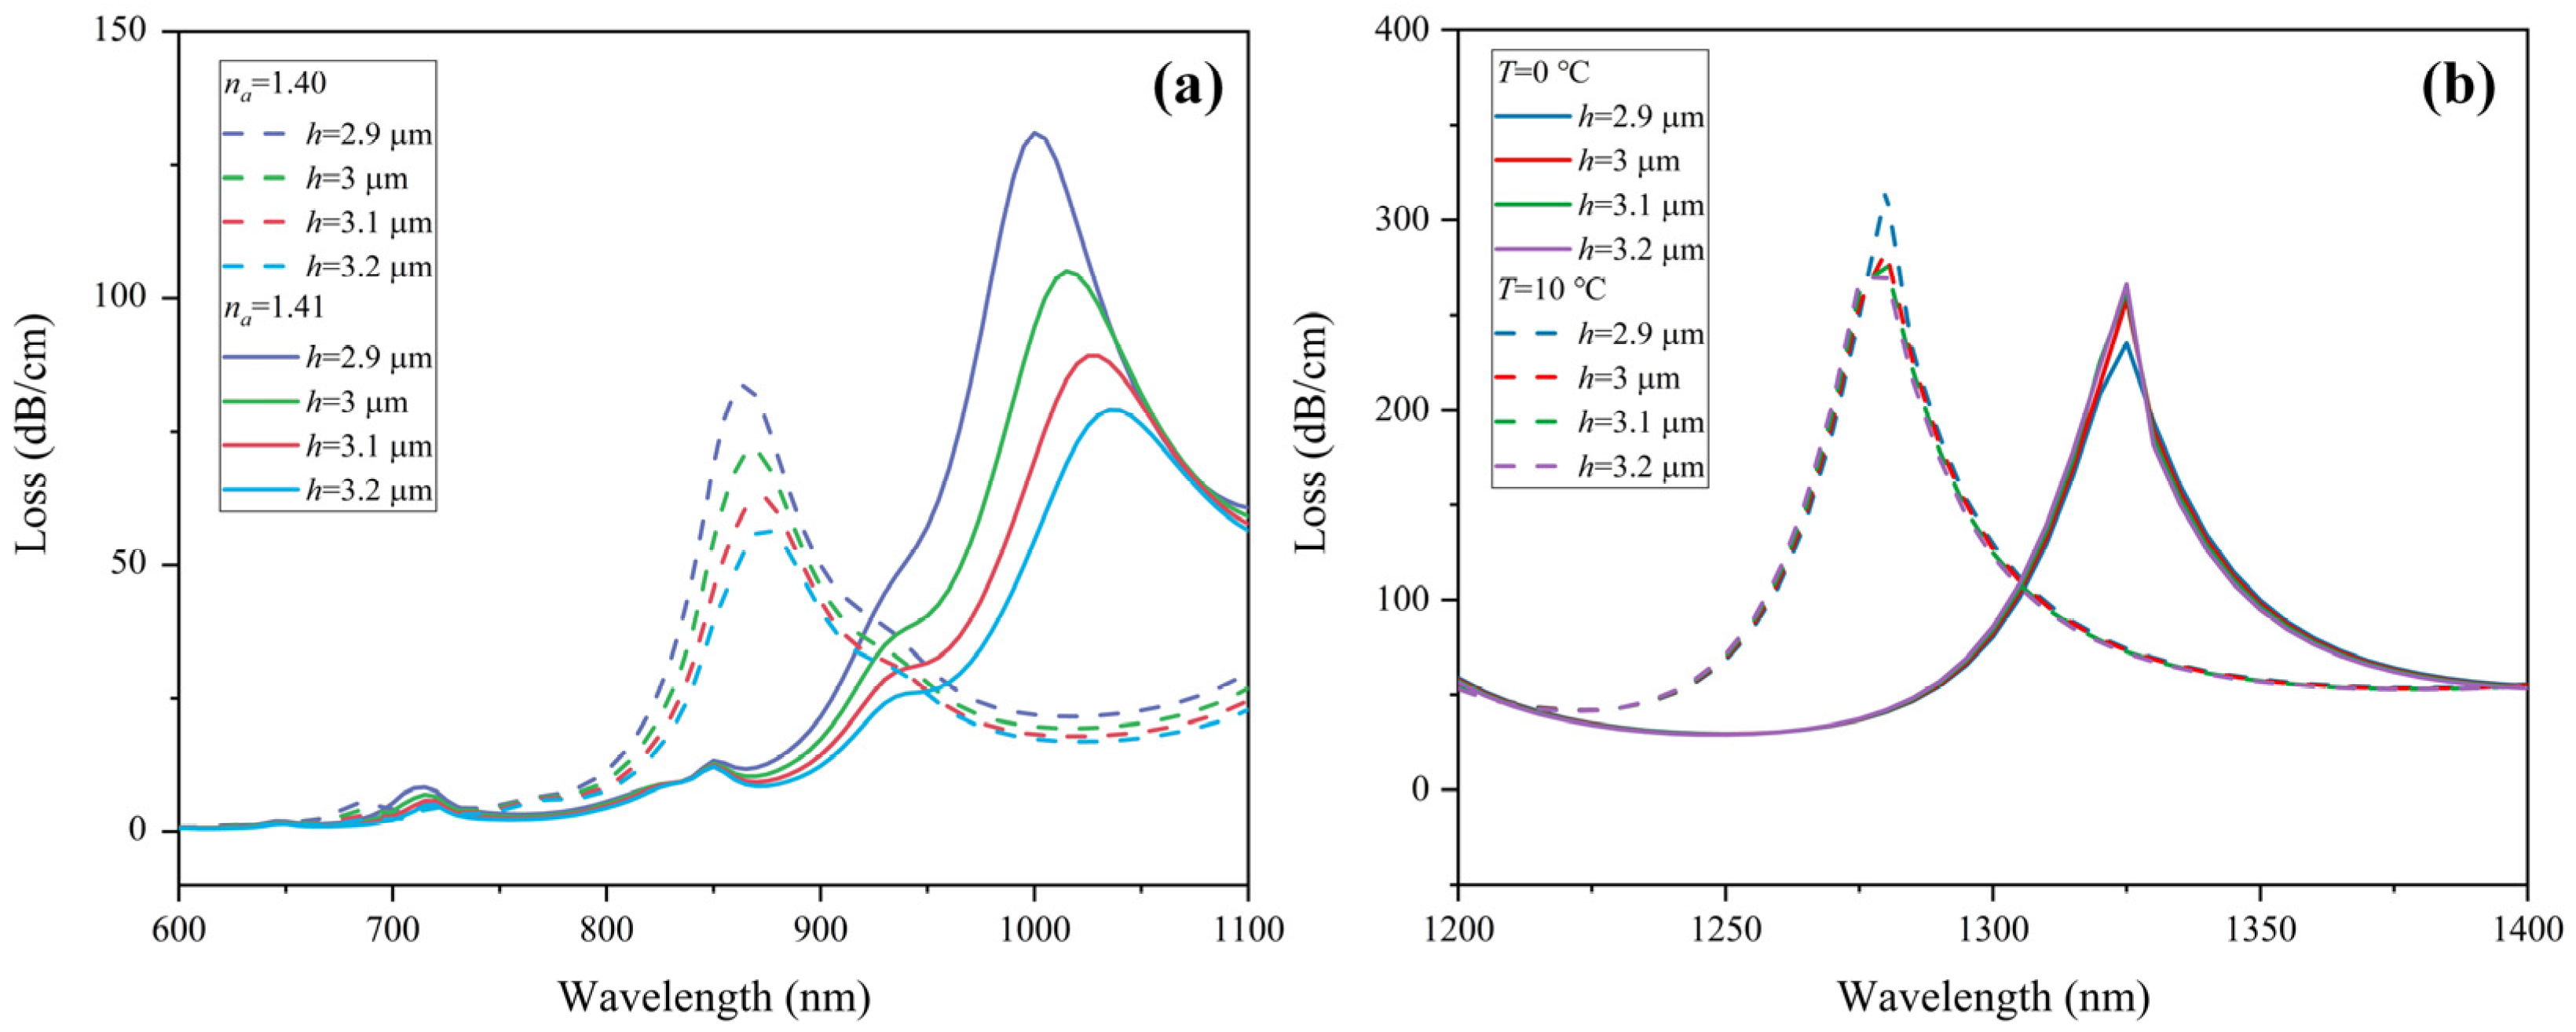
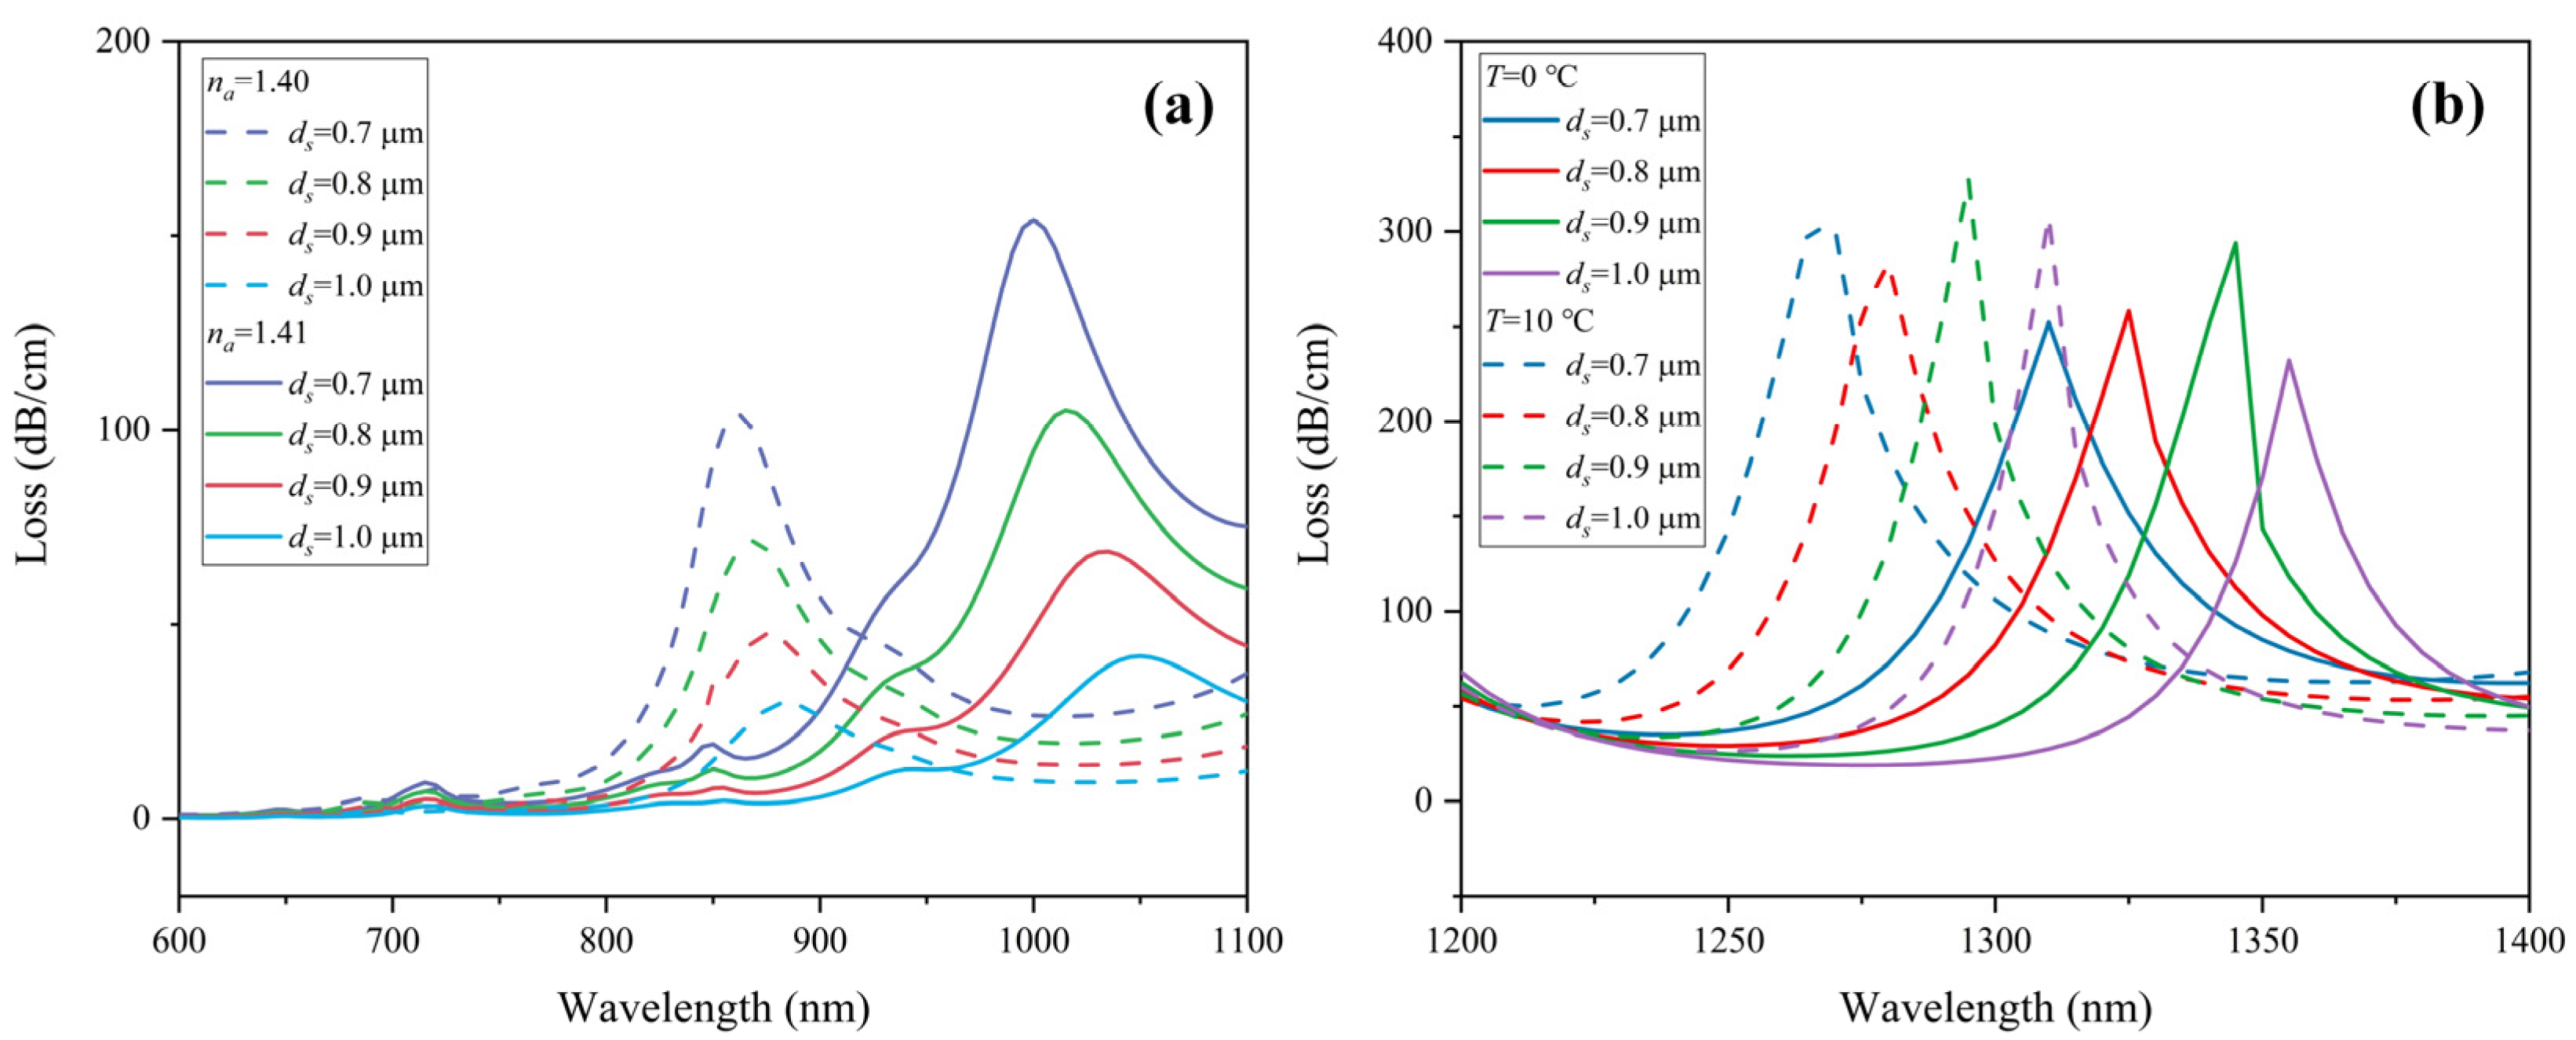
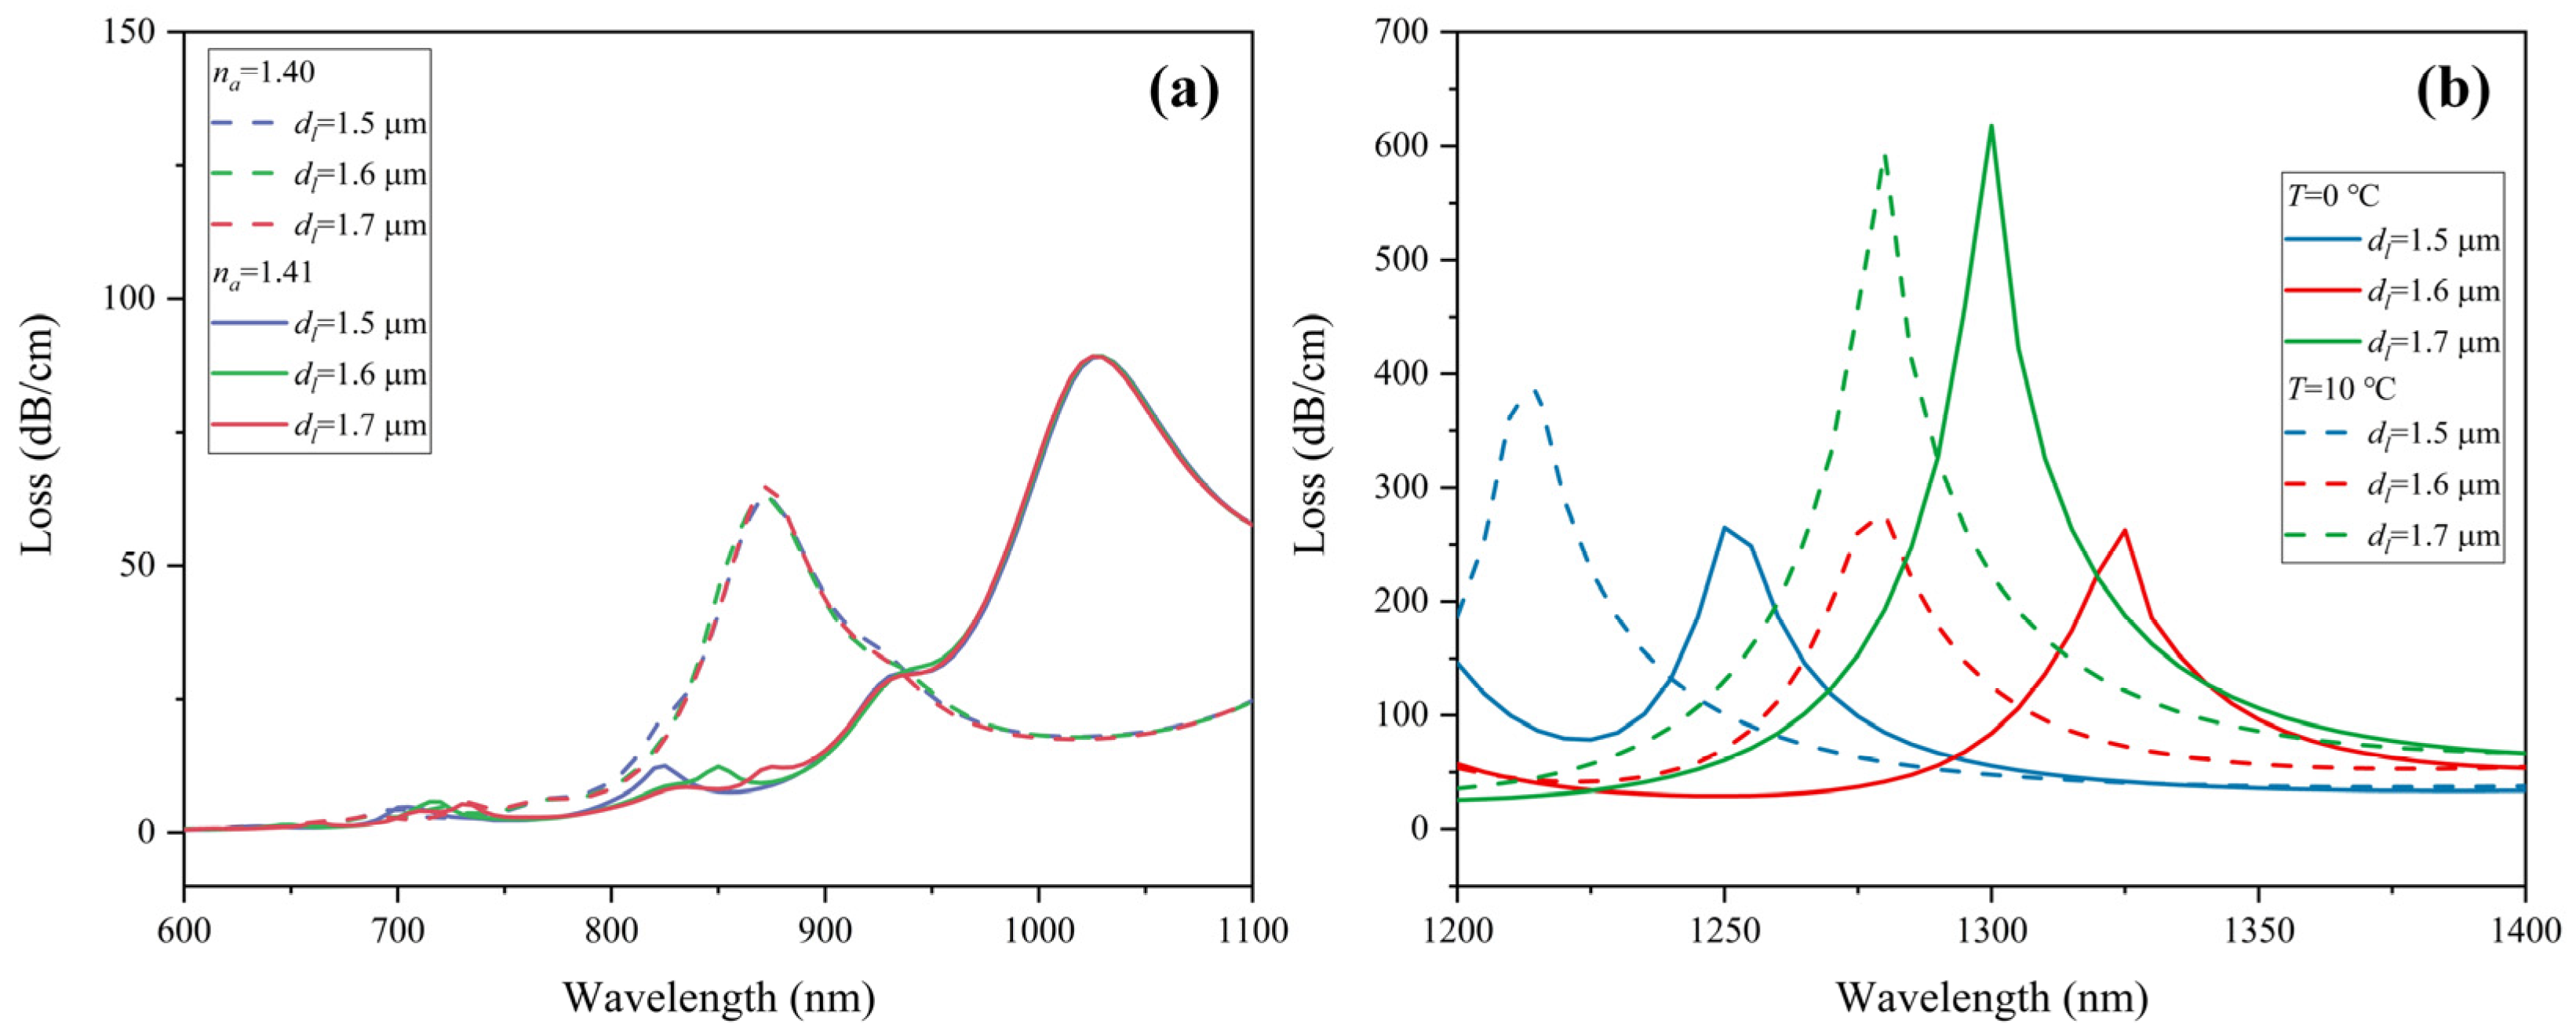
4. Structure Parameter Optimization

The structure parameters of the sensor will affect the detection performance of temperature and RI in various degrees. In order to optimize the sensing characteristics of the proposed sensor, the influence of the thickness of the gold film tg, deposition depth of the gold film h, the diameter of the small air holes in the inner layer ds, and the diameter of the large air holes in the outer layer dl on the sensing performance are analyzed and discussed in this section.
SPR is excited at the interface between the gold layer and the medium. The thickness of the gold layer tg has a great influence on the resonance wavelength and the peak value of the loss spectrum. Therefore, this parameter is one of the key indicators that affect the sensing performance. It can be seen from Figure 8a that the increase in tg promotes the red-shift of the resonance wavelength. When tg = 40, 50, and 60 nm, the wavelength sensitivity of RI is 13,000, 14,500, and 15,500 nm/RIU, respectively. As tg increases, the height of the loss peak decreases. This is because the gold film is too thick, preventing the electric field from penetrating the dielectric layer [32]. The mode coupling efficiency is correspondingly depressed and weakened, resulting in great suppression of the CL peak. Additionally, the CL spectrum of 1.41 RIU shows a 2nd order peak near the resonance peak of 1.40 RIU when tg = 60 nm, which might interfere with the sensing. For temperature detection, as shown in Figure 8b, when tg = 40 and 50 nm, the wavelength sensitivity is −4.5 nm/°C, and when tg thickens to 60 nm, the temperature sensitivity is increased to −5 nm/°C. Considering the sensing characteristics of both RI and temperature, 50 nm is determined to be the optimum thickness of the gold film.
Since the detection of RI occurs in y-polarization, the polishing depth h of the Au film has a great influence on the sensing performance of RI. Figure 9a exhibits the CL spectra of 1.40 RIU and 1.41 RIU as a function of h. When the analyte RI varies from 1.40 to 1.41, the corresponding wavelength sensitivities are 13,500, 14,500, 16,000, and 16,000 nm/RIU for h = 2.9, 3, 3.1, and 3.2 μm, respectively. When h is larger than 3.1 μm, the sensitivity is no longer improved. It can be seen from Figure 9a that the CL peak becomes lower as h increases. As the polishing surface gets away from the core area, resonance intensity between the core mode and SPP mode is weakened accordingly. Figure 9b shows the resonance wavelength as a function of different h at 0–10 °C. It is obvious that the change in h has little effect on temperature sensitivity, which remains at −4.5 nm/°C. Therefore, we choose h = 3.1 μm for higher RI sensitivity.
The structure of PCF can be further optimized. The diameter of the air holes has a great influence on the leakage of the mode and the position where the resonance occurs. Firstly, the influence of the small air hole diameter ds in the inner layer on sensing performance is analyzed. Figure 10a shows the effect of ds on the CL spectrum when the analyte RI changes from 1.40 to 1.41. When ds = 0.7, 0.8, 0.9, and 1 μm, the RI sensitivity is 14,000, 14,500, 16,000, and 18,500 nm/RIU, respectively. It can be known that smaller ds allows the guiding light to leak more from the core area, resulting in a stronger resonance at the interface between the metal film and the medium. A larger peak in the CL spectrum appears. Red-shift of the resonance wavelength is suppressed, and the RI sensitivity is reduced. From Figure 10b, when ds = 0.7, 0.8, 0.9, and 1 μm, the temperature sensitivity is −3.5, −4.5, −5, and −4.5 nm/°C, respectively. As ds increases from 0.7 μm to 0.9 μm, the temperature sensitivity ascends. However, when ds continues to increase, the temperature sensitivity begins to descend afterward. Therefore, the value of ds is set as 0.9 μm.
Figure 11 displays the variations of the loss spectrum with a different air hole diameter dl for the RI range 1.40–1.41 and the temperature range 0–10 °C. Because there is no large air hole between the RI detection channel and fiber core area, the variation of dl does not have much influence on the RI detection, yet it has a certain influence on the temperature detection. Figure 11a shows that when dl = 1.5, 1.6, and 1.7 μm, the RI sensitivity is 15,500, 16,000, and 15,000 nm/RIU, respectively. Figure 11b shows that the corresponding temperature sensitivity is −3.5, −4.5, and −2 nm/°C, respectively. When dl = 1.6 μm, both RI and temperature detection have better performance. Thus, dl = 1.6 μm is considered the best design. In conclusion, the optimized structural parameters are ds = 0.9 μm, dl = 1.6 μm, h = 3.1 μm, and tg = 50 nm.
Table 1 illustrates the comparison of the sensing characteristics between the proposed flat PCF-SPR sensor and previously reported structures for RI and temperature detection. Compared with other structures, it is evident that the detecting performance of temperature and RI is greatly improved in the proposed PCF. The sensor shows more superb wavelength sensitivity of 17,000 nm/RIU and amplitude sensitivity of 354.39 RIU−1 for RI sensing than the previously reported sensors. The optimal temperature sensitivity of −5 nm/°C is comparable. In addition, the proposed structure is simpler than some of the structures that have been introduced.

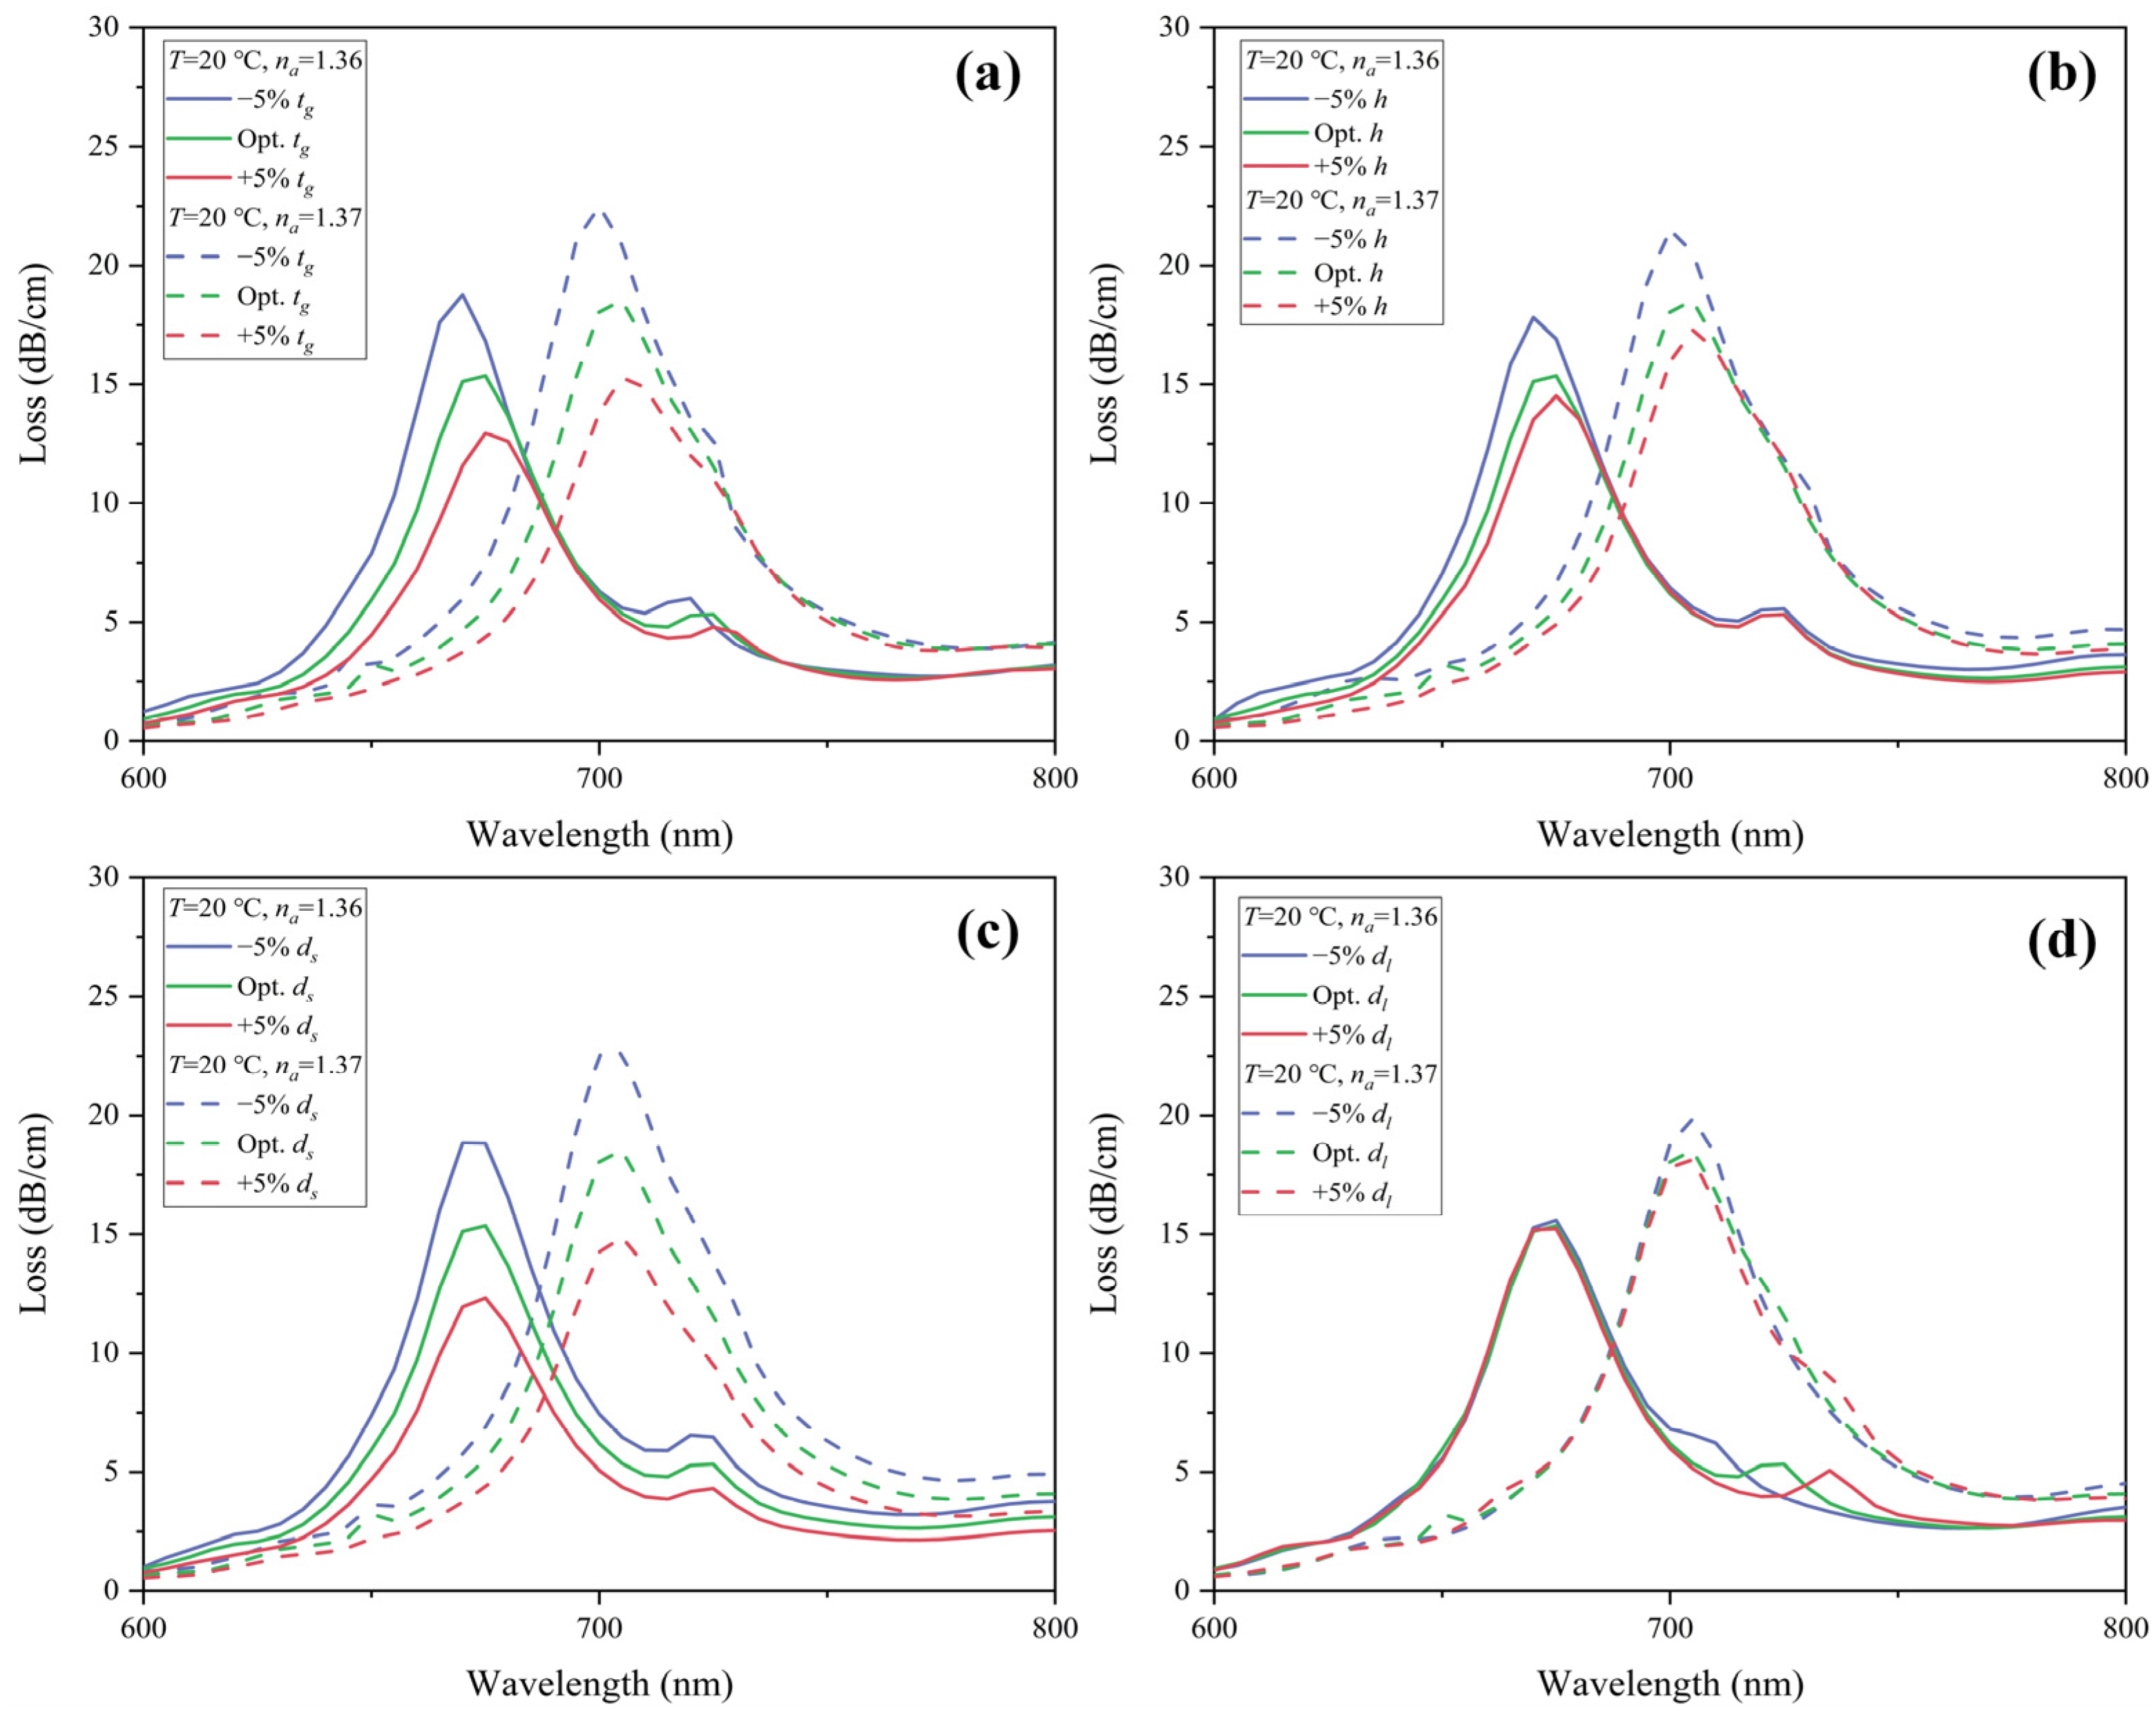
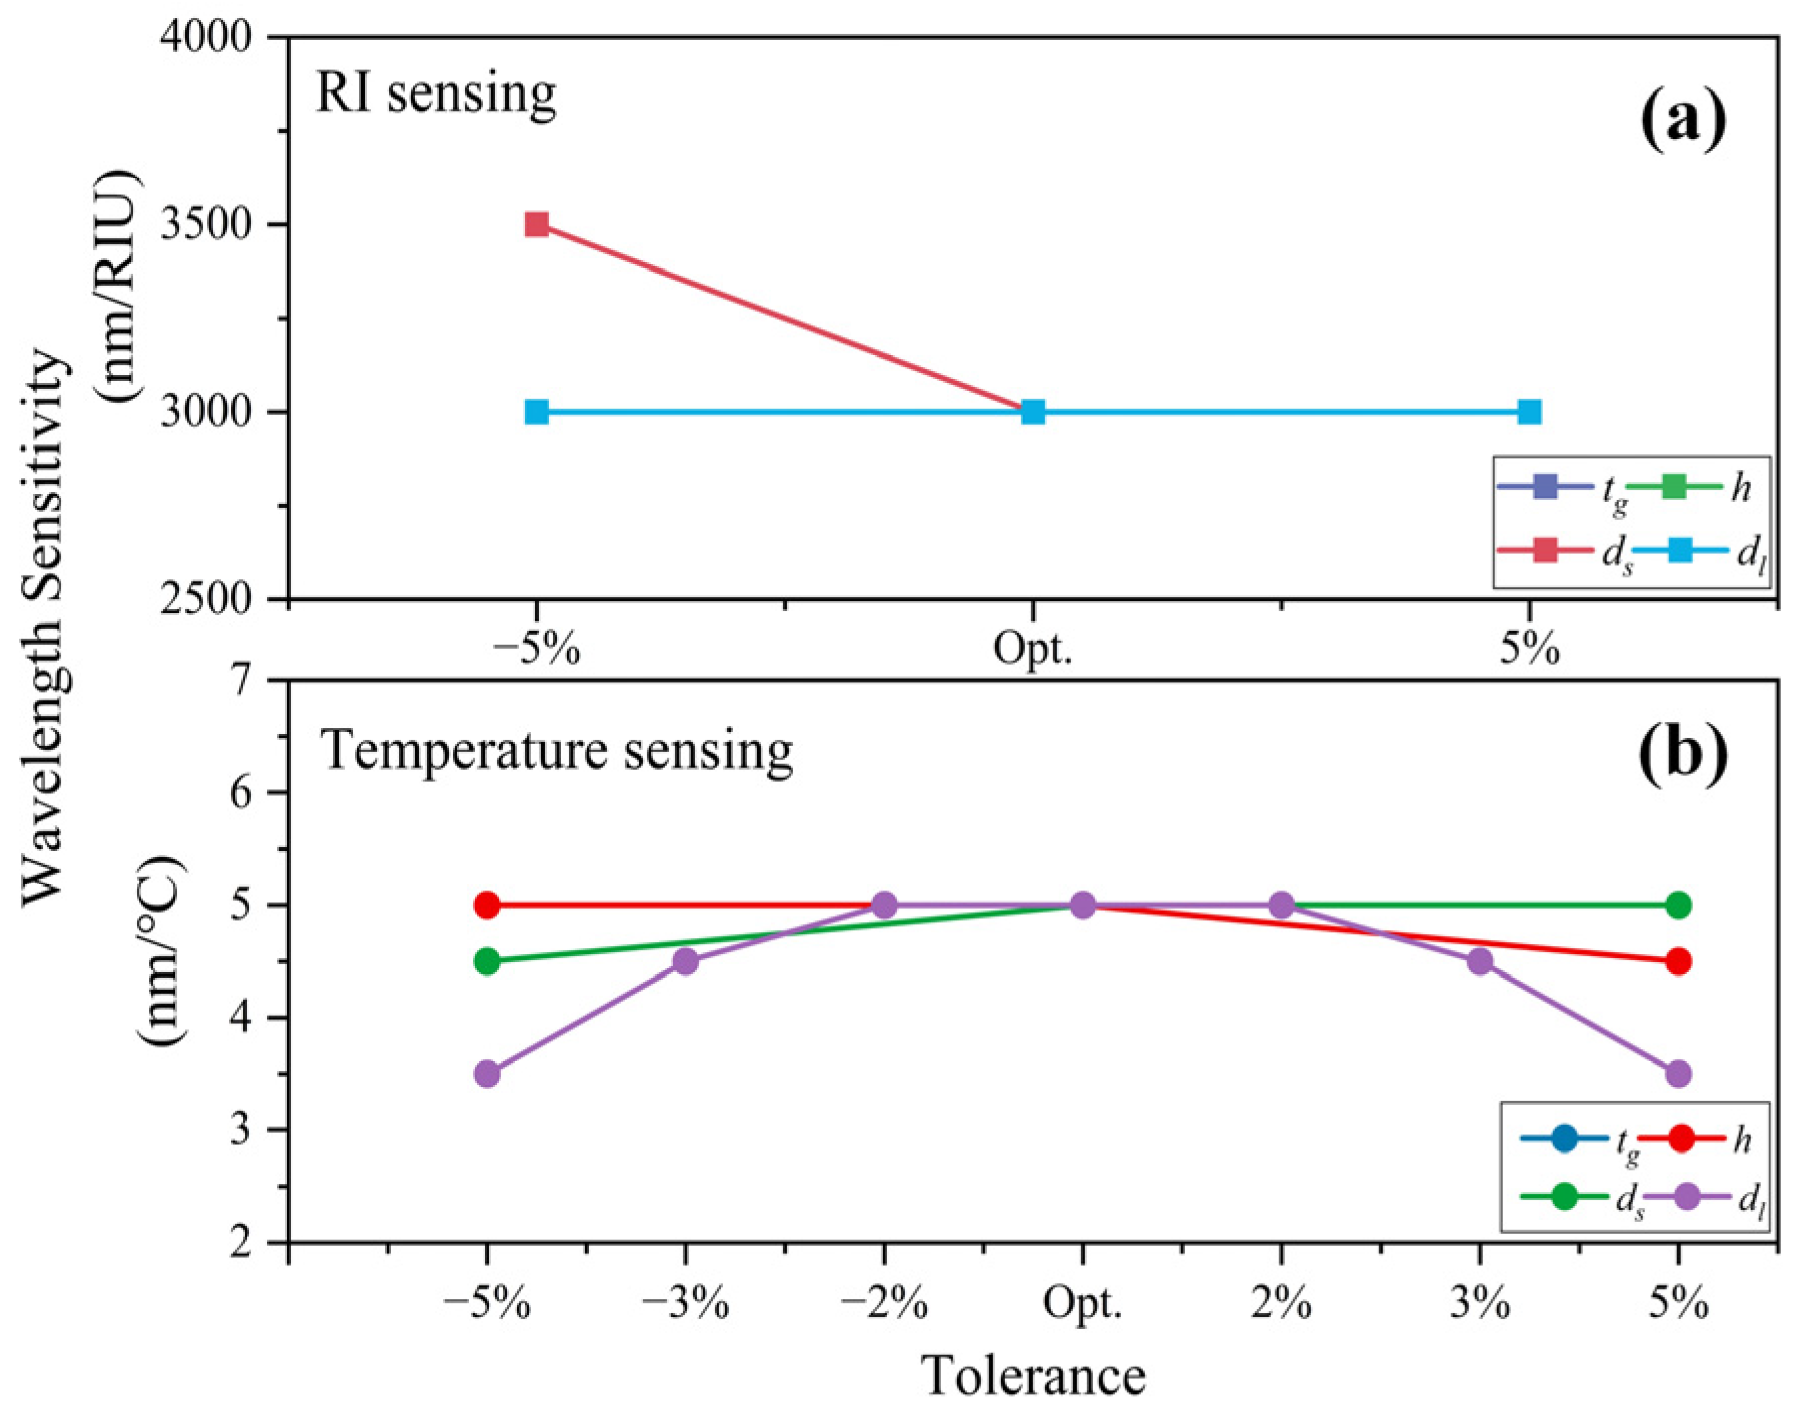
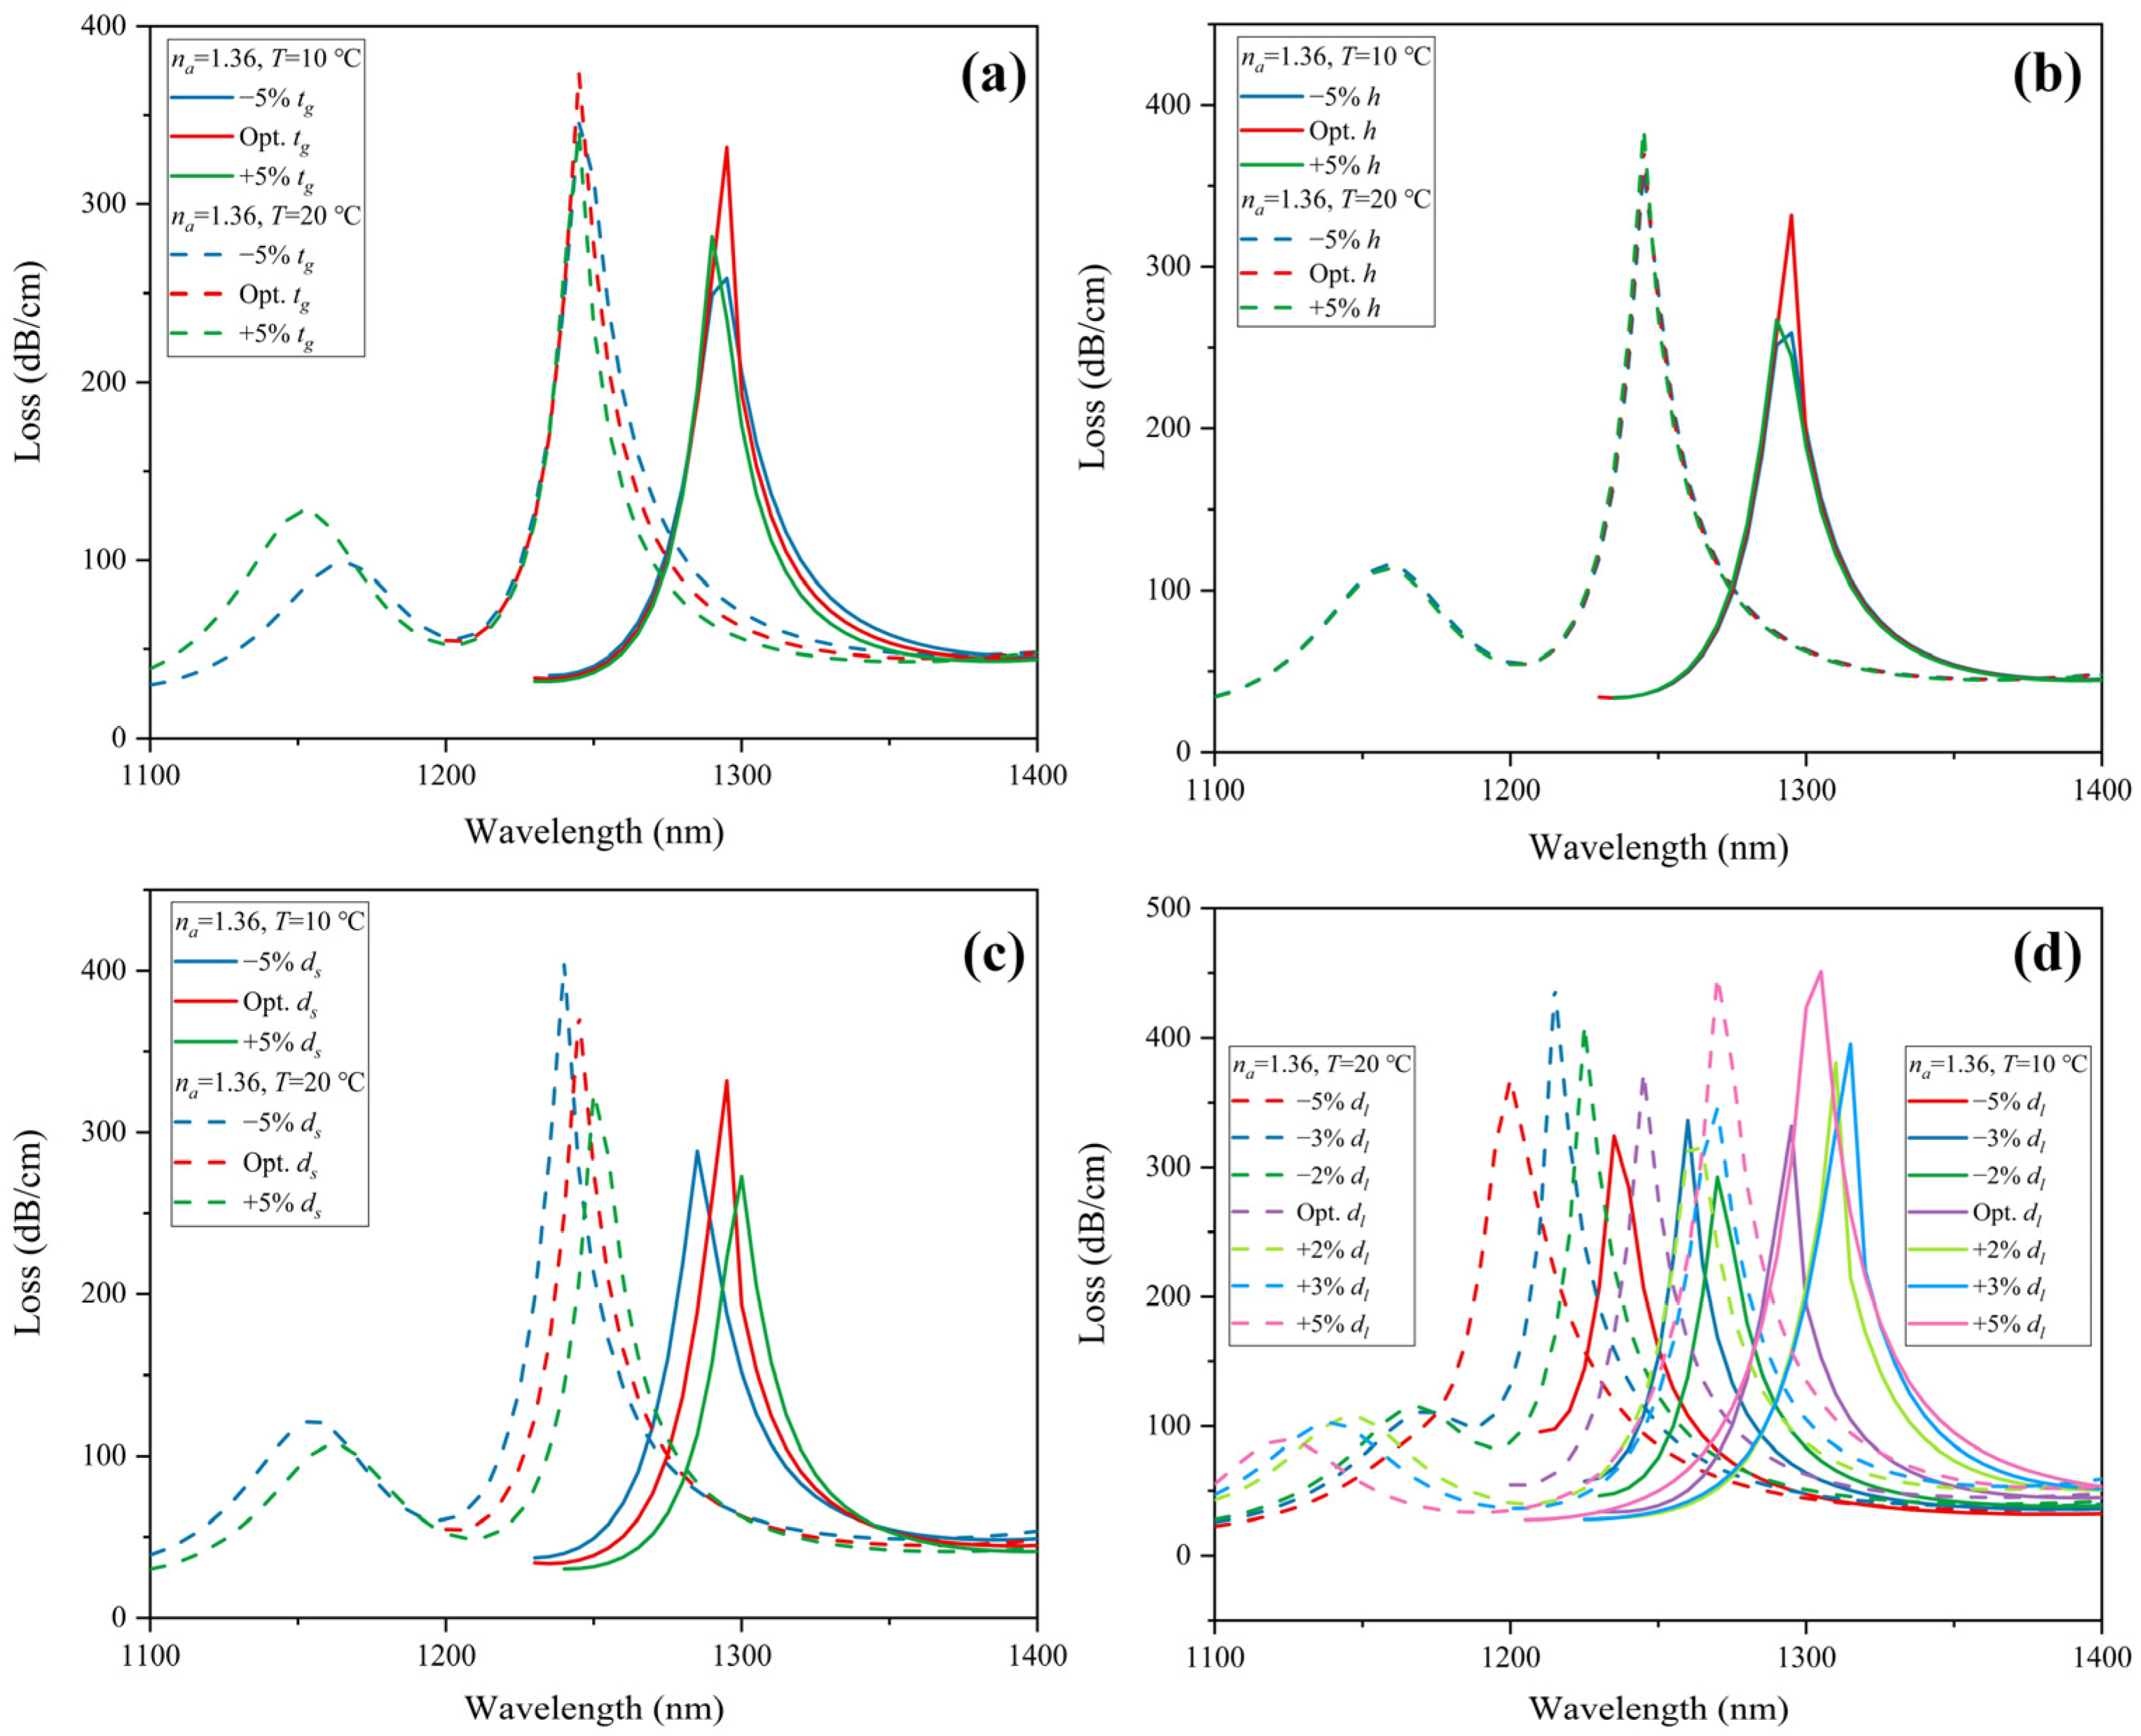
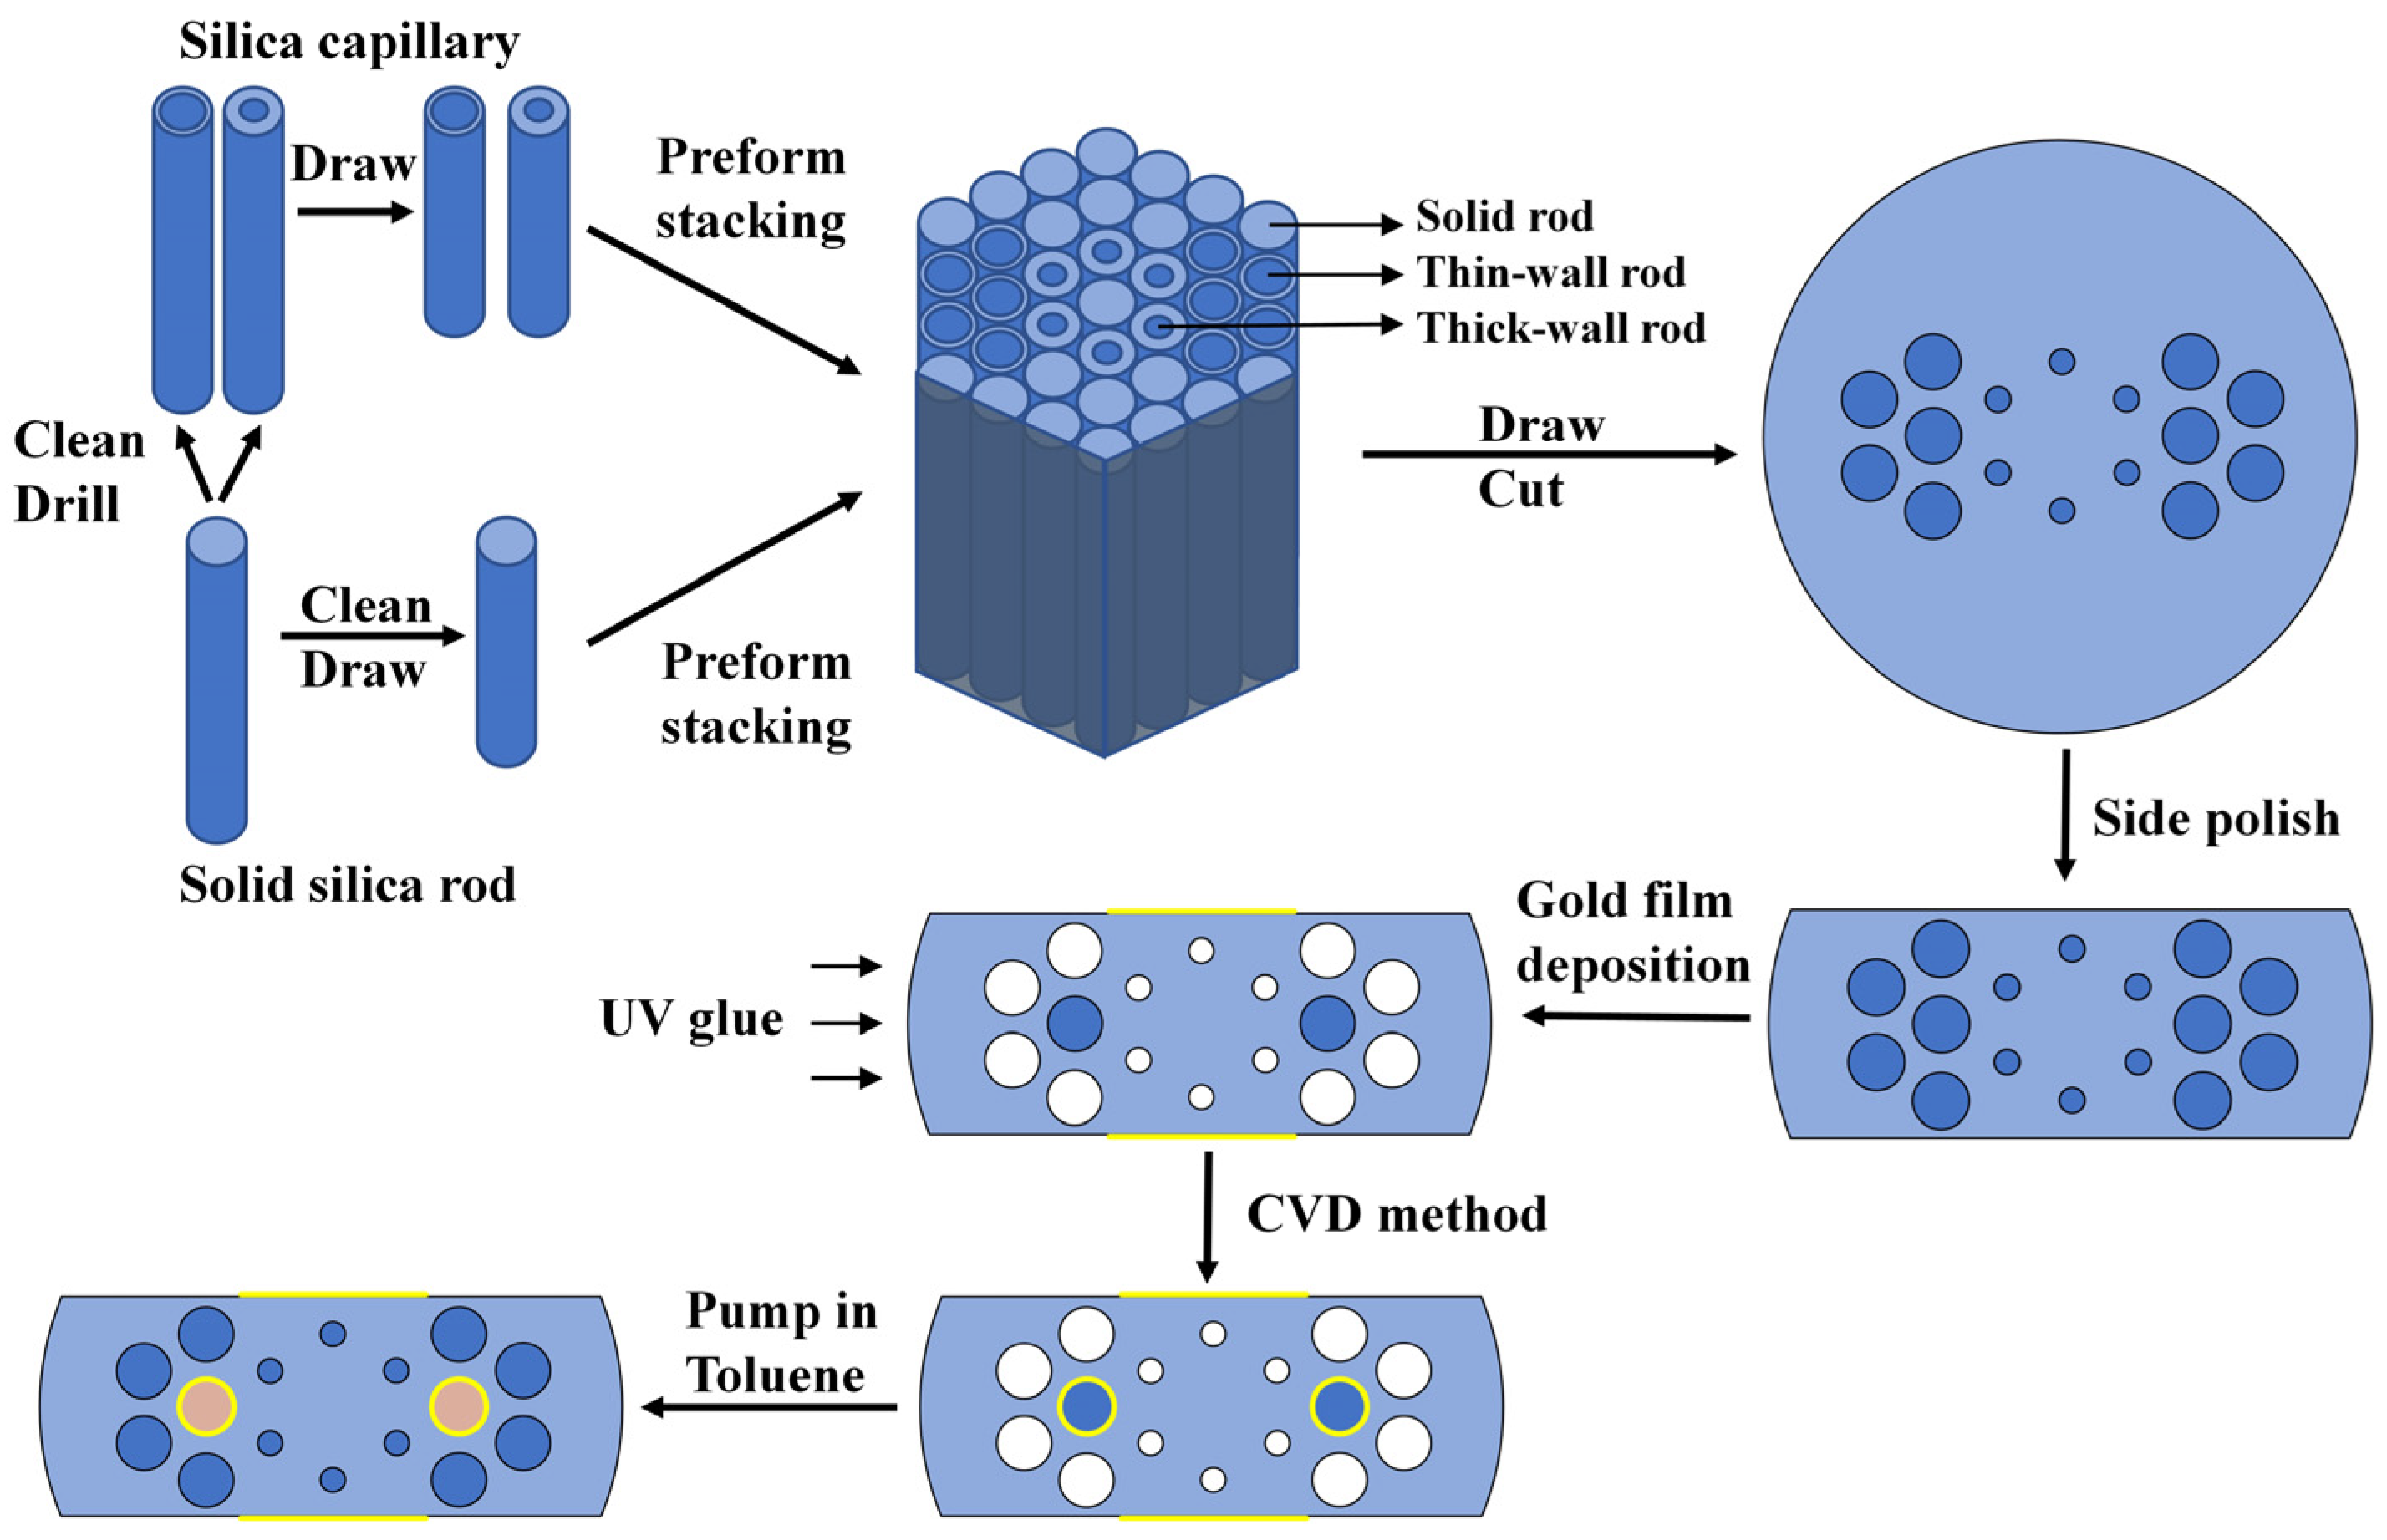
5. Fabrication Tolerance and Manufacturing Process Analysis

In the practical manufacturing process, the difference in structure parameters is inevitable. According to Reeves et al. [36], the order of 1% deviation might take place. In this section, the repeatability and stability of the proposed sensor are investigated by performing fabrication tolerance on the key parameters tg, h, ds, and dl.
We consider ±5% variation from the optimal parameters of tg, h, ds, and dl. Under ambient temperature T = 20 °C, the CL spectra of y-polarization core mode in the RI sensing channel for analyte RI of 1.36 and 1.37 is depicted in Figure 12. Figure 12a–d shows the result of the tolerance test for tg, h, ds, and dl, respectively. The resonance peak shift is less than 5 nm, which is very minor. The change in peak value is very slight and is under 4.12 dB/cm. Figure 13a shows the wavelength sensitivity of RI detection with ±5% structure tolerance. It is obvious that except for an improvement of 500 nm/RIU with −5% ds, wavelength sensitivity remains unchanged. Therefore, ±5% tolerance of the structure parameters has little effect on RI sensing.
A tolerance test on structure parameters is also performed in the temperature-sensing channel. A ±5% deviation of tg, h, ds, dl, and ±2%, ±3%, and ±5% deviation of dl are considered. With analyte RI of 1.36, the CL spectrum of the x-polarization core mode under ambient temperature T = 10 and 20 °C is drawn in Figure 14. Figure 14a–d shows the result of the tolerance test for tg, h, ds, and dl, respectively. tg, h, and ds with ±5% deviation did not show a significant effect on wavelength shift, which is less than 5 nm. The change in peak value of CL spectra is under 73.46 dB/cm. In Figure 13b, the decrease in wavelength sensitivity for temperature sensing caused by tg, h, and ds with ±5% deviation is less than 0.5 nm/°C. However, ±5% deviation of dl will have a greater effect on both wavelength shift and peak value. Thus, we further examine the temperature sensing characteristics with ±2% and ±3% tolerance of dl. As shown in Figure 14d, with ±3% deviation of dl, the corresponding maximum wavelength shift is 35 nm, and the maximum peak loss change is 65.96 dB/cm. With ±2% deviation of dl, the wavelength shift is 25 nm and 20 nm for −2% under T = 10 and 20 °C, respectively, and 15 nm for +2% under T = 10 and 20 °C. The maximum peak loss change is 58.17 dB/cm. From Figure 13b, with ±3% tolerance of dl, the variation of wavelength sensitivity for temperature sensing can be limited within 0.5 nm/°C. With ±2% tolerance of dl, the wavelength sensitivity is unaffected. In order to ensure the loss peak shift is as minor as possible, we suggest the fabrication tolerance of dl be controlled under ±2%, which is technically feasible. Overall, the reported sensor exhibits considerable repeatability and stability when the structure parameters tg, h, and ds are fabricated within ±5% tolerance and dl within ±2% tolerance. Moreover, gold is very stable. Liquid toluene and gold are chemically nonreactive. As an organic compound, toluene does not corrode silica. Since toluene is packaged in the PCF, volatility can be avoided. The material and structure design helps the sensor stay stable during the detecting process.
Manufacturing is an essential part of the proposed sensor to be practically applied. In Figure 15, the manufacturing process of the reported flat PCF plasmonic sensor is illustrated. We suggest the following ways by which our sensor can be implemented. The stack-and-draw method [37] can be adopted to fabricate the PCF structure. Silica tubes with good geometric dimensions and optical surfaces are selected. Capillaries of different diameters are drawn through a drawing tower after rigorous cleaning. The drawn capillaries are tightly packed according to the designed structure. The preform stacking configuration of the proposed sensor is shown in Figure 15. Solid rods, thick-wall, and thin-wall rods are used to form cavities of different sizes. The stacked rods are drawn in a jacket through a high-temperature furnace that is heated to 1850–1900 °C [38] to soften. The cane is cut into the desired length. Using the side polishing method [39], the gold coating surface is produced. The gold film is then coated on the PCF. The deposition process can be realized by chemical vapor deposition (CVD) [40], atomic layer deposition (ALD) [41], and other methods [42]. Next, air holes, except for the selected liquid-filled ones, are sealed with UV glue. UV glue is hardened under a UV radiator. The gold film on the inner air holes can also be deposited by the aforementioned methods. Liquid toluene is then pumped into the selected air holes in a vacuum [43]. In the next step, the experimental realization of the proposed work is expected to examine and improve our structure.

6. Conclusions

In this paper, a sensitive and compact RI-temperature PCF sensor based on SPR is presented. The flat RI detection channel is coated with gold film. The temperature detection channel is composed of two liquid toluene-filled air holes and incorporated with a gold film. The large thermos-optical coefficient of toluene improves the temperature sensitivity. The detection of temperature and RI takes place in the x- and y- polarization, respectively, to avoid the detection crossover. By optimizing the structural parameters of the sensor, the detection sensitivity is improved. A maximum wavelength sensitivity of −5 nm/°C is achieved in the temperature range of −30–40 °C. An excellent optimal wavelength sensitivity of 17,000 nm/RIU is accomplished in the RI range from 1.32 to 1.41. The simulation results show that the proposed sensor possesses higher sensitivity than the previously reported structures. For temperature sensing, the fitting result of the resonance wavelength shows good linearity with an excellent R2 of 0.9935. For RI sensing, polynomial fitting of the resonance wavelength also gives the extremely high fitting coefficient R2 of 0.99896. The proposed sensor shows an ideal detecting resolution of 5.88 × 10⁻⁶ RIU and 0.02 °C for RI and temperature, respectively. The best amplitude sensitivity can be up to 354.39 RIU−1. The best value of FOM is 216.74 RIU−1. The sensor shows good repeatability when tg, h, and ds are fabricated within ±5% tolerance and dl within ±2% tolerance. In addition, the proposed sensor structure can be easily manufactured. The flat polishing area of the gold layer reduces the manufacturing difficulty. Due to the characteristics of high sensitivity, simple structure, and flexible operation, the novel flat PCF sensor has a promising future in environmental monitoring, chemical inspection, and many other fields.

Author Contributions

Conceptualization, Methodology, Formal analysis, Writing, W.A.; Writing—Review and Editing, Supervision, Funding acquisition, C.L.; Writing—Review and Editing, D.W.; Supervision, W.C. and S.G. (Shijing Guo); Funding acquisition, S.G. (Song Gao) and C.Z. All authors have read and agreed to the published version of the manuscript.

Funding

This work was supported by the National Natural Science Foundation of China (Grant no. 61905091, 62104080, 62005095).

Institutional Review Board Statement

Not applicable.

Informed Consent Statement

Not applicable.

Data Availability Statement

Not applicable.

Acknowledgments

The authors thank the National Natural Science Foundation of China for helping identify collaborators for this work.

Conflicts of Interest

The authors declare no conflict of interest.

References

  1. Homola, J. Surface Plasmon Resonance Sensors for Detection of Chemical and Biological Species. Chem. Rev. 2008, 108, 462–493. [Google Scholar] [CrossRef]
  2. Silva, S.; Roriz, P.; Frazão, O. Refractive Index Measurement of Liquids Based on Microstructured Optical Fibers. Photonics 2014, 1, 516–529. [Google Scholar] [CrossRef] [Green Version]
  3. Qin, W.; Li, S.; Yao, Y.; Xin, X.; Xue, J. Analyte-filled core self-calibration microstructured optical fiber based plasmonic sensor for detecting high refractive index aqueous analyte. Opt. Lasers Eng. 2014, 58, 1–8. [Google Scholar] [CrossRef]
  4. Jorge, P.A.; Silva, S.O.; Gouveia, C.; Tafulo, P.; Coelho, L.; Caldas, P.; Viegas, D.; Rego, G.; Baptista, J.M.; Santos, J.L.; et al. Fiber optic-based refractive index sensing at INESC Porto. Sensors 2012, 12, 8371–8389. [Google Scholar] [CrossRef] [PubMed] [Green Version]
  5. Cao, S.; Shao, Y.; Wang, Y.; Wu, T.; Zhang, L.; Huang, Y.; Zhang, F.; Liao, C.; He, J.; Wang, Y. Highly sensitive surface plasmon resonance biosensor based on a low-index polymer optical fiber. Opt. Express 2018, 26, 3988–3994. [Google Scholar] [CrossRef] [Green Version]
  6. Klantsataya, E.; Jia, P.; Ebendorff-Heidepriem, H.; Monro, T.M.; Francois, A. Plasmonic Fiber Optic Refractometric Sensors: From Conventional Architectures to Recent Design Trends. Sensors 2016, 17, 12. [Google Scholar] [CrossRef] [Green Version]
  7. Chau, Y.-F.; Liu, C.-Y.; Yeh, H.-H.; Tsai, D.P. A Comparative Study of High Birefringence and Low Confinement Loss Photonic Crystal Fiber Employing Elliptical Air Holes in Fiber Cladding with Tetragonal Lattice. Prog. Electromagn. Res. B 2010, 22, 39–52. [Google Scholar] [CrossRef] [Green Version]
  8. Meng, X.; Li, J.; Guo, Y.; Li, S.; Zhang, S.; Liu, Y.; Cheng, T. Analysis of Double Peak Detection in a D-Shaped Photonic Crystal Fiber Plasmonic Sensor. Plasmonics 2021, 16, 761–768. [Google Scholar] [CrossRef]
  9. Siddik, A.B.; Hossain, S.; Paul, A.K.; Rahman, M.; Mollah, A. High sensitivity property of dual-core photonic crystal fiber temperature sensor based on surface plasmon resonance. Sens. Bio-Sens. Res. 2020, 29, 100350. [Google Scholar] [CrossRef]
  10. Zhang, Y.; Chen, H.; Wang, M.; Liu, Y.; Fan, X.; Chen, Q.; Wu, B. Simultaneous measurement of refractive index and temperature of seawater based on surface plasmon resonance in a dual D-type photonic crystal fiber. Mater. Res. Express 2021, 8, 085201. [Google Scholar] [CrossRef]
  11. Zhao, Y.; Wua, Q.-L.; Zhanga, Y.-N. Theoretical analysis of high-sensitive seawater temperature and salinity measurement based on C-type micro-structured fiber. Sens. Actuators B 2018, 258, 822–828. [Google Scholar] [CrossRef]
  12. Chen, A.; Yu, Z.; Dai, B.; Li, Y. Highly Sensitive Detection of Refractive Index and Temperature Based on Liquid-Filled D-Shape PCF. IEEE Photonics Technol. Lett. 2021, 33, 529–532. [Google Scholar] [CrossRef]
  13. Li, B.; Zhang, F.; Yan, X.; Zhang, X.; Wang, F.; Li, S.; Cheng, T. Numerical Analysis of Dual-Parameter Optical Fiber Sensor With Large Measurement Range Based on Surface Plasmon Resonance. IEEE Sens. J. 2021, 21, 10719–10725. [Google Scholar] [CrossRef]
  14. Yu, X.; Zhang, Y.; Pan, S.; Shum, P.; Yan, M.; Leviatan, Y.; Li, C. A selectively coated photonic crystal fiber based surface plasmon resonance sensor. J. Opt. 2009, 12, 015005. [Google Scholar] [CrossRef] [Green Version]
  15. Vial, A.; Grimault, A.-S.; Macías, D.; Barchiesi, D.; de la Chapelle, M.L. Improved analytical fit of gold dispersion: Application to the modeling of extinction spectra with a finite-difference time-domain method. Phys. Rev. B 2005, 71, 085416. [Google Scholar] [CrossRef]
  16. Johnson, P.B.; Christy, R.W. Optical Constants of the Noble Metals. Phys. Rev. B 1972, 6, 4370–4379. [Google Scholar] [CrossRef]
  17. Lin, K.; Lu, Y.; Luo, Z.; Zheng, R.; Wang, P.; Ming, H. Numerical and experimental investigation of temperature effects on the surface plasmon resonance sensor. Chin. Opt. Lett. 2009, 7, 428–431. [Google Scholar]
  18. Lawrence, W.E. Electron-electron scattering in the low-temperature resistivity of the noble metals. Phys. Rev. B 1976, 13, 5316–5319. [Google Scholar] [CrossRef]
  19. Holstein, T. Optical and Infrared Volume Absorptivity of Metals. Phys. Rev. 1954, 96, 535–536. [Google Scholar] [CrossRef]
  20. Ozdemir, S.K.; Turhan-Sayan, G. Temperature effects on surface plasmon resonance: Design considerations for an optical temperature sensor. J. Light. Technol. 2003, 21, 805–814. [Google Scholar] [CrossRef]
  21. Harvey, A.H.; Gallagher, J.S.; Sengers, J.L. Revised Formulation for the Refractive Index of Water and Steam as a Function of Wavelength, Temperature and Density. J. Phys. Chem. Ref. Data 1998, 27, 761–774. [Google Scholar] [CrossRef]
  22. Wang, R.; Yao, J.; Miao, Y.; Lu, Y.; Xu, D.; Luan, N.; Musideke, M.; Duan, L.; Hao, C. A reflective photonic crystal fiber temperature sensor probe based on infiltration with liquid mixtures. Sensors 2013, 13, 7916–7925. [Google Scholar] [CrossRef] [PubMed]
  23. Zhao, L.; Han, H.; Lian, Y.; Luan, N.; Liu, J. Theoretical analysis of all-solid D-type photonic crystal fiber based plasmonic sensor for refractive index and temperature sensing. Opt. Fiber Technol. 2019, 50, 165–171. [Google Scholar] [CrossRef]
  24. Hassani, A.; Skorobogatiy, M. Design criteria for microstructured-optical-fiberbased surface-plasmon-resonance sensors. J. Opt. Soc. Am. B 2007, 24, 1423–1429. [Google Scholar] [CrossRef]
  25. Otupiri, R.; Akowuah, E.K.; Haxha, S. Multi-channel SPR biosensor based on PCF for multi-analyte sensing applications. Opt. Express 2015, 23, 15716–15727. [Google Scholar] [CrossRef] [PubMed] [Green Version]
  26. Wang, S.; Li, S. Surface plasmon resonance sensor based on symmetrical side-polished dual-core photonic crystal fiber. Opt. Fiber Technol. 2019, 51, 96–100. [Google Scholar] [CrossRef]
  27. Hautakorpi, M.; Mattinen, M.; Ludvigsen, H. Surface-plasmon-resonance sensor based on three-hole microstructured optical fiber. Opt. Express 2008, 16, 8427–8432. [Google Scholar] [CrossRef]
  28. Gandhi, M.S.A.; Senthilnathan, K.; Babu, P.R.; Li, Q. Highly Sensitive Localized Surface Plasmon Polariton Based D-Type Twin-Hole Photonic Crystal Fiber Microbiosensor: Enhanced Scheme for SERS Reinforcement. Sensors 2020, 20, 5248. [Google Scholar] [CrossRef]
  29. Luan, N.; Wang, R.; Lv, W.; Lu, Y.; Yao, J. Surface plasmon resonance temperature sensor based on photonic crystal fibers randomly filled with silver nanowires. Sensors 2014, 14, 16035–16045. [Google Scholar] [CrossRef] [Green Version]
  30. Paul, A.K.; Hassan, M.Z.; Islam, M.R.; Zhu, J.G. Graphene/gold based photonic crystal fiber plasmonic temperature sensor for electric vehicle applications. In Proceedings of the 2019 22nd International Conference on Electrical Machines and Systems (ICEMS), Harbin, China, 11–14 August 2019. [Google Scholar]
  31. Qiu, S.; Yuan, J.; Zhou, X.; Qu, Y.; Yan, B.; Wu, Q.; Wang, K.; Sang, X.; Long, K.; Yu, C. Highly sensitive temperature sensing based on all-solid cladding dual-core photonic crystal fiber filled with the toluene and ethanol. Opt. Commun. 2020, 477, 126357. [Google Scholar] [CrossRef]
  32. Meng, F.; Wang, H.; Fang, D. Research on D-Shape Open-Loop PCF Temperature Refractive Index Sensor Based on SPR Effect. IEEE Photonics J. 2022, 14, 1–5. [Google Scholar] [CrossRef]
  33. Zhao, Q.; Liu, J.; Yang, H.; Liu, H.; Zeng, G.; Huang, B.; Jia, J. Double U-groove temperature and refractive index photonic crystal fiber sensor based on surface plasmon resonance. Appl. Opt. 2022, 61, 7225–7230. [Google Scholar] [CrossRef] [PubMed]
  34. Liu, C.; Zhang, Y.; Li, X.; Fan, X.; Chen, Q.; Wu, B.; Chen, H. A gold film coated dual-core photonic crystal fiber for refractive index and temperature sensing with high isolation. Opt. Fiber Technol. 2022, 72, 102975. [Google Scholar] [CrossRef]
  35. Yu, Y.-L.; Kishikawa, H.; Liaw, S.-K.; Goto, N.; Liu, W.-F. Simultaneous measurement of temperature and refractive index based on an SPR Silicon core fiber sensor with a fused silica grating design. Opt. Quantum Electron. 2022, 54, 63. [Google Scholar] [CrossRef]
  36. Reeves, W.H.; Knight, J.C.; Russell, P.S.J. Demonstration of ultra-flattened dispersion in photonic crystal fibers. Opt. Express 2002, 10, 609–613. [Google Scholar] [CrossRef]
  37. Mahdiraji, G.A.; Chow, D.M.; Sandoghchi, S.R.; Amirkhan, F.; Dermosesian, E.; Yeo, K.S.; Kakaei, Z.; Ghomeishi, M.; Poh, S.Y.; Gang, S.Y.; et al. Challenges and Solutions in Fabrication of Silica-Based Photonic Crystal Fibers: An Experimental Study. Fiber Integr. Opt. 2014, 33, 85–104. [Google Scholar] [CrossRef]
  38. Li, J.; Yan, H.; Dang, H.; Meng, F. Structure design and application of hollow core microstructured optical fiber gas sensor: A review. Opt. Laser Technol. 2021, 135, 106658. [Google Scholar] [CrossRef]
  39. Tseng, S.-M.; Chen, C.-L. Side-polished fibers. Appl. Opt. 1992, 31, 3438–3447. [Google Scholar] [CrossRef]
  40. Das, S.; Guha, S.; Das, P.P.; Ghadai, R.K. Analysis of morphological, microstructural, electrochemical and nano mechanical characteristics of TiCN coatings prepared under N2 gas flow rate by chemical vapour deposition (CVD) process at higher temperature. Ceram. Int. 2020, 46, 10292–10298. [Google Scholar] [CrossRef]
  41. Griffiths, M.B.E.; Pallister, P.J.; Mandia, D.J.; Barry, S.T. Atomic Layer Deposition of Gold Metal. Chem. Mater. 2016, 28, 44–46. [Google Scholar] [CrossRef]
  42. Wijaya, E.; Lenaerts, C.; Maricot, S.; Hastanin, J.; Habraken, S.; Vilcot, J.-P.; Boukherroub, R.; Szunerits, S. Surface plasmon resonance-based biosensors: From the development of different SPR structures to novel surface functionalization strategies. Curr. Opin. Solid State Mater. Sci. 2011, 15, 208–224. [Google Scholar] [CrossRef]
  43. Shakya, A.K.; Singh, S. Design of novel Penta core PCF SPR RI sensor based on fusion of IMD and EMD techniques for analysis of water and transformer oil. Measurement 2022, 188, 110513. [Google Scholar] [CrossRef]
Figure 1. Schematic diagram of the proposed flat PCF-SPR sensor.
Sensors 22 09028 g001
Figure 2. Schematic setup of the flat PCF plasmonic sensor.
Sensors 22 09028 g002
Figure 3. Dispersion relationship of (a) y- and (b) x-polarization core modes with SPP modes. The inset (i) (ii) (iii) is the electric field distribution and direction of core modes, SPP modes, and SPR, respectively.
Sensors 22 09028 g003
Figure 4. (a) CL spectrum of y-polarization core mode with various na from 1.32–1.41 at T = 25 °C. (b) Resonance wavelength and its polynomial fitting line with various na from 1.32–1.41 at T = 25 °C.
Sensors 22 09028 g004
Figure 5. (a) Amplitude sensitivity and (b) figure of merit with analyte RI changing from 1.32 to 1.41.
Sensors 22 09028 g005
Figure 6. (a) CL spectrum of x-polarization core mode under various T from −30–40 °C when na = 1.36. (b) Resonance wavelength and its linear fitting line under various T from −30–40 °C when na = 1.36.
Sensors 22 09028 g006
Figure 7. (a) CL spectrum of y-polarization core mode in RI sensing channel under different ambient temperatures T from −30 to 40 °C when na = 1.36 (solid line) and under T = 20 °C when na = 1.37 (dotted line). (b) CL spectrum of x-polarization core mode in temperature sensing channel for various na from 1.32–1.41 at T = 20 °C (solid line) and under T = 10 °C when na = 1.36 (dotted line).
Sensors 22 09028 g007
Figure 8. Loss spectra of (a) y-polarization core mode in RI sensing channel when analyte RI varies from 1.40 to 1.41, and (b) x-polarization core mode in temperature sensing channel under ambient temperature from 0 to 10 °C with different thicknesses of the Au film tg.
Sensors 22 09028 g008
Figure 9. Loss spectra of (a) y-polarization core mode in RI sensing channel when analyte RI varies from 1.40 to 1.41, and (b) x-polarization core mode in temperature sensing channel under ambient temperatures from 0 to 10 °C with different polishing depths of Au film h.
Sensors 22 09028 g009
Figure 10. Loss spectra of (a) y-polarization core mode in RI sensing channel when analyte RI varies from 1.40–1.41, and (b) x-polarization core mode in temperature sensing channel under ambient temperature from 0–10 °C with different diameter of air holes ds.
Sensors 22 09028 g010
Figure 11. Loss spectra of (a) y-polarization core mode in RI sensing channel when analyte RI varies from 1.40 to 1.41, and (b) x-polarization core mode in temperature sensing channel under ambient temperature from 0 to 10 °C with different diameter of air holes dl.
Sensors 22 09028 g011
Figure 12. Tolerance test on RI sensing channel of the structure parameter (a) tg, (b) h, (c) ds, and (d) dl for ±5% deviation.
Sensors 22 09028 g012
Figure 13. Wavelength sensitivity of (a) RI sensing for structure parameter tg, h, ds, and dl with ±5% tolerance, and (b) temperature sensing for structure parameter tg, h, ds with ±5% tolerance, and dl with ±2%, ±3%, ±5% tolerance.
Sensors 22 09028 g013
Figure 14. Tolerance test on temperature sensing channel of the structure parameter (a) tg, (b) h, (c) ds for ±5% deviation, and (d) dl for ±2%, ±3%, ±5% deviation.
Sensors 22 09028 g014
Figure 15. Manufacturing process of the proposed flat PCF plasmonic sensor.
Sensors 22 09028 g015
Table 1. Performance comparison between the proposed sensor and previously reported sensors.
Structure Configuration RI Range Temp. Range Operating Wavelength [nm] Wavelength Sensitivity (RI/Temp.) Amplitude Sensitivity (RI/Temp.)
[RIU−1/°C−1]
Wavelength Resolution (RI/Temp.)
[RIU/°C]
FOM (RI) [RIU−1]
Liquid-filled D-shape PCF [12]1.35–1.4020–60 °C550–8503940 nm/RIU/
1.075 nm/°C
152.23/
539.42
N/AN/A
No-core fiber [13]1.33–1.440–180 °C400–120012,530 nm/RIU/
−3.465 nm/°C
N/AN/AN/A
Double U-groove PCF [33]1.32–1.4−30–50 °C1300–25004715 nm/RIU/
18 nm/°C
48.44/
1.01 × 10⁻¹
2.12 × 10⁻⁵/
5.55 × 10⁻³
N/A
Dual-core D-shaped PCF [34]1.33–1.39−50–40 °C500–9008100 nm/RIU/
1.3 nm/°C
N/AN/AN/A
Grating-assisted SPR silicon core sensor [35]1.28–1.3815–40 °C1800–28001949.8 nm/RIU/
1.6 nm/°C
N/AN/AN/A
Proposed Flat PCF Plasmonic Sensor1.32–1.41−30–40 °C500–150017,000 nm/RIU/
−5 nm/°C
354.39/
N/A
5.88 × 10⁻⁶/
0.02
216.74
Publisher’s Note: MDPI stays neutral with regard to jurisdictional claims in published maps and institutional affiliations.

