
Estimation of Water Depth on Road Surfaces Using Accelerometric Signals
 ,
,  ,
,  and
and 
Abstract
:1. Introduction
- Where is the appropriate location for the accelerometers on a wheel arch?
- How can accelerometric signals be processed to extract the relevant information?
- What is the relationship between accelerometric signals and actual water depths?
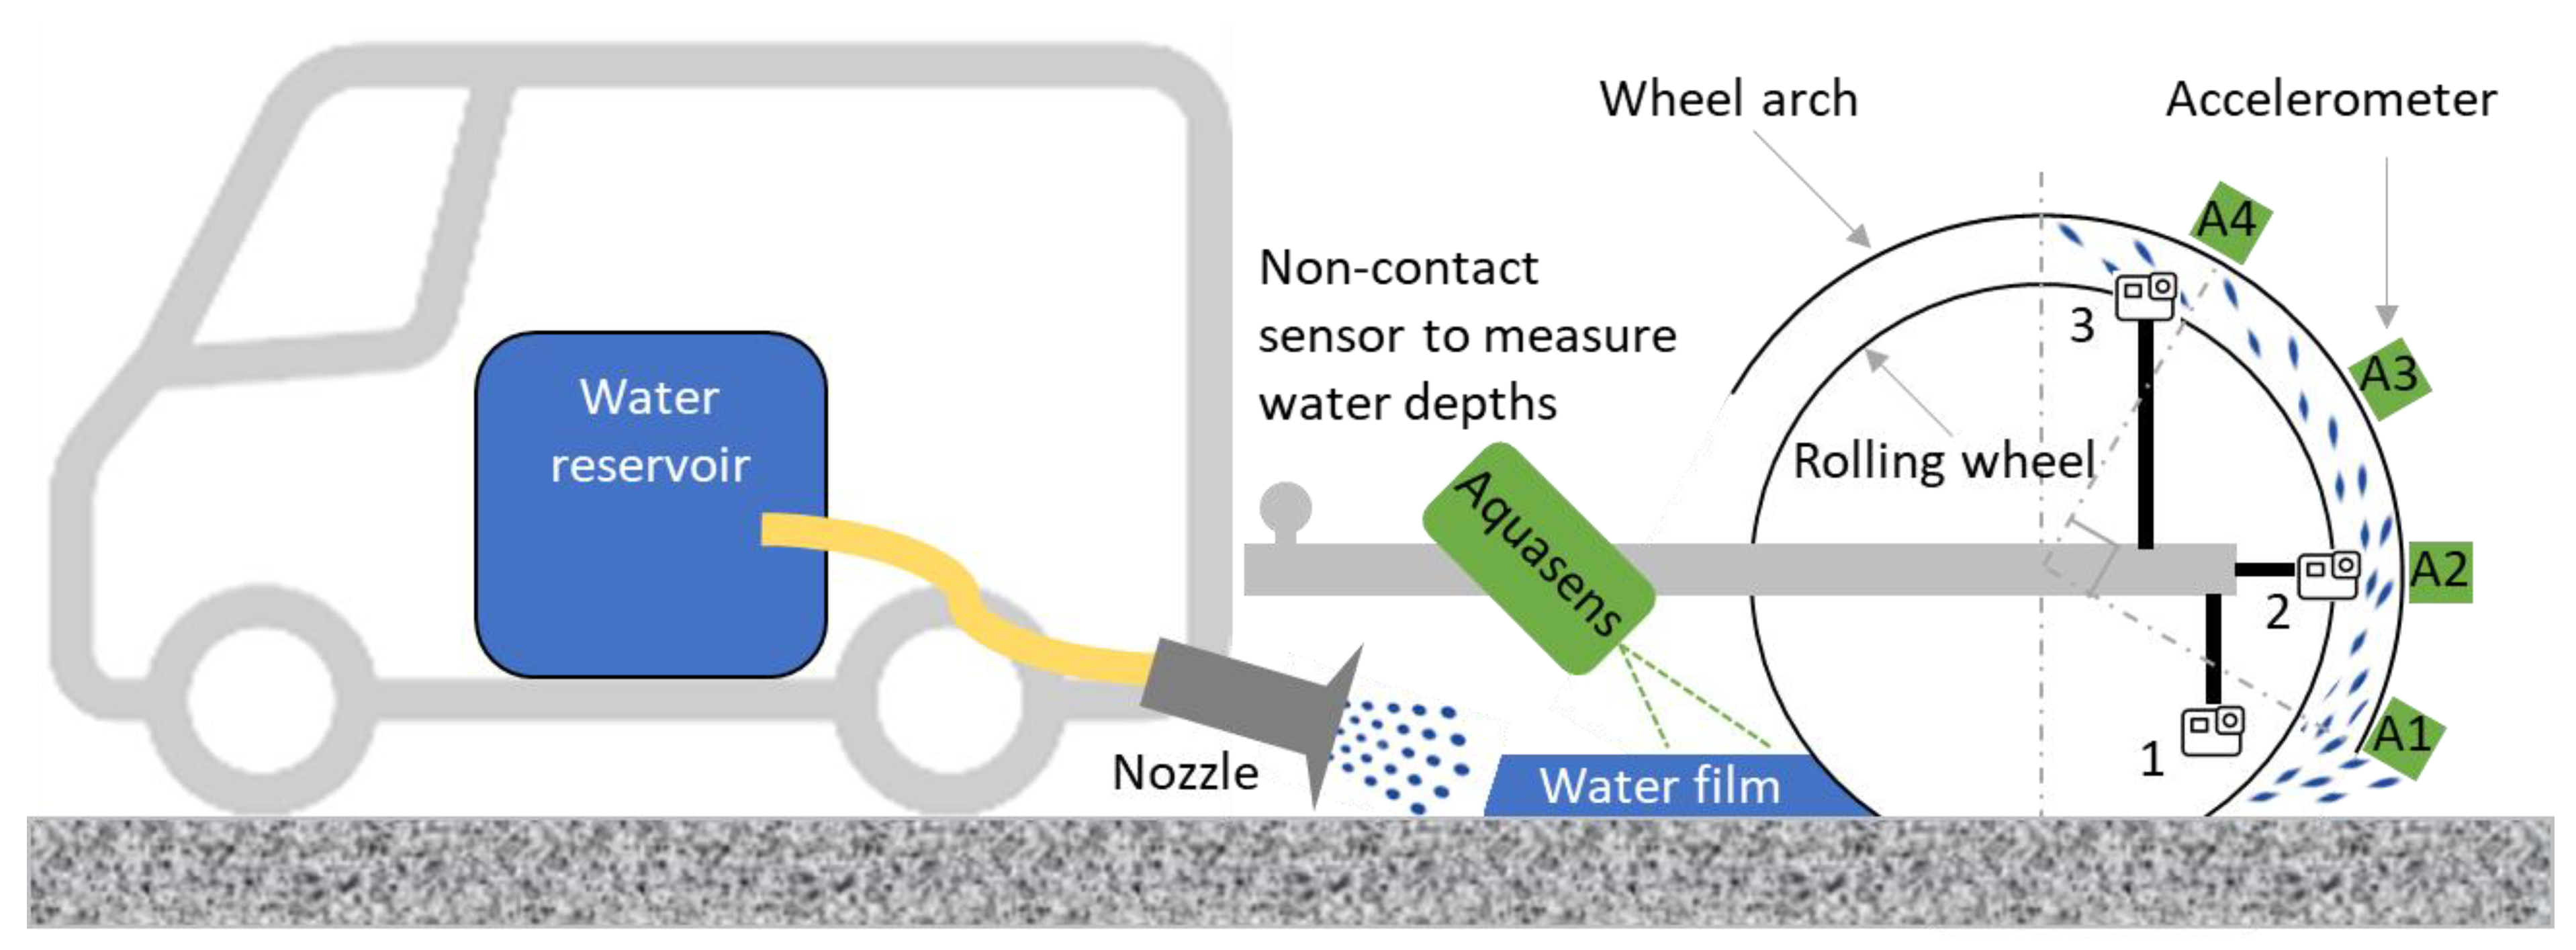
2. Methodology
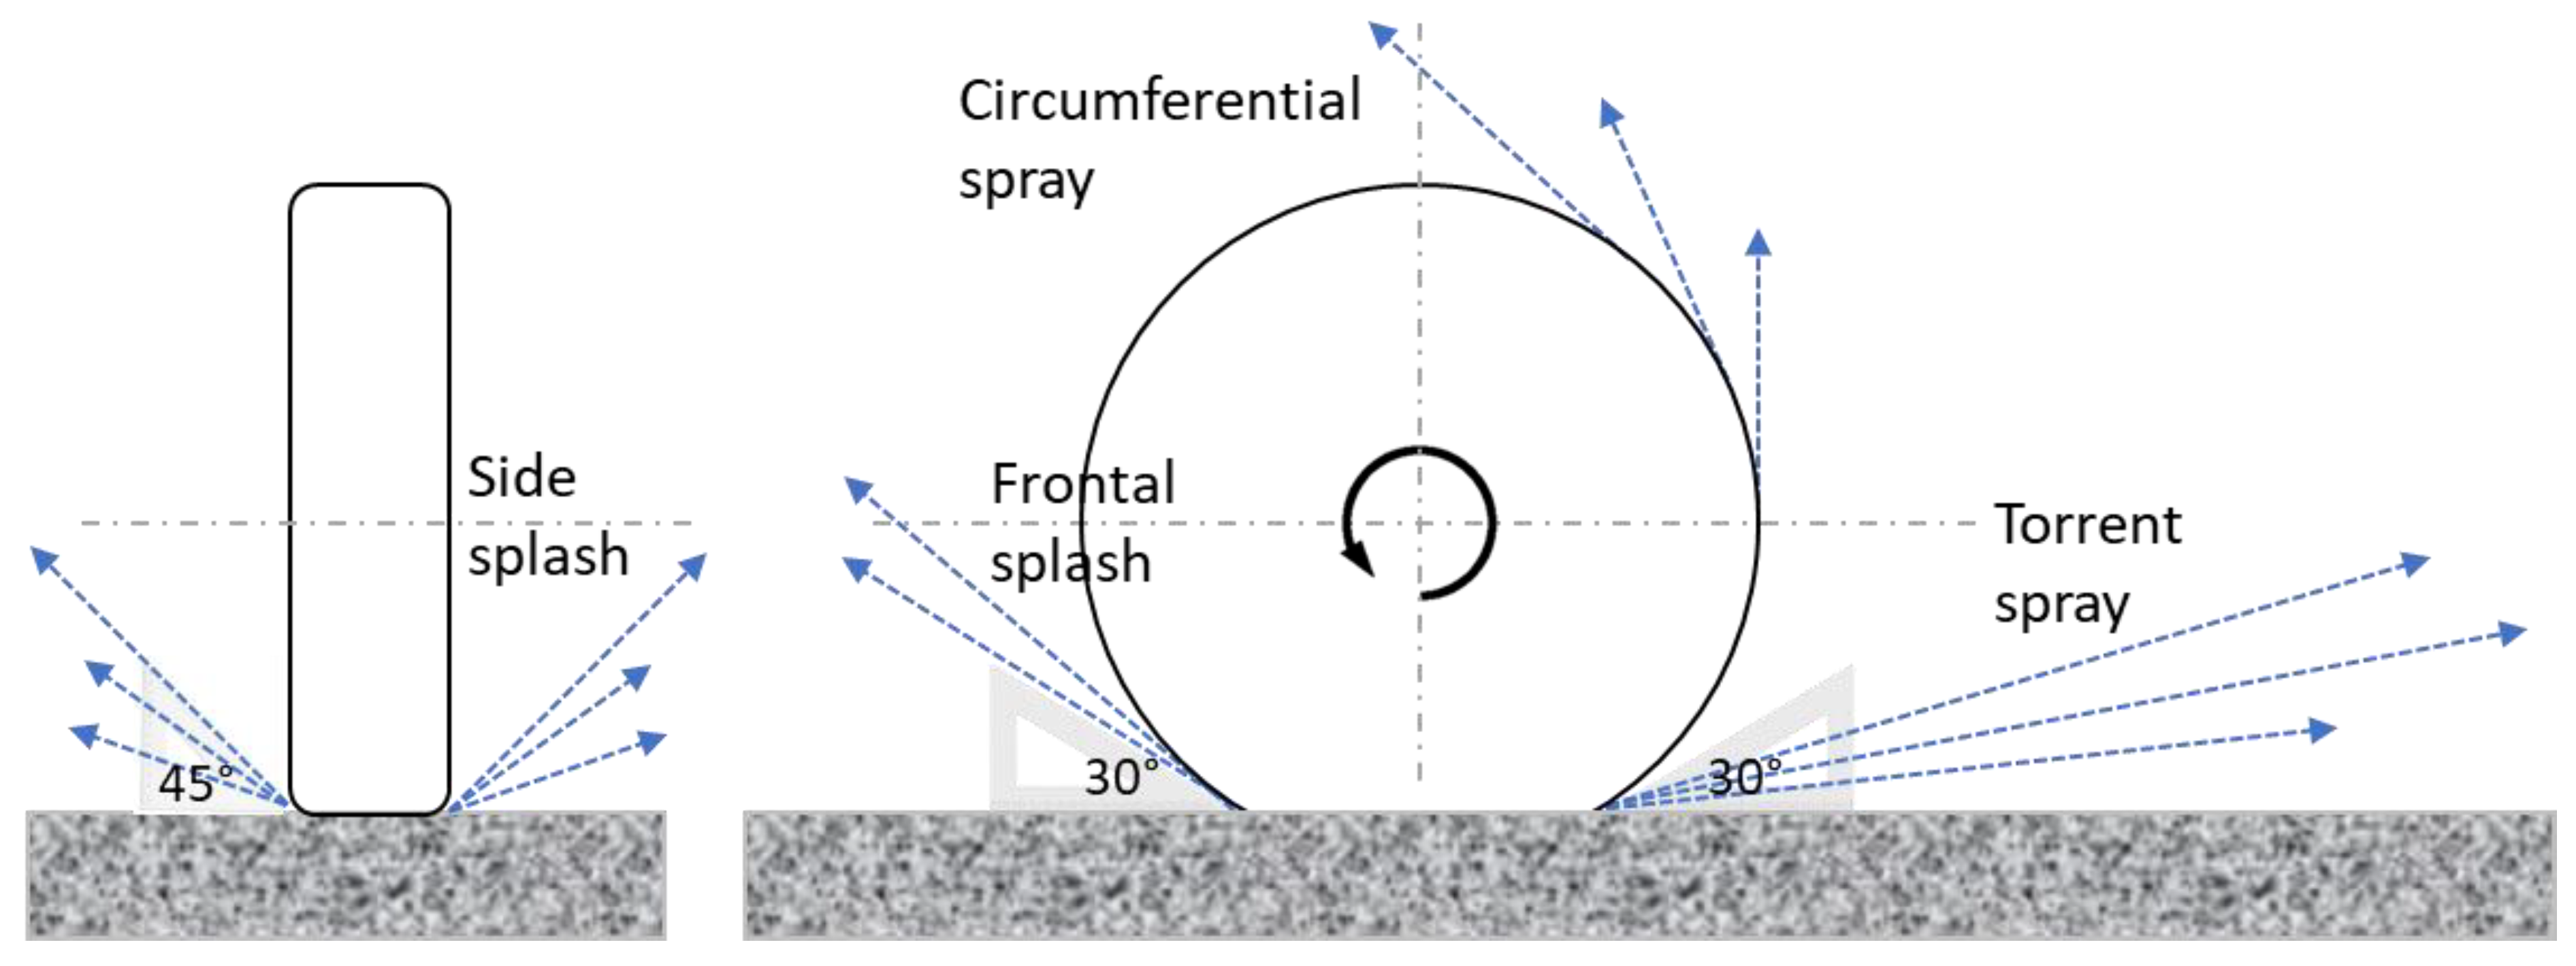
- In the first step, efforts are made to visualize water sprays. High-speed cameras are used for this purpose. Videos are used to better understand the distribution of water droplets and, depending on the spray intensity, choose appropriate locations for the accelerometers on the wheel arch.
- In the second step, signals are processed to extract relevant information with respect to road wetness.
- In the third step, correlation is established between indicators calculated from accelerometers’ signals and water depths.
3. Experimental Program
3.1. Sensors
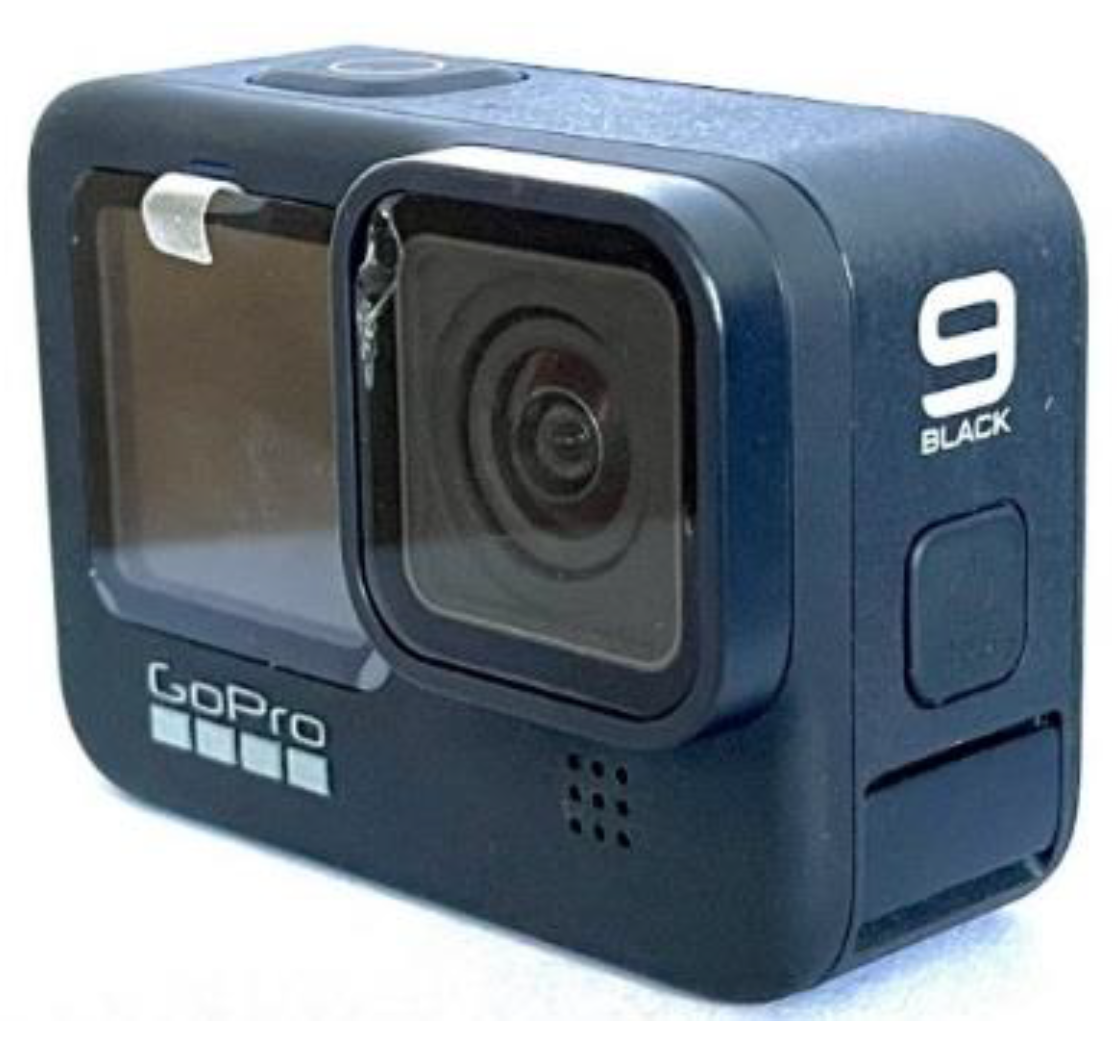
3.1.1. Accelerometers
3.1.2. High-Speed Camera
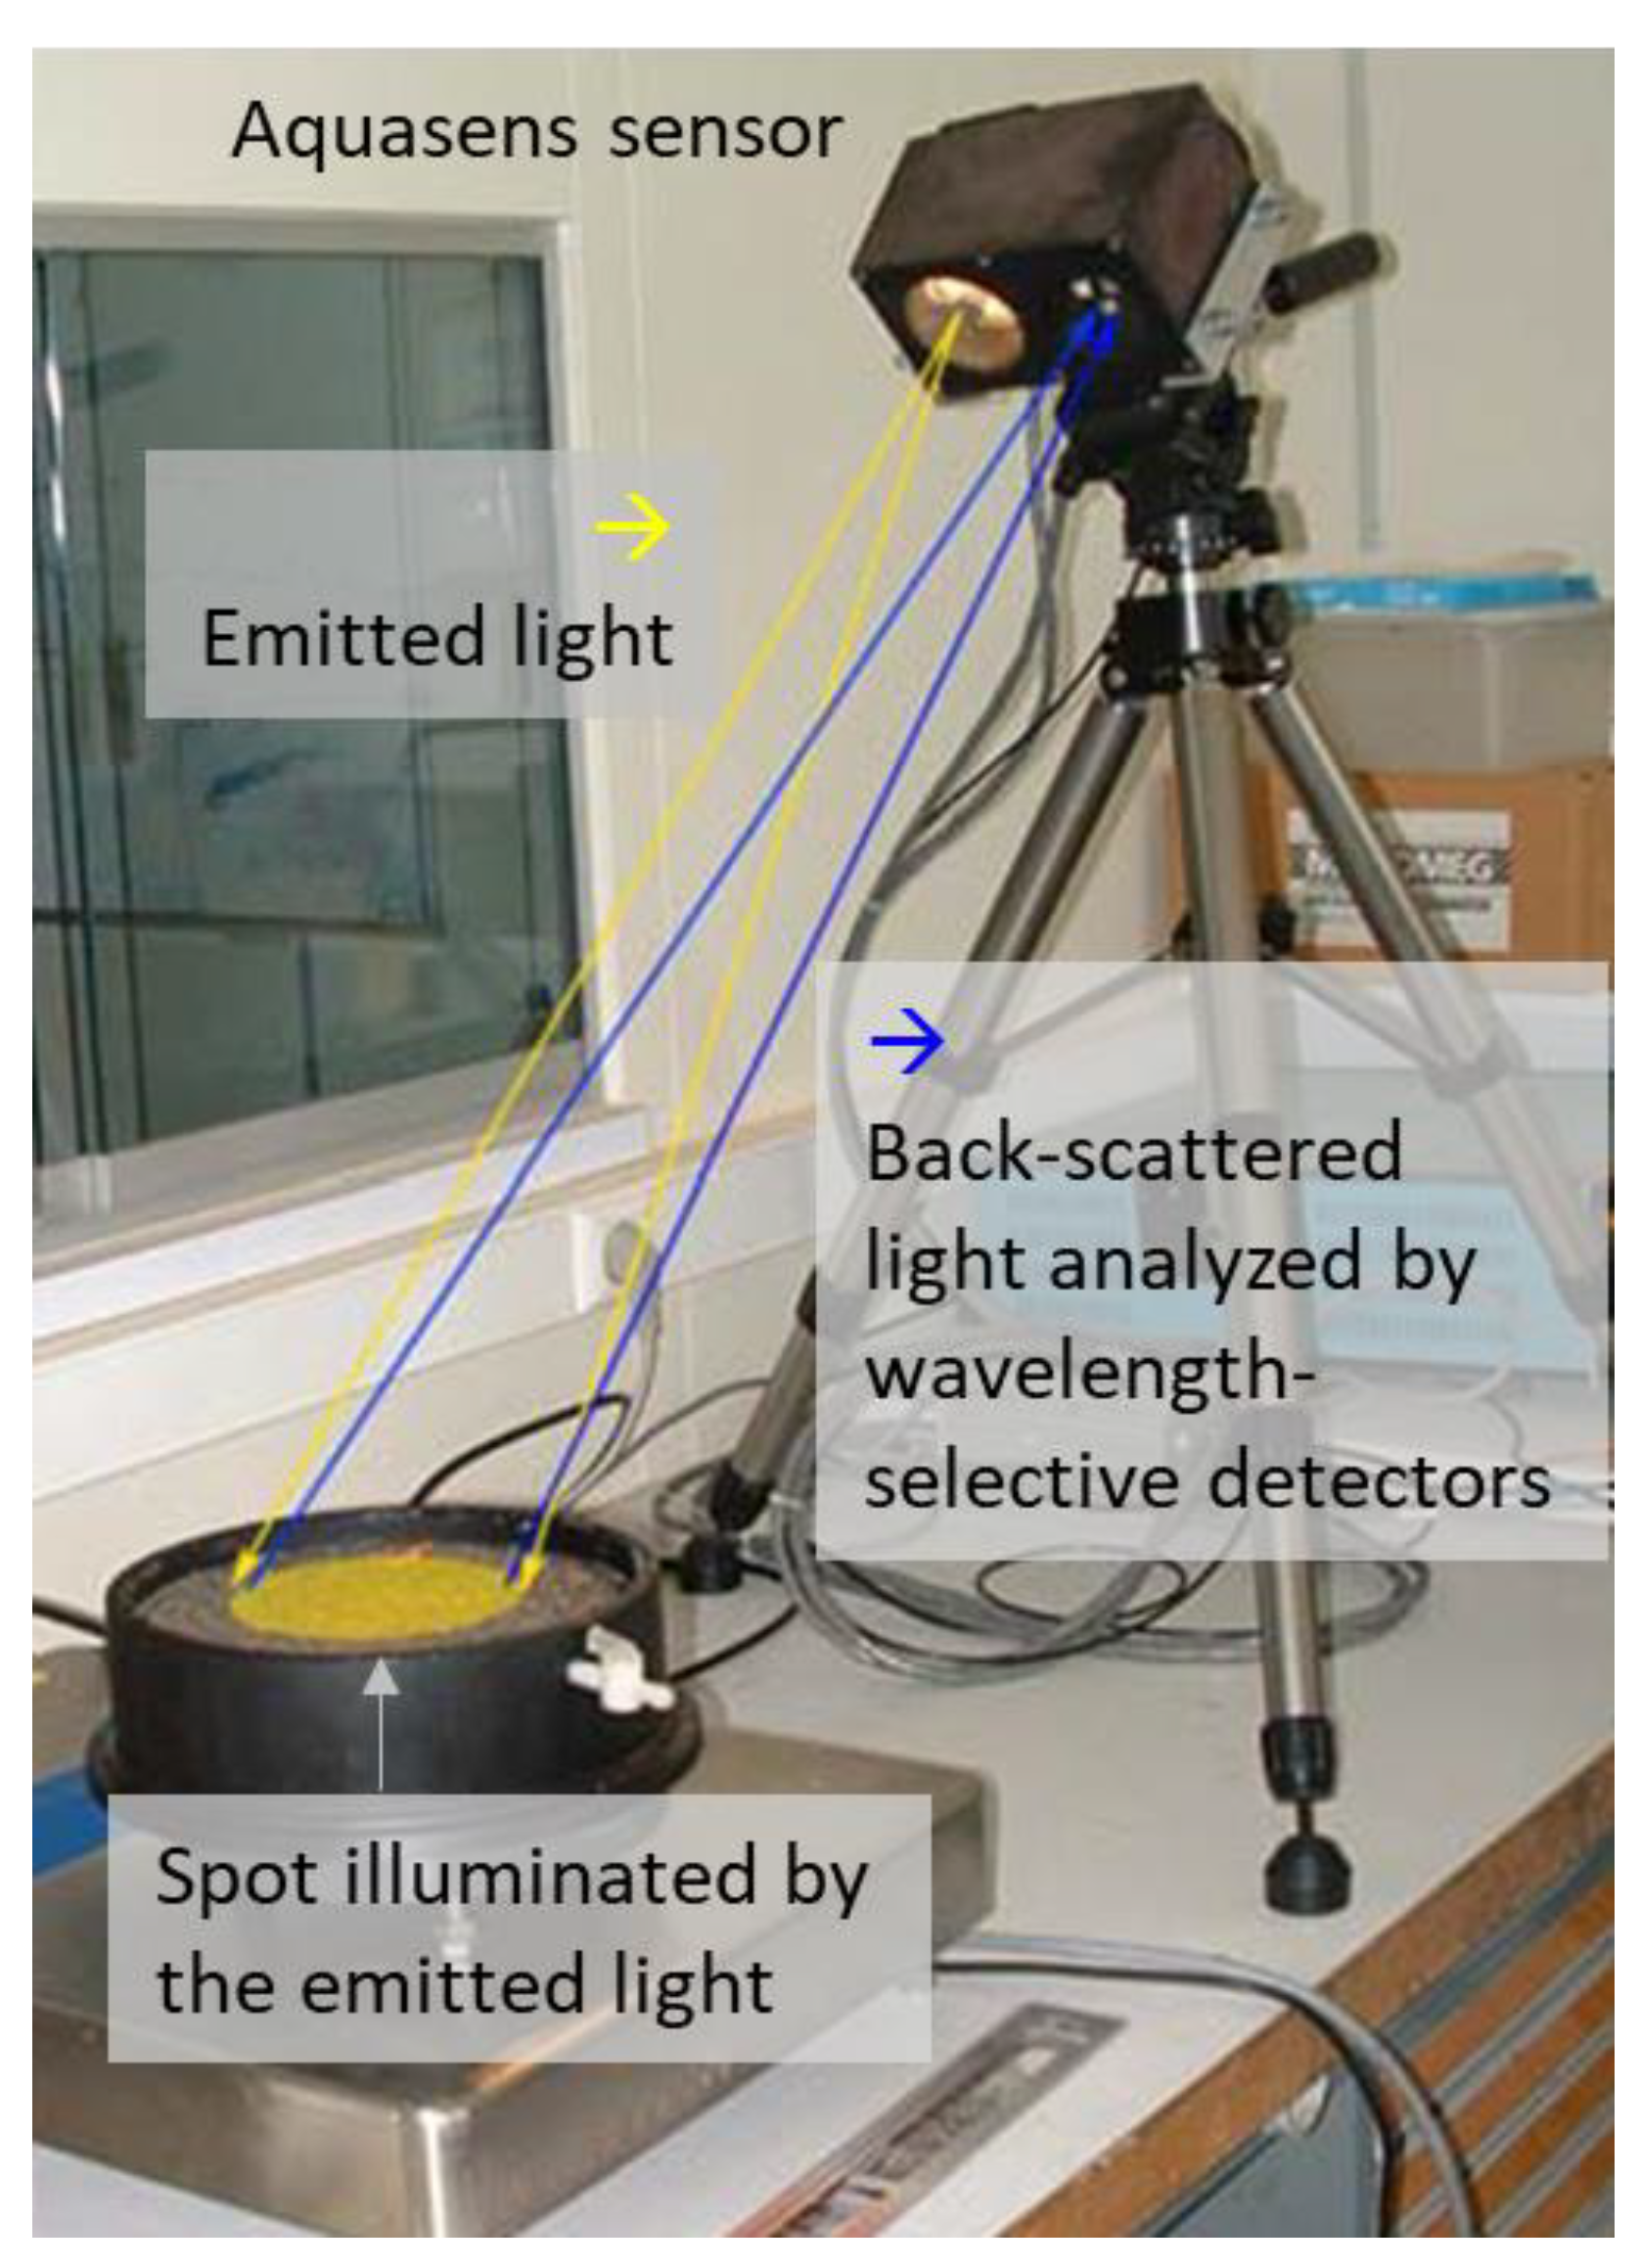
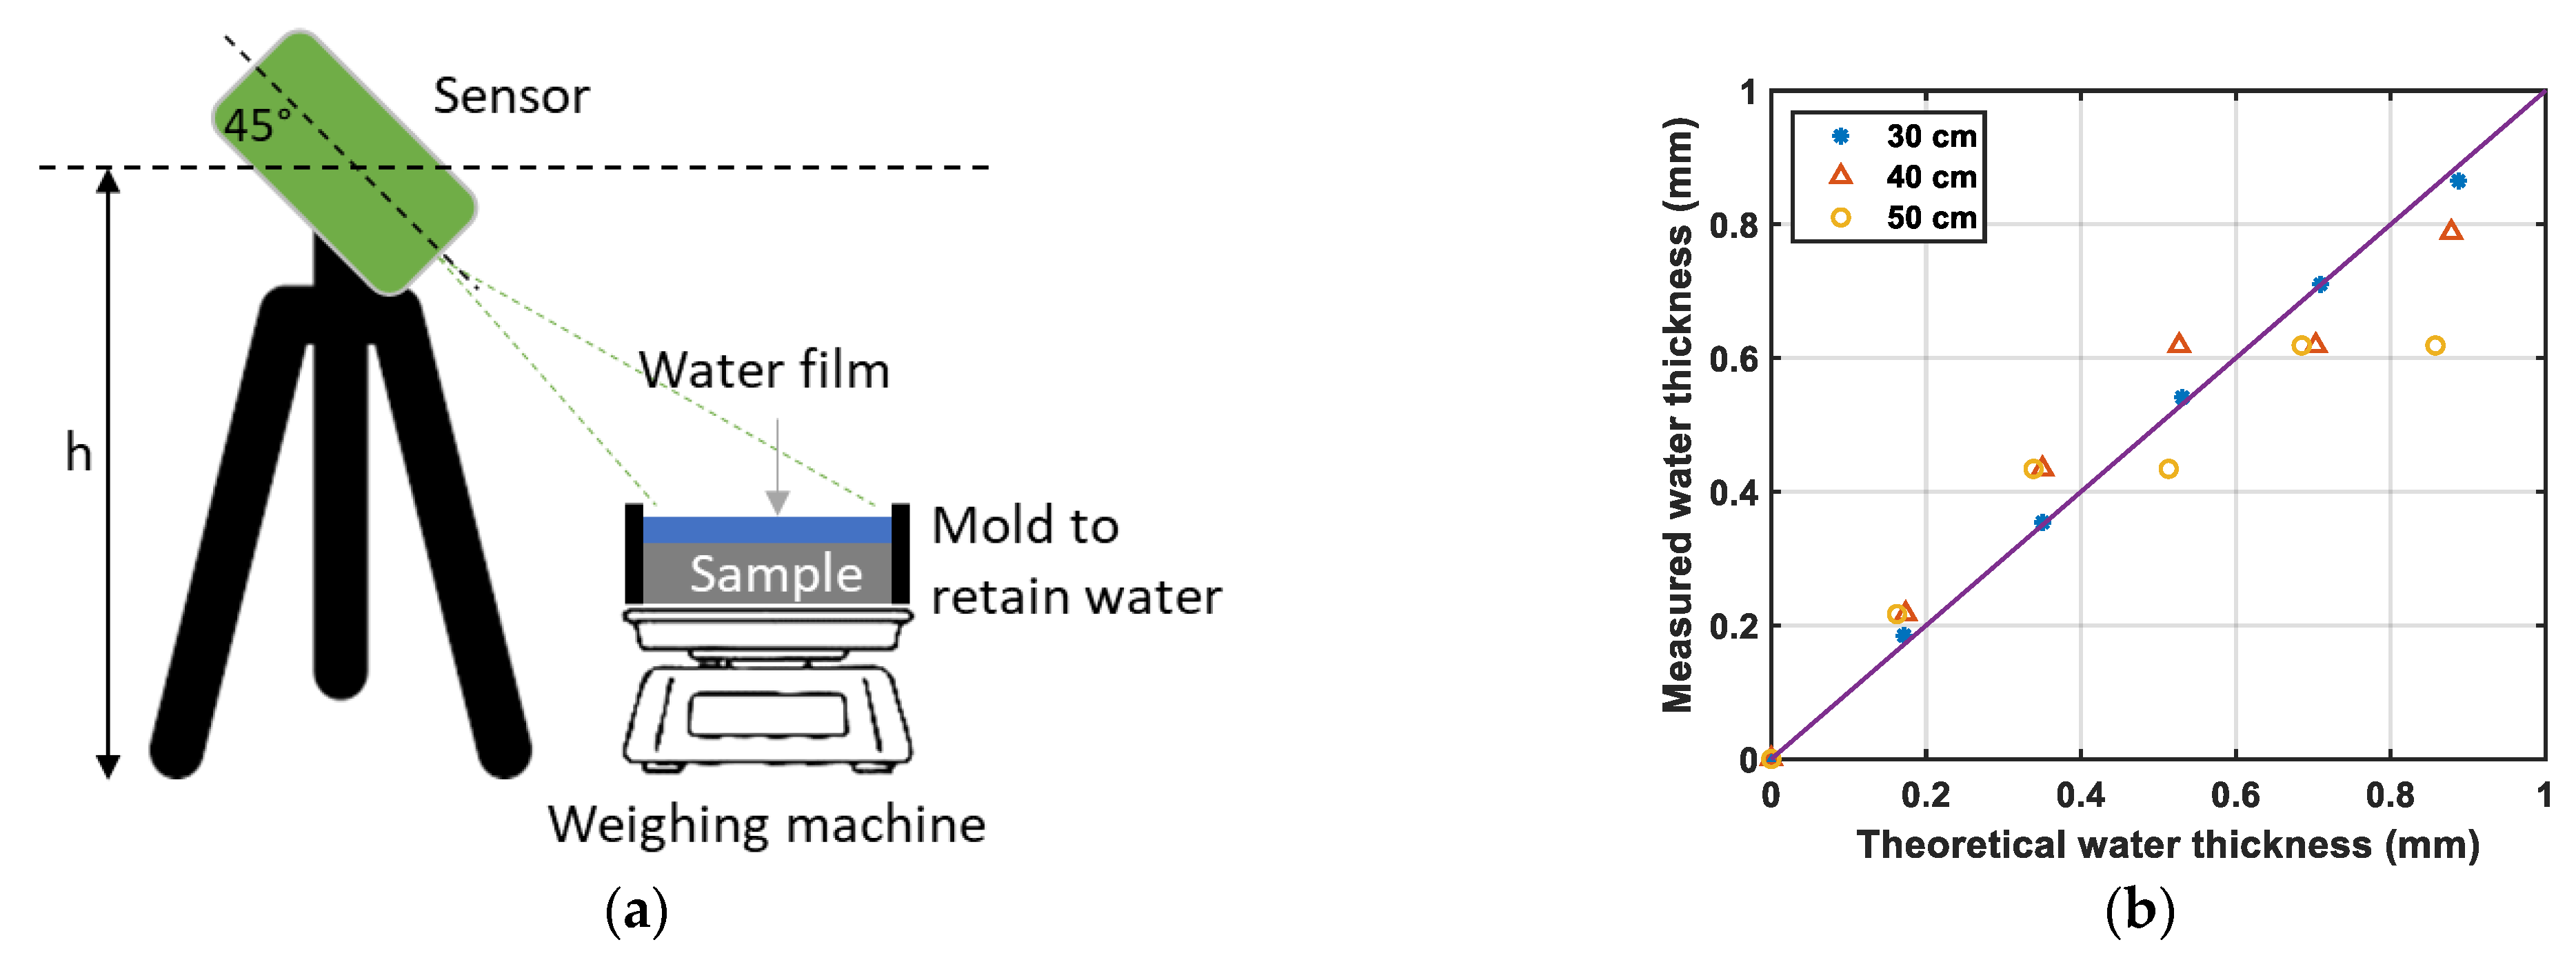
3.1.3. Noncontact Sensor to Measure Water Depths
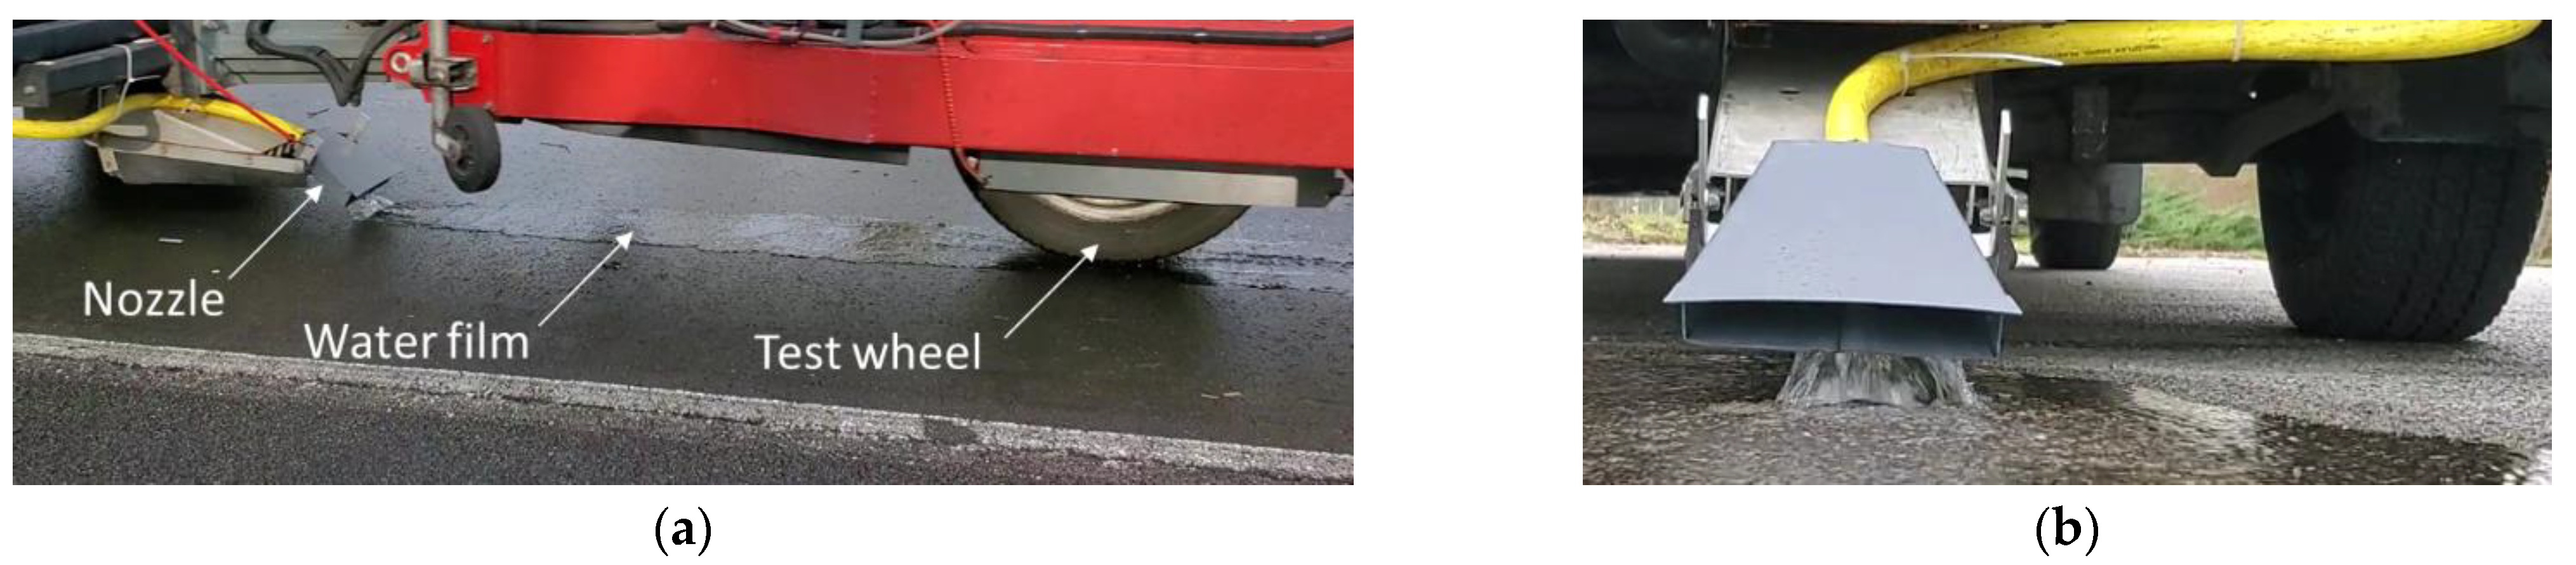
3.2. Test Setup
3.2.1. Setup to Spread a Water Film on the Test Surface
3.2.2. Setup to Measure the Impact of Water Droplets
3.2.3. Setup to Visualize Water Droplets
3.3. Test Program
4. Results
4.1. Visualization of Water Sprays
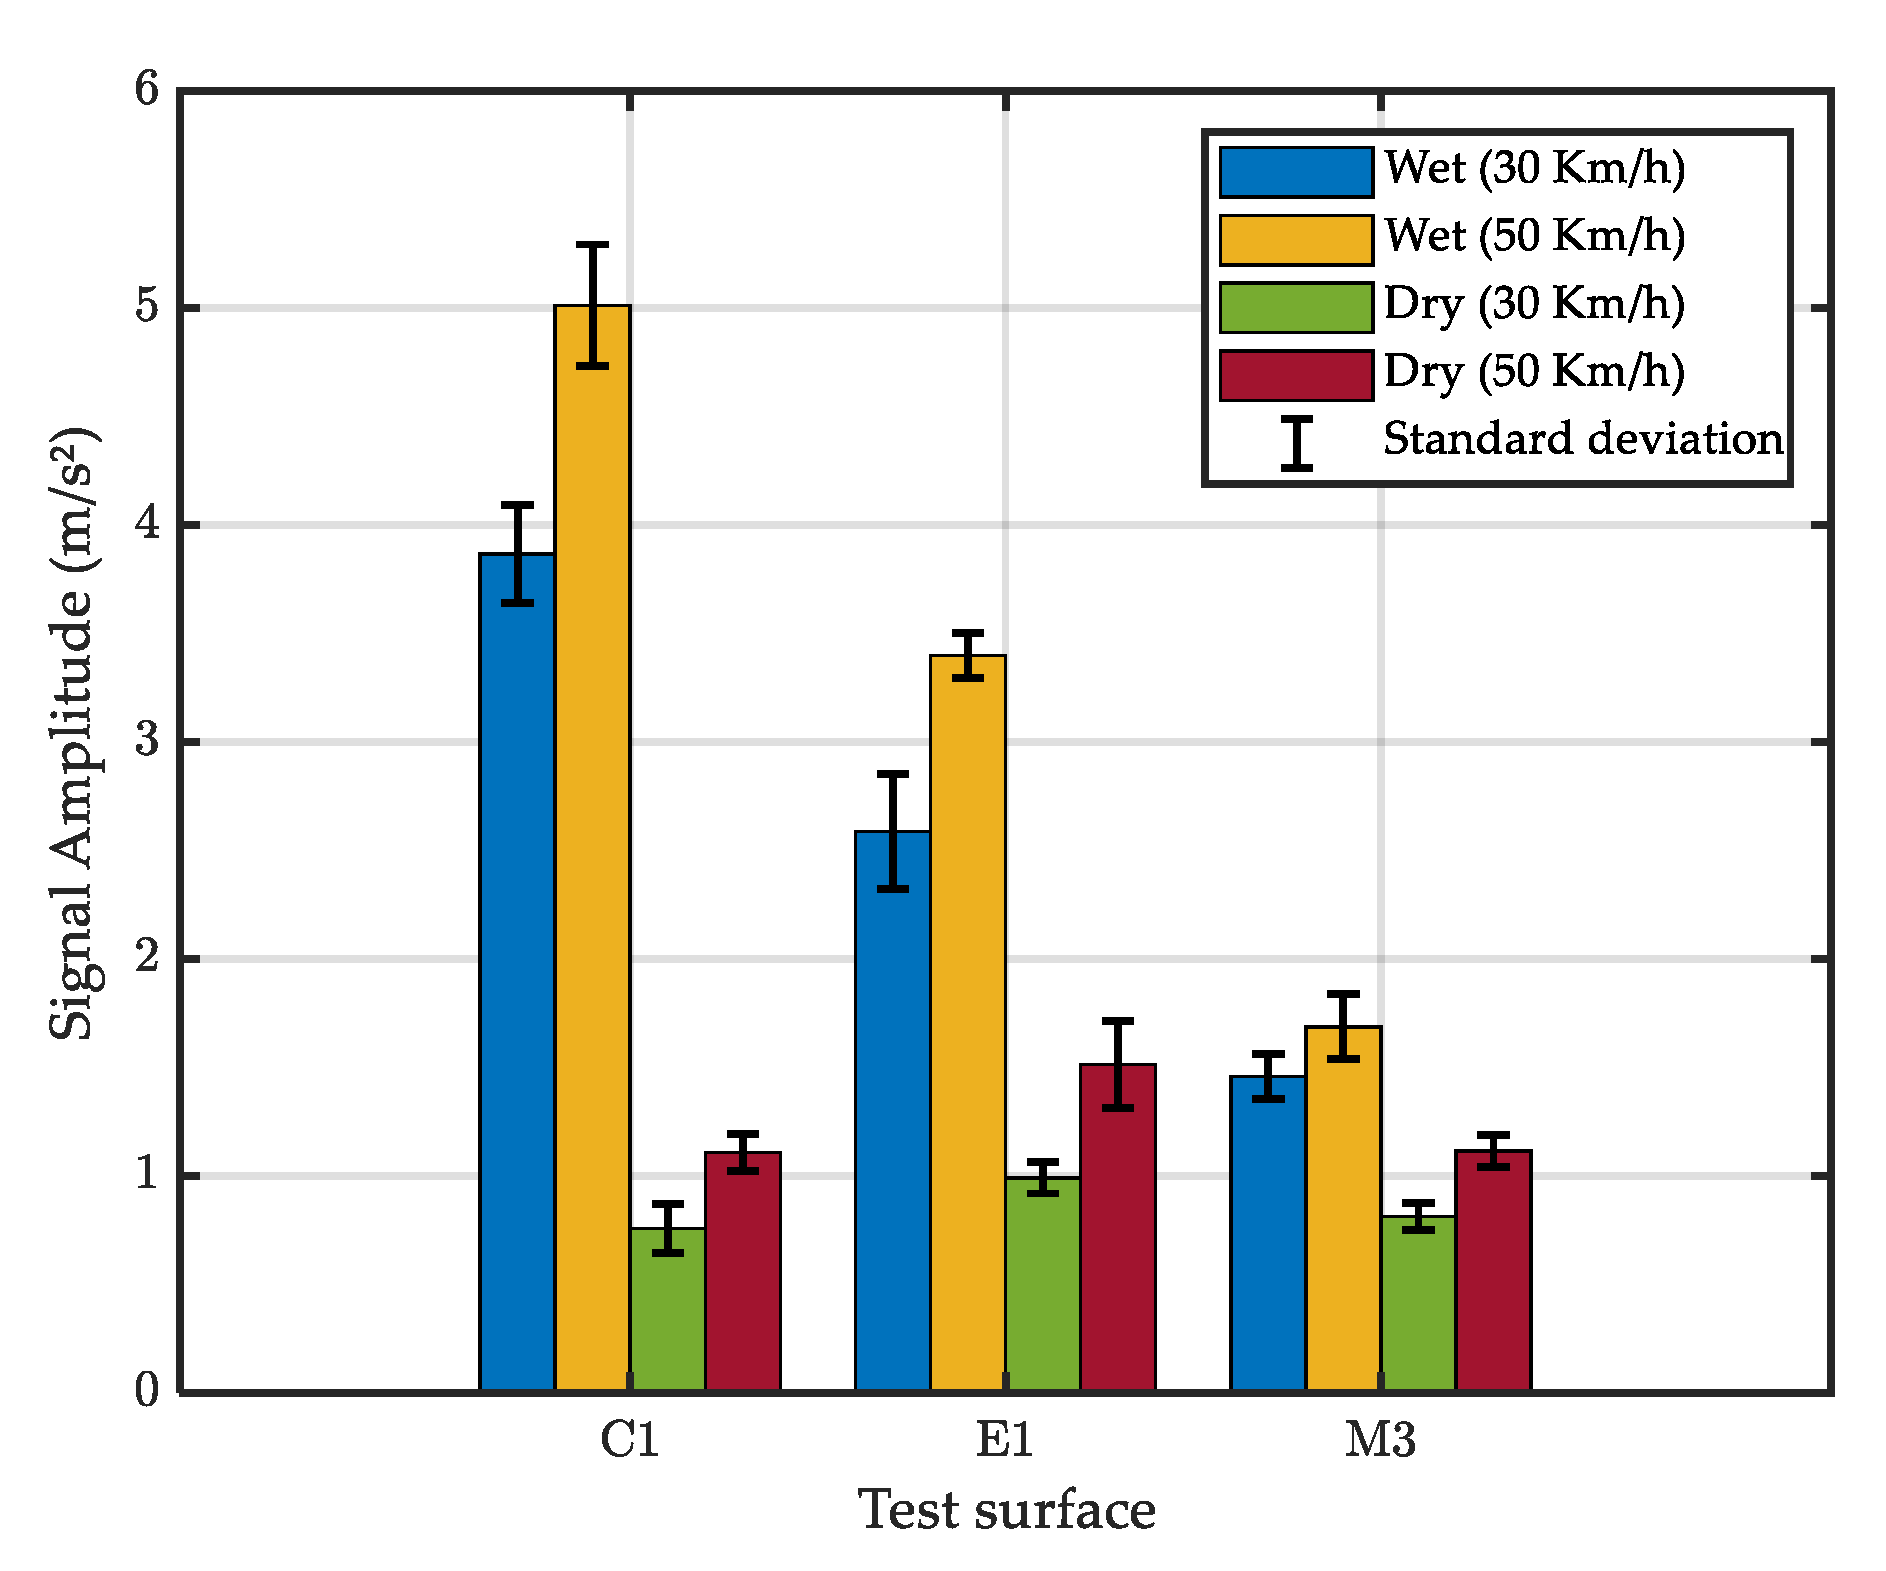
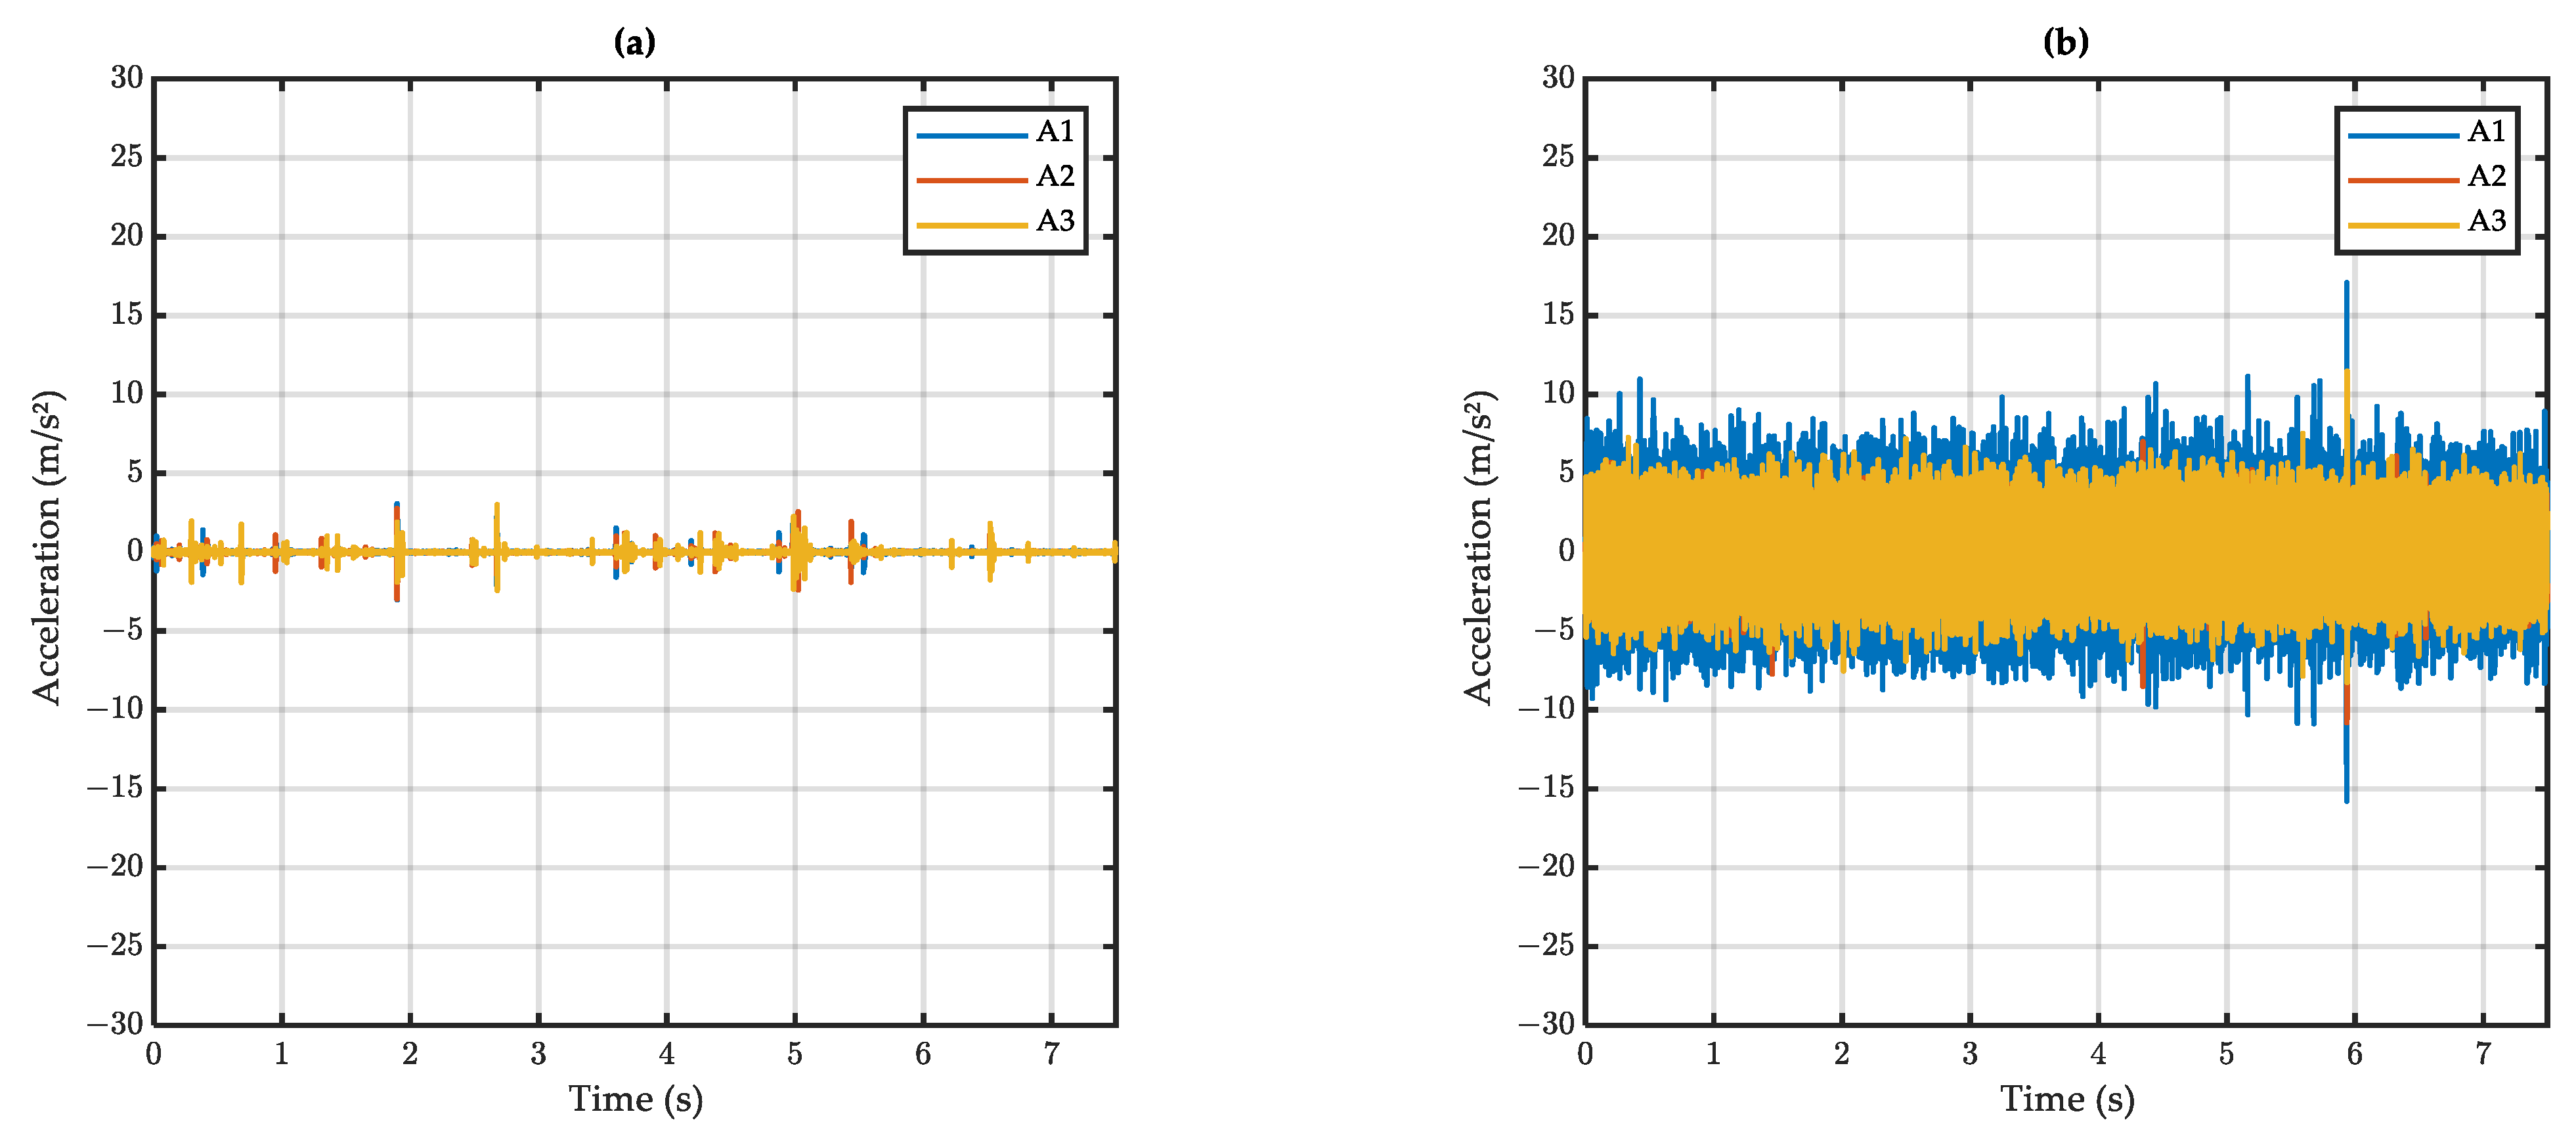
4.2. Analysis of Signals
4.2.1. Raw Signals
4.2.2. Filtered Signals
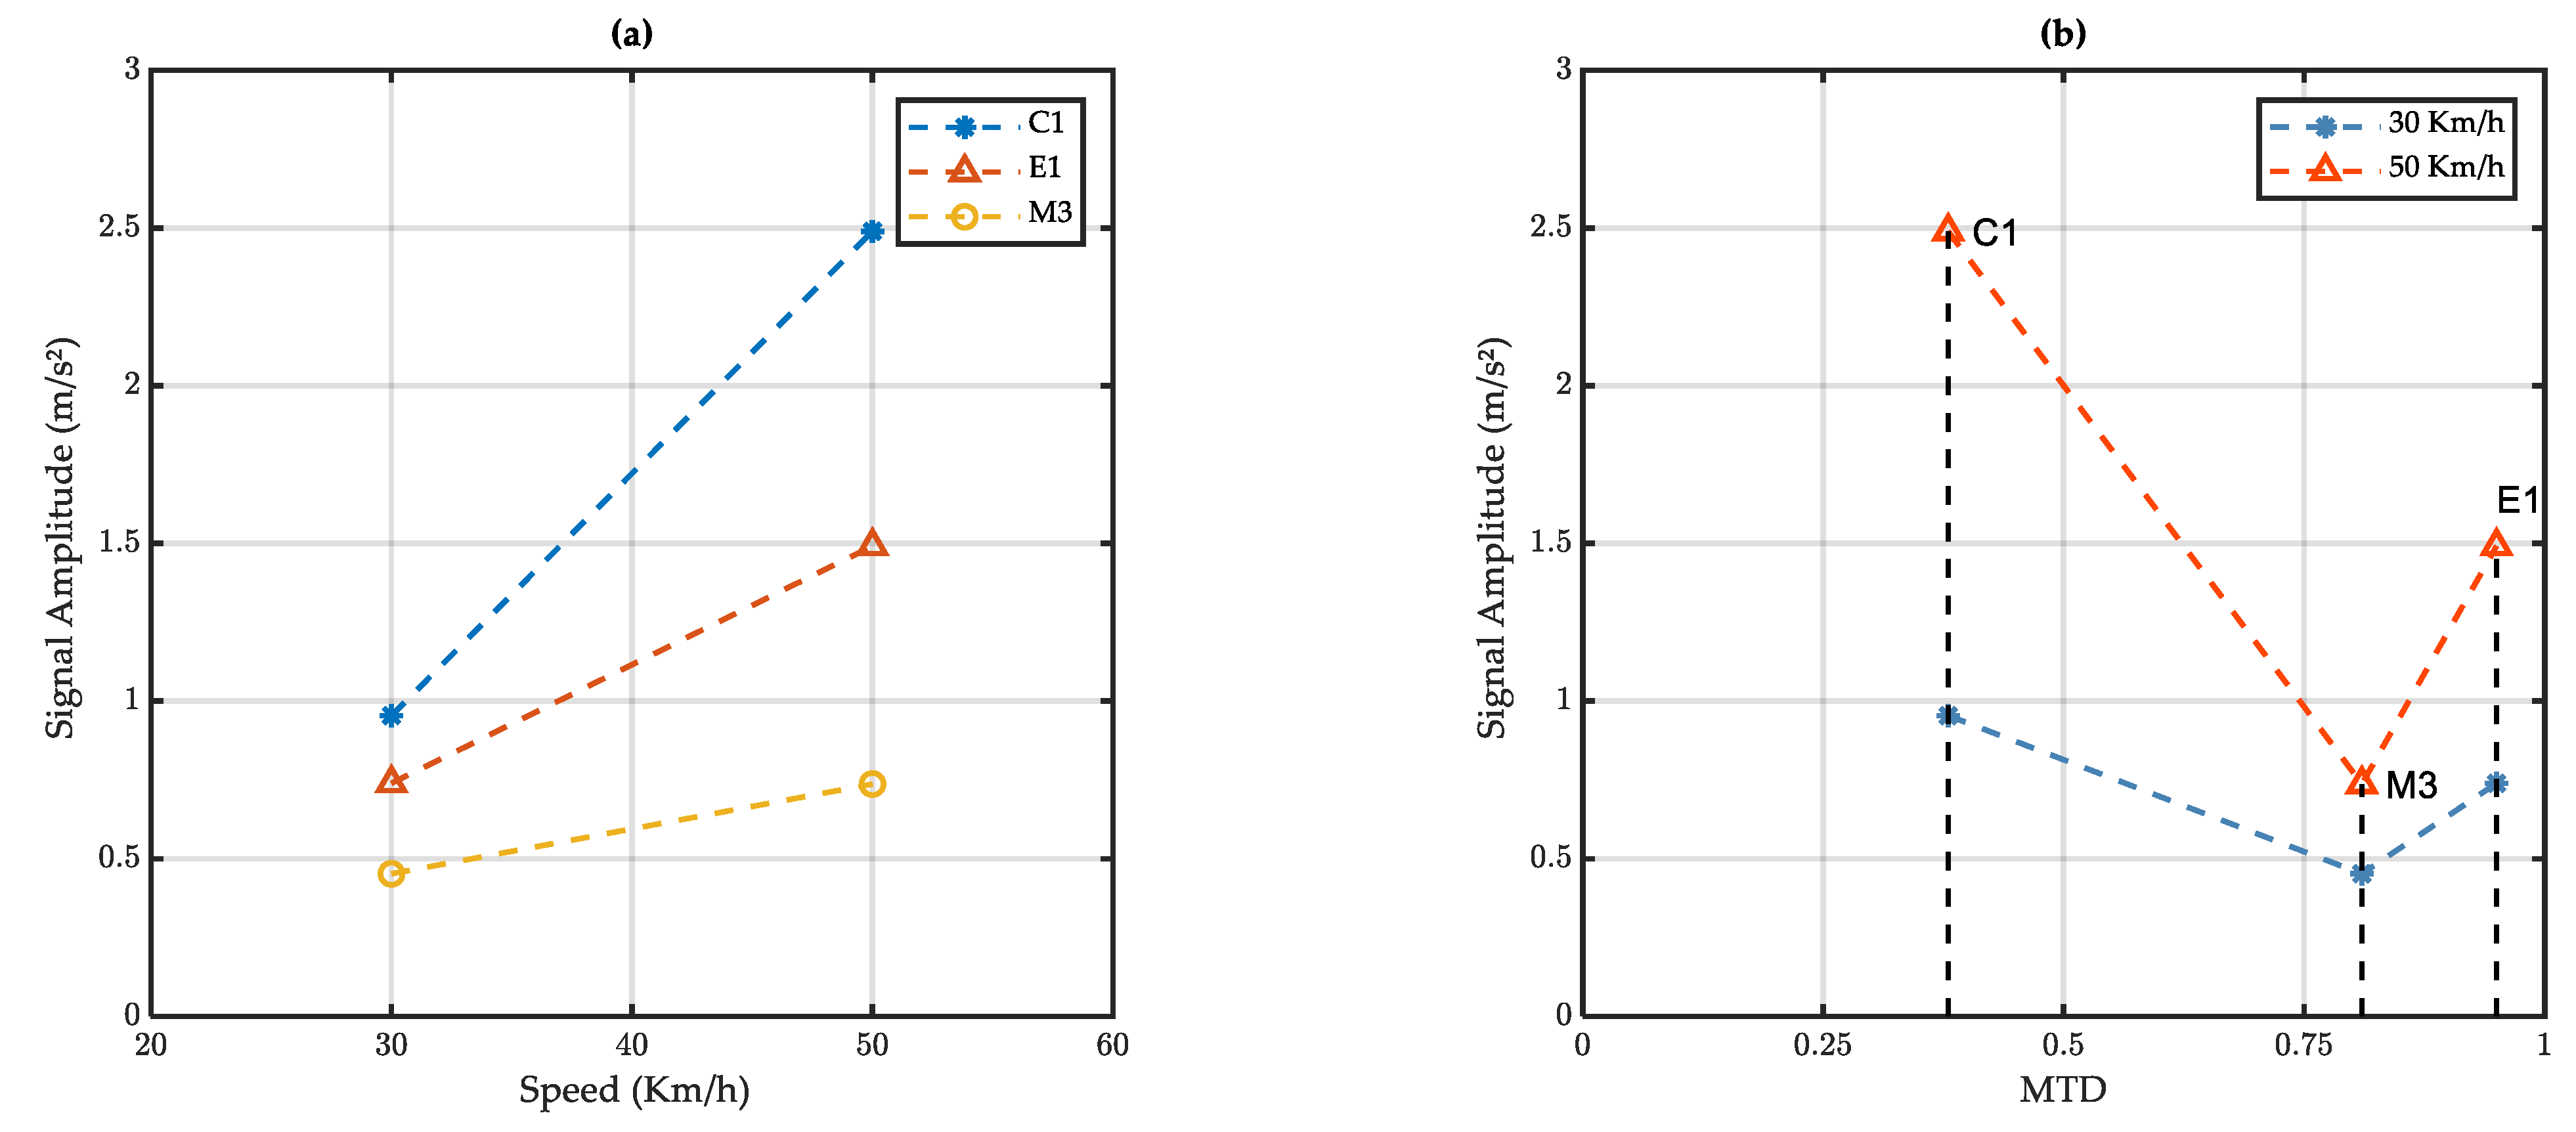
4.3. Estimation of Water Depths
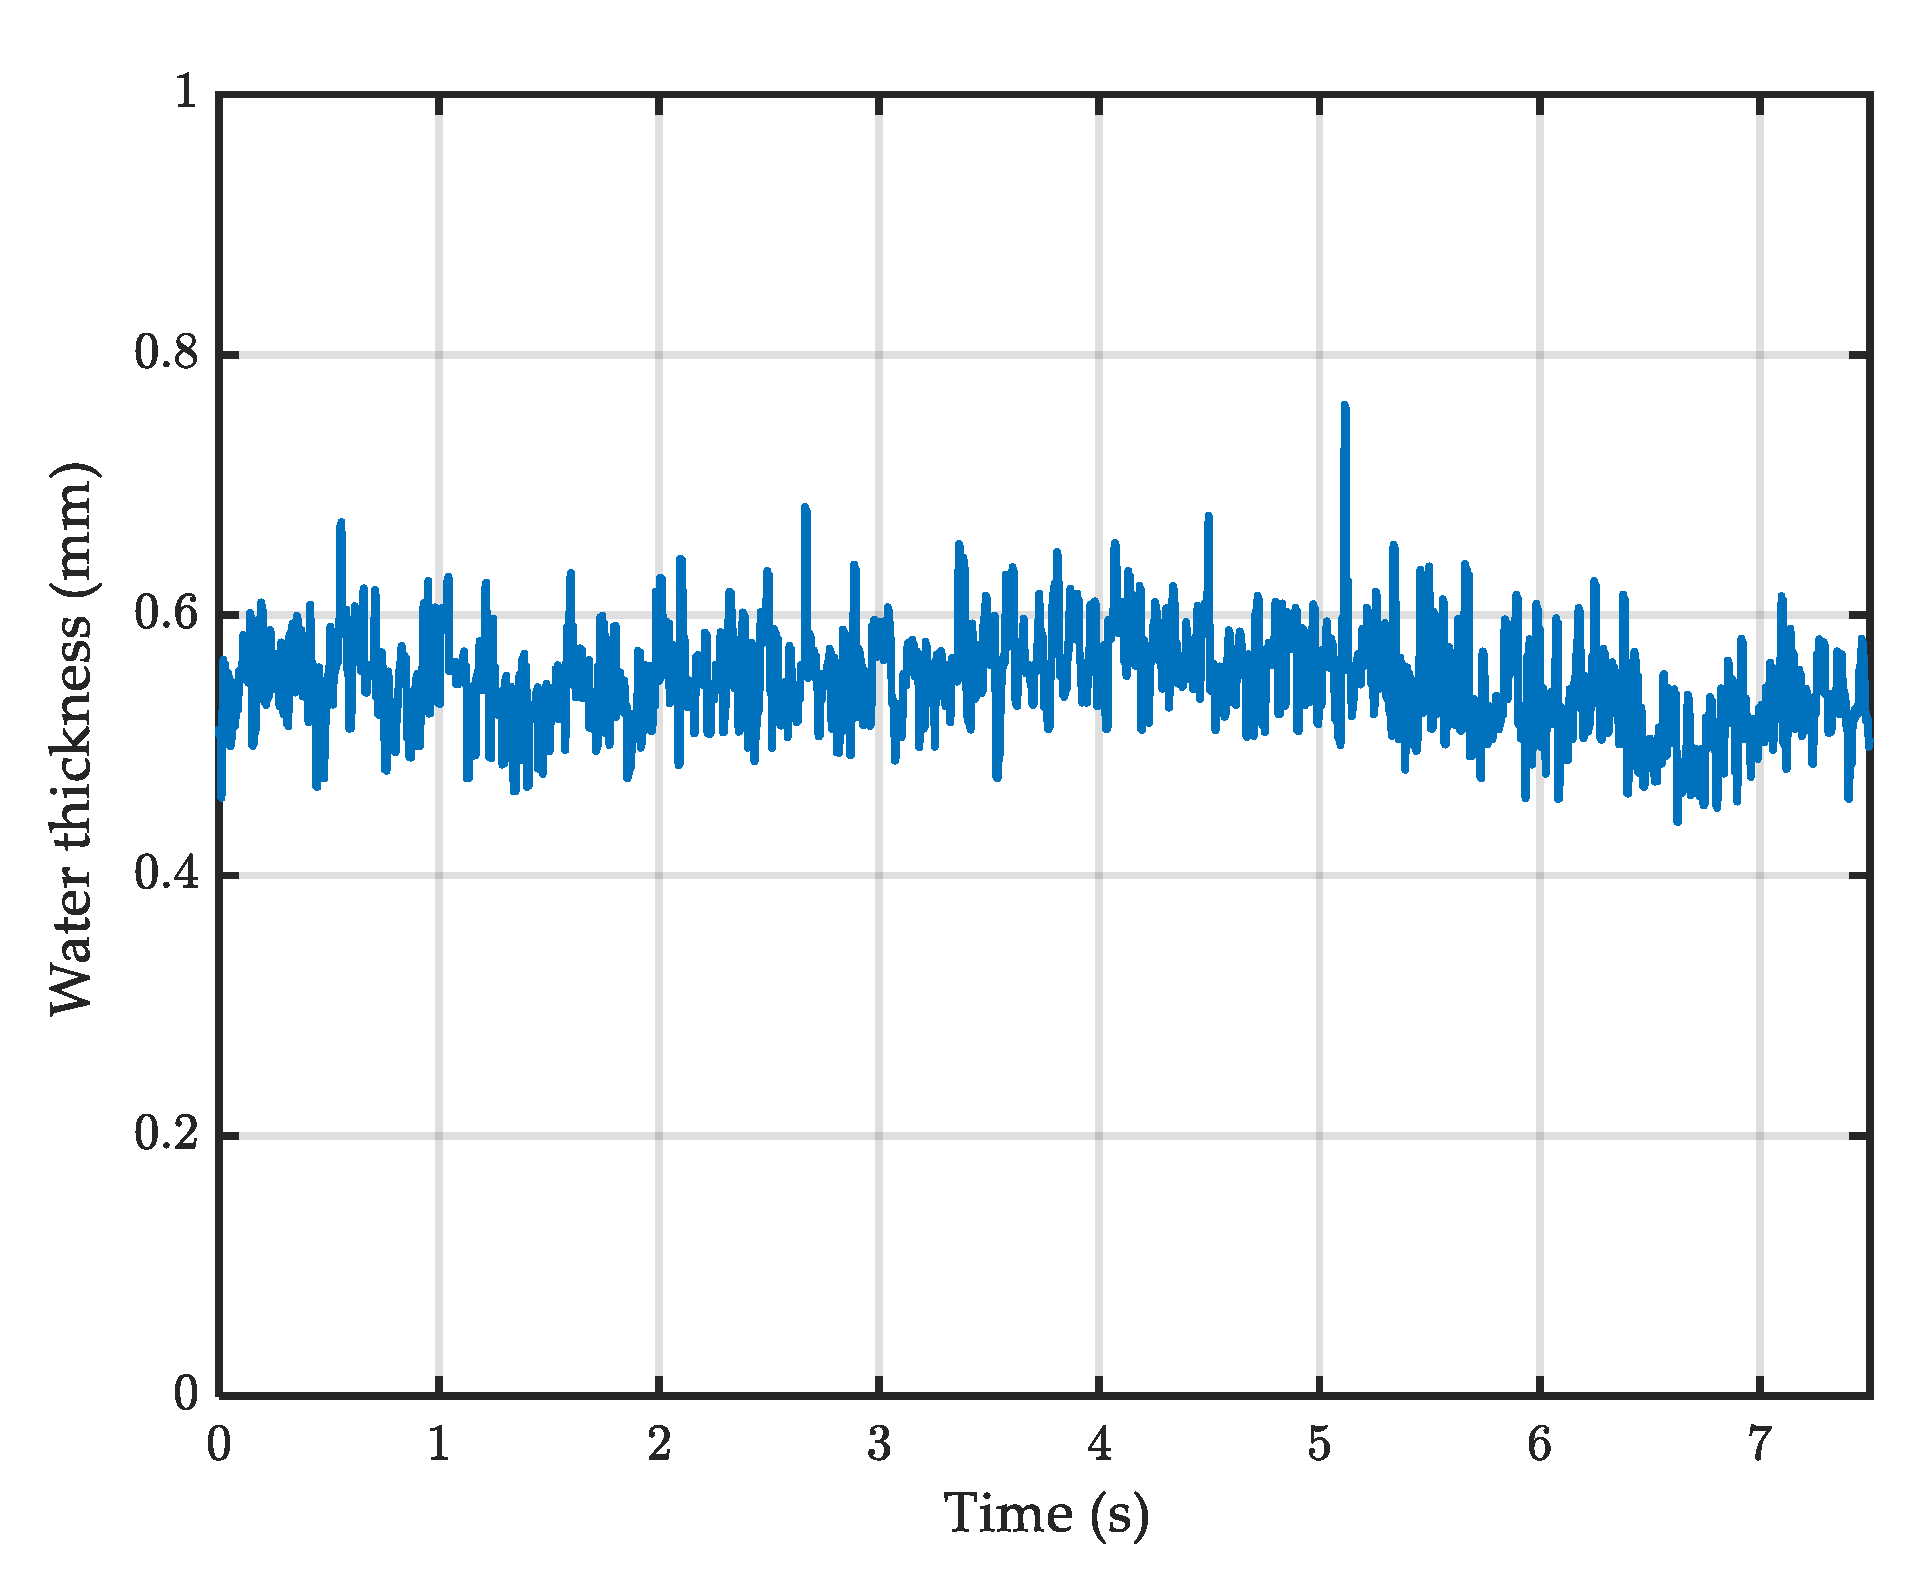
4.3.1. Analysis of Measured Water Depths
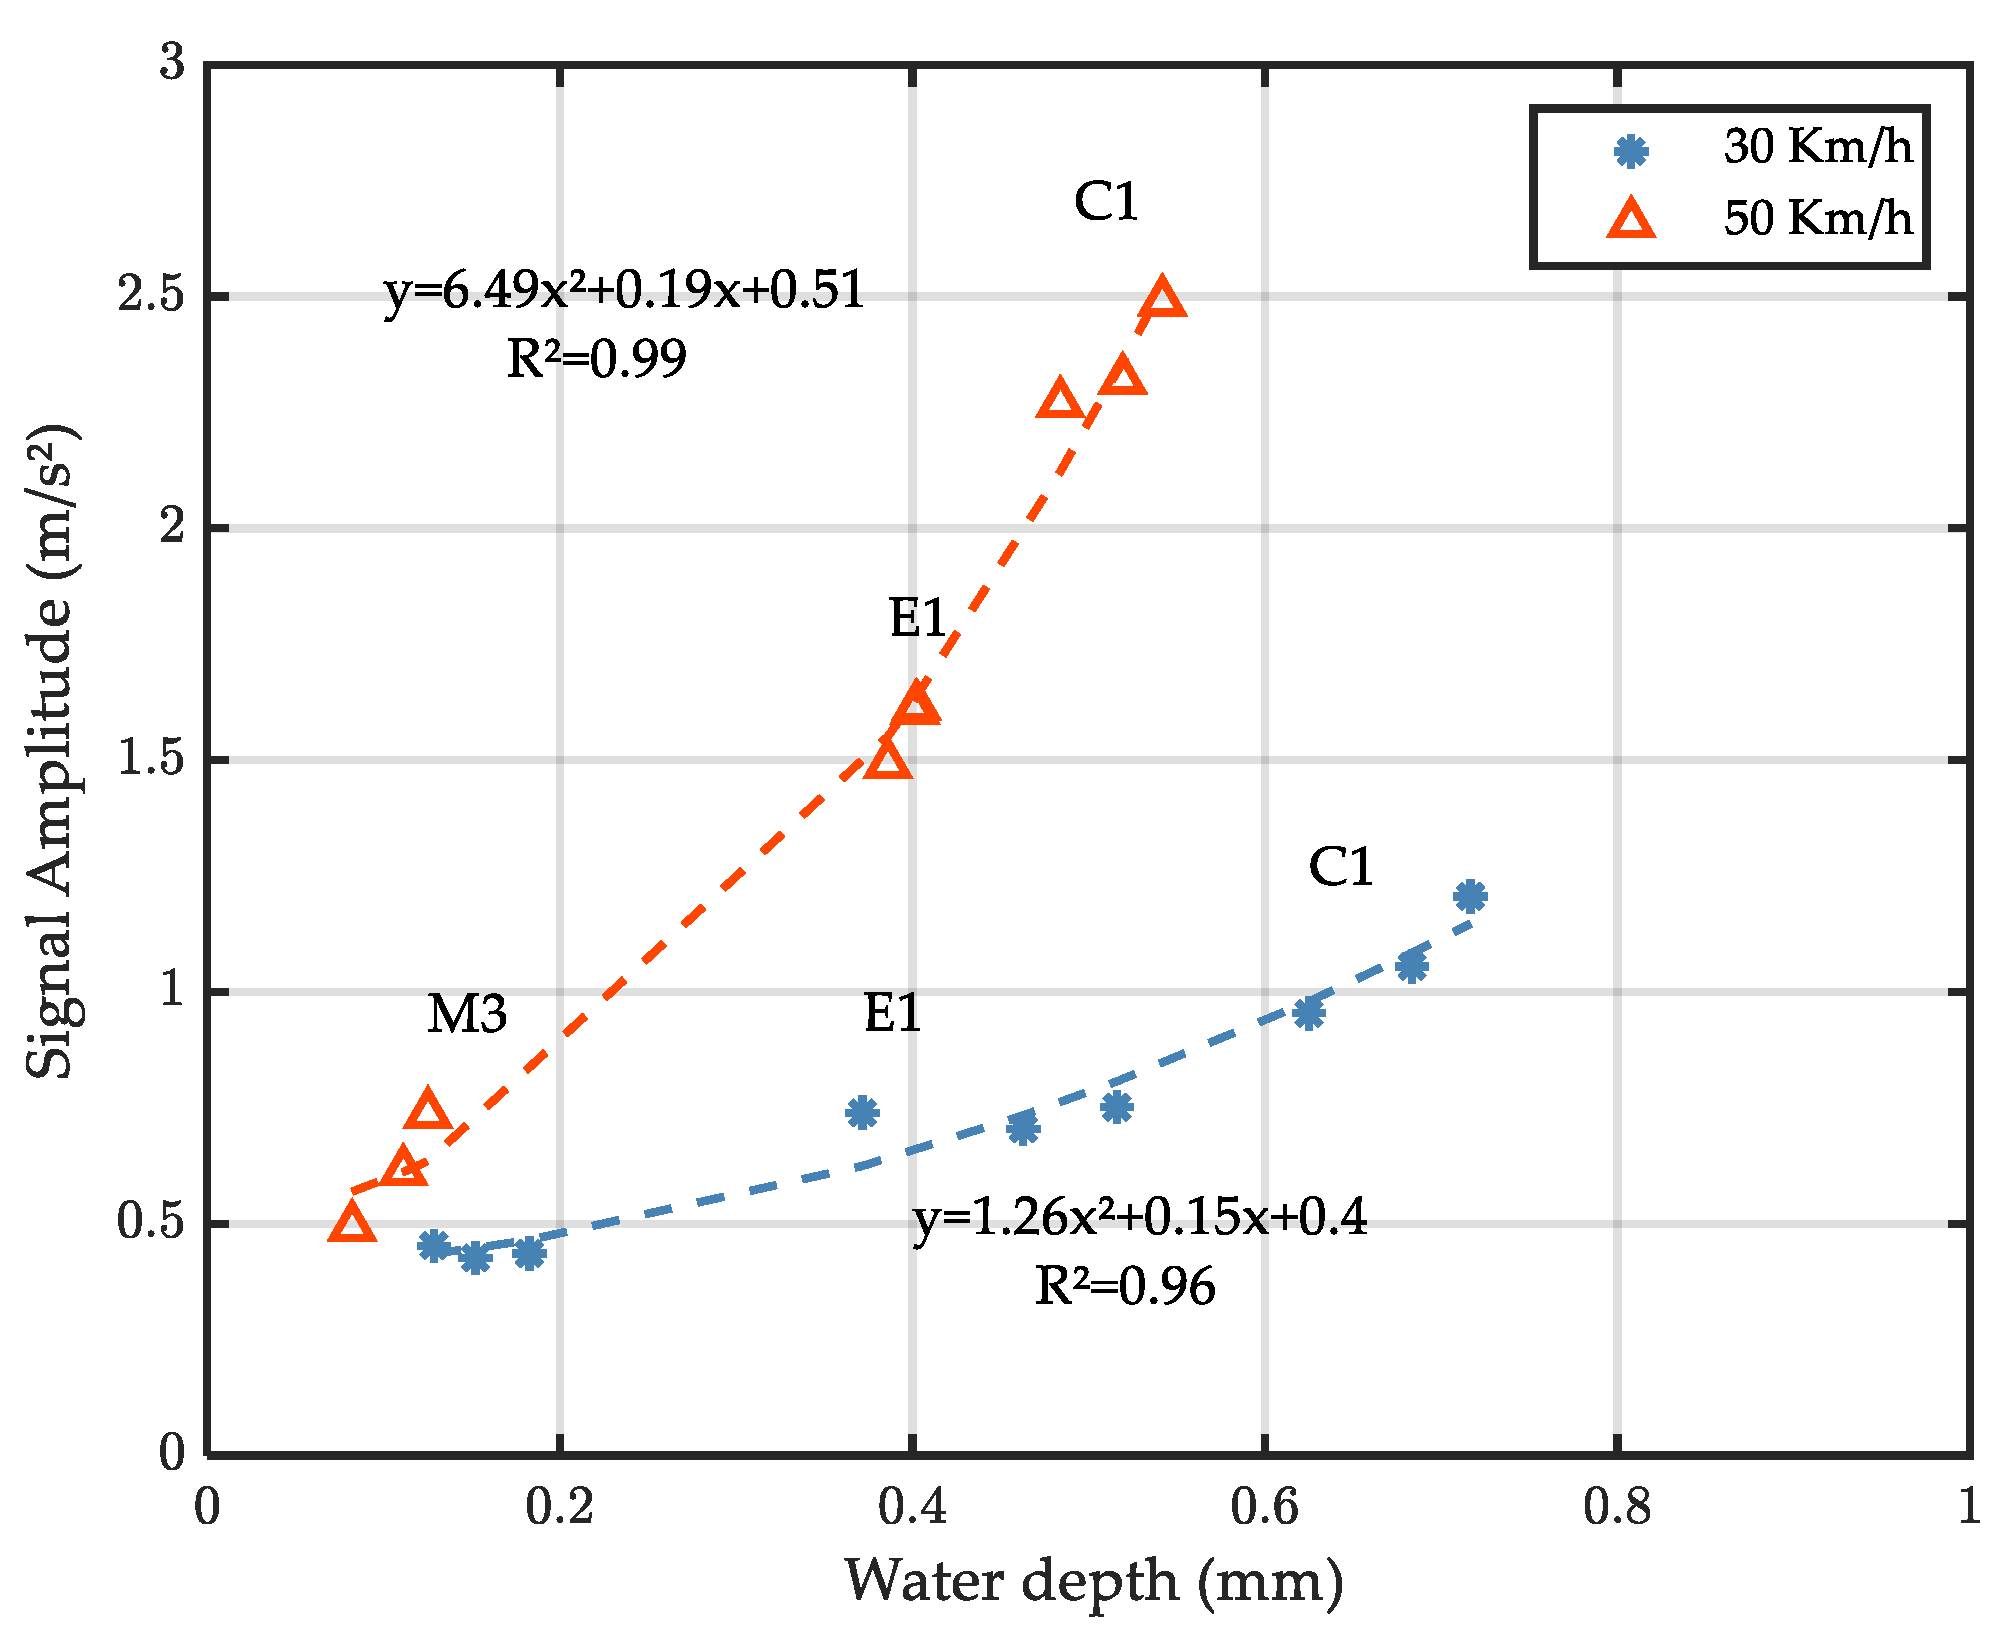
4.3.2. Relationship between Accelerations and Water Depths
5. Conclusions
Author Contributions
Funding
Data Availability Statement
Acknowledgments
Conflicts of Interest
References
- Brodsky, H.; Hakkert, A. Risk of a road accident in rainy weather. Accid. Anal. Prev. 1988, 20, 161–176. [Google Scholar] [CrossRef]
- Singh, R.; Mondal, P.; Sharma, N.; Kumar, A.; Bhangale, U.D.; Tyagi, D.; Singh, R. Effect of Rainfall and Wet Road Condition on Road Crashes: A Critical Analysis. SAE Tech. Pap. 2011, 1, 1–7. [Google Scholar] [CrossRef]
- Black, A.W.; Villarini, G.; Mote, T.L. Effects of Rainfall on Vehicle Crashes in Six U.S. States. Weather Clim. Soc. 2017, 9, 53–70. [Google Scholar] [CrossRef]
- Stevens, S.E.; Schreck, C.J., III; Saha, S.; Bell, J.E.; Kunkel, K. Precipitation and Fatal Motor Vehicle Crashes: Continental Analysis with High-Resolution Radar Data. Bull. Am. Meteorol. Soc. 2019, 100, 1453–1461. [Google Scholar] [CrossRef]
- Andrey, J.; Yagar, S. A temporal analysis of rain-related crash risk. Accid. Anal. Prev. 1993, 25, 465–472. [Google Scholar] [CrossRef]
- Eisenberg, D. The mixed effects of precipitation on traffic crashes. Accid. Anal. Prev. 2004, 36, 637–647. [Google Scholar] [CrossRef]
- Salvi, K.A.; Kumar, M. Rainfall-induced hydroplaning risk over road infrastructure of the continental USA. PLoS ONE 2022, 17, e0272993. [Google Scholar] [CrossRef] [PubMed]
- Moore, D.F. The Friction of Pneumatic Tyres; Elsevier Scientific Publishing Company: Amsterdam, The Netherlands, 1975. [Google Scholar]
- Veith, A.G. Tires–roads–rainfall–vehicles: The traction connection. In Frictional Interaction of Tire and Pavement; Meyer, W.E., Reichter, J., Eds.; ASTM STP: West Conshohocken, PA, USA, 1983; Volume 793, pp. 3–40. [Google Scholar]
- Kulakowski, B.T.; Harwood, D.W. Effect of water-film thickness on tire-pavement friction. In Surface Characteristics of Roadways: International Research and Technologies; Meyer, W.E., Reichter, J., Eds.; ASTM STP: West Conshohocken, PA, USA, 1990; Volume 1031, pp. 50–60. [Google Scholar] [CrossRef]
- Ong, G.P.; Fwa, T.F. Prediction of Wet-Pavement Skid Resistance and Hydroplaning Potential. Transp. Res. Rec. J. Transp. Res. Board 2007, 2005, 160–171. [Google Scholar] [CrossRef]
- Do, M.-T.; Cerezo, V.; Beautru, Y.; Kane, M. Modeling of the connection road surface microtexture/water depth/friction. Wear 2013, 302, 1426–1435. [Google Scholar] [CrossRef]
- Kogbara, R.B.; Masad, E.A.; Kassem, E.; Scarpas, A.; Anupam, K. A state-of-the-art review of parameters influencing measurement and modeling of skid resistance of asphalt pavements. Constr. Build. Mater. 2016, 114, 602–617. [Google Scholar] [CrossRef]
- Yu, M.; You, Z.; Wu, G.; Kong, L.; Liu, C.; Gao, J. Measurement and modeling of skid resistance of asphalt pavement: A review. Constr. Build. Mater. 2020, 260, 119878. [Google Scholar] [CrossRef]
- Holzwarth, F.; Eichhorn, U. Non-contact sensors for road conditions. Sens. Actuators A Phys. 1993, 37–38, 121–127. [Google Scholar] [CrossRef]
- Schmiedel, B.; Gauterin, F. Tire Splash and Spray Directly before and during Hydroplaning. Tire Sci. Technol. 2019, 47, 141–159. [Google Scholar] [CrossRef]
- Döring, J.; Beering, A.; Scholtyssek, J.; Krieger, K.-L. Road Surface Wetness Quantification Using a Capacitive Sensor System. IEEE Access 2021, 9, 145498–145512. [Google Scholar] [CrossRef]
- Weir, D.H.; Strange, J.F.; Heffley, R.K. Reduction of Adverse Aerodynamic Effects of Large Trucks; Report FHWA-RD-79-84; Federal Highway Administration: Washington, DC, USA, 1978. Available online: https://rosap.ntl.bts.gov/view/dot/753 (accessed on 15 October 2022).
- Schmiedel, B.; Gauterin, F.; Unrau, H.-J. Road wetness quantification via tyre spray. Proc. Inst. Mech. Eng. Part D J. Automob. Eng. 2018, 233, 28–37. [Google Scholar] [CrossRef]
- Schmiedel, B.; Gauterin, F.; Unrau, H.-J. Study of system layouts for road wetness quantification via tire spray. Automot. Engine Technol. 2019, 4, 63–73. [Google Scholar] [CrossRef]
- Sabey, B.E.; Williams, T.; Lupton, G.N. Factors Affecting the Friction of Tires on Wet Roads. SAE Tech. Pap. 1970, 79, 700376. [Google Scholar] [CrossRef]
- Prevost, D.; Cerezo, V.; Do, M.T.; Chabanon, C. On-board estimation of water depth using low-cost sensors. In Proceedings of the SURF 2012 (7th Symposium on Pavement Surface Characteristics), Norfolk, VA, USA, 19–22 September 2012. [Google Scholar]
- ISO 13473-1; Characterization of Pavement Texture by Use of Surface Profiles—Part 1: Determination of Mean Profile Depth. American National Standards Institute (ANSI): New York, NY, USA, 1997.


| Surface | Texture | MTD (mm) |
|---|---|---|
| C1 |  | 0.38 |
| E1 | 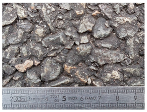 | 0.95 |
| M3 | 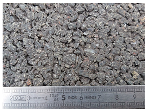 | 0.85 |
| Intensity Level | |||
|---|---|---|---|
| Low | Medium | High | |
| Illustration (photos extracted from videos) |  |  |  |
| Description | Droplets barely visible on part of or the whole wheel arch | Droplets visible on the whole wheel arch | Big droplets densely distributed on the whole wheel arch |
| Surface | C1 | E1 | ||||
|---|---|---|---|---|---|---|
| Run | 1 | 2 | 3 | 1 | 2 | 3 |
| 30 km/h |  |  |  |  |  |  |
| 50 km/h |  |  |  |  |  |  |
Publisher’s Note: MDPI stays neutral with regard to jurisdictional claims in published maps and institutional affiliations. |
© 2022 by the authors. Licensee MDPI, Basel, Switzerland. This article is an open access article distributed under the terms and conditions of the Creative Commons Attribution (CC BY) license (https://creativecommons.org/licenses/by/4.0/).
Share and Cite
Riahi, E.; Edjeou, W.; Buisson, S.; Gennesseaux, M.; Do, M.-T. Estimation of Water Depth on Road Surfaces Using Accelerometric Signals. Sensors 2022, 22, 8940. https://doi.org/10.3390/s22228940
Riahi E, Edjeou W, Buisson S, Gennesseaux M, Do M-T. Estimation of Water Depth on Road Surfaces Using Accelerometric Signals. Sensors. 2022; 22(22):8940. https://doi.org/10.3390/s22228940
Chicago/Turabian StyleRiahi, Ebrahim, Wiyao Edjeou, Sébastien Buisson, Manuela Gennesseaux, and Minh-Tan Do. 2022. "Estimation of Water Depth on Road Surfaces Using Accelerometric Signals" Sensors 22, no. 22: 8940. https://doi.org/10.3390/s22228940
APA StyleRiahi, E., Edjeou, W., Buisson, S., Gennesseaux, M., & Do, M.-T. (2022). Estimation of Water Depth on Road Surfaces Using Accelerometric Signals. Sensors, 22(22), 8940. https://doi.org/10.3390/s22228940