
Characterization of Fluorescence Tracers for Thermometry and Film Thickness Measurements in Liquid Coolants Relevant for Thermal Management of Electric and Electronic Components

Abstract
1. Introduction
2. Description of the Experiment
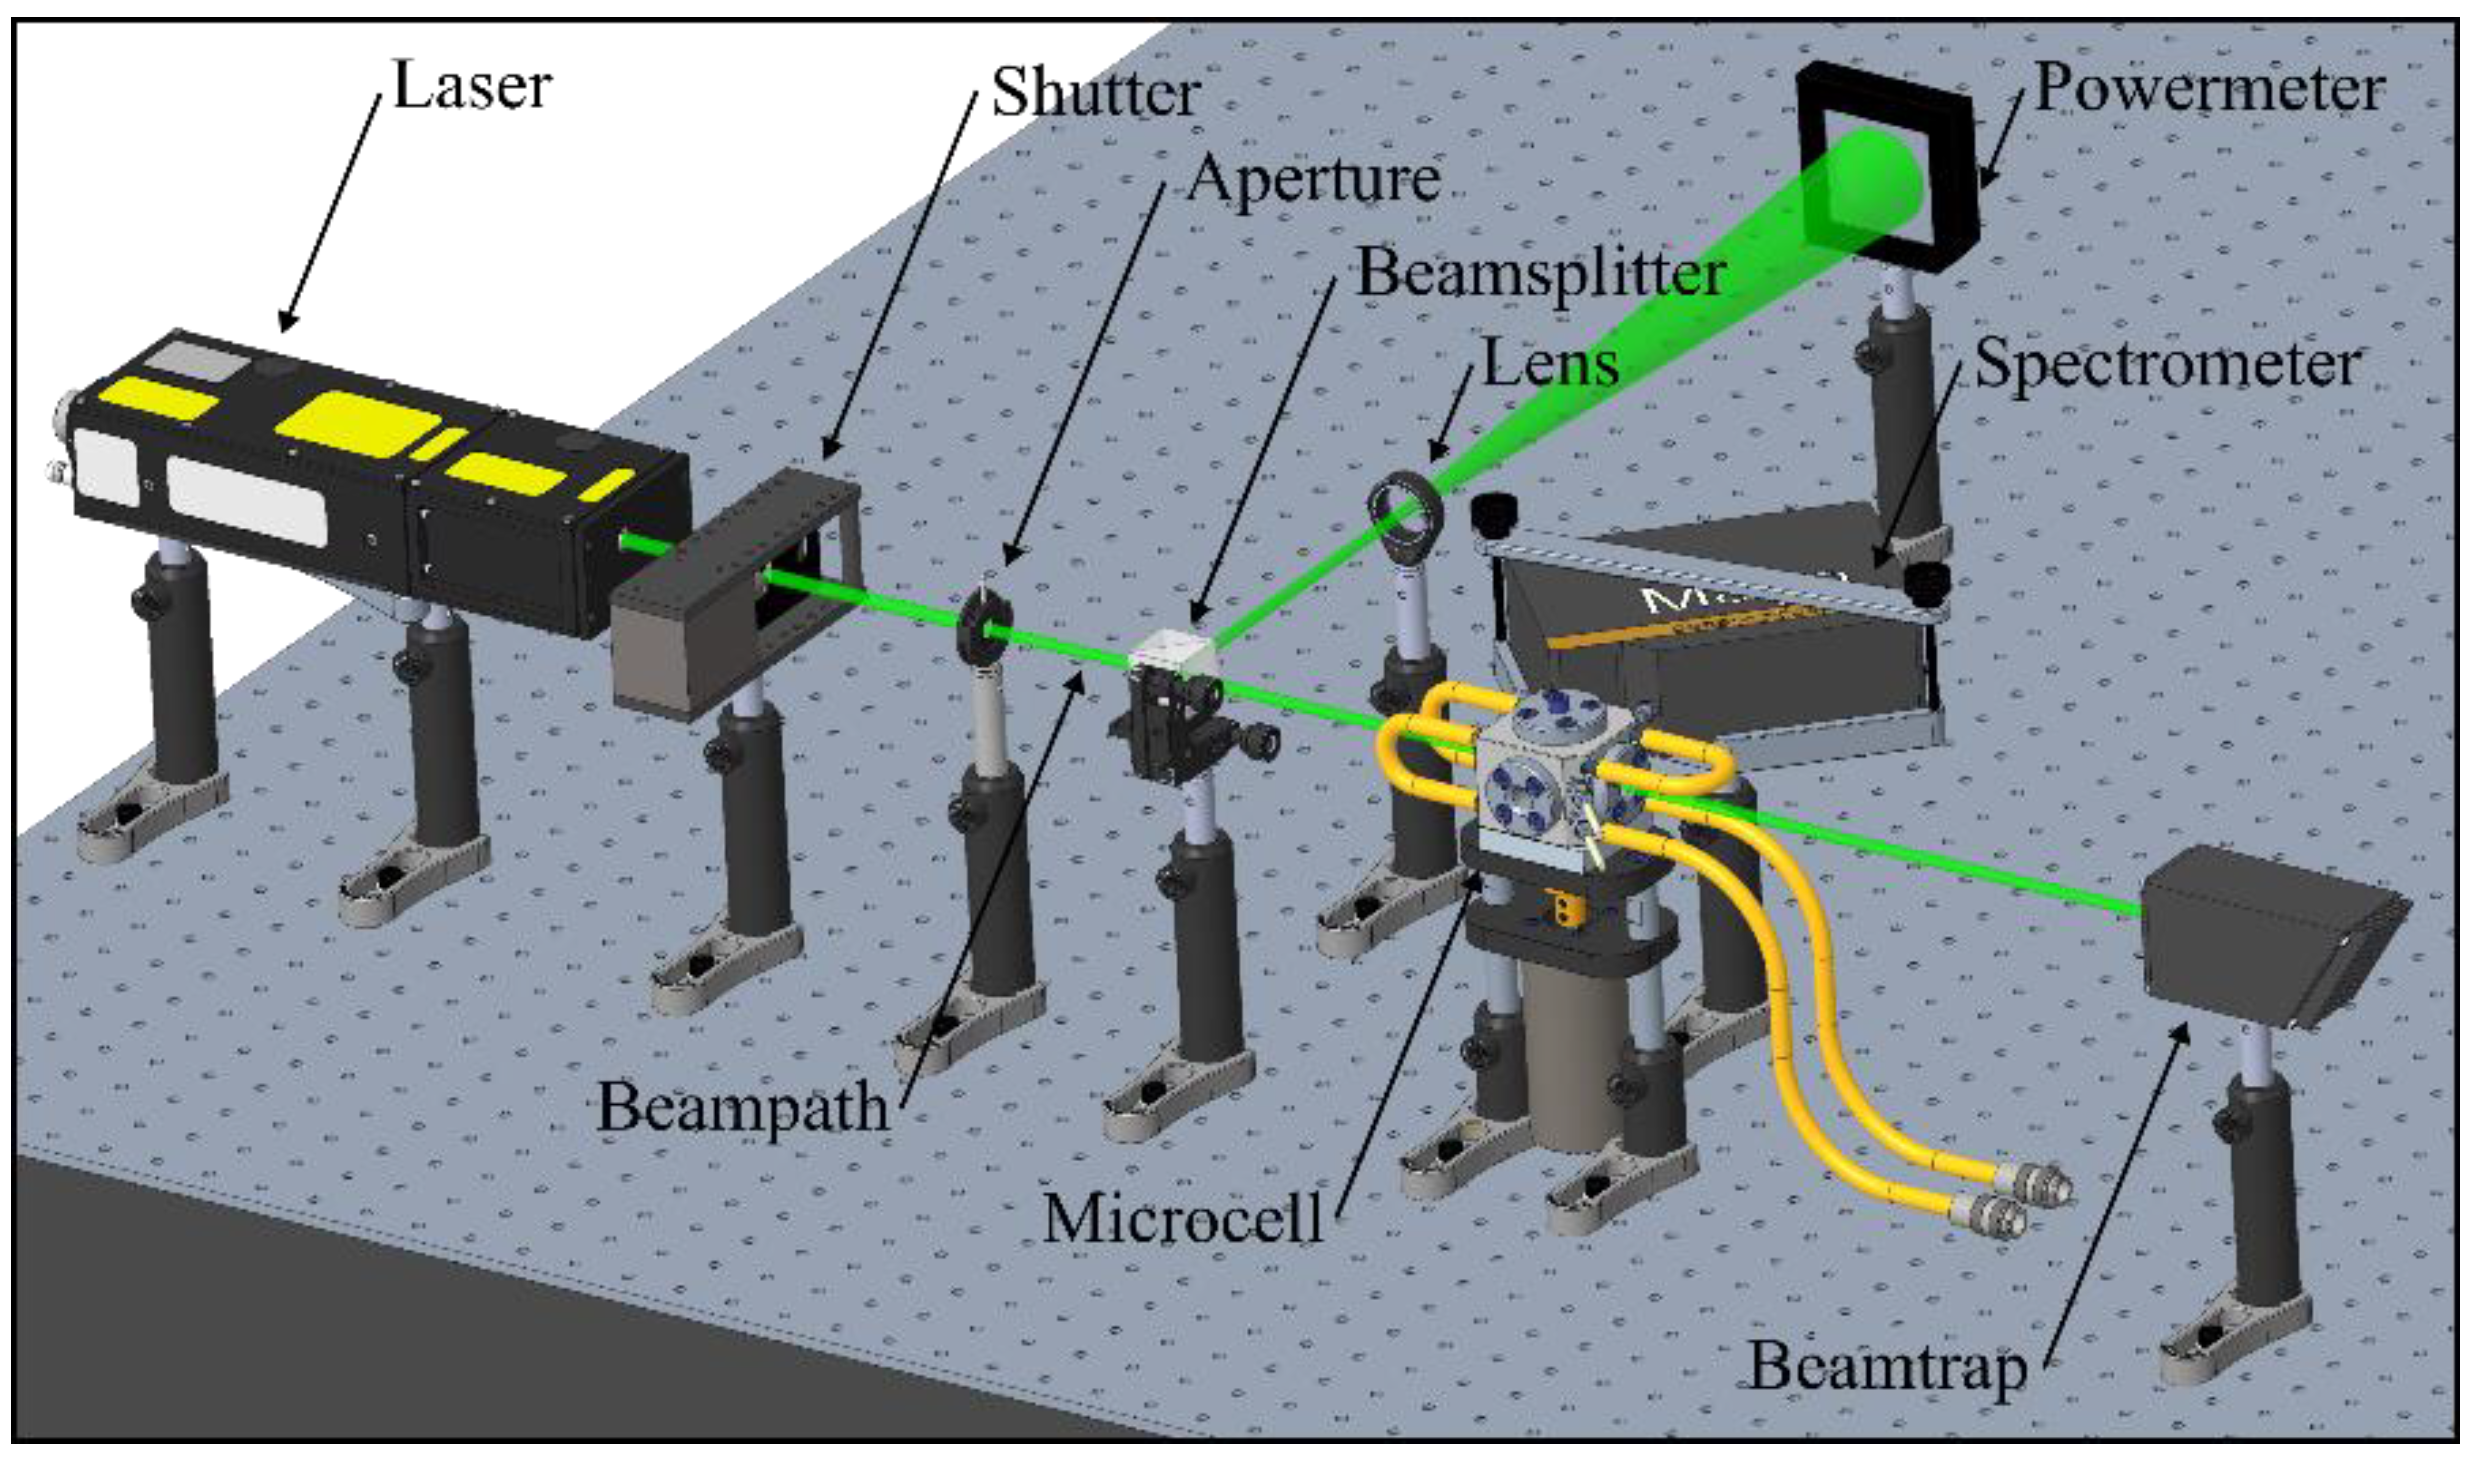
2.1. Fluorescence Spectroscopy Setup
2.2. Absorption Spectroscopy Setup
3. Coolants and Tracers Used
4. Results
4.1. Concentration-Dependent Measurements
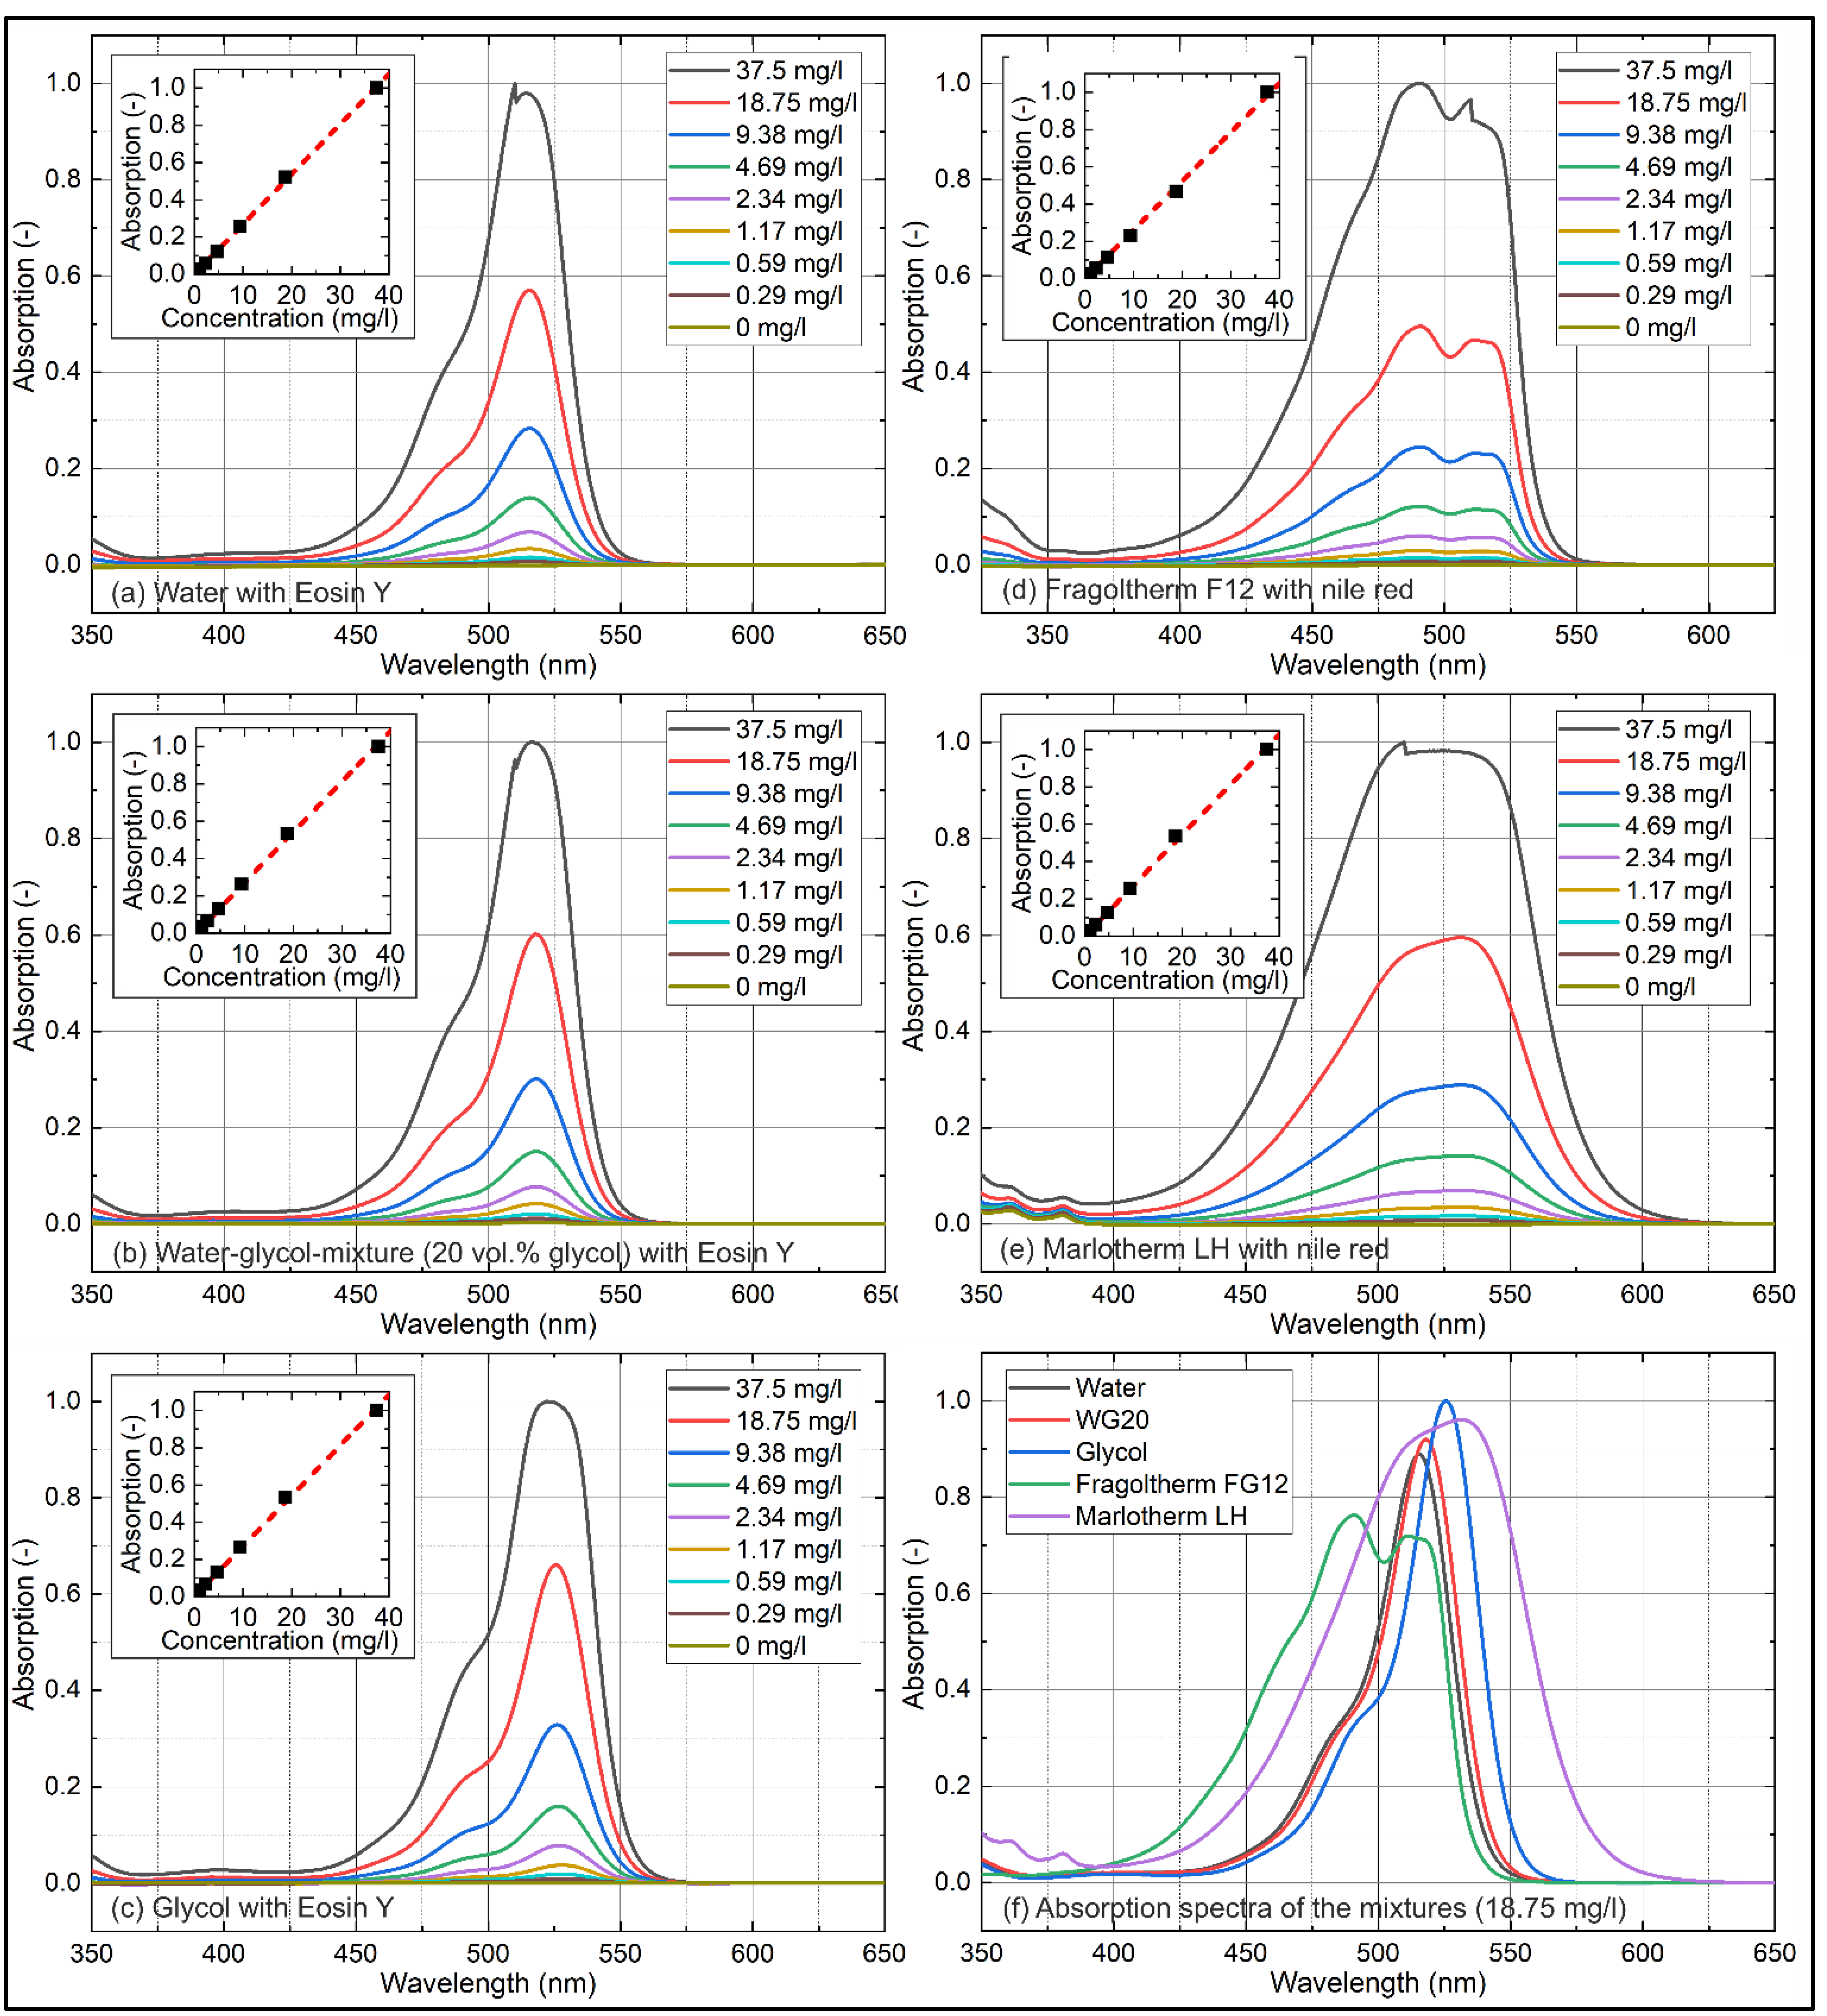
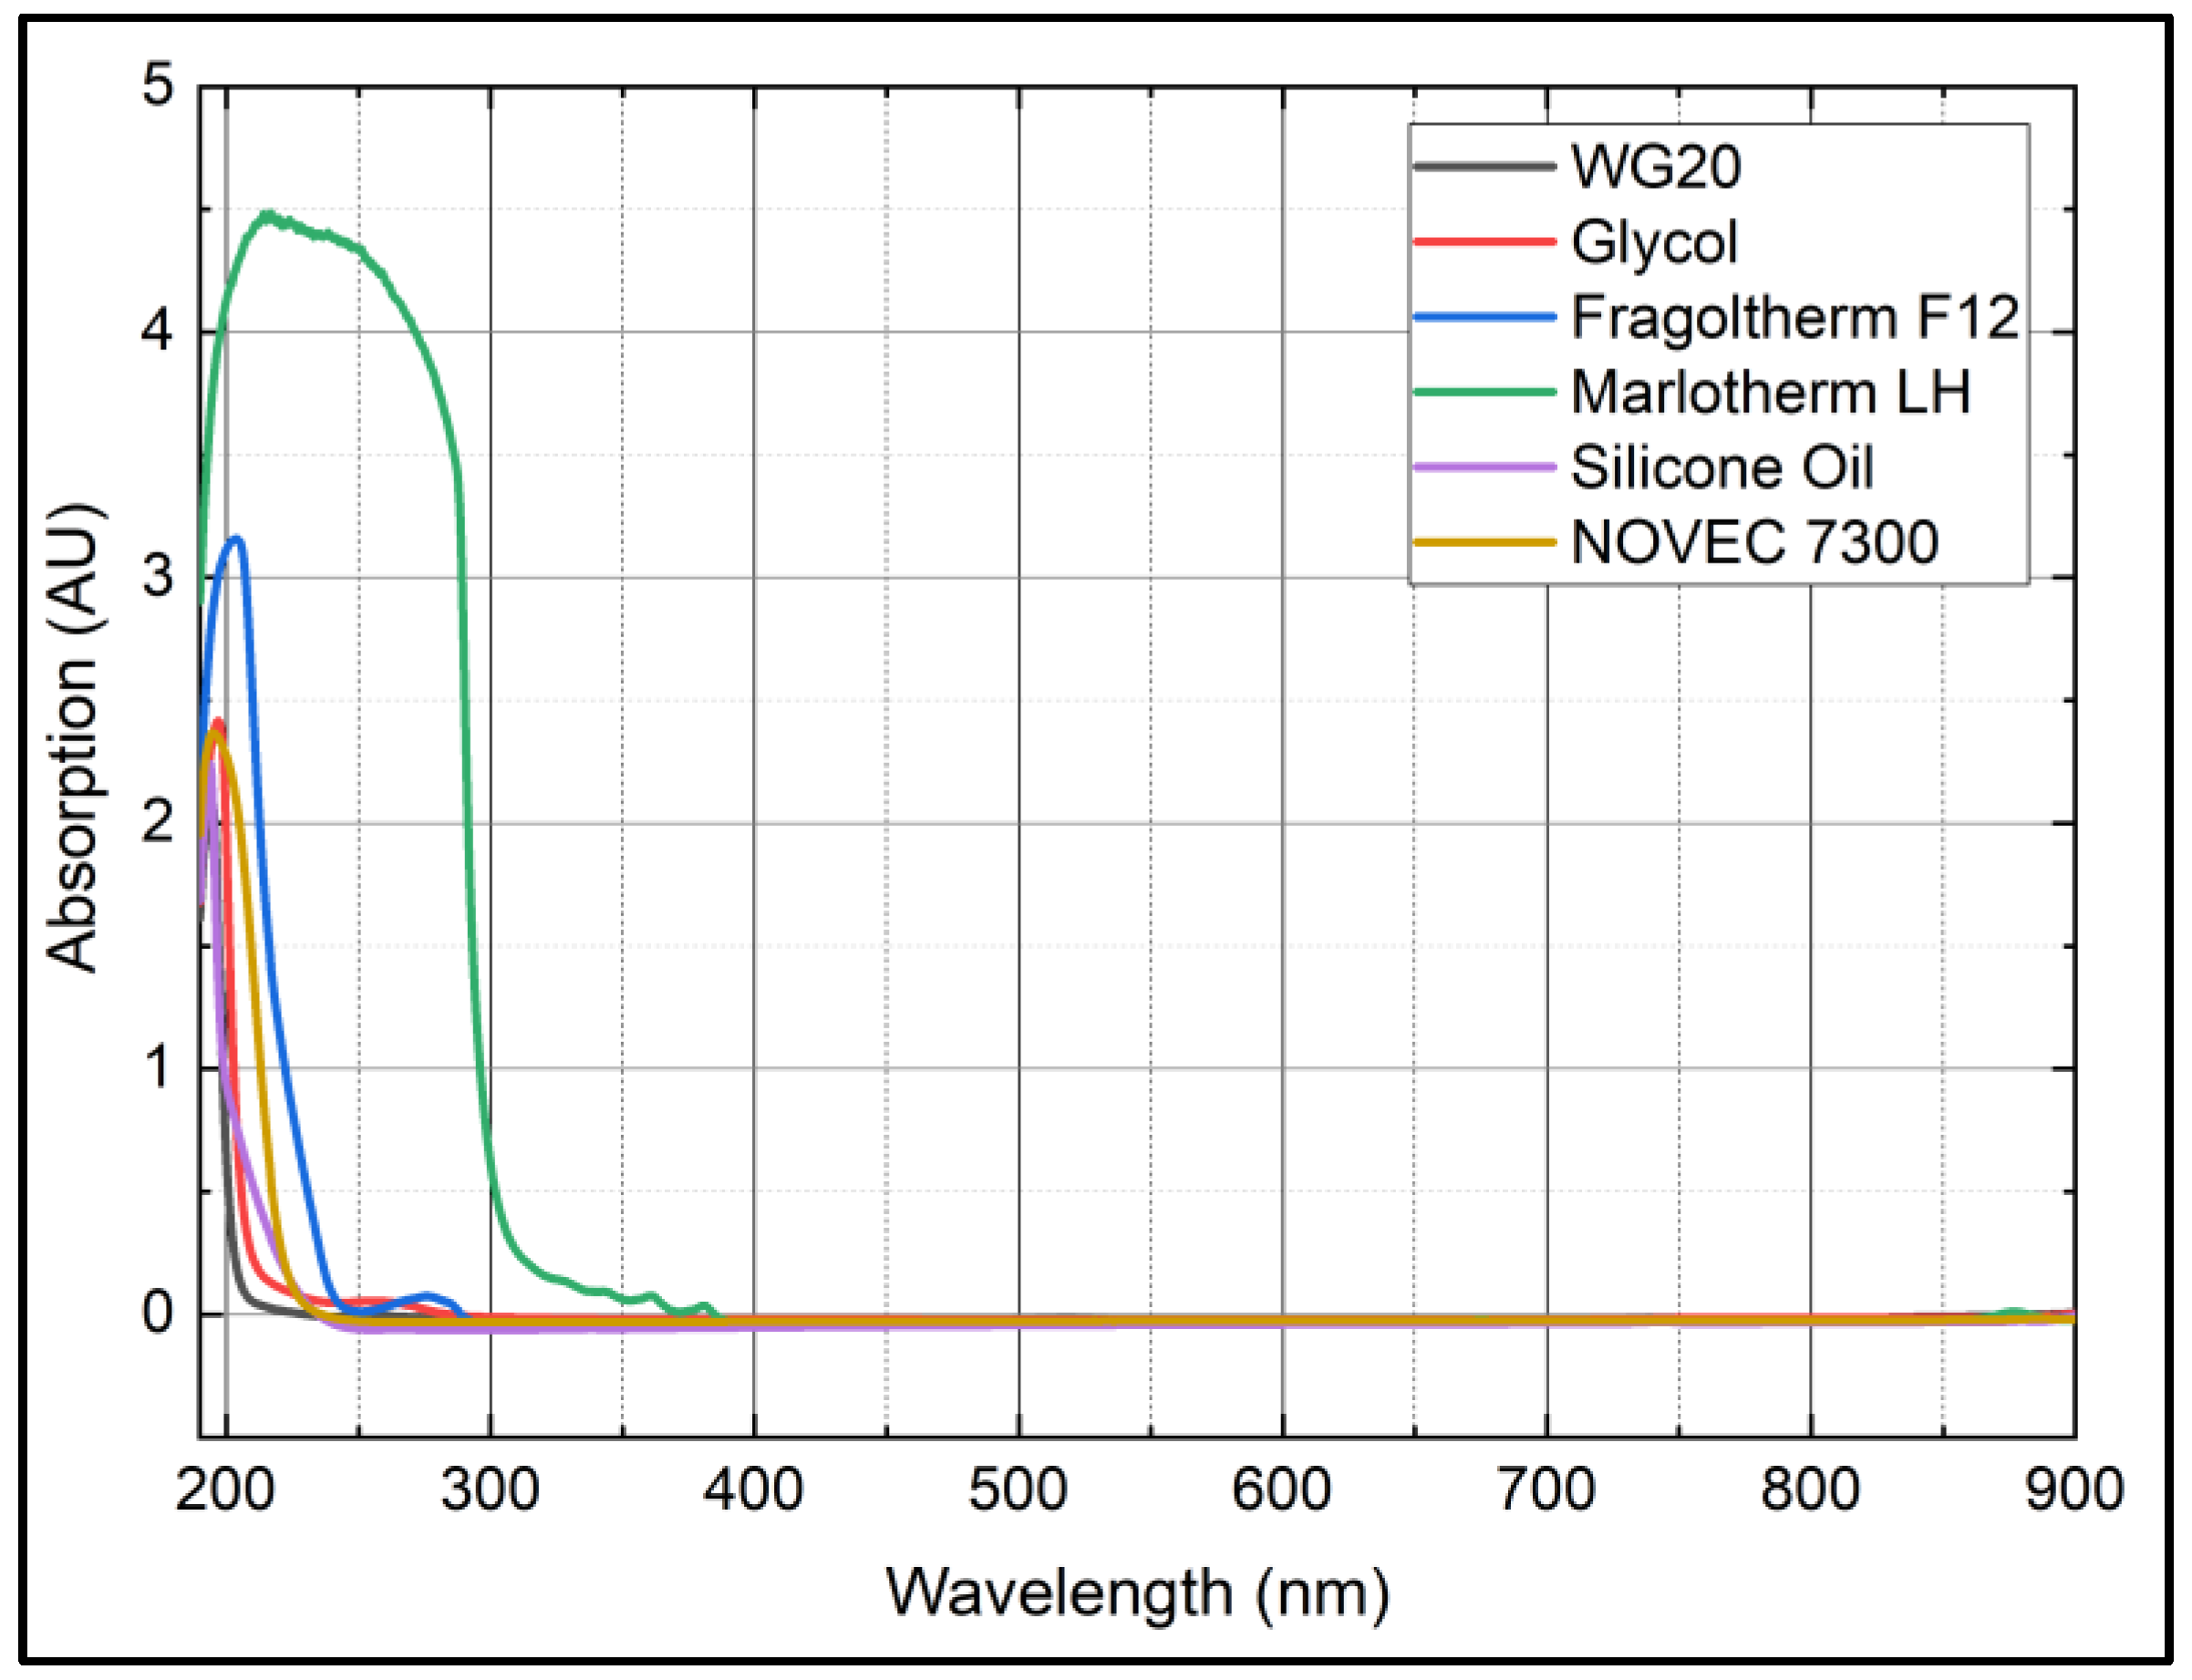
4.1.1. Absorption
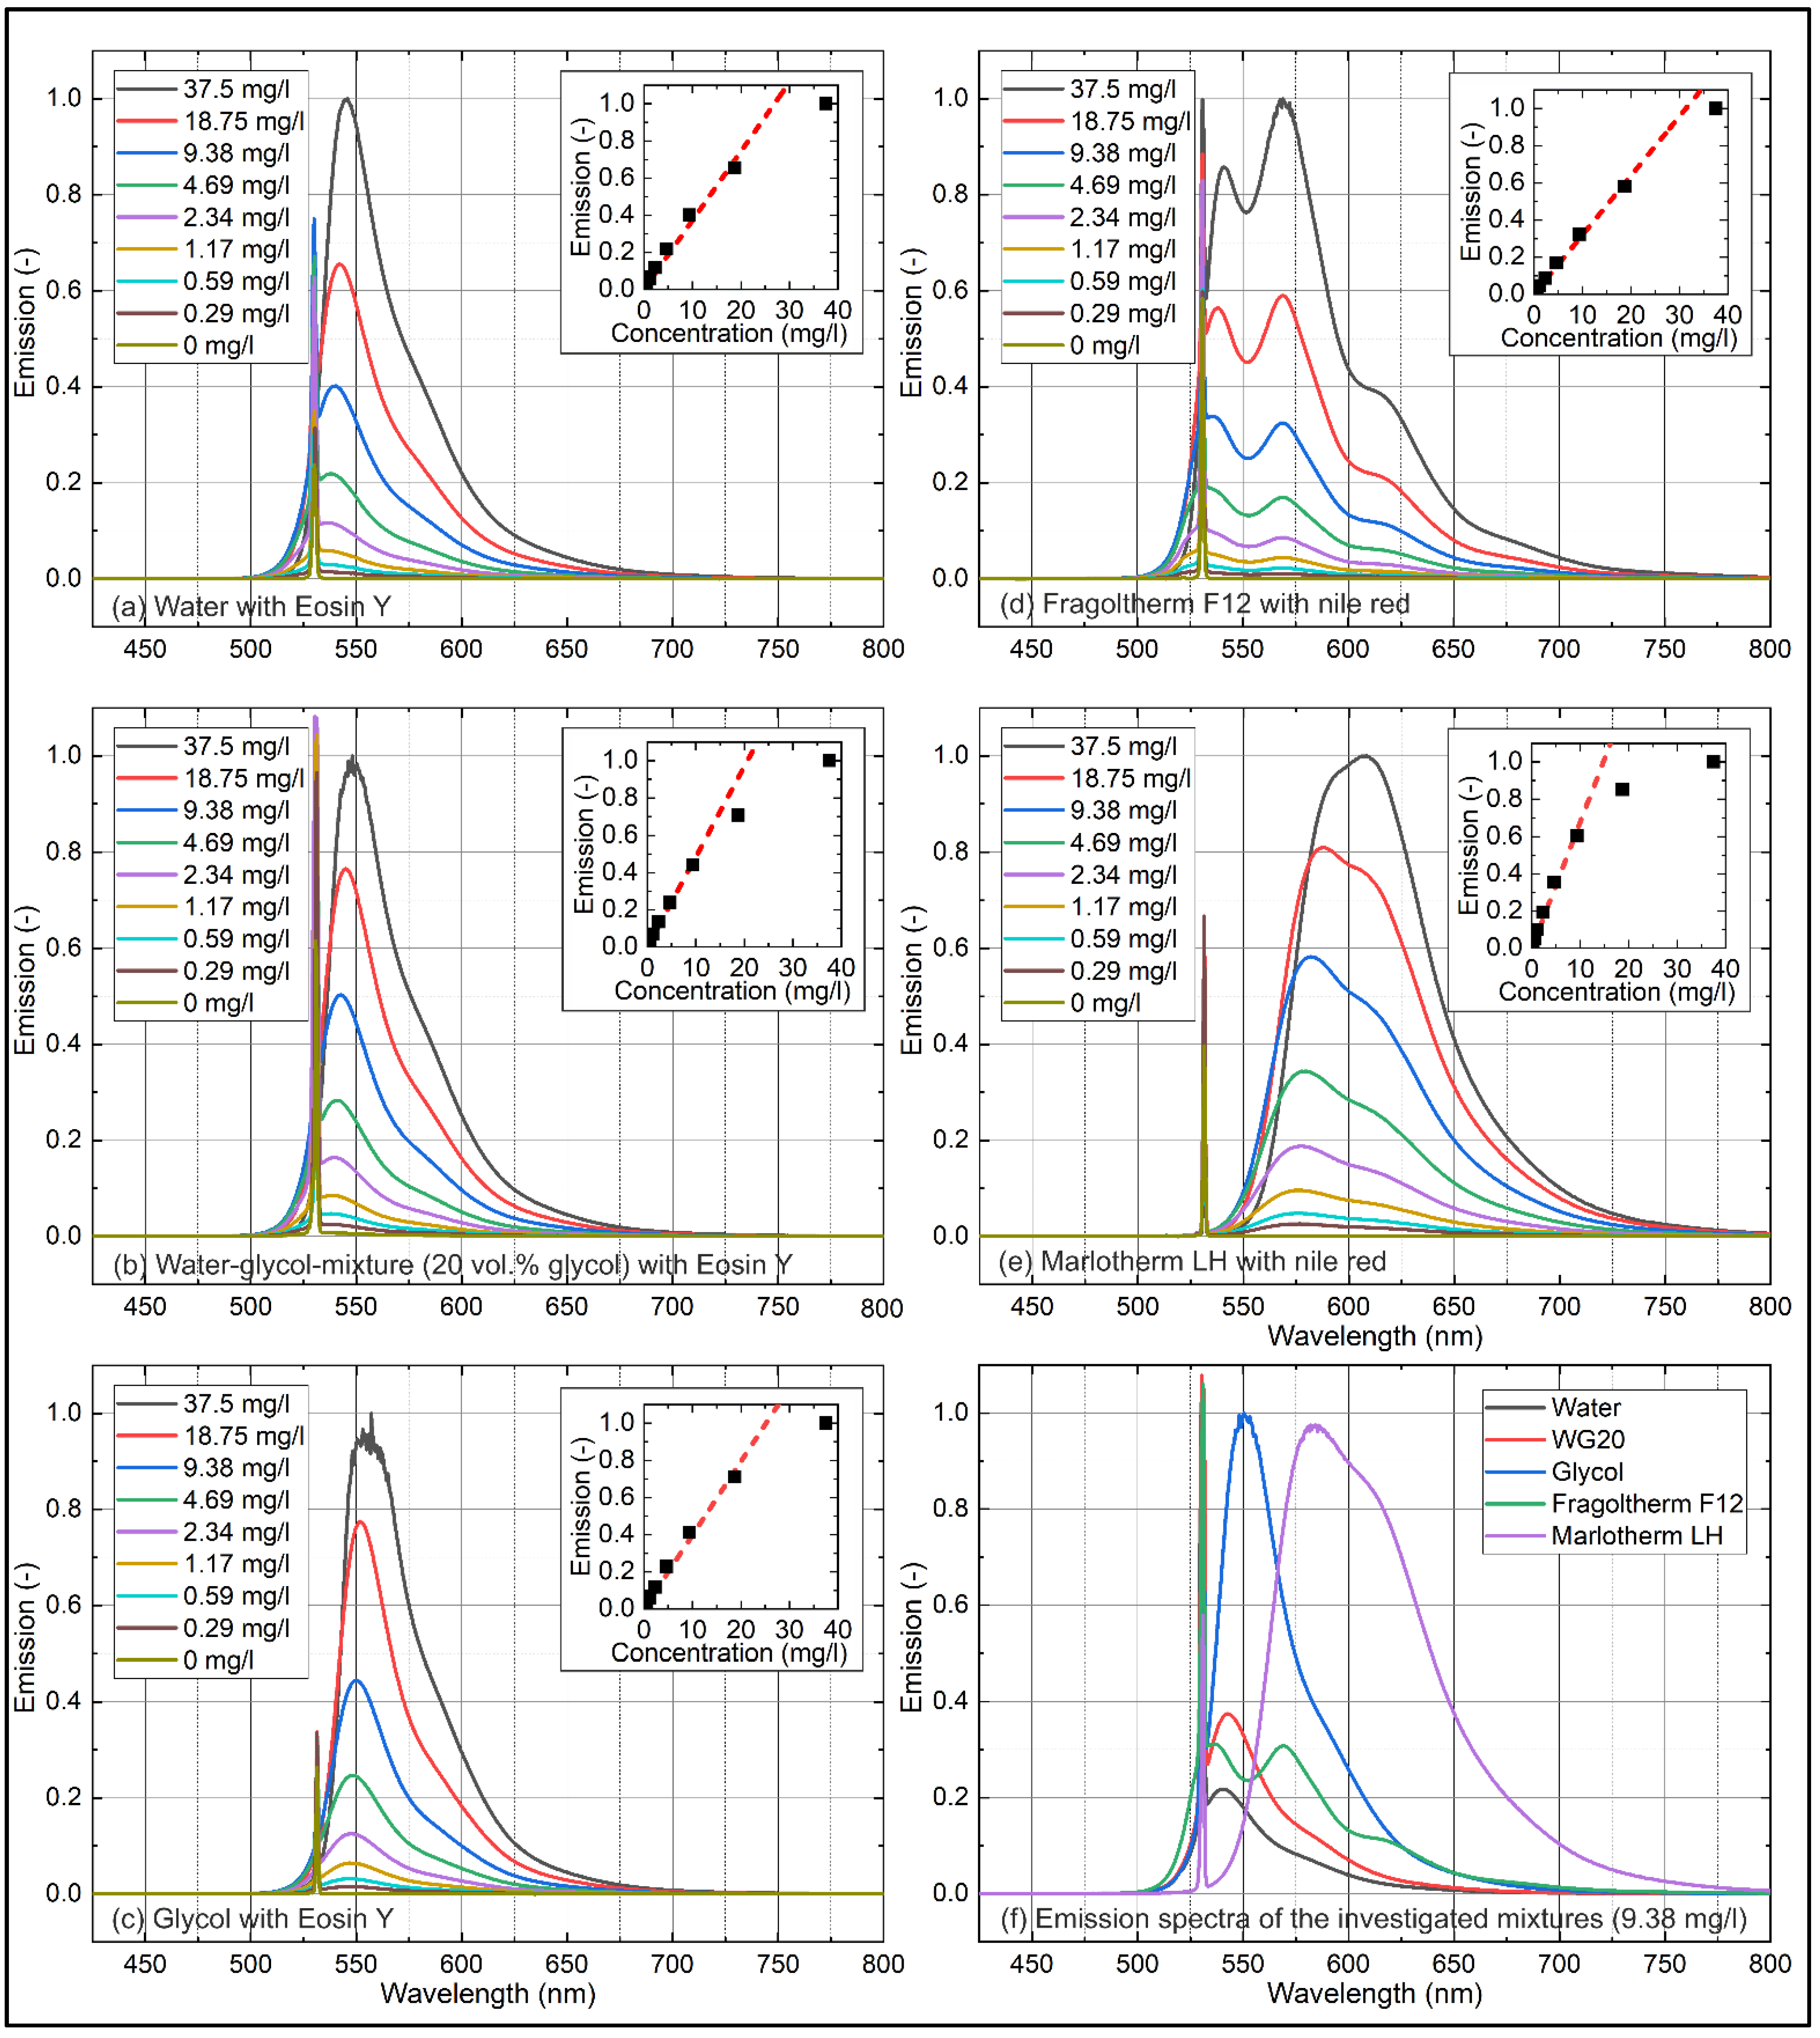
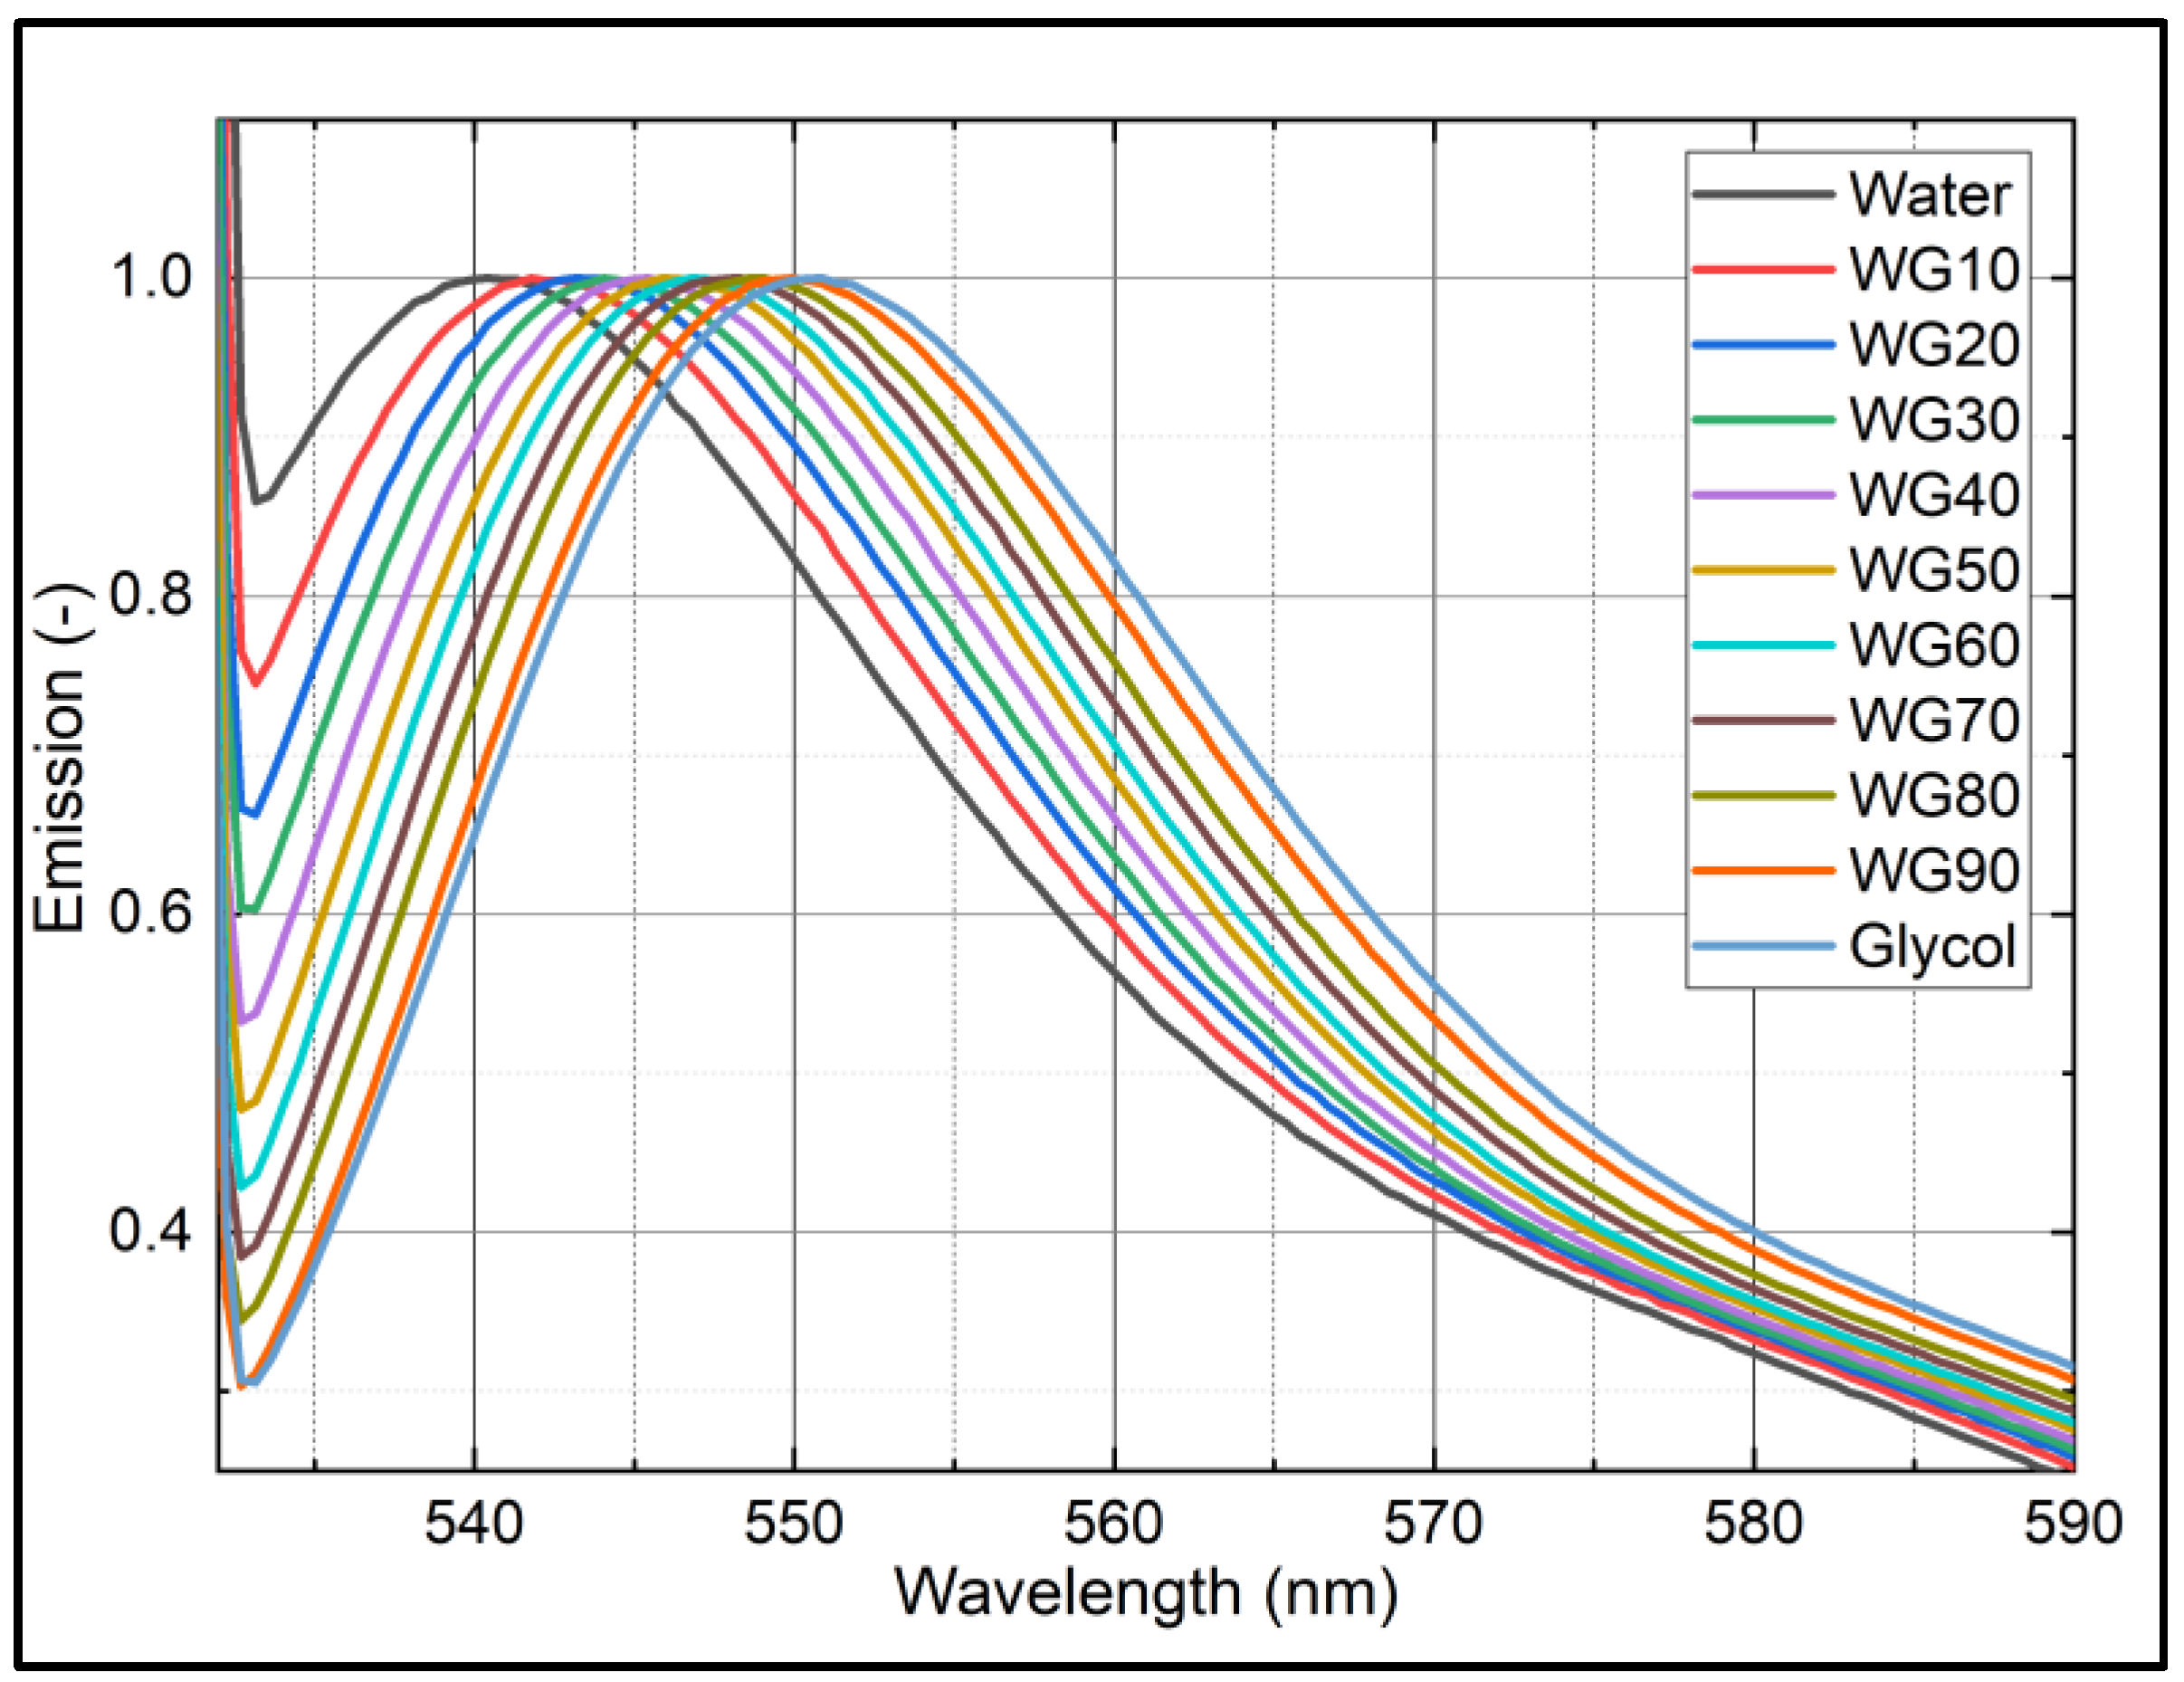
4.1.2. Emission
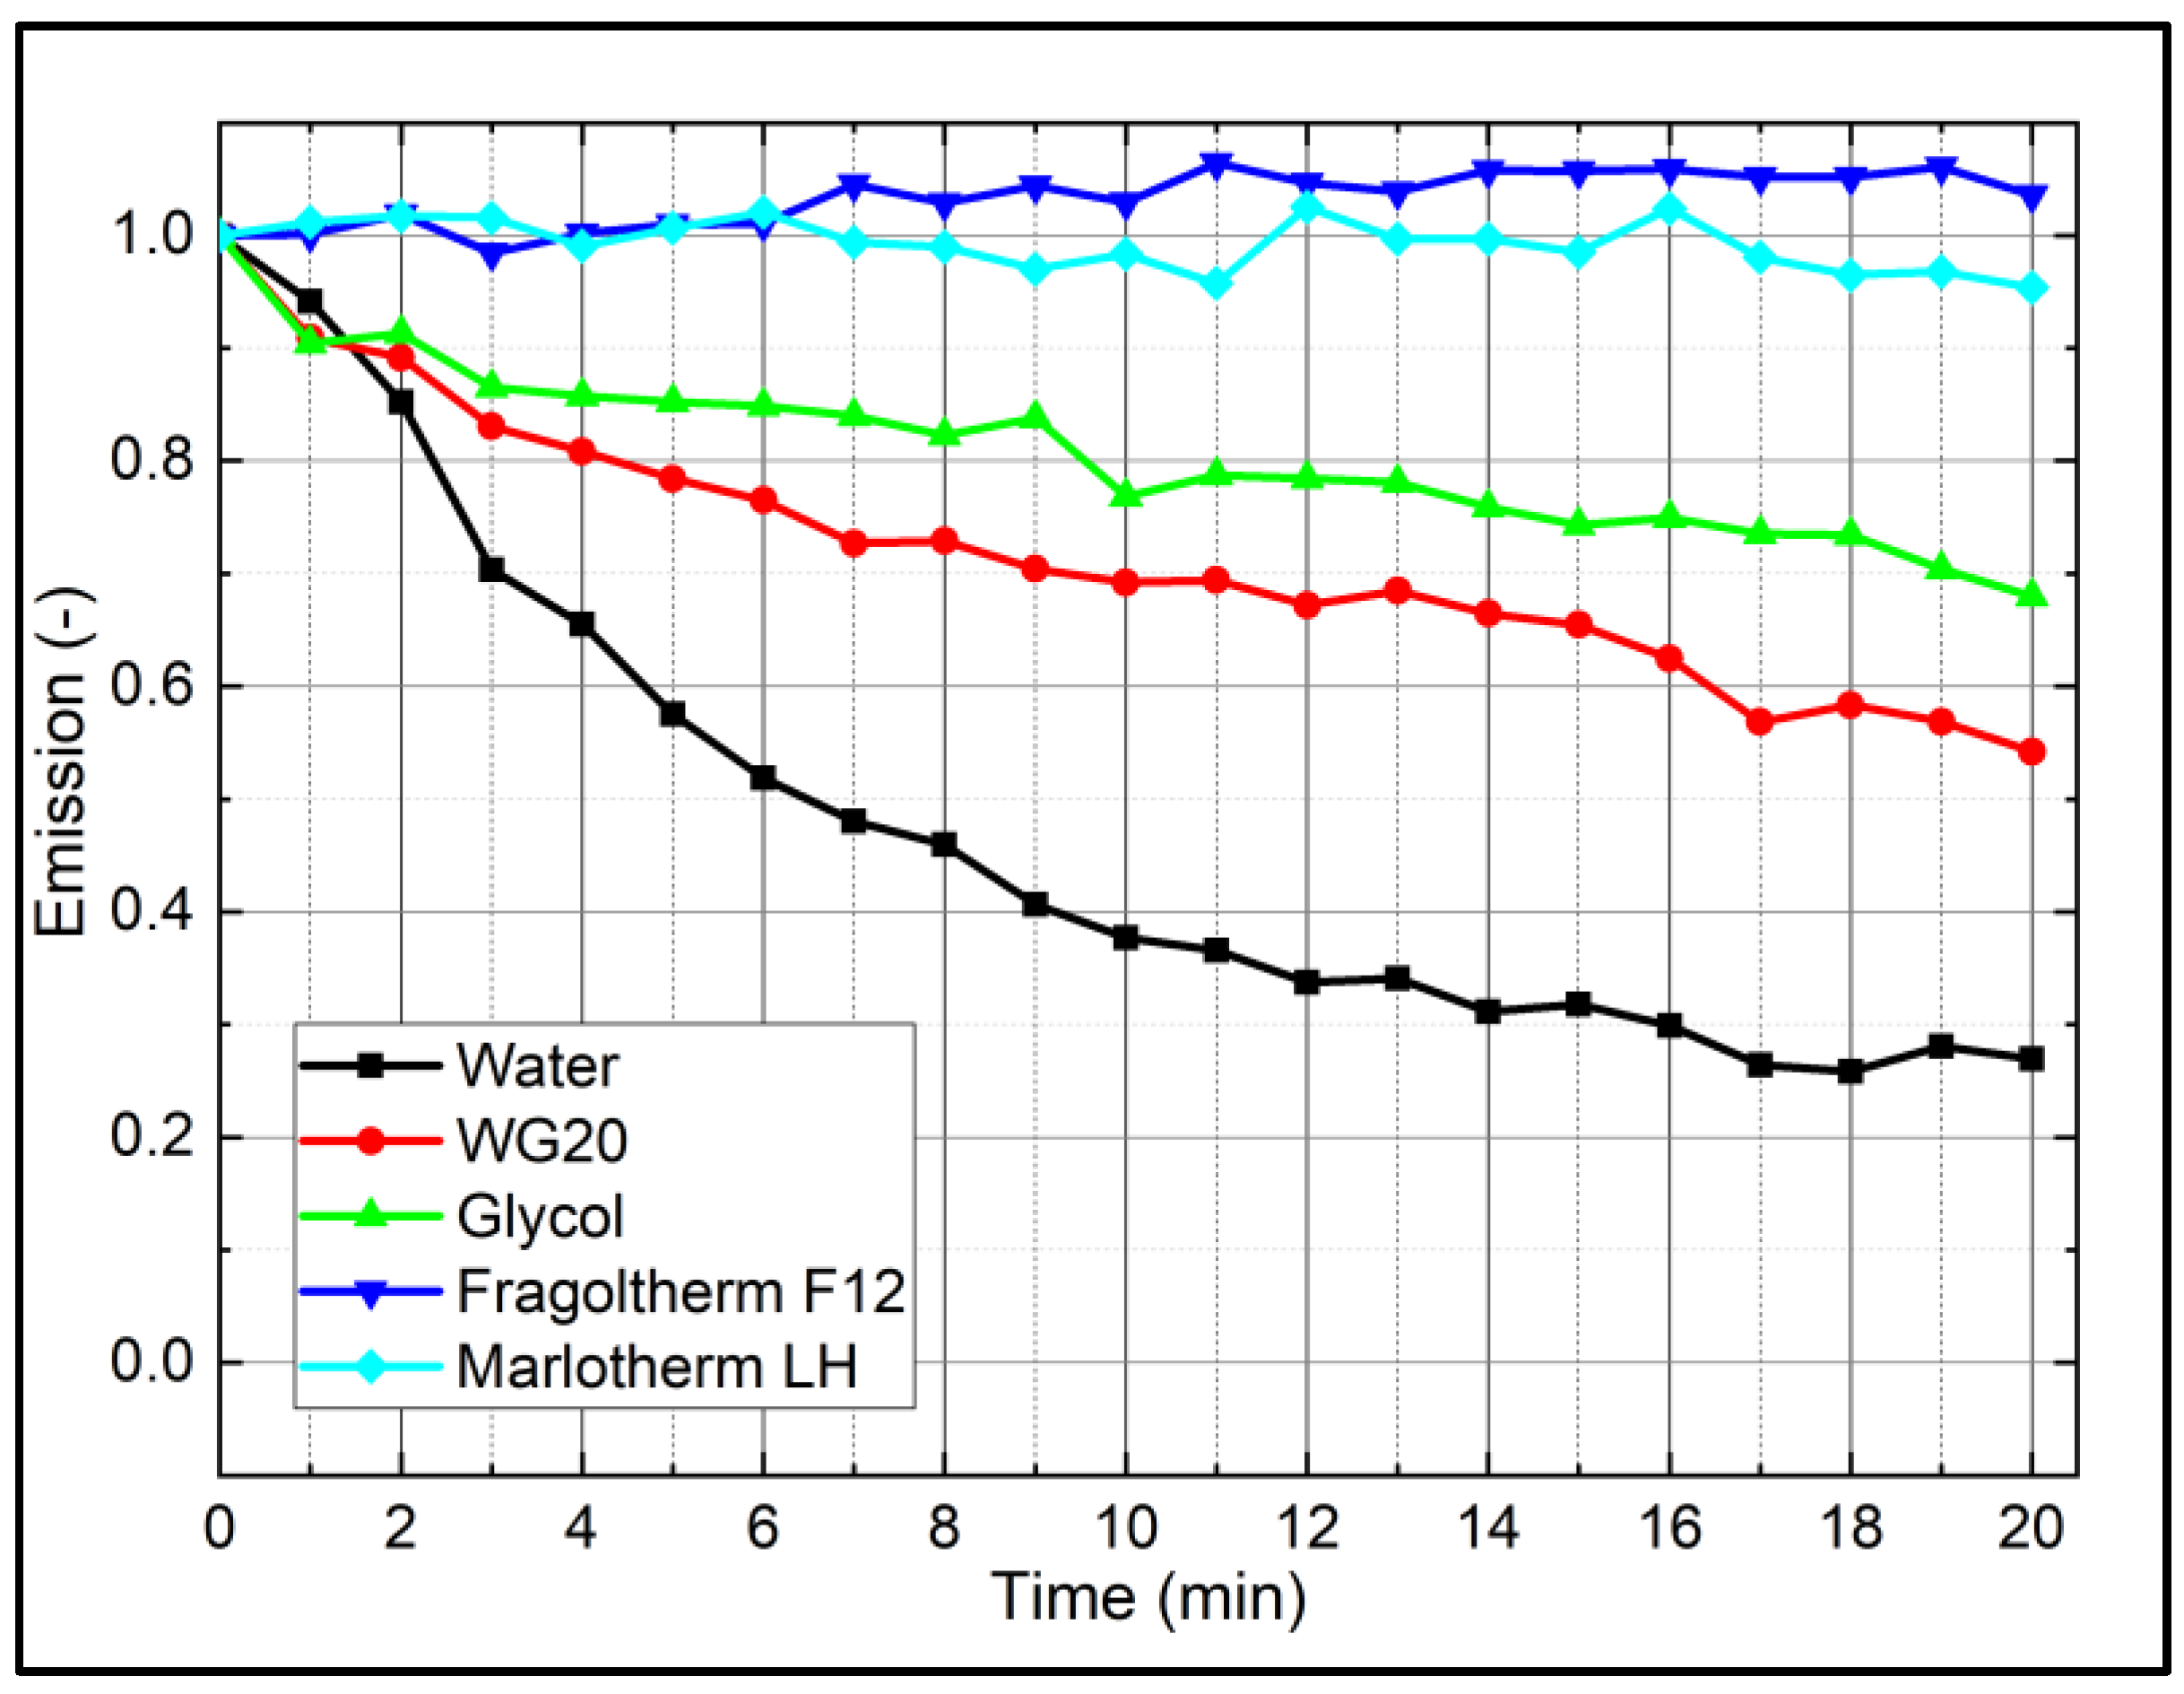
4.2. Photo-Dissociation
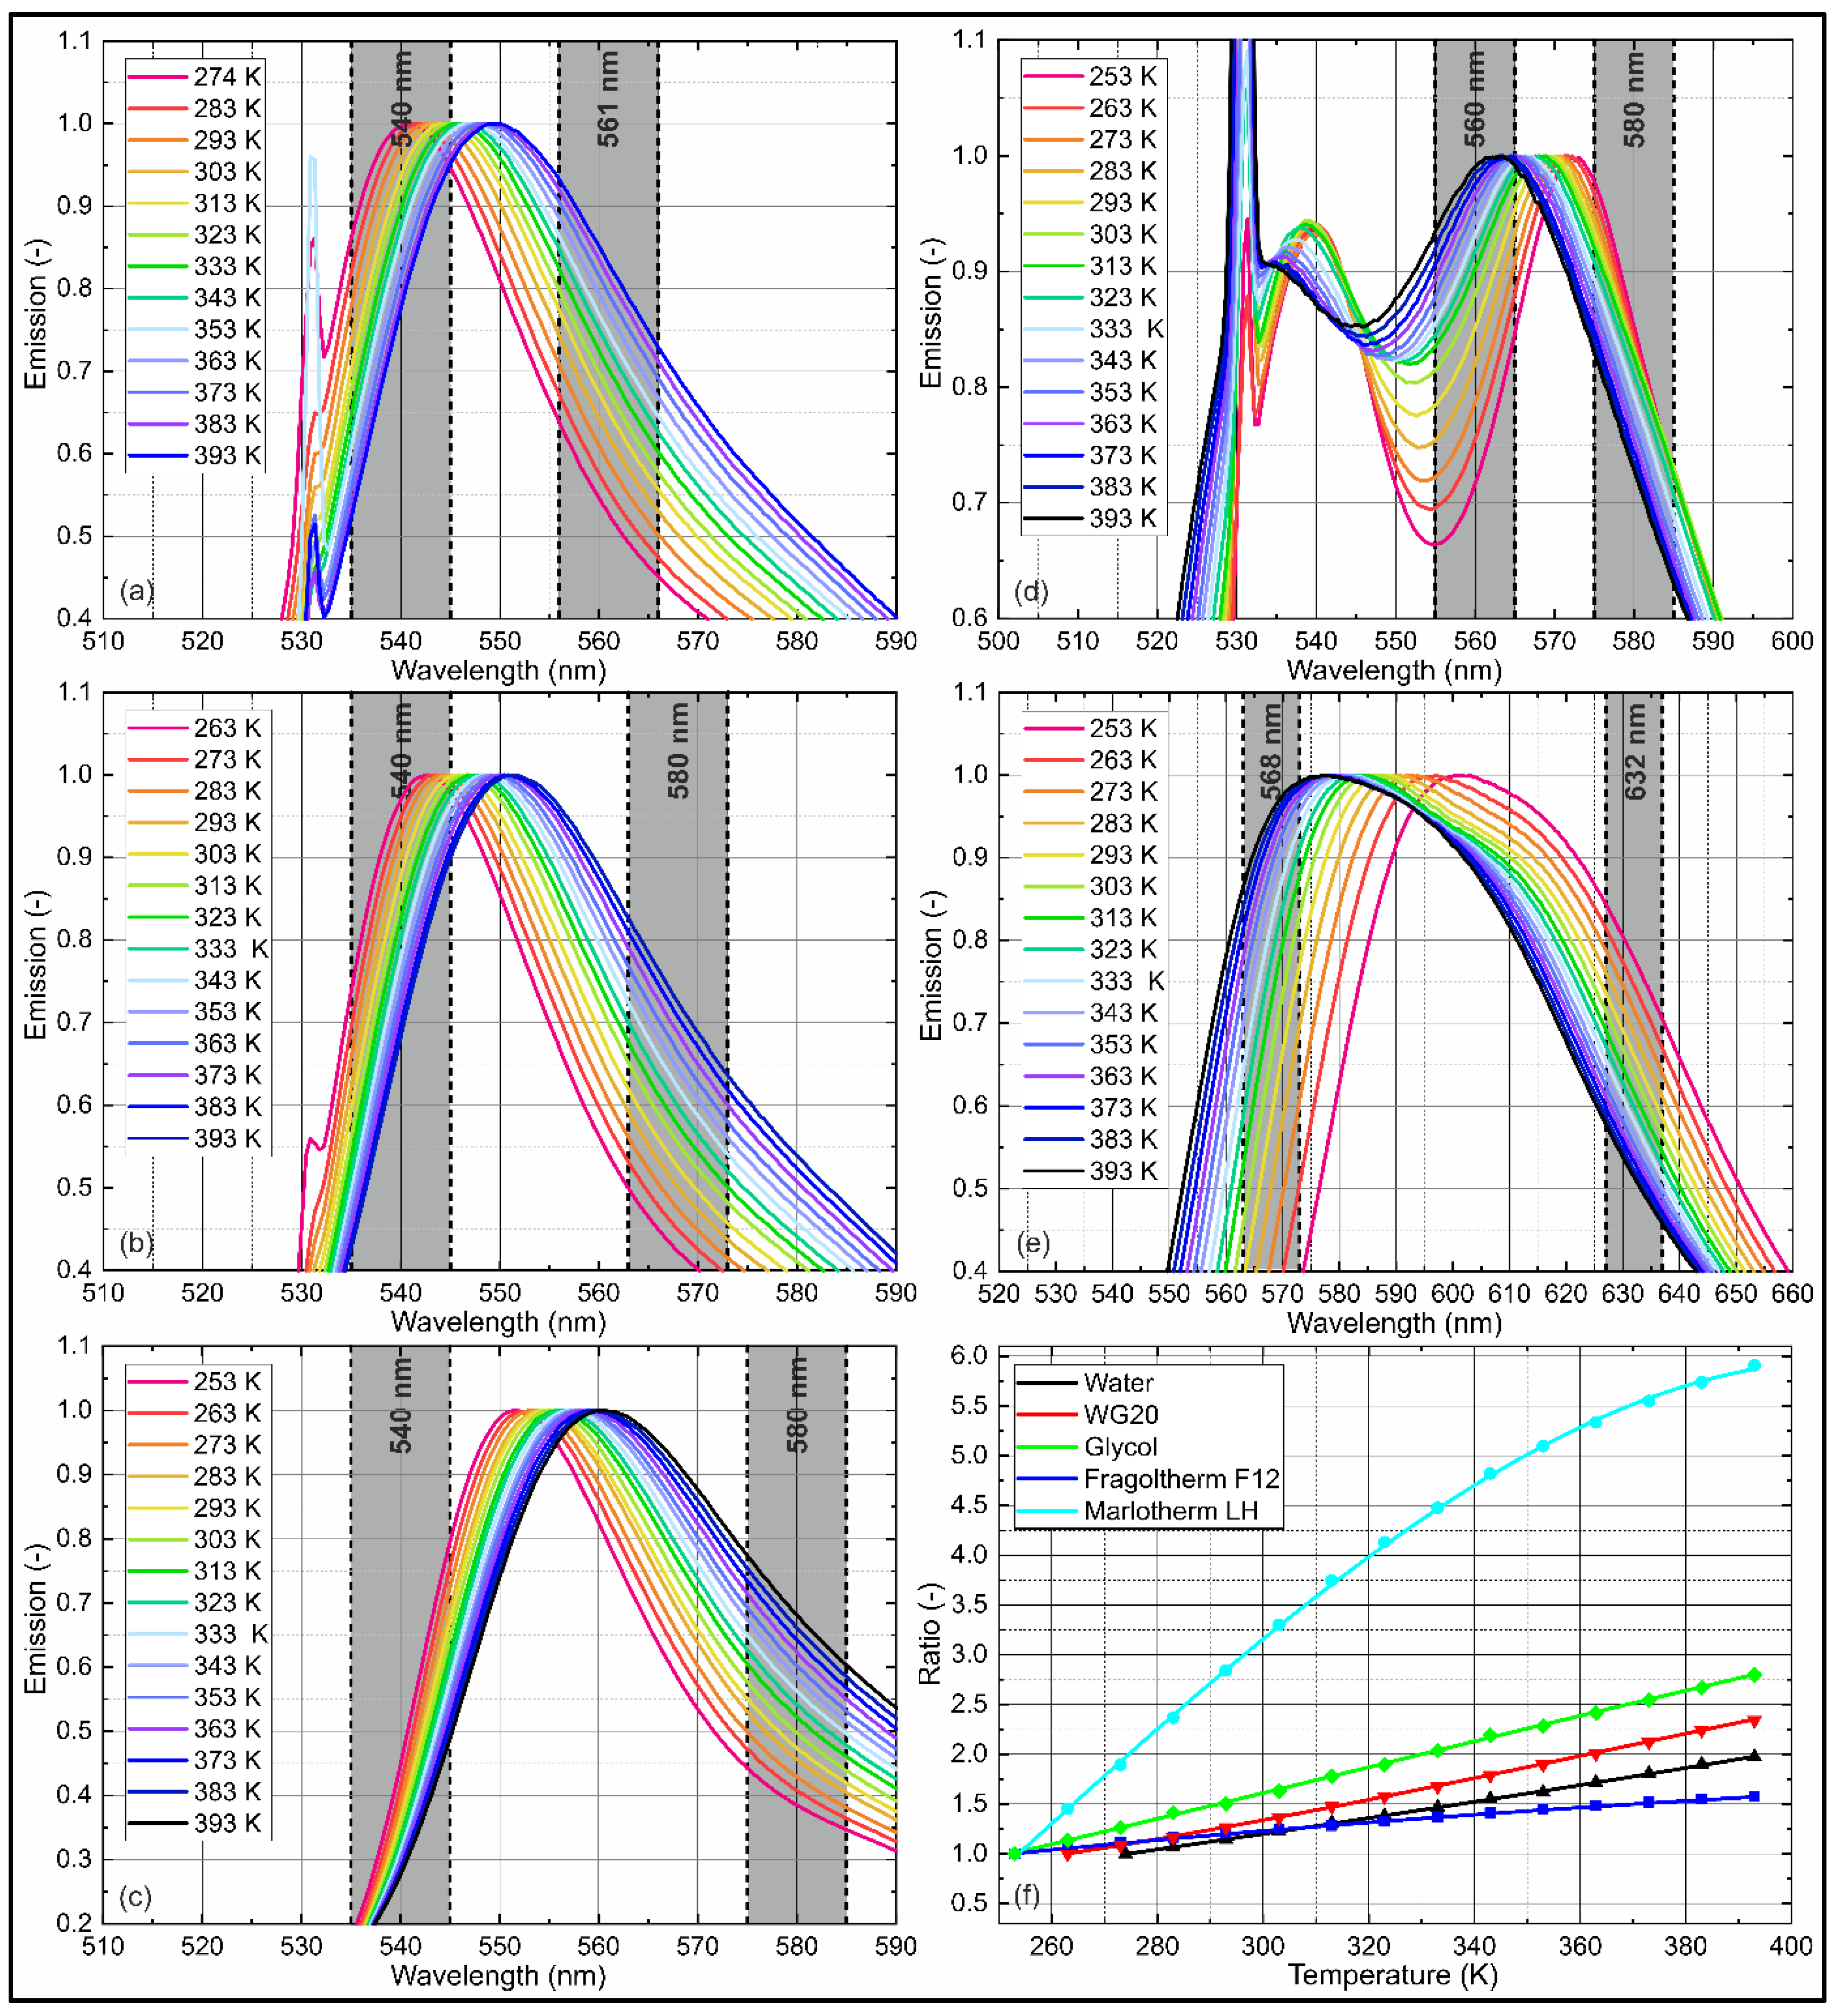
4.3. Temperature-Dependent Emission Spectra
5. Conclusions and Future Work
Author Contributions
Funding
Institutional Review Board Statement
Informed Consent Statement
Conflicts of Interest
Appendix A


References
- Roe, C.; Feng, X.; White, G.; Li, R.; Wang, H.; Rui, X.; Li, C.; Zhang, F.; Null, V.; Parkes, M.; et al. Immersion cooling for lithium-ion batteries—A review. J. Power Sources 2022, 525, 231094. [Google Scholar] [CrossRef]
- Pambudi, N.A.; Sarifudin, A.; Firdaus, R.A.; Ulfa, D.K.; Gandidi, I.M.; Romadhon, R. The immersion cooling technology: Current and future development in energy saving. Alex. Eng. J. 2022, 61, 9509–9527. [Google Scholar] [CrossRef]
- Pandey, H.; Kumar Gupta, N. A descriptive review of the thermal transport mechanisms in mono and hybrid nanofluid-filled heat pipes and current developments. Therm. Sci. Eng. Prog. 2022, 31, 101281. [Google Scholar] [CrossRef]
- Abdelkareem, M.A.; Maghrabie, H.M.; Abo-Khalil, A.G.; Adhari, O.H.K.; Sayed, E.T.; Radwan, A.; Rezk, H.; Jouhara, H.; Olabi, A.G. Thermal management systems based on heat pipes for batteries in EVs/HEVs. J. Energy Storage 2022, 51, 104384. [Google Scholar] [CrossRef]
- Labergue, A.; Gradeck, M.; Lemoine, F. Comparative study of the cooling of a hot temperature surface using sprays and liquid jets. Int. J. Heat Mass Transf. 2015, 81, 889–900. [Google Scholar] [CrossRef]
- Klinzing, W.P.; Rozzi, J.C.; Mudawar, I. Film and transition boiling correlations for quenching of hot surfaces with water sprays. J. Heat Treat. 1992, 9, 91–103. [Google Scholar] [CrossRef]
- Jia, W.; Qiu, H.H. Experimental investigation of droplet dynamics and heat transfer in spray cooling. Exp. Therm. Fluid Sci. 2003, 27, 829–838. [Google Scholar] [CrossRef]
- Chen, R.-H.; Chow, L.C.; Navedo, J.E. Effects of spray characteristics on critical heat flux in subcooled water spray cooling. Int. J. Heat Mass Transf. 2002, 45, 4033–4043. [Google Scholar] [CrossRef]
- Celata, G.P.; Cumo, M.; Mariani, A.; Saraceno, L. A comparison between spray cooling and film flow cooling during the rewetting of a hot surface. Heat Mass Transf. 2009, 45, 1029–1035. [Google Scholar] [CrossRef]
- Celata, G.P.; Cumo, M.; Lombardo, C.; Mariani, A.; Saraceno, L. Experimental result on rewetting of hot surfaces by droplet impingement. Exp. Therm. Fluid Sci. 2005, 29, 275–285. [Google Scholar] [CrossRef]
- Al-Ahmadi, H.M.; Yao, S.C. Spray cooling of high temperature metals using high mass flux industrial nozzles. Exp. Heat Transf. 2008, 21, 38–54. [Google Scholar] [CrossRef]
- Lemoine, F.; Castanet, G. Temperature and chemical composition of droplets by optical measurement techniques: A state-of-the-art review. Exp. Fluids 2013, 54, 1572. [Google Scholar] [CrossRef]
- Domann, R.; Hardalupas, Y. Spatial distribution of fluorescence intensity within large droplets and its dependence on dye concentration. Appl. Opt. 2001, 40, 3586–3597. [Google Scholar] [CrossRef] [PubMed]
- Domann, R.; Hardalupas, Y. A Study of Parameters that Influence the Accuracy of the Planar Droplet Sizing (PDS) Technique. Part. Part. Syst. Charact. 2001, 18, 3–11. [Google Scholar] [CrossRef]
- Domann, R.; Hardalupas, Y.; Jones, A.R. A study of the influence of absorption on the spatial distribution of fluorescence intensity within large droplets using Mie theory, geometrical optics and imaging experiments. Meas. Sci. Technol. 2002, 13, 280–291. [Google Scholar] [CrossRef]
- Domann, R.; Hardalupas, Y. Quantitative Measurement of Planar Droplet Sauter Mean Diameter in Sprays using Planar Droplet Sizing. Part. Part. Syst. Charact. 2003, 20, 209–218. [Google Scholar] [CrossRef]
- Frackowiak, B.; Tropea, C. Numerical analysis of diameter influence on droplet fluorescence. Appl. Opt. 2010, 49, 2363–2370. [Google Scholar] [CrossRef]
- Frackowiak, B.; Tropea, C. Fluorescence modeling of droplets intersecting a focused laser beam. Opt. Lett. 2010, 35, 1386–1388. [Google Scholar] [CrossRef]
- Koegl, M.; Mishra, Y.N.; Hofbeck, B.; Baderschneider, K.; Huber, F.J.T.; Pracht, J.; Berrocal, E.; Will, S.; Zigan, L. 3D LIF/Mie planar droplet sizing in IC engine sprays using single-droplet calibration data. In Proceedings of the ICLASS 2018: 14th International Conference on Liquid Atomization & Spray Systems, Chicago, IL, USA, 22–26 July 2018. [Google Scholar]
- Koegl, M.; Hofbeck, B.; Baderschneider, K.; Mishra, Y.N.; Huber, F.J.T.; Berrocal, E.; Will, S.; Zigan, L. Analysis of LIF and Mie signals from single micrometric droplets for instantaneous droplet sizing in sprays. Opt. Express 2018, 26, 31750–31766. [Google Scholar] [CrossRef]
- Mishra, Y.N.; Koegl, M.; Baderschneider, K.; Hofbeck, B.; Berrocal, E.; Conrad, C.; Will, S.; Zigan, L. 3D mapping of droplet Sauter mean diameter in sprays. Appl. Opt. 2019, 58, 3775–3783. [Google Scholar] [CrossRef]
- Charalampous, G.; Hardalupas, Y. Numerical evaluation of droplet sizing based on the ratio of fluorescent and scattered light intensities (LIF/Mie technique). Appl. Opt. 2011, 50, 1197–1209. [Google Scholar] [CrossRef] [PubMed]
- Charalampous, G.; Hardalupas, Y. Method to reduce errors of droplet sizing based on the ratio of fluorescent and scattered light intensities (laser-induced fluorescence/Mie technique). Appl. Opt. 2011, 50, 3622–3637. [Google Scholar] [CrossRef] [PubMed]
- Le Gal, P.; Farrugia, N.; Greenhalgh, D.A. Laser Sheet Dropsizing of dense sprays. Opt. Laser Technol. 1999, 31, 75–83. [Google Scholar] [CrossRef]
- Koegl, M.; Baderschneider, K.; Bauer, F.; Hofbeck, B.; Berrocal, E.; Will, S.; Zigan, L. Analysis of the LIF/Mie Ratio from Individual Droplets for Planar Droplet Sizing: Application to Gasoline Fuels and Their Mixtures with Ethanol. Appl. Sci. 2019, 9, 4900. [Google Scholar] [CrossRef]
- Koegl, M.; Mishra, Y.N.; Baderschneider, K.; Conrad, C.; Lehnert, B.; Will, S.; Zigan, L. Planar droplet sizing for studying the influence of ethanol admixture on the spray structure of gasoline sprays. Exp. Fluids 2020, 61, 209. [Google Scholar] [CrossRef]
- Malarski, A.; Schurer, B.; Schmitz, I.; Zigan, L.; Flugel, A.; Leipertz, A. Laser sheet dropsizing based on two-dimensional Raman and Mie scattering. Appl. Opt. 2009, 48, 1853–1860. [Google Scholar] [CrossRef]
- Bareiss, S.; Bork, B.; Bakić, S.; Tropea, C.; Irsig, R.; Tiggesbäumker, J.; Dreizler, A. Application of femtosecond lasers to the polarization ratio technique for droplet sizing. Meas. Sci. Technol. 2013, 24, 025203. [Google Scholar] [CrossRef]
- Beretta, F.; Cavaliere, A.; D’Alessio, A.; Massoli, P.; Ragucci, R. A spectral scattering method for determining size distribution functions and optical characteristics of droplets ensembles in fuel sprays. Symp. Int. Combust. 1988, 21, 675–683. [Google Scholar] [CrossRef]
- Massoli, P.; Beretta, F.; D’Alessio, A. Single droplet size, velocity, and optical characteristics by the polarization properties of scattered light. Appl. Opt. 1989, 28, 1200–1205. [Google Scholar] [CrossRef]
- Massoli, P.; Beretta, F.; D’alessio, A.J.C.E.C. A new experimental technique for the determination of single droplets size, velocity and optical properties inside sprays. Chem. Eng. Commun. 1989, 75, 171–180. [Google Scholar] [CrossRef]
- Hofeldt, D.L. Full-field measurements of particle size distributions: I. theoretical limitations of the polarization ratio method. Appl. Opt. 1993, 32, 7551–7558. [Google Scholar] [CrossRef] [PubMed]
- Serpenguzel, A.; Kucuksenel, S.; Chang, R.K. Microdroplet identification and size measurement in sprays with lasing images. Opt. Express 2002, 10, 1118–1132. [Google Scholar] [CrossRef] [PubMed]
- Park, S.; Cho, H.; Yoon, I.; Min, K. Measurement of droplet size distribution of gasoline direct injection spray by droplet generator and planar image technique. Meas. Sci. Technol. 2002, 13, 859–864. [Google Scholar] [CrossRef]
- Schulz, C.; Sick, V. Tracer-LIF Diagnostics: Quantitative Measurement of Fuel Concentration, Temperature and Fuel/Air Ratio in Practical Combustion Systems. Prog. Energy Combust. Sci. 2005, 31, 75–121. [Google Scholar] [CrossRef]
- Kranz, P.; Kaiser, S.A. LIF-based imaging of preferential evaporation of a multi-component gasoline surrogate in a direct-injection engine. Proc. Combust. Inst. 2019, 37, 1365–1372. [Google Scholar] [CrossRef]
- Retzer, U.; Ulrich, H.; Will, S.; Zigan, L. Burst-mode 1-methylnaphthalene laser-induced fluorescence: Extended calibration and measurement of temperature and fuel partial density in a rapid compression machine. Appl. Phys. B 2022, 128, 144. [Google Scholar] [CrossRef]
- Lind, S.; Trost, J.; Zigan, L.; Will, S.; Leipertz, A. Application of the tracer combination TEA/acetone for multi-parameter laser-induced fluorescence measurements in IC engines with exhaust gas recirculation. Proc. Combust. Inst. 2014, 35, 3783–3791. [Google Scholar] [CrossRef]
- Geiler, J.; Mirschinka, F.; Kaiser, S. Characterization of the fluorescence properties of selected organic compounds for measuring the thickness of evaporating liquid fuel films. Appl. Phys. B 2021, 127, 110. [Google Scholar] [CrossRef]
- Mishra, Y.N.; Yoganantham, A.; Koegl, M.; Zigan, L. Investigation of Five Organic Dyes in Ethanol and Butanol for Two-Color Laser-Induced Fluorescence Ratio Thermometry. Optics 2020, 1, 1–17. [Google Scholar] [CrossRef]
- Ulrich, H.; Lehnert, B.; Guenot, D.; Svendsen, K.; Lundh, O.; Wensing, M.; Berrocal, E.; Zigan, L. Effects of liquid properties on atomization and spray characteristics studied by planar two-photon fluorescence. Phys. Fluids 2022, 34, 083305. [Google Scholar] [CrossRef]
- Prenting, M.; Dzulfida, M.; Dreier, T.; Schulz, C. Characterization of tracers for two-color laser-induced fluorescence liquid-phase temperature imaging in sprays. Exp. Fluids 2020, 61, 77. [Google Scholar] [CrossRef]
- Lavieille, P.; Lemoine, F.; Lavergne, G.; Lebouché, M. Evaporating and combusting droplet temperature measurements using two-color laser-induced fluorescence. Exp. Fluids 2001, 31, 45–55. [Google Scholar] [CrossRef]
- Castanet, G.; Liénart, T.; Lemoine, F. Dynamics and temperature of droplets impacting onto a heated wall. Int. J. Heat Mass Transf. 2009, 52, 670–679. [Google Scholar] [CrossRef]
- Labergue, A.; Deprédurand, V.; Delconte, A.; Castanet, G.; Lemoine, F. New insight into two-color LIF thermometry applied to temperature measurements of droplets. Exp. Fluids 2010, 49, 547–556. [Google Scholar] [CrossRef][Green Version]
- Vetrano, M.R.; Simonini, A.; Steelant, J.; Rambaud, P. Thermal characterization of a flashing jet by planar laser-induced fluorescence. Exp. Fluids 2013, 54, 1573. [Google Scholar] [CrossRef]
- Zhou, J.; Yang, W.; Yin, Y.; Chen, S.; Yan, B.; Mu, J.; Qi, X. Nonlinear temperature calibration equation for Rhodamine B in different solutions for wide-temperature-range applications. Appl. Opt. 2019, 58, 1514–1518. [Google Scholar] [CrossRef]
- Estrada-Pérez, C.; Hassan, Y.; Tan, S. Experimental characterization of temperature sensitive dyes for laser induced fluorescence thermometry. Rev. Sci. Instrum. 2011, 82, 074901. [Google Scholar] [CrossRef]
- Chaze, W.; Caballina, O.; Castanet, G.; Lemoine, F. Spatially and temporally resolved measurements of the temperature inside droplets impinging on a hot solid surface. Exp. Fluids 2017, 58, 96. [Google Scholar] [CrossRef]
- Castanet, G.; Chaze, W.; Caballina, O.; Collignon, R.; Lemoine, F. Transient evolution of the heat transfer and the vapor film thickness at the drop impact in the regime of film boiling. Phys. Fluids 2018, 30, 122109. [Google Scholar] [CrossRef]
- Perrin, L.; Castanet, G.; Lemoine, F. Characterization of the evaporation of interacting droplets using combined optical techniques. Exp. Fluids 2015, 56, 29. [Google Scholar] [CrossRef]
- Palmer, J.; Reddemann, M.A.; Kirsch, V.; Kneer, R. Temperature measurements of micro-droplets using pulsed 2-color laser-induced fluorescence with MDR-enhanced energy transfer. Exp. Fluids 2016, 57, 177. [Google Scholar] [CrossRef]
- Palmer, J.; Reddemann, M.; Kirsch, V.; Kneer, R. Applying 2D-2cLIF-EET thermometry for micro-droplet internal temperature imaging. Exp. Fluids 2018, 59, 51. [Google Scholar] [CrossRef]
- Wolff, M.; Delconte, A.; Schmidt, F.; Gucher, P.; Lemoine, F. High-pressure Diesel spray temperature measurements using two-colour laser-induced fluorescence. Meas. Sci. Technol. 2007, 18, 697–706. [Google Scholar] [CrossRef]
- Depredurand, V.; Miron, P.; Labergue, A.; Wolff, M.; Castanet, G.; Lemoine, F. A temperature-sensitive tracer suitable for two-colour laser-induced fluorescence thermometry applied to evaporating fuel droplets. Meas. Sci. Technol. 2008, 19, 105403. [Google Scholar] [CrossRef]
- Deprédurand, V.; Delconte, A.; Lemoine, F. Combined PDA and LIF applied to size–temperature correlations measurements in a heated spray. Exp. Fluids 2011, 50, 561–571. [Google Scholar] [CrossRef]
- Koegl, M.; Pahlevani, M.; Zigan, L. A Novel Approach for Measurement of Composition and Temperature of N-Decane/Butanol Blends Using Two-Color Laser-Induced Fluorescence of Nile Red. Sensors 2020, 20, 5721. [Google Scholar] [CrossRef]
- Koegl, M.; Dai, H.; Baderschneider, K.; Ulrich, H.; Zigan, L. Polarization-dependent LIF/Mie ratio for sizing of micrometric ethanol droplets doped with Nile red. Appl. Opt. 2022, 61, 4204–4214. [Google Scholar] [CrossRef] [PubMed]
- Koegl, M.; Mull, C.; Baderschneider, K.; Wislicenus, J.; Will, S.; Zigan, L. Characterization of Nile Red as a Tracer for Laser-Induced Fluorescence Spectroscopy of Gasoline and Kerosene and Their Mixture with Biofuels. Sensors 2019, 19, 2822. [Google Scholar] [CrossRef]
- Bernardin, J.D.; Stebbins, C.J.; Mudawar, I. Mapping of impact and heat transfer regimes of water drops impinging on a polished surface. Int. J. Heat Mass Transf. 1997, 40, 247–267. [Google Scholar] [CrossRef]
- Gradeck, M.; Ouattara, J.A.; Rémy, B.; Maillet, D. Solution of an inverse problem in the Hankel space—Infrared thermography applied to estimation of a transient cooling flux. Exp. Therm. Fluid Sci. 2012, 36, 56–64. [Google Scholar] [CrossRef]
- Dunand, P.; Castanet, G.; Gradeck, M.; Maillet, D.; Lemoine, F. Energy balance of droplets impinging onto a wall heated above the Leidenfrost temperature. Int. J. Heat Fluid Flow 2013, 44, 170–180. [Google Scholar] [CrossRef]
- Fansler, T.D.; Parrish, S.E. Spray measurement technology: A review. Meas. Sci. Technol. 2015, 26, 012002. [Google Scholar] [CrossRef]
- Sick, V.; Stojkovic, B.D. Evolution and impingement of an automotive fuel spray investigated with simultaneous Mie/LIF techniques. Appl. Phys. B 2001, 73, 75–83. [Google Scholar] [CrossRef]
- Cho, H.; Min, K. Measurement of liquid fuel film distribution on the cylinder liner of a spark ignition engine using the laser-induced fluorescence technique. Meas. Sci. Technol. 2003, 14, 975. [Google Scholar] [CrossRef]
- Alonso, M.; Kay, P.J.; Bowen, P.J.; Gilchrist, R.; Sapsford, S. A laser induced fluorescence technique for quantifying transient liquid fuel films utilising total internal reflection. Exp. Fluids 2010, 48, 133–142. [Google Scholar] [CrossRef]
- Yang, J.; Melton, L.A. Fluorescence-Based Method Designed for Quantitative Measurement of Fuel Film Thickness during Cold-Start of Engines. Appl. Spectrosc. 2000, 54, 565–574. [Google Scholar] [CrossRef]
- Spathopoulou, M.; Gavaises, M.; Theodorakakos, A.; Yanagihara, H. Formation and development of wall liquid films during impaction of gasoline fuel sprays. At. Sprays 2009, 19, 701–726. [Google Scholar] [CrossRef]
- Huang, C.-Y.; Murthy, T.G.; Chandrasekar, S. Simultaneous Measurements of Thickness and Temperature Profile of the Lubricant Film at Chip-tool Interface during Machining Process Using Luminescent Sensors. Procedia Eng. 2014, 79, 9–16. [Google Scholar] [CrossRef]
- Mouza, A.; Vlachos, N.A.; Paras, S.; Karabelas, A. Measurement of liquid film thickness using a laser light absorption method. Exp. Fluids 2000, 28, 355–359. [Google Scholar] [CrossRef]
- Yang, H.; Wei, W.; Su, M.; Chen, J.; Cai, X. Measurement of liquid water film thickness on opaque surface with diode laser absorption spectroscopy. Flow Meas. Instrum. 2018, 60, 110–114. [Google Scholar] [CrossRef]
- Pan, R.; Jeffries, J.; Dreier, T.; Schulz, C. Measurements of liquid film thickness, concentration, and temperature of aqueous urea solution by NIR absorption spectroscopy. Appl. Phys. B 2016, 122, 4. [Google Scholar] [CrossRef]
- Wu, W.; Kong, S.; Xu, X.; Tao, J.; Li, C.; Wang, J.; Su, M.; Yang, H. Simultaneous measurement of liquid film thickness and temperature on metal surface. Spectrochim. Acta Part A Mol. Biomol. Spectrosc. 2021, 257, 119804. [Google Scholar] [CrossRef] [PubMed]
- Maligne, D.; Bruneaux, G. Time-Resolved Fuel Film Thickness Measurement for Direct Injection SI Engines Using Refractive Index Matching. In Proceedings of the SAE 2011 World Congress and Exhibition, Detroit, Michigan, 12–14 April 2011. [Google Scholar] [CrossRef]
- Drake, M.C.; Fansler, T.D.; Solomon, A.S.; Szekely, G.A. Piston Fuel Films as a Source of Smoke and Hydrocarbon Emissions from a Wall-Controlled Spark-Ignited Direct-Injection Engine. SAE Tech. Pap. 2003, 112, 762–783. [Google Scholar] [CrossRef]
- Schagen, A.; Modigell, M.; Dietze, G.; Kneer, R. Simultaneous measurement of local film thickness and temperature distribution in wavy liquid films using a luminescence technique. Int. J. Heat Mass Transf. 2006, 49, 5049–5061. [Google Scholar] [CrossRef]
- Borgetto, N.; André, F.; Galizzi, C.; Escudié, D. Simultaneous film thickness measurement and wall temperature assessment by Low-Coherence Interferometry. Exp. Therm. Fluid Sci. 2013, 44, 512–519. [Google Scholar] [CrossRef]
- Collignon, R.; Caballina, O.; Lemoine, F.; Markides, C.; Castanet, G. Heat Transfer Enhancement in Wavy Films Falling on a Heated Inclined Plate. SSRN Electron. J. 2022. [Google Scholar] [CrossRef]
- Koegl, M.; Weiß, C.; Zigan, L. Fluorescence Spectroscopy for Studying Evaporating Droplets Using the Dye Eosin-Y. Sensors 2020, 20, 5985. [Google Scholar] [CrossRef]
- Kim, C.; Okuyama, K.; Fernandez de la Mora, J. Performance Evaluation of an Improved Particle Size Magnifier (PSM) for Single Nanoparticle Detection. Aerosol Sci. Technol. 2003, 37, 791–803. [Google Scholar] [CrossRef]
- Eastman Chemical Company. Marlotherm LH. Available online: https://www.eastman.com/Literature_Center/S/SFEHTF10985.pdf (accessed on 19 July 2022).
- Fragol, A.G. Fragoltherm F12. Available online: https://www.fragol.de/waermetraeger/waermetraeger/produkte/fragolthermr-f-12.html?gclid=CjwKCAjwrNmWBhA4EiwAHbjEQKsbDFKcVIUPQ4Pj11ONYpVdh4_8-E_oK7tnJy9Z7a99Vpc8JJcw_hoC4OkQAvD_BwE (accessed on 19 July 2022).
- Lecher, K.; Lühr, H.-P.; Zanke, U.C.E. Taschenbuch der Wasserwirtschaft: Mit 170 Tabellen; Vieweg+Teubner Verlag: Stuttgart, Germany, 2001. [Google Scholar]
- Braun, N.O.; Persson, U.Å.; Karlsson, H.T. Densities and Viscosities of Mono(ethylene glycol) + 2-Amino-2-methyl-1-propanol + Water. J. Chem. Eng. Data 2001, 46, 805–808. [Google Scholar] [CrossRef]
- Zhang, Y.; Leng, J.; Hu, W. Theoretical Design of a Two-Photon Fluorescent Probe for Nitric Oxide with Enhanced Emission Induced by Photoninduced Electron Transfer. Sensors 2018, 18, 1324. [Google Scholar] [CrossRef]
- Lin, B.S.; Yang, Y.C.; Ho, C.Y.; Yang, H.Y.; Wang, H.Y. A PDMS-based cylindrical hybrid lens for enhanced fluorescence detection in microfluidic systems. Sensors 2014, 14, 2967–2980. [Google Scholar] [CrossRef] [PubMed]
- Greenspan, P.; Fowler, S.D. Spectrofluorometric Studies of the Lipid Probe, Nile Red. J. Lipid Res. 1985, 26, 781–789. [Google Scholar] [CrossRef]
- Koegl, M.; Dai, H.; Qomi, M.P.; Bauer, F.; Eppinger, B.; Zigan, L. Morphology-dependent resonances in laser-induced fluorescence images of micrometric gasoline/ethanol droplets utilizing the dye nile red. Appl. Opt. 2021, 60, 5000–5011. [Google Scholar] [CrossRef]
- Kalathimekkad, S.; Missinne, J.; Schaubroeck, D.; Mandamparambil, R.; Van Steenberge, G. Alcohol Vapor Sensor Based on Fluorescent Dye-Doped Optical Waveguides. IEEE Sens. J. 2015, 15, 76–81. [Google Scholar] [CrossRef]
- Durst, A.; Wensing, M.; Berrocal, E. Light sheet fluorescence microscopic imaging for the primary breakup of diesel and gasoline sprays with real-world fuels. Appl. Opt. 2018, 57, 2704–2714. [Google Scholar] [CrossRef] [PubMed]
- Nile Red. Available online: https://www.carlroth.com/medias/SDB-7726-IE-EN.pdf?context=bWFzdGVyfHNlY3VyaXR5RGF0YXNoZWV0c3wyMjY2ODN8YXBwbGljYXRpb24vcGRmfHNlY3VyaXR5RGF0YXNoZWV0cy9oNWQvaDliLzg5NjUwMTE4MDAwOTQucGRmfGQzYzliZWViOGRlMDU5MGQ0MTMwMDk4YTkwODk5YTgxNGUyZjI2NmJiOTExMzk0Y2FiNzRiZjg0ZWY3OGU1ZGY (accessed on 19 July 2022).
- Ali, H.; Ali, S.; Mazhar, M.; Ali, A.; Jahan, A.; Ali, A. Eosin fluorescence: A diagnostic tool for quantification of liver injury. Photodiagnosis Photodyn. Ther. 2017, 19, 37–44. [Google Scholar] [CrossRef]
- Selsted, M.E.; Becker, H.W. Eosin Y: A reversible stain for detecting electrophoretically resolved protein. Anal. Biochem. 1986, 155, 270–274. [Google Scholar] [CrossRef]
- Brumley, W.C.; Farley, J.W. Determining eosin as a groundwater migration tracer by capillary electrophoresis/laser-induced fluorescence using a multiwavelength laser. Electrophoresis 2003, 24, 2335–2339. [Google Scholar] [CrossRef]
- Koegl, M.; Mishra, Y.N.; Storch, M.; Conrad, C.; Berrocal, E.; Will, S.; Zigan, L. Analysis of ethanol and butanol direct-injection spark-ignition sprays using two-phase structured laser illumination planar imaging droplet sizing. Int. J. Spray Combust. Dyn. 2019, 11, 1756827718772496. [Google Scholar] [CrossRef]
- Safety Data Sheet Eosin-Y. Available online: https://www.merckmillipore.com/DE/de/product/msds/MDA_CHEM-115935?ReferrerURL=https%3A%2F%2Fwww.google.com%2F (accessed on 19 July 2022).


| Property | Unit | Fragoltherm F12 | Marlotherm LH | Monoethylen–Glycol | Water |
|---|---|---|---|---|---|
| Density | g/cm3 | 7.630 (20 °C) | 9.960 (20 °C) | 1.110 (25 °C) | 0.998 (20 °C) |
| Heat conductivity | W/(m∗K) | 0.110 (20 °C) | 0.132 (20 °C) | 0.260 | 0.597 (20 °C) |
| Viscosity | mm2/s | 1.60 (20 °C) | 4.00 (20 °C) | 16.31 (25 °C) | 1.00 (20 °C) |
| Mixture | Coefficient of Determination R2 |
|---|---|
| Water (Eosin-Y) | 0.9994 |
| WG20 (Eosin-Y) | 0.9993 |
| Glycol (Eosin-Y) | 0.9988 |
| Fragoltherm F12 (Nile red) | 0.9990 |
| Marlotherm LH (Nile red) | 0.9992 |
| Mixture | Coefficient of Determination R2 |
|---|---|
| Water (Eosin-Y) | 0.9883 |
| WG20 (Eosin-Y) | 0.9563 |
| Glycol (Eosin-Y) | 0.9930 |
| Fragoltherm F12 (Nile red) | 0.9970 |
| Marlotherm LH (Nile red | 0.9923 |
| Filter 1 | Filter 2 | |||
|---|---|---|---|---|
| Solvent | CWL (nm) | SN | CWL (nm) | SN |
| Water | 561 | #12-152 | 540 | #65-157 |
| WG20 | 568 | #65-160 | 540 | #65-157 |
| Glycol | 580 | #65-161 | 540 | #65-157 |
| Fragoltherm F12 | 560 | #88-011 | 580 | #65-161 |
| Marlotherm LH | 568 | #65-221 | 632 | #65-166 |
| p1 | p2 | p3 | p4 | R2 | Valid | |
|---|---|---|---|---|---|---|
| Water | 1.27 × 10⁻⁸ | −7.44 × 10⁻⁶ | 0.008919 | −1.149 | 0.9996 | (274 K–393 K) |
| WG20 | −9.77 × 10⁻⁸ | 0.0001075 | −0.02819 | 2.758 | 0.9999 | (263 K–393 K) |
| Glycol | −3.77 × 10⁻⁸ | 3.57 × 10⁻⁵ | 0.001729 | −1.103 | 0.9995 | (253 K–393 K) |
| Fragoltherm F12 | 6.58 × 10⁻⁹ | −1.44 × 10⁻⁵ | 0.01127 | −1.033 | 0.9993 | (253 K–393 K) |
| Marlotherm LH | −6.14 × 10⁻⁷ | 4.56 × 10⁻⁴ | −0.06435 | −1.999 | 0.9997 | (253 K–393 K) |
Publisher’s Note: MDPI stays neutral with regard to jurisdictional claims in published maps and institutional affiliations. |
© 2022 by the authors. Licensee MDPI, Basel, Switzerland. This article is an open access article distributed under the terms and conditions of the Creative Commons Attribution (CC BY) license (https://creativecommons.org/licenses/by/4.0/).
Share and Cite
Koegl, M.; Delwig, M.; Zigan, L. Characterization of Fluorescence Tracers for Thermometry and Film Thickness Measurements in Liquid Coolants Relevant for Thermal Management of Electric and Electronic Components. Sensors 2022, 22, 8892. https://doi.org/10.3390/s22228892
Koegl M, Delwig M, Zigan L. Characterization of Fluorescence Tracers for Thermometry and Film Thickness Measurements in Liquid Coolants Relevant for Thermal Management of Electric and Electronic Components. Sensors. 2022; 22(22):8892. https://doi.org/10.3390/s22228892
Chicago/Turabian StyleKoegl, Matthias, Moritz Delwig, and Lars Zigan. 2022. "Characterization of Fluorescence Tracers for Thermometry and Film Thickness Measurements in Liquid Coolants Relevant for Thermal Management of Electric and Electronic Components" Sensors 22, no. 22: 8892. https://doi.org/10.3390/s22228892
APA StyleKoegl, M., Delwig, M., & Zigan, L. (2022). Characterization of Fluorescence Tracers for Thermometry and Film Thickness Measurements in Liquid Coolants Relevant for Thermal Management of Electric and Electronic Components. Sensors, 22(22), 8892. https://doi.org/10.3390/s22228892