2. Proposed Methodology
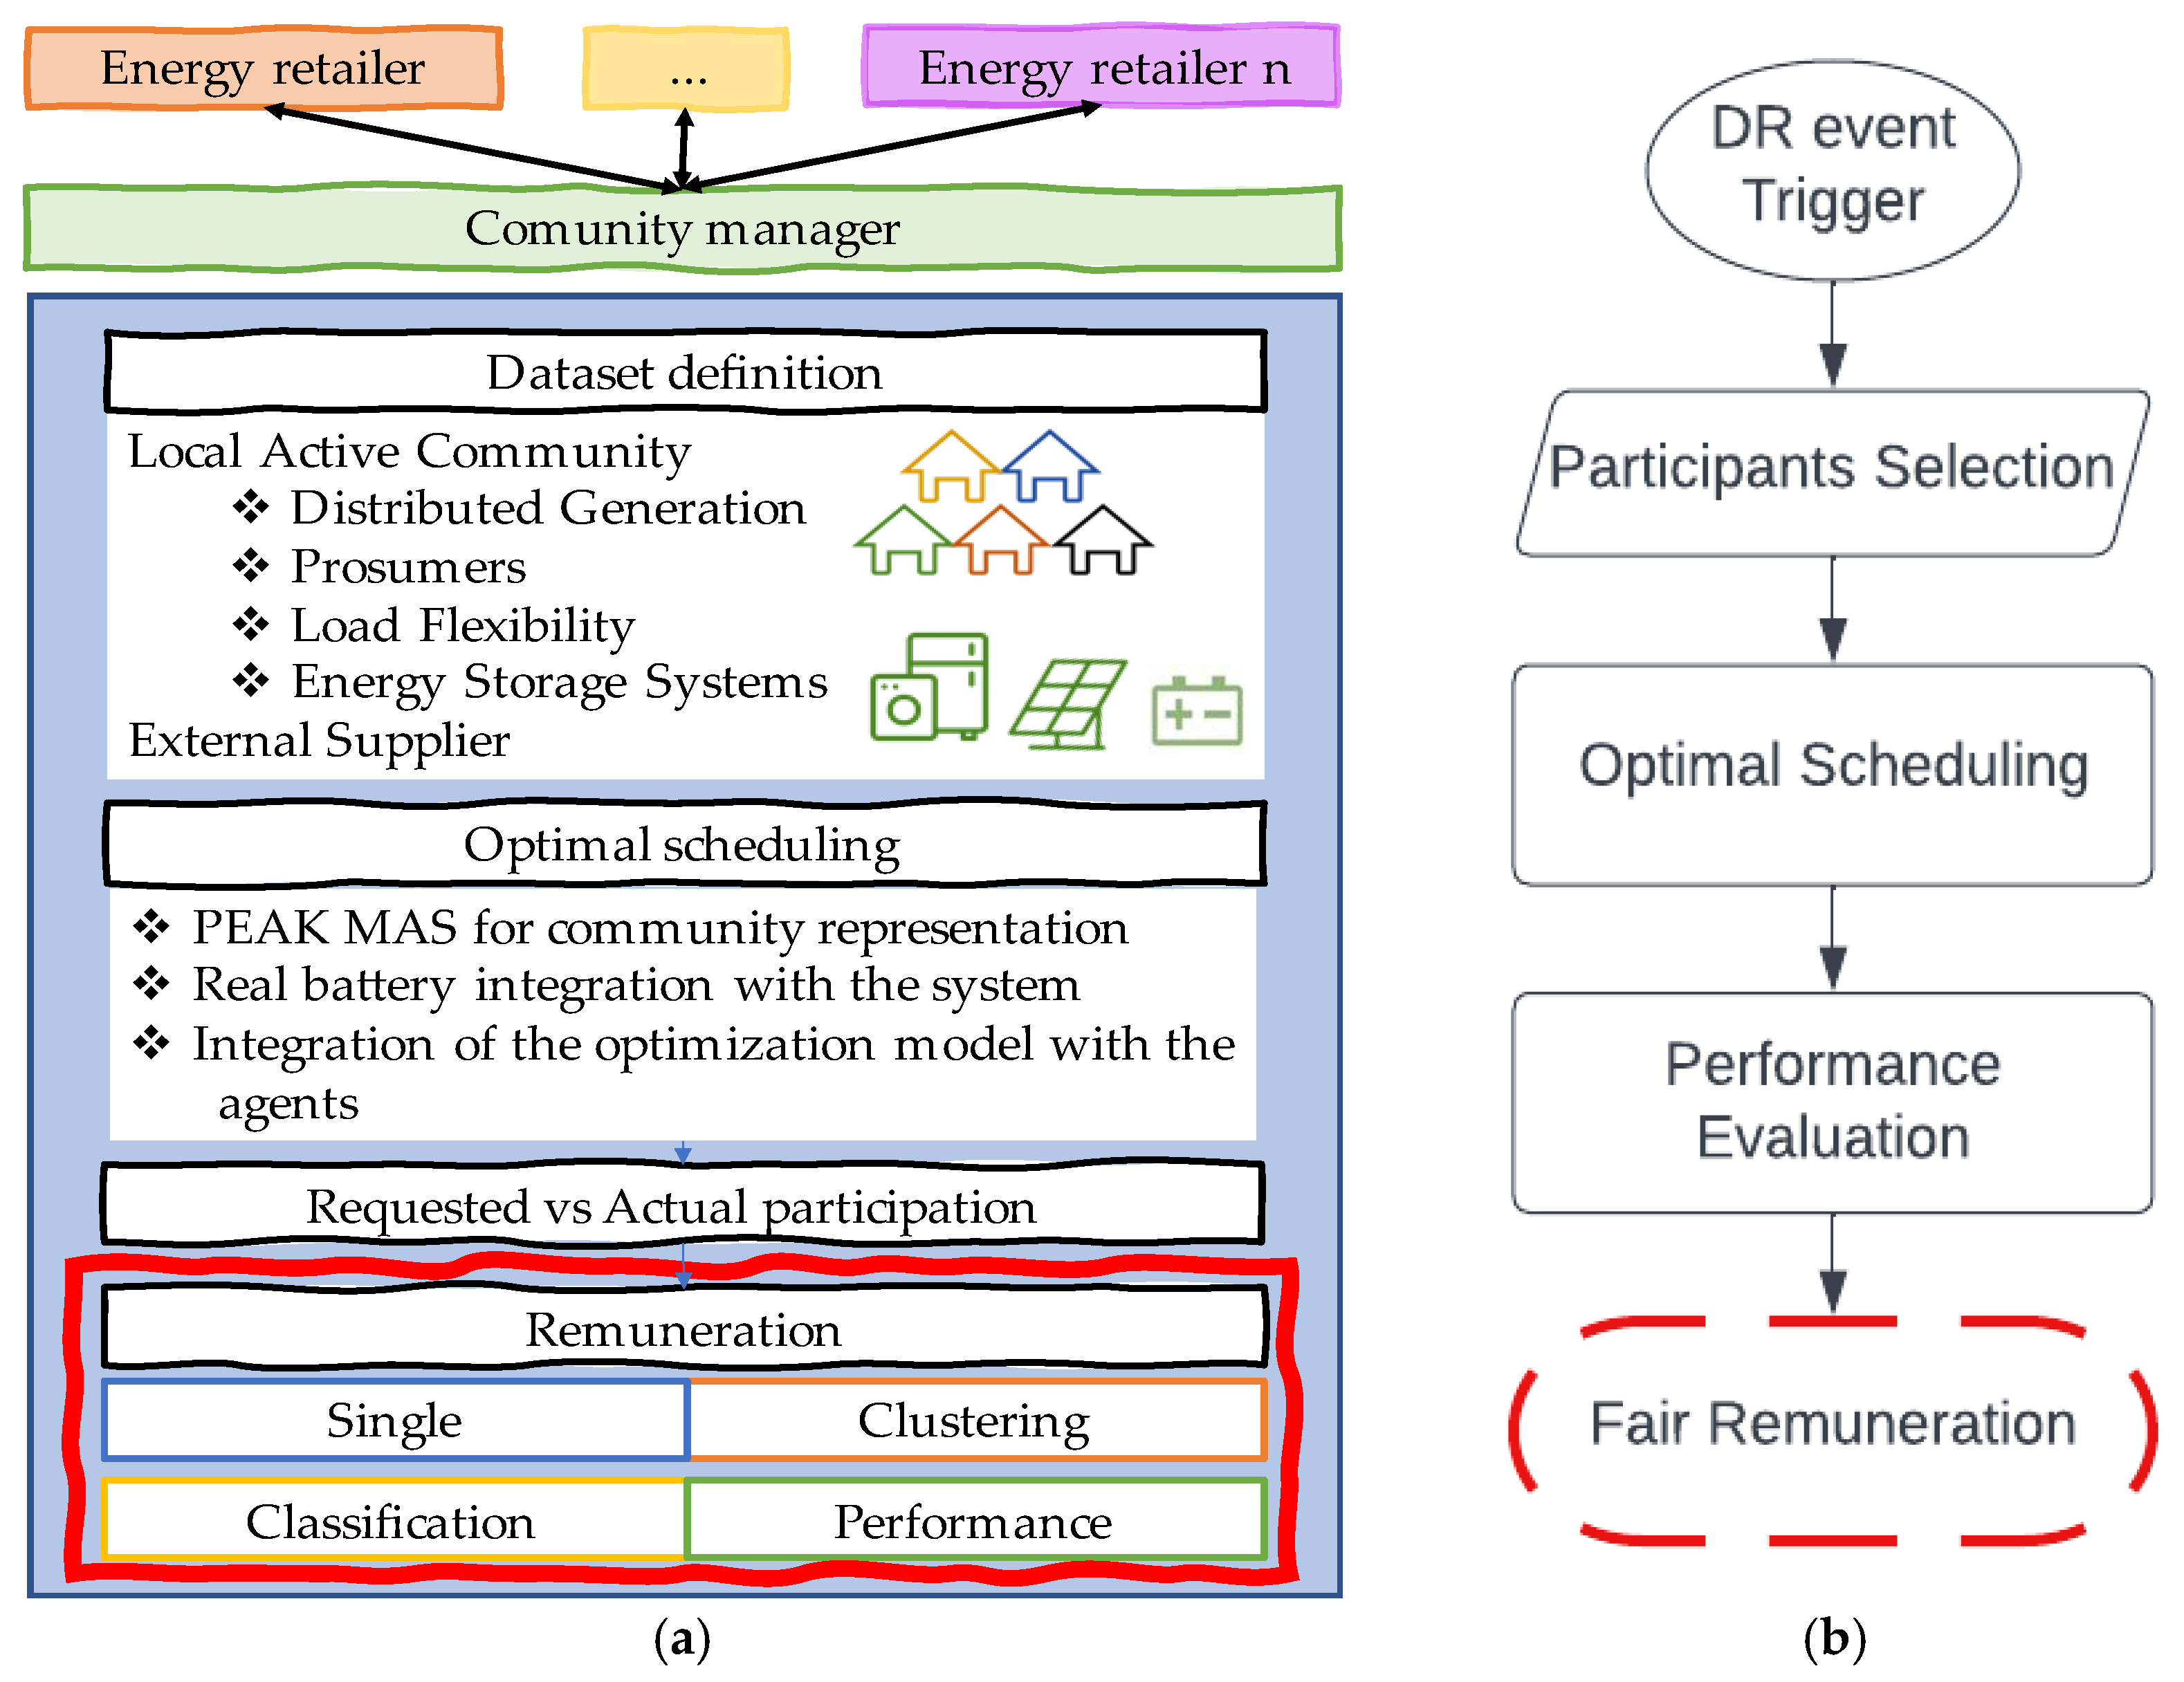
The authors developed a methodology to optimally manage the resources in a community, such as Distributed Generation (DG), prosumers, load flexibility, and energy storage systems. Believing that context is an important matter, bringing intelligence to the models developed, the authors believe introducing this concept will improve the solution compared with previous works [
23]. For the present paper, besides the inclusion of BES in the prosumer’s portfolio, the authors intend to evaluate ways to motivate participation in DR events and reduce the operating costs from the community manager by selecting only the proper participants for a certain context, following the proposed methodology in
Figure 1.
For a community manager, several offers are being made from the energy retailers as a competitive market is introduced. Furthermore, dealing with the new and uninformed prosumers as market players with a more direct impact on the market transactions increases the complexity of managing active communities.
Following
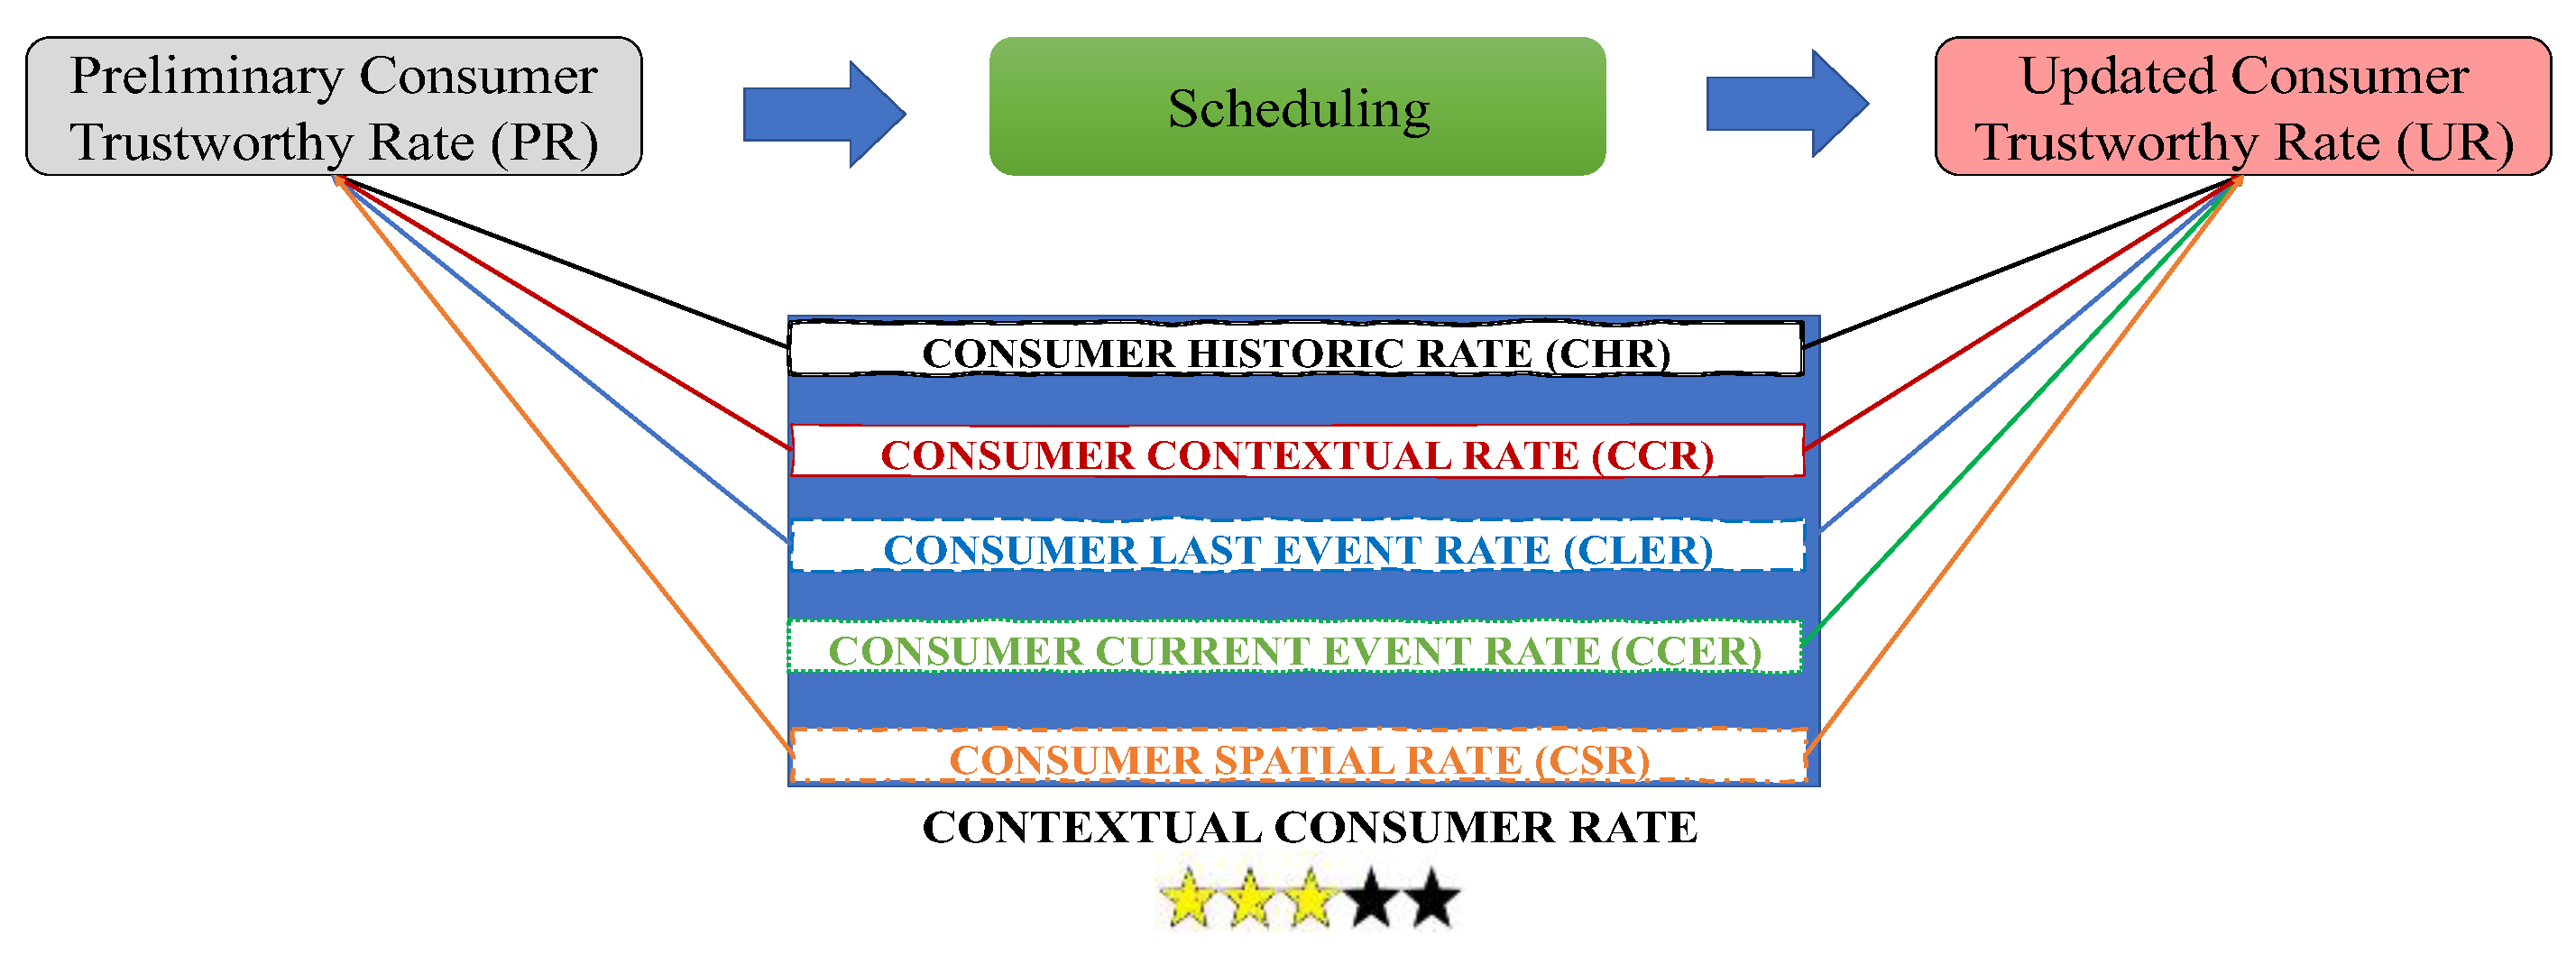
Figure 1b, the participants are selected to attend, starting with the DR event triggered in a specific context. To maintain continuity with previous works, the authors used a rate designed to classify the participants’ performance on a DR event: Consumer Trustworthy Rate (CTR), defined according to
Figure 2. Three yellow stars in
Figure 2 means three out of five.
Before scheduling, information is gathered regarding DR events in the same context—for instance, the same hour, day of the week, or even the temperature registered for each participant. This rate will be useful for understanding which prosumers are more willing to participate in each situation. However, privacy matters could be raised since prosumers might share sensitive information regarding their appliances to participate in DR events. Before the event, the community manager and the participants should agree on the data provided, since this is a contextual approach. For instance, in load-shifting programs, the appliance schedule might be shared to be optimally attributed to a different period, avoiding consumer discomfort and rebound effect.
To avoid privacy issues, the proposed methodology-optimal schedule in the present paper is performed in a distributed way, so the aggregator does not have any private information on a real-time basis or any other horizon. Each prosumer building does their own internal management with the optimal schedule proposed and does not provide private information regarding a specific appliance’s availability or behavior. The aggregator has only the sum of actual flexibility response from each consumer at the end of the month to update the CTR and proceed for DR participation remuneration.
Participants with high values of CTR are usually the more trustworthy. The formulation of the CTR changes according to the needed step: before (preliminary consumer trustworthy rate as PR) or after (updated consumer trustworthy rate as UR) the scheduling. To select the participants for DR events, the PR is defined according to the consumer historic rate (CHR), the consumer contextual rate (CCR), the consumer last event rate (CLER), and the consumer spatial rate (CSR). The first one is the average of the last five performances in the same period. CCR is divided into two different perspectives: time and weather. The participant’s performance according to these indicators will result in the CCR. After that, the CLER differs from the CHR to update the CTR according to the last performance. Finally, CSR is only used if the aggregator has knowledge regarding the participant’s current location on the grid. For cases where a voltage violation is detected, the participants closer to the faulty bus must have priority. In the present paper, CSR was not considered since it was not the focus of the study. Further privacy issues regarding CTR were already discussed by the authors in prior works with additional consumer information [
24], so this topic will not be approached in the present paper. After the scheduling is performed and the comparison between the requested and the actual flexibility is made, the CTR must be updated with the performance from the current period—CCER.
As soon as the participants are selected, the optimal scheduling phase starts. Equation (1) represents the objective function from the mixed-integer linear programming optimization. Since the tariffs are defined hourly, the term ∆t was added to adjust the consumption for a different time basis.
Equation (2) represents the balance that must exist between the consumption and generation resources in the community. Equation (3) shows the upper and lower limits for grid usage. As can be seen, the sign of
changes according to the transactions done: if the energy is bought, the value is positive. Otherwise, it is negative.
Regarding the flexibility provided by the participants in the DR events, it is represented with
and is limited according to upper and lower limits shown on Equation (4). Also, the authors considered that loads are connected to relays and only when activated—using the binary variable
, the loads can be shed according to Equation (5).
Energy storage systems considered in the methodology are limited by several constraints represented from Equations (6)–(10). Equation (6) represents the upper and lower limits of the energy storage system operation capacity. Equations (7) and (8) represent the charge and discharge limits per period, respectively, associated with binary variables. So with Equation (9), the aggregator can guarantee the impossibility of charging and discharging with these binary variables
and
in the same period. Finally, Equation (10) represents the state of charge of the energy storage system maintaining the power balance—the sum of the previous state and what was charged or what was discharged for the current period.
Once finished with the scheduling, the following stage is represented on
Figure 2b as “Performance Evaluation”, where a comparison between the actual and the requested participation is made to properly assign the remuneration tariffs to the ones that contributed to the DR event.
The fair remuneration phase is the focus of this study. The authors proposed four approaches: single, clustering, classification, and performance. The single approach considers that flexibility is remunerated according to the energy price applied for the current period. Several schedules were considered for dividing, for instance, the day into peak, valley, and off-valley periods. Each period has a different tariff, and the flexibility is compensated with the same value.
For the clustering approach, the authors opt for one of the well-known partitional methods—k-means. The algorithm aims to find a centroid value representing each group, comparing the distance between elements until the minimum value is found. The k-means clustering method was already studied and widely used with various extensions in the literature. For the proposed methodology, the authors intend to aggregate prosumers with similar flexibility profiles and remunerate higher values with better tariffs, which may lead to different tariff values per period, since the group with higher flexibility can also change. By getting the output data from the method in which a group is assigned to each participant, the authors want to create the proper rules and then attribute the group to other participants without performing the clustering method each period. In this way, classification methods can be used. Three different methods were tested within the scope of the present paper: decision tree, k-nearest neighbors (KNN), and artificial neural networks (ANN). These methods were then compared and evaluated using accuracy and mean absolute error (MAE).
Finally, the UR is used for the remuneration since it contains the information from the actual performance. Each rate is tariff-associated, and the higher the rate, the better the compensation.
The novelty from previous works relies on the contextual change of energy price and remuneration. The authors believe proper compensation is crucial to motivate continuous participation and make this transaction known to prosumers. It will take time, education, and resources to make the prosumers better power and energy market players. Still, the authors believe continuous participation and experience will also be important to progress. With higher knowledge regarding the community come better results in managing community resources. It will also benefit the prosumers, since their load can be changed to other periods when the energy price is lower. Comparing several approaches to remunerate properly and fairly can be useful for developing a tool capable of taking a step forward to apply DR in the real market with optimal results.
3. Case Study
To test and validate the optimization model, it was used with a novel multi-agent system conceived and developed by the authors called Python-based Ecosystem for Agent Communities (PEAK) [
25]. PEAK is a multi-agent framework that aims to support and manage the development of multi-agent ecosystems in a simple way, based on the Python programming language. This framework can create simulation environments and provide a feasible solution for a pilot deployment. PEAK can integrate real devices, such as energy resources, loads, and IoT devices, using specific drivers for each communication protocol. Furthermore, it is possible to integrate mathematical and machine learning models within the agents. By default, a system created with PEAK registers every interaction inside the ecosystem for posterior debugging and analysis.
The paper uses Multi-Agent Systems (MAS) to model and represent smart grid entities. The authors consider the approach a good fit, as they can decentralize the computational effort among agents. The proposed MAS solution uses the open-source PEAK framework (
www.gecad.isep.ipp.pt/peak, accessed on 3 November 2022), which enables easy and fast development and deployment of MAS in simulated and real scenarios. As for the optimization model, it is distributed among agents, and each agent responsible for the optimization of its own resources.
Energy storage in the literature has been identified with several options, such as ultra-capacitor, super magnetic, flywheel, compressed air, pumped hydro energy storage systems, and Battery Energy Storage Systems (BESS) [
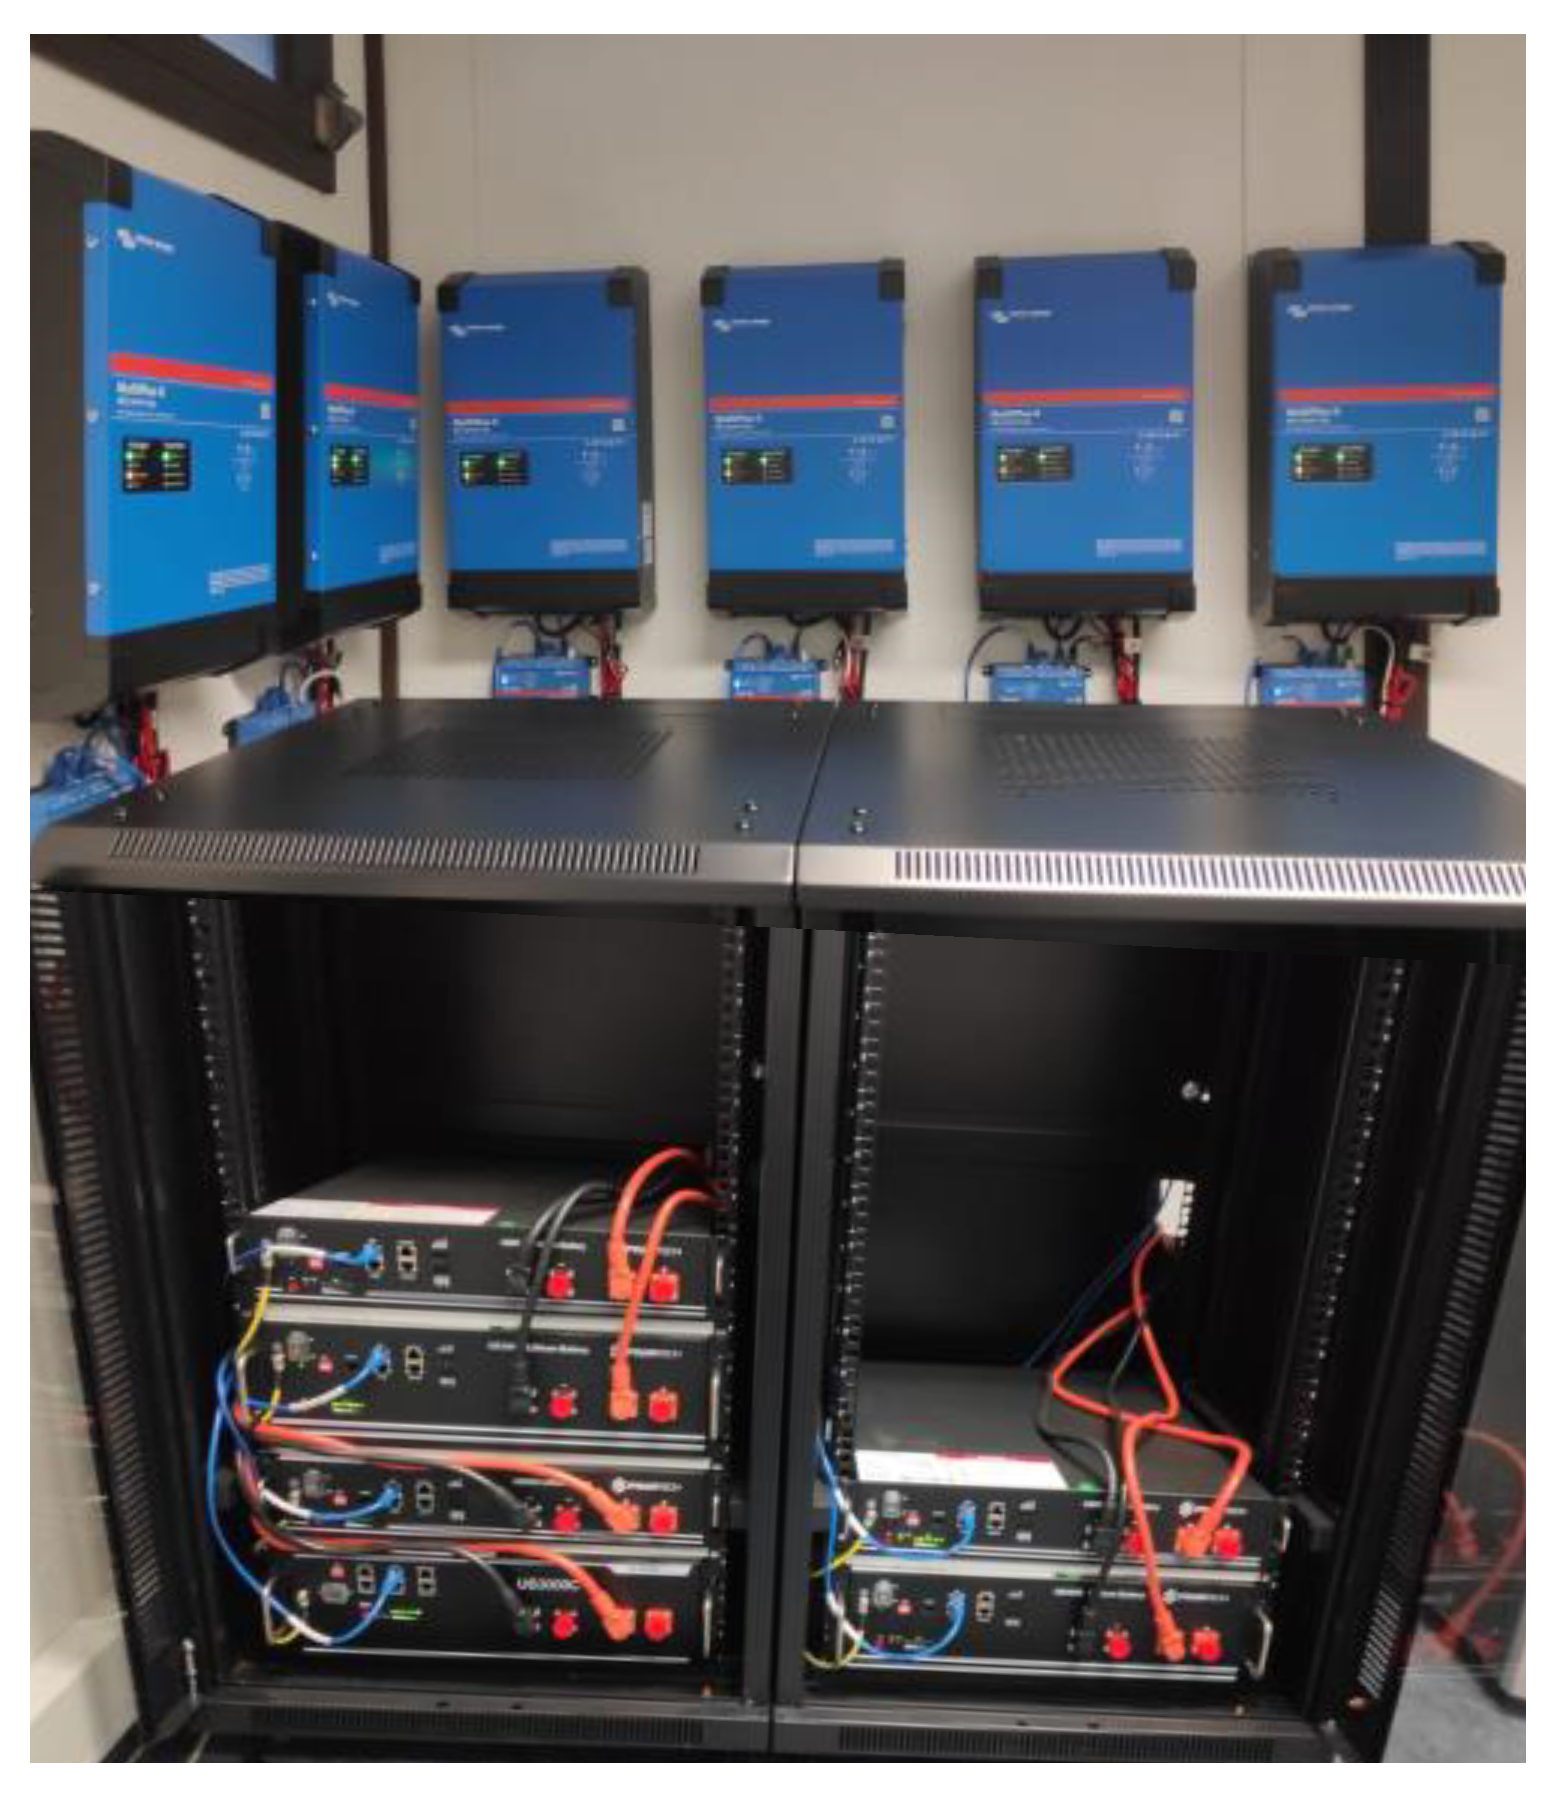
26]. In the present paper, BESS has been selected. As concluded in [
26], combining BESS with DR can significantly reduce the size of conventional energy storage systems and improve power quality. For the present case study, a total of 19 prosumers/agents were considered, and five of those prosumers are connected to real BESS, while the others use simulated BESS, and both are constrained by (6) to (10). These real BESS belong to the GECAD/ISEP research center and can be seen in
Figure 3, with a capacity of 2 kW. The developed PEAK agents for the proposed model do not represent a threat to the equipment when using data simulation. To avoid damage to the equipment, the PEAK was executed in real-time (running the case study for 24 h) while compliant with the physical limitations of BESS. Also, the BESS used, a Victron inverter, was configured to set charging, discharging, and state of the charge limits to avoid physical threats to the equipment. Regarding computational complexity, this framework uses multiprocessing and multithreading to increase simulation processing speed, enabling computation processing distribution between different machines.
At the beginning of the simulation, the real BESS starts at full capacity. Furthermore, to communicate with the BESS, the agents use the protocol ModBus/TCP. Regarding the optimization model, the authors integrated with the multi-agent system’s agents and optimized each period where the model is executed in each agent. The proposed model allows BESS configuration. In this way, for the case study in the present paper, the actual BESS may have a configuration like the simulated BESS.
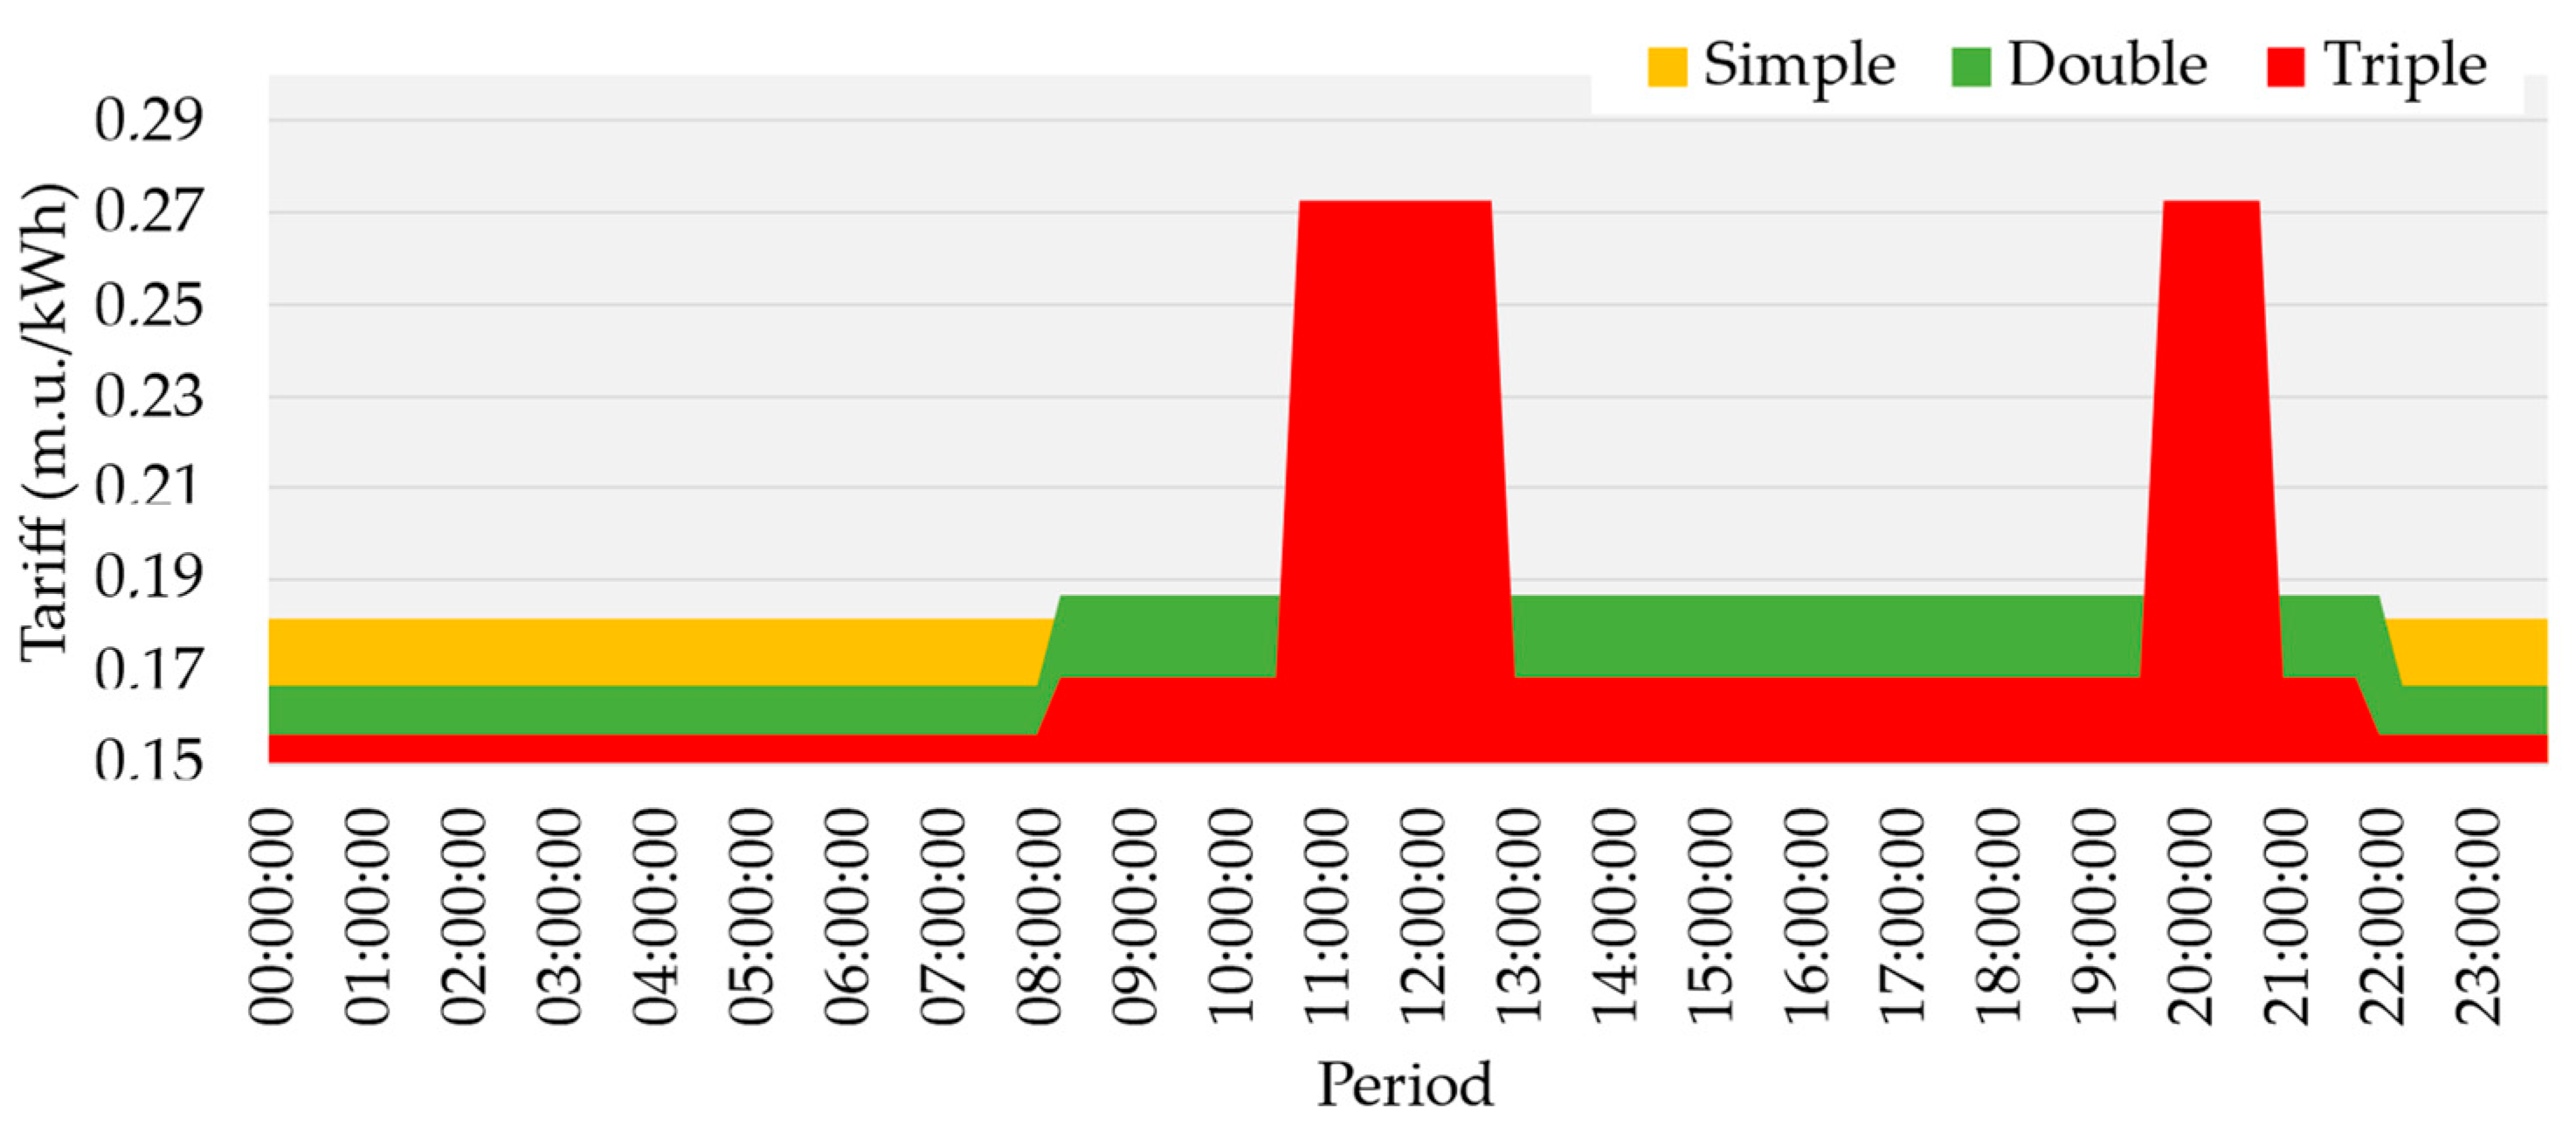
Focusing on the contextual change of energy prices for resource scheduling, three case studies were created considering the tariff values from
Table 2 and the schedule represented in
Figure 4. The feed-in tariff was not considered for the case studies—values applied are currently considered by the main Portugal DSO. Only prosumers below 20.7 kW of contracted power were considered for this study. The 19 prosumers mentioned above with contracts as DR participants will provide flexibility. Moreover, these prosumers also use photovoltaic (PV) generation and a BESS associated with each one of them, being able to suppress their load consumption or sell the excess to the grid. The Portuguese DSO from which
Table 2 tariffs were withdrawn considers two different schedule options: daily and weekly. However, this fact does not affect the tariff values, only the schedules in which they are applied; for the weekly schedule, the season matters.
The four remuneration approaches were then compared using the
Figure 4 schedule for the different types of tariffs.
First, the single approach where the same tariffs from
Table 2 are used for remunerating the participants in the DR event is the single approach where the same tariffs from
Table 2 are used to remunerate the DR event participants. Then, a clustering approach is applied, aggregating the participants with similar behaviors. For this scenario, the number of clusters to be formed will equal three. The tariffs are attributed according to the context in which the DR event is triggered, following the schedule from
Figure 4 according to the tri-hourly one. The classification scenario will create several rules to assign a tariff to the participants according to the context. And finally, the authors decided to apply a different approach. The CTR was used for the remuneration fees regarding participation in the DR event, as seen in
Table 3.
Considering the values from
Table 2, for the CTR scenario, the authors attribute the higher tariff value to each scheduled period (i.e., peak, off-valley, and valley) and divide according to the rate. So with higher rate values, the prosumer will receive more compensation for their participation, sometimes enough to pay for their load consumption for the current period and have profits. The approach’s main goal is to improve performance and encourage continuous participation, giving more benefits to the prosumer for participating in the market transactions. The dataset used for each case study is in
Appendix A.
4. Results and Discussion
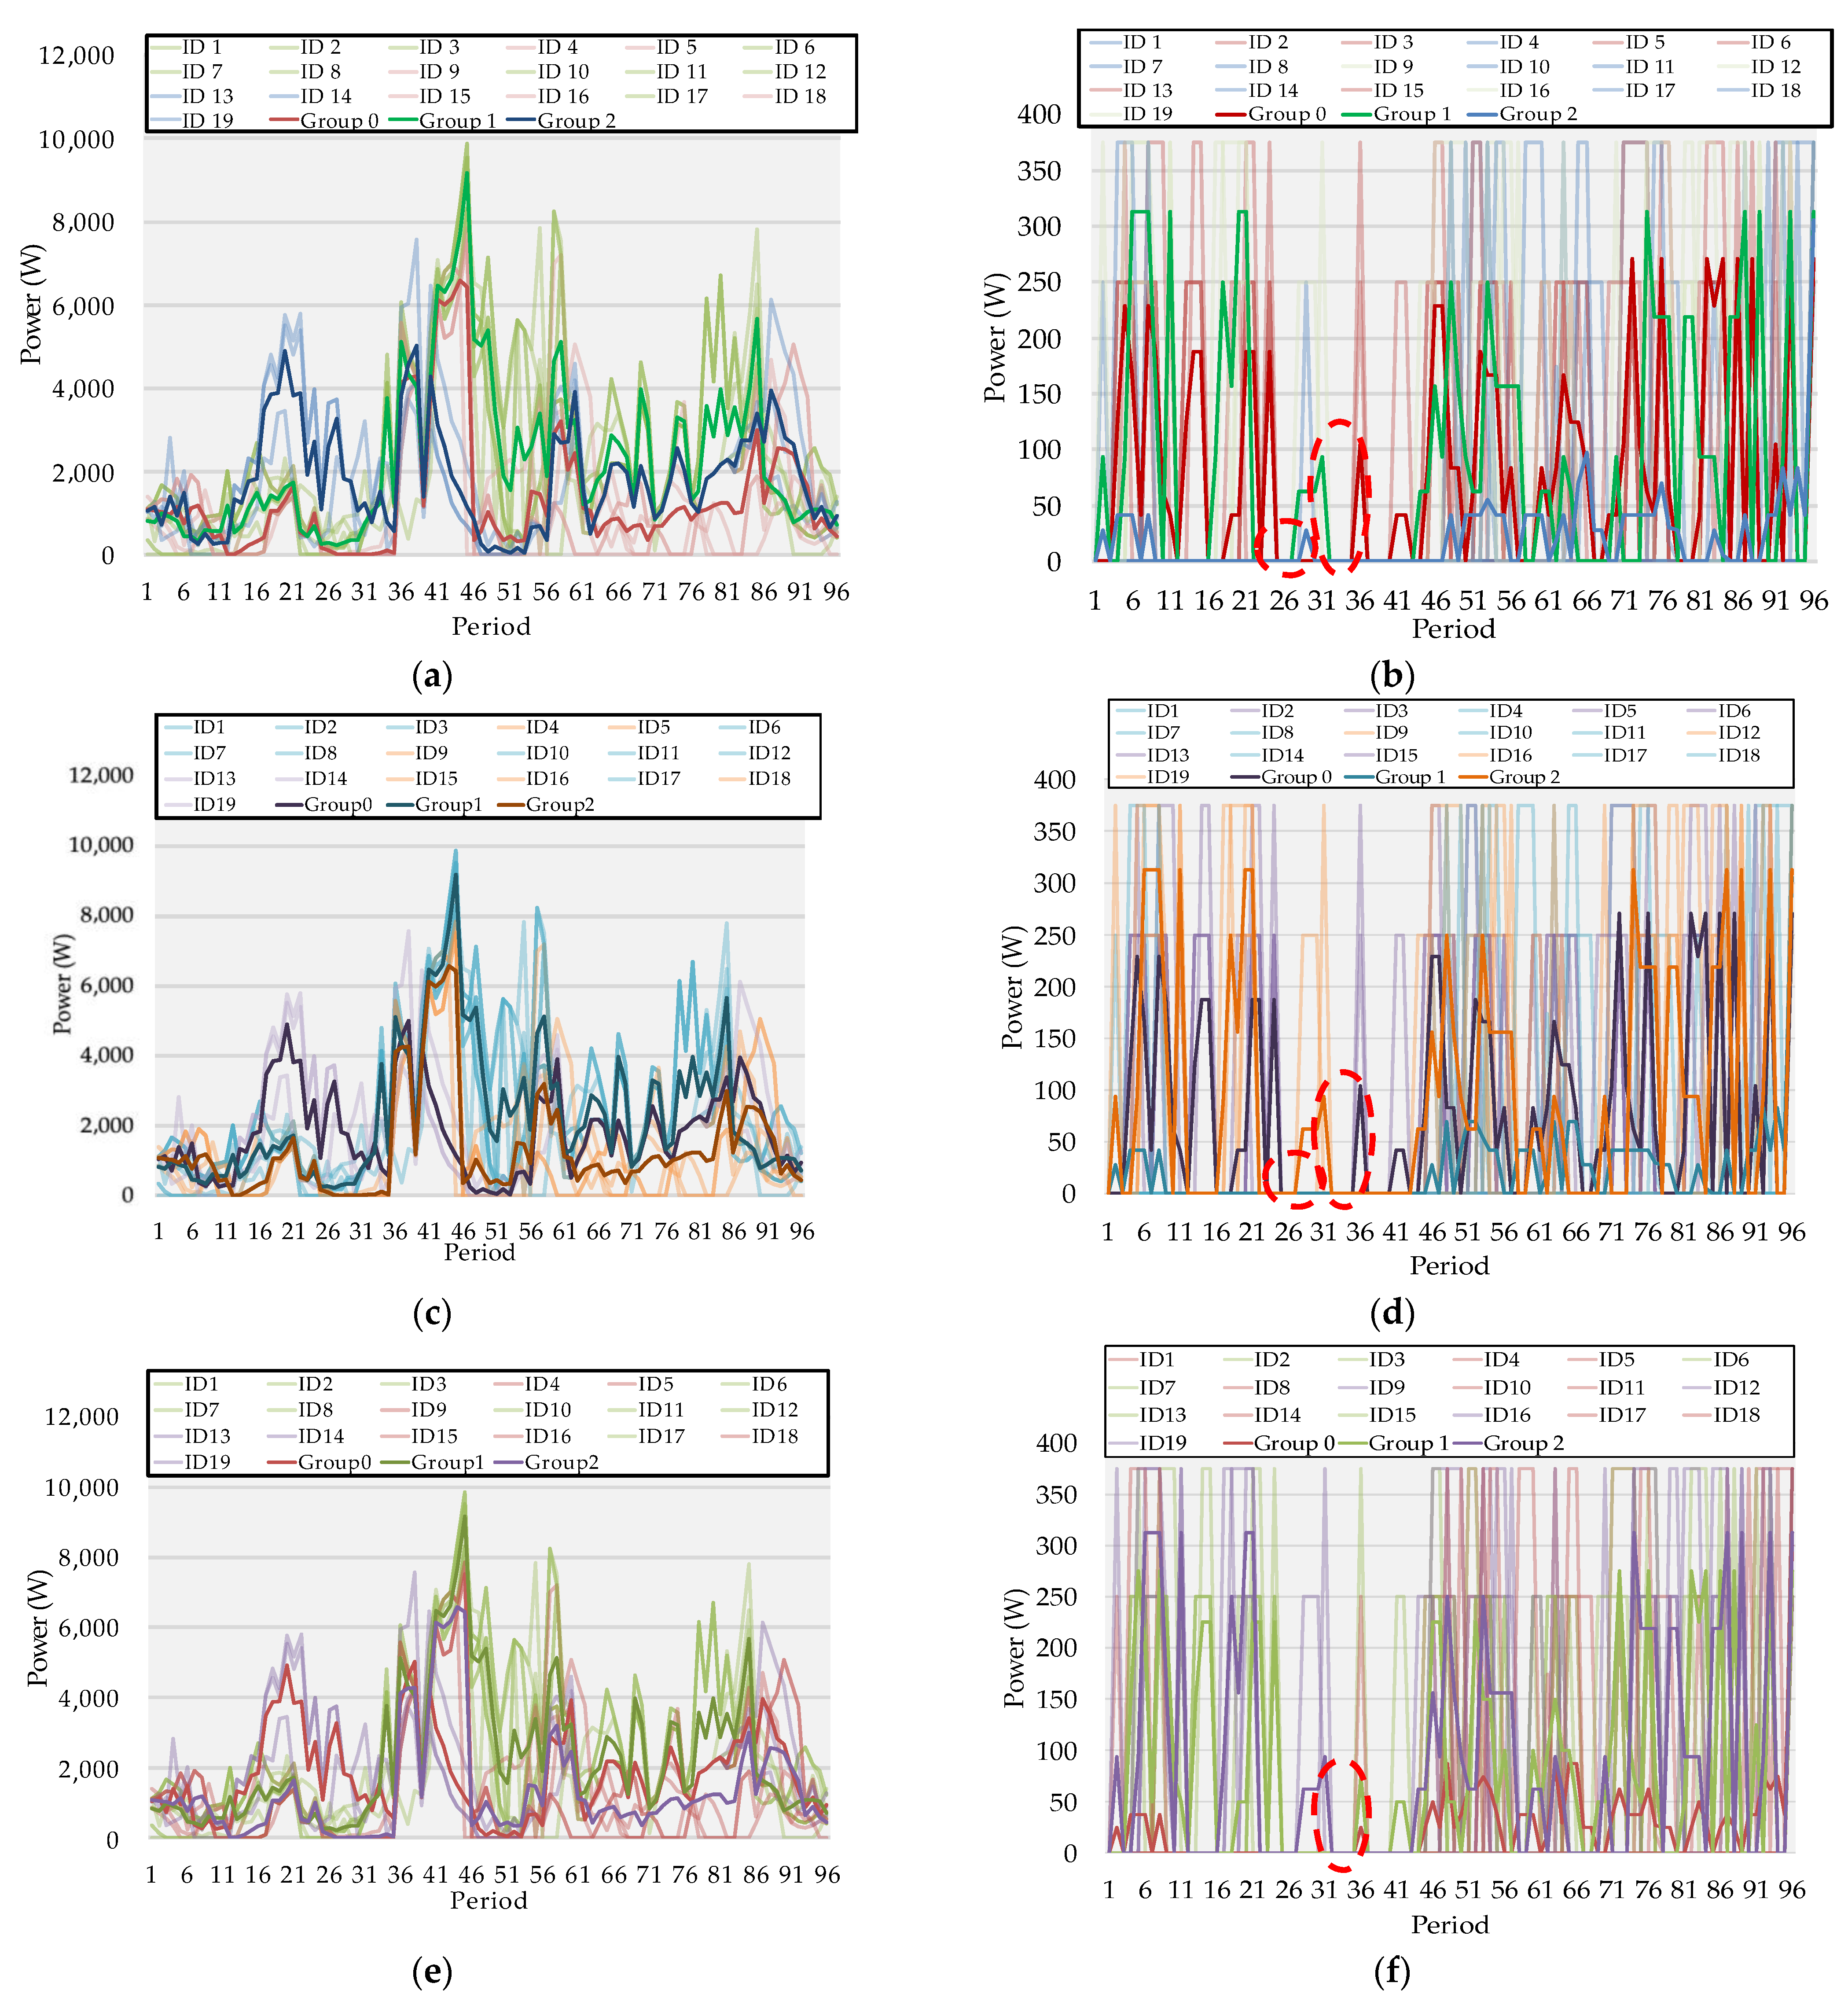
In the present section, the authors discuss the proposed methodology results when applied to the previously presented case study. The scheduling was performed for all the prosumers in the community considering (1) to (10). The prosumer resources flexible results can be seen in
Figure 5a–f, from load reduction values (constrained by (4) and (5)) and BES discharging (constrained by (8)).
The results were then aggregated into three groups using the k-means clustering method to find the similarity between the load profiles. This consumer modeling technique was used by the authors for ease the analysis—the colors were also changed in the group according to each ID assigned, but with higher values of opacity.
Figure 5a,b represent the scheduling results for case study 1 (flat energy price tariff).
Figure 5a clustering results show that Group 0 gathers the prosumers with low values of flexibility outside the peak zone, namely when compared with Group 2. From period 40 until period 58, Group 0 (represented by the red curve) had higher values of flexibility than Group 2 (represented by the blue curve), which prevailed mostly higher in the remaining periods. Regarding Group 1, before period 35, it was also below the blue line but remained superior to the others until around period 85. It must be highlighted that Group 0 had six prosumers, Group 1 gathered ten different participants, and the remaining were attributed to Group 2.
Results from
Figure 5b achieved the maximum discharge value (375 W) for many periods and kept that value for no more than four consecutive periods. Nevertheless, the participant that contributed with this type of flexibility for the most periods was ID 16, keeping the maximum for four consecutive periods and then decreasing to 95 W. This participant was then assigned to Group 1, the four prosumers that have higher values of contribution for most of the time; namely, when there is no PV generation. Assigned to Group 0 were six different participants: ID2, ID3, ID5, ID6, ID13, and ID15. Group 2 has nine participants with lower values of contribution.
Figure 5c,d represent the scheduling results for the second case study that considers a bi-hourly tariff, meaning there are times of the day considered as valley and off-valley (including the peak hours) where the energy price is different, as seen in
Table 2. As suggested by the Portuguese DSO, the bi-hourly tariff is ideal for the prosumers, with 40% of their daily consumption spent between 10 p.m. and 8 a.m. Still, the authors wanted to understand if these tariffs impact the flexibility in the community schedule—are two different energy tariffs enough to move the load consumption to lower price schedules?
Figure 5c flexibility results are similar to
Figure 5a. Group 0 was assigned ID12, ID14, and ID19 (represented with purple curves), reducing by a total of 518 W for the whole day—the group with fewer members and less provided flexibility overall. For Group 1, the clustering method allocated ten participants to this group, which reduced the day by 2164 W. Finally, in Group 2, the reduction value was 773 W between the six participants within the group. Regarding the BES discharging results, some disparities can be found in
Figure 5b. For instance, period 29 is highlighted with the red dotted circle on both figures—the discharging value from Group 2 in
Figure 5b is null.
Figure 5e,f represent the results for the final case study where a tri-hourly tariff is considered, meaning three different values are assigned to periods, such as peak, off-valley, and valley, according to
Table 2. However, applying the tri-hourly tariff did not affect the flexibility provided by the participants differently from the previous ones. Still, differences could be seen on the BES discharging chart marked with a red dotted circle in period 36, where the discharging value was slightly lower than the remaining cases.
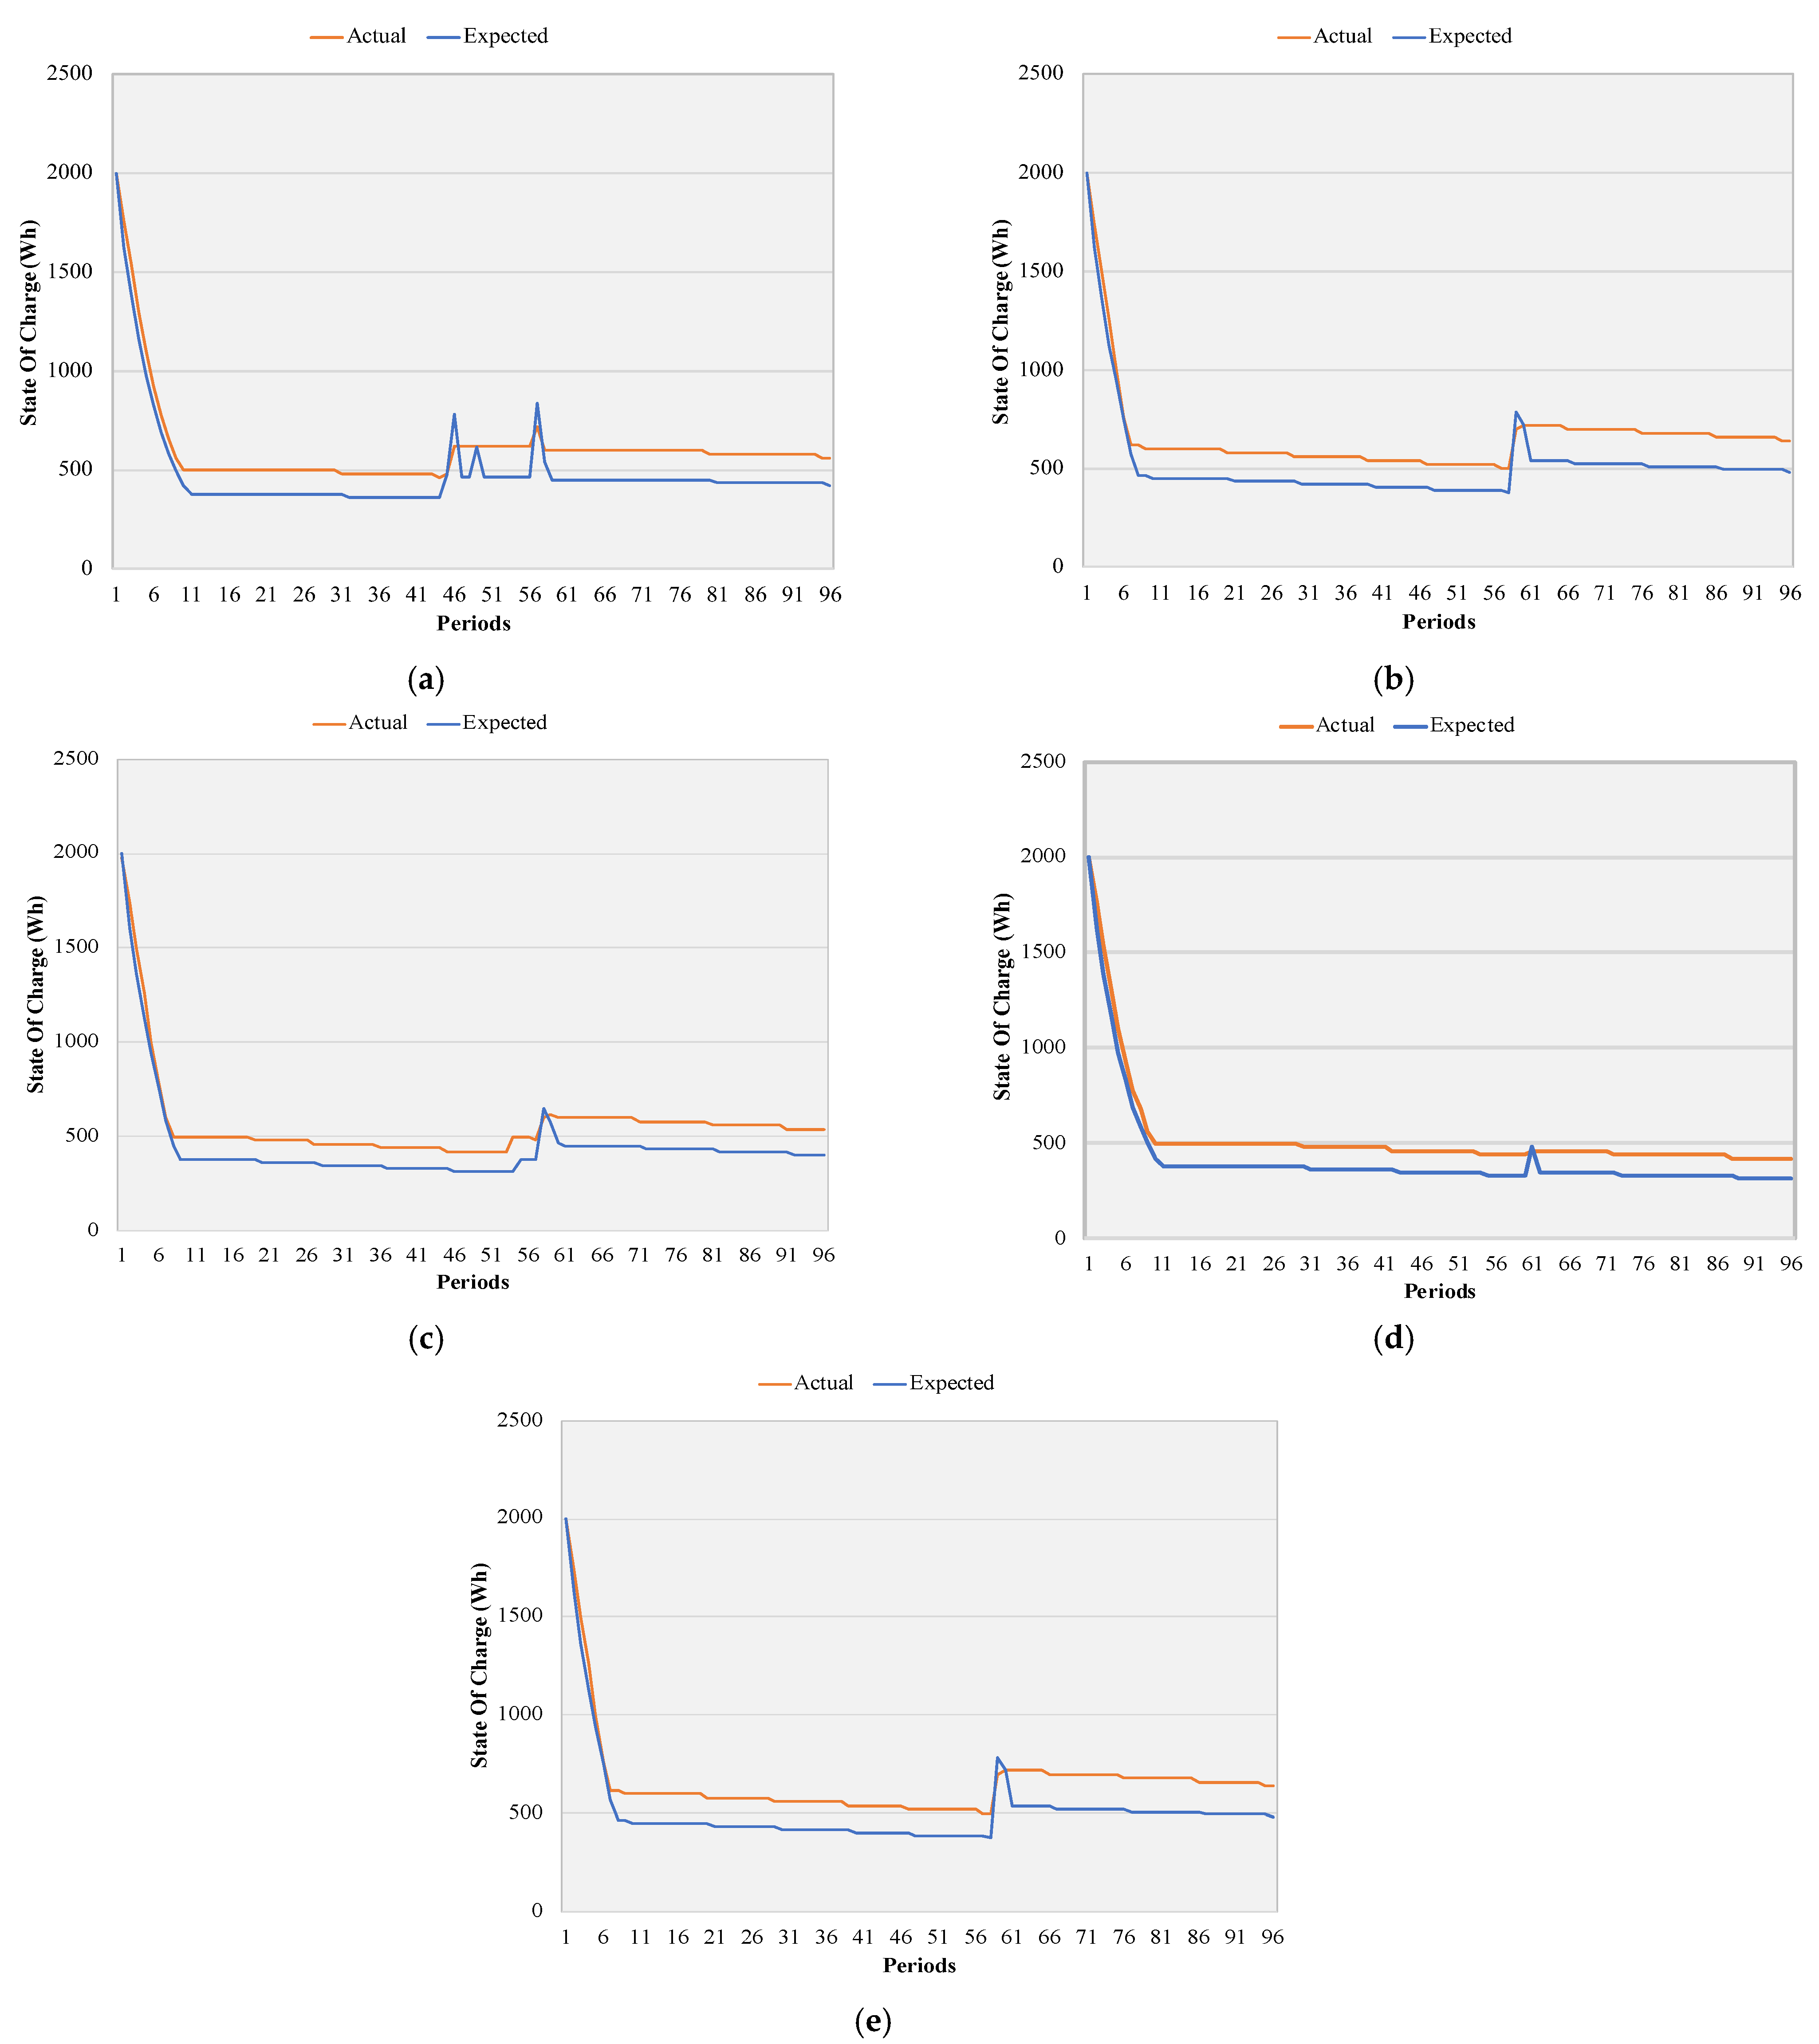
The simulated values had differences between the three case studies regarding the BESS perspective. To prove the viability and robustness of the proposed model, case study 3, with more tariffs, was tested in a real-time environment. The real state of charge for the five BES considered can be seen in
Figure 6, according to the PEAK execution. When comparing both expected and real results, most of the time, the real values are above the expected, although it follows the same tendency. Regarding
Figure 6a, between periods 40 and 60, a major difference can be seen between both curves—expected to charge and after discharge. Still, the real value kept above 500 W. Moving on to
Figure 6b, from period 60, the battery was expected to discharge, but that did not happen in the real curve, similar to
Figure 6c–e. The expected results were constrained by (7).
Moving on to the second phase of the study, regarding fair remuneration, the results for the first approach can be seen in
Table 4 regarding the total flexibility of the prosumers’ load and the total BES discharging. By analyzing this table, the authors can conclude that the total compensation increased from case study 1 to case study 3. BES discharging remuneration decreased from case study 1 to case study 2 but achieved the maximum in case study 3 with 4.53 m.u.
When participating in DR events, the prosumers will benefit from changing their consumption to other periods with cheaper energy prices or even using PV resources for self-consumption. Furthermore, they will be fairly remunerated for helping with market transactions. For instance, according to
Table 4, if the community prosumers did not participate, a maximum of 163.81 would be attributed, and grid problems might not be solved.
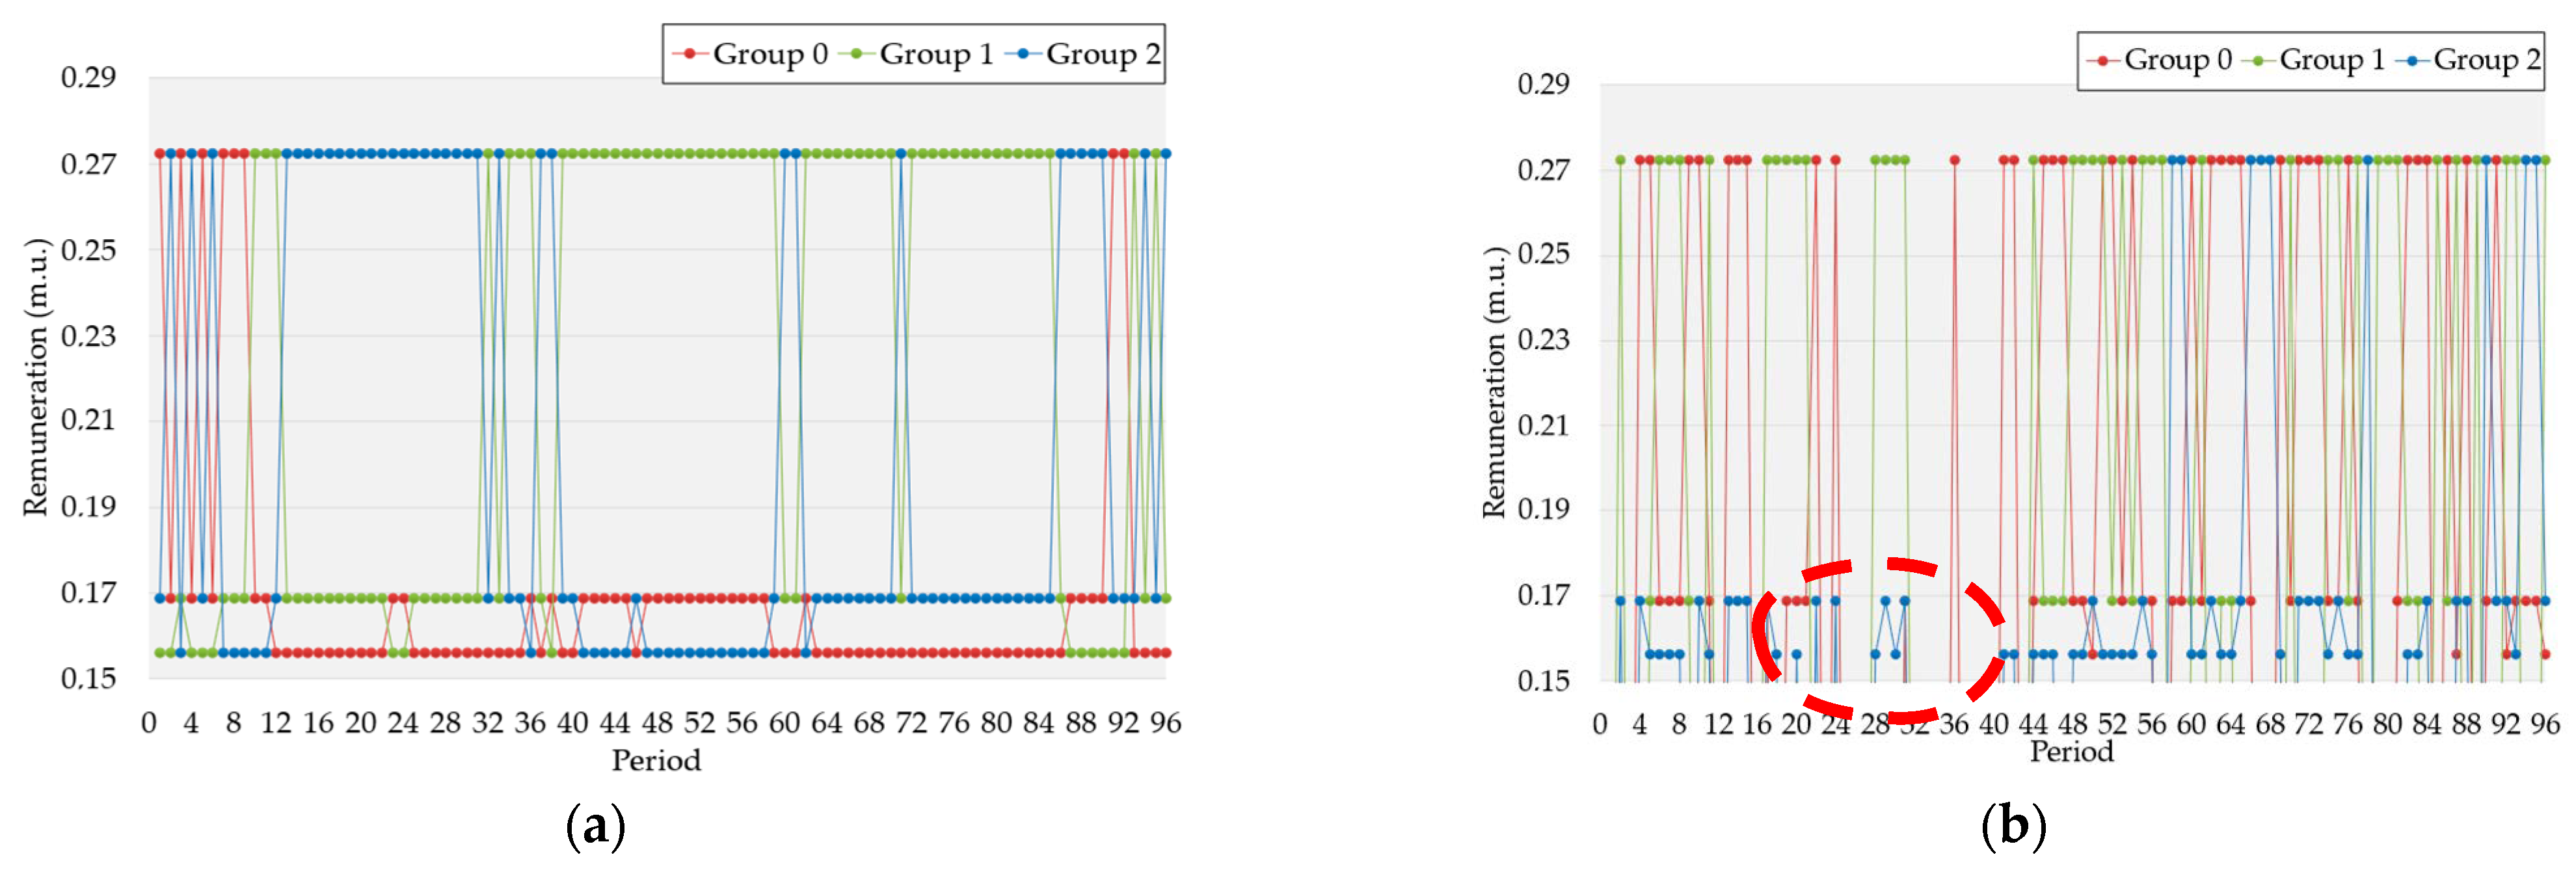
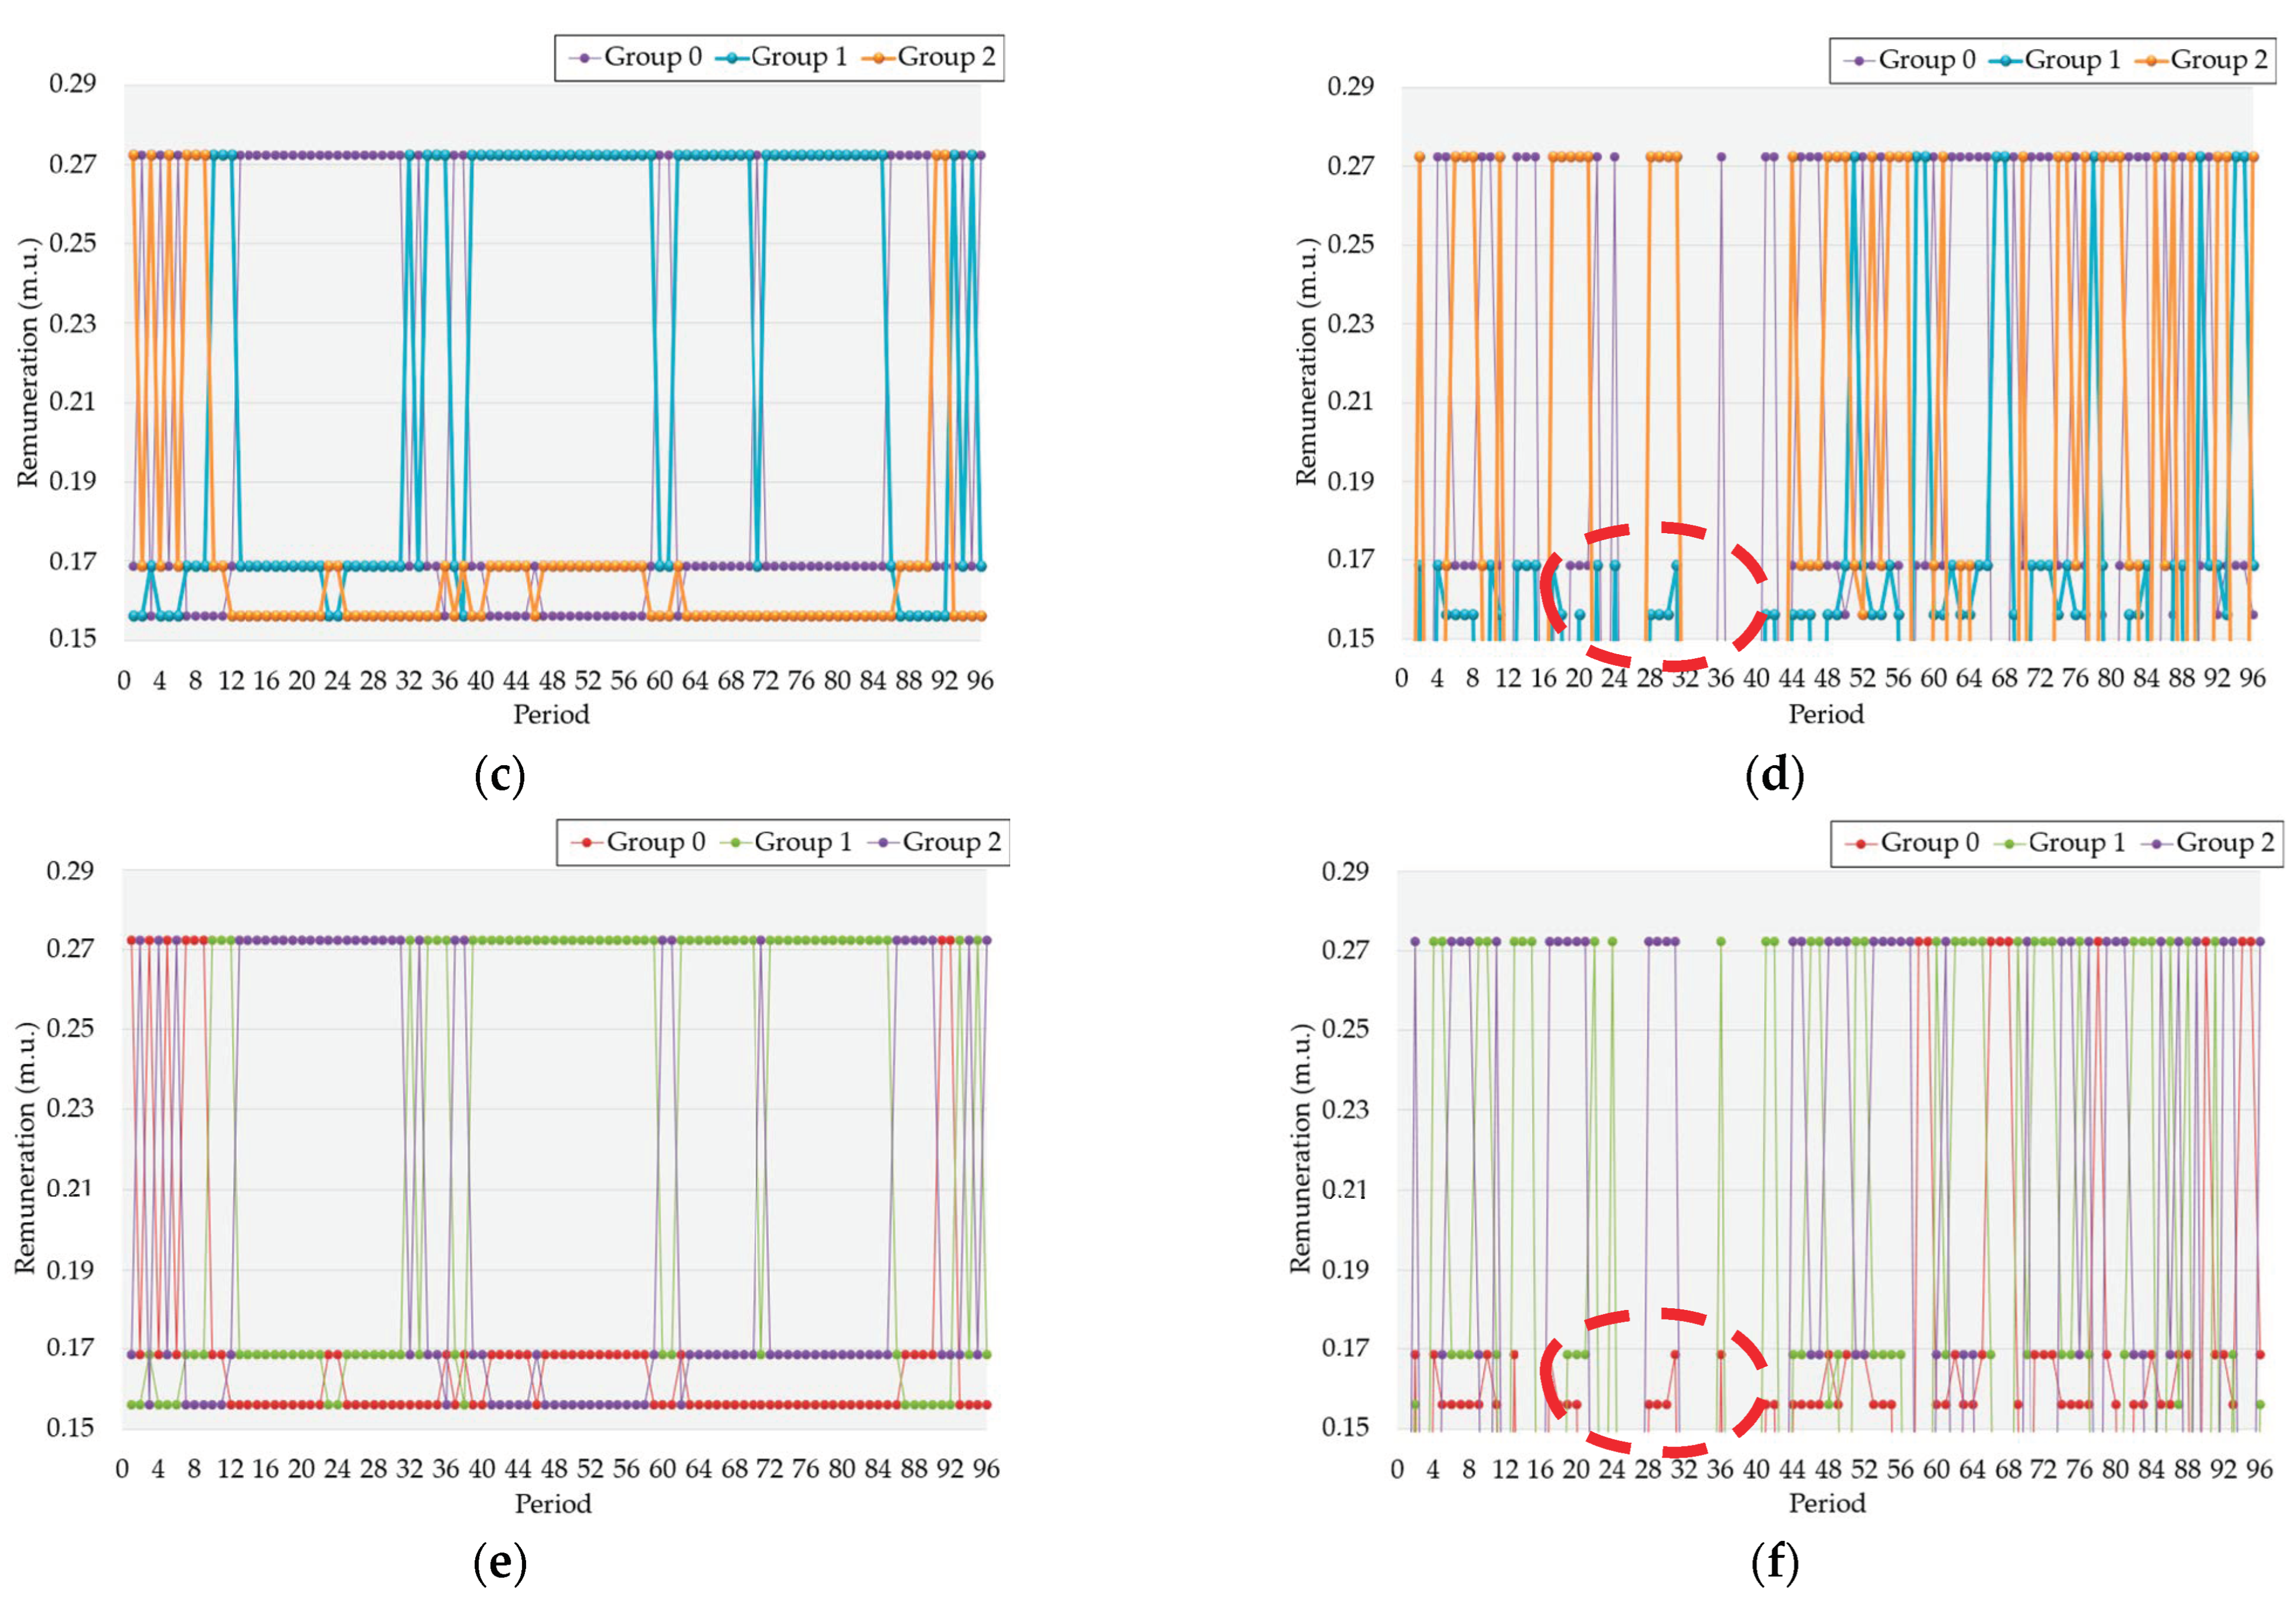
The results from the fair remuneration clustering approach can be seen in Figure 8 for both prosumers’ load flexibility and BESS discharging.
The remuneration tariffs were assigned according to groups with a higher value of flexibility for each period. In other words, the ones with higher accumulated flexibility will be assigned higher remuneration. It must be highlighted that remuneration tariffs were defined according to the tri-hourly tariff used previously. In this way, the group tariffs resulting from the prosumers’ flexibility are similar for the three case studies, according to
Figure 7a,c,e. Disparities can be, however, found regarding the BES discharging results. Focusing again between periods 20 and 40, marked with a red dotted circle in
Figure 7, there were differences between case studies. Firstly, for case study 1, group 2 changed tariffs twice—from 0.1561 (m.u./kW) to 0.1686 (m.u./kW). Regarding case study 2, group 1 increased their remuneration price from 0.1561 (m.u./kW) to 0.1686 (m.u./kW). Finally, similar to case study 2, group 0 from case study 3 increased the remuneration but also participated in period 36, achieving the second-best tariff. In contrast to the results from
Figure 7,
Table 5 was created to compare the daily remuneration obtained per group and case study.
As expected from the previous results, the remuneration from the actual flexibility of participants is the same for all the groups in the different case studies. However, the BES discharging results are different, demonstrating a higher gap between case study 3 and the remaining. Group 0 achieved a 2.75 m.u. for case study 1 and case study 2. Group 1 from case study 1 and Group 2 from case study 2 had similar remuneration of around 2.20 m.u. Group 2 from case study 3 received 2.22 m.u. The lowest remuneration was attributed to Group 2 from case study 1 (with 0.84 m.u.), Group 1 from case study 2 (with 0.87 m.u.), and Group 0 from case study 3 (with 1.08 m.u.). Regarding these results, from an overall perspective, opting for case study 3 can benefit the aggregator. These results indicate that adding more contextual information may reduce the total remuneration and still be fair with the participation compensation.
Furthermore, the authors used three different classification methods to create the proper tool to attribute the remuneration group to each participant, resorting to the results obtained from the clustering results. The classification method’s performance, using the selected indexes (accuracy and MAE), can be seen in
Table 6. The results were obtained using Python libraries created for this goal. In examining the results and regarding the actual flexibility, the lowest accuracy value was achieved when the decision tree was performed—10.59%, with the 83.33% achieved with KNN. This method obtained better results from both accuracy and MAE for both datasets.
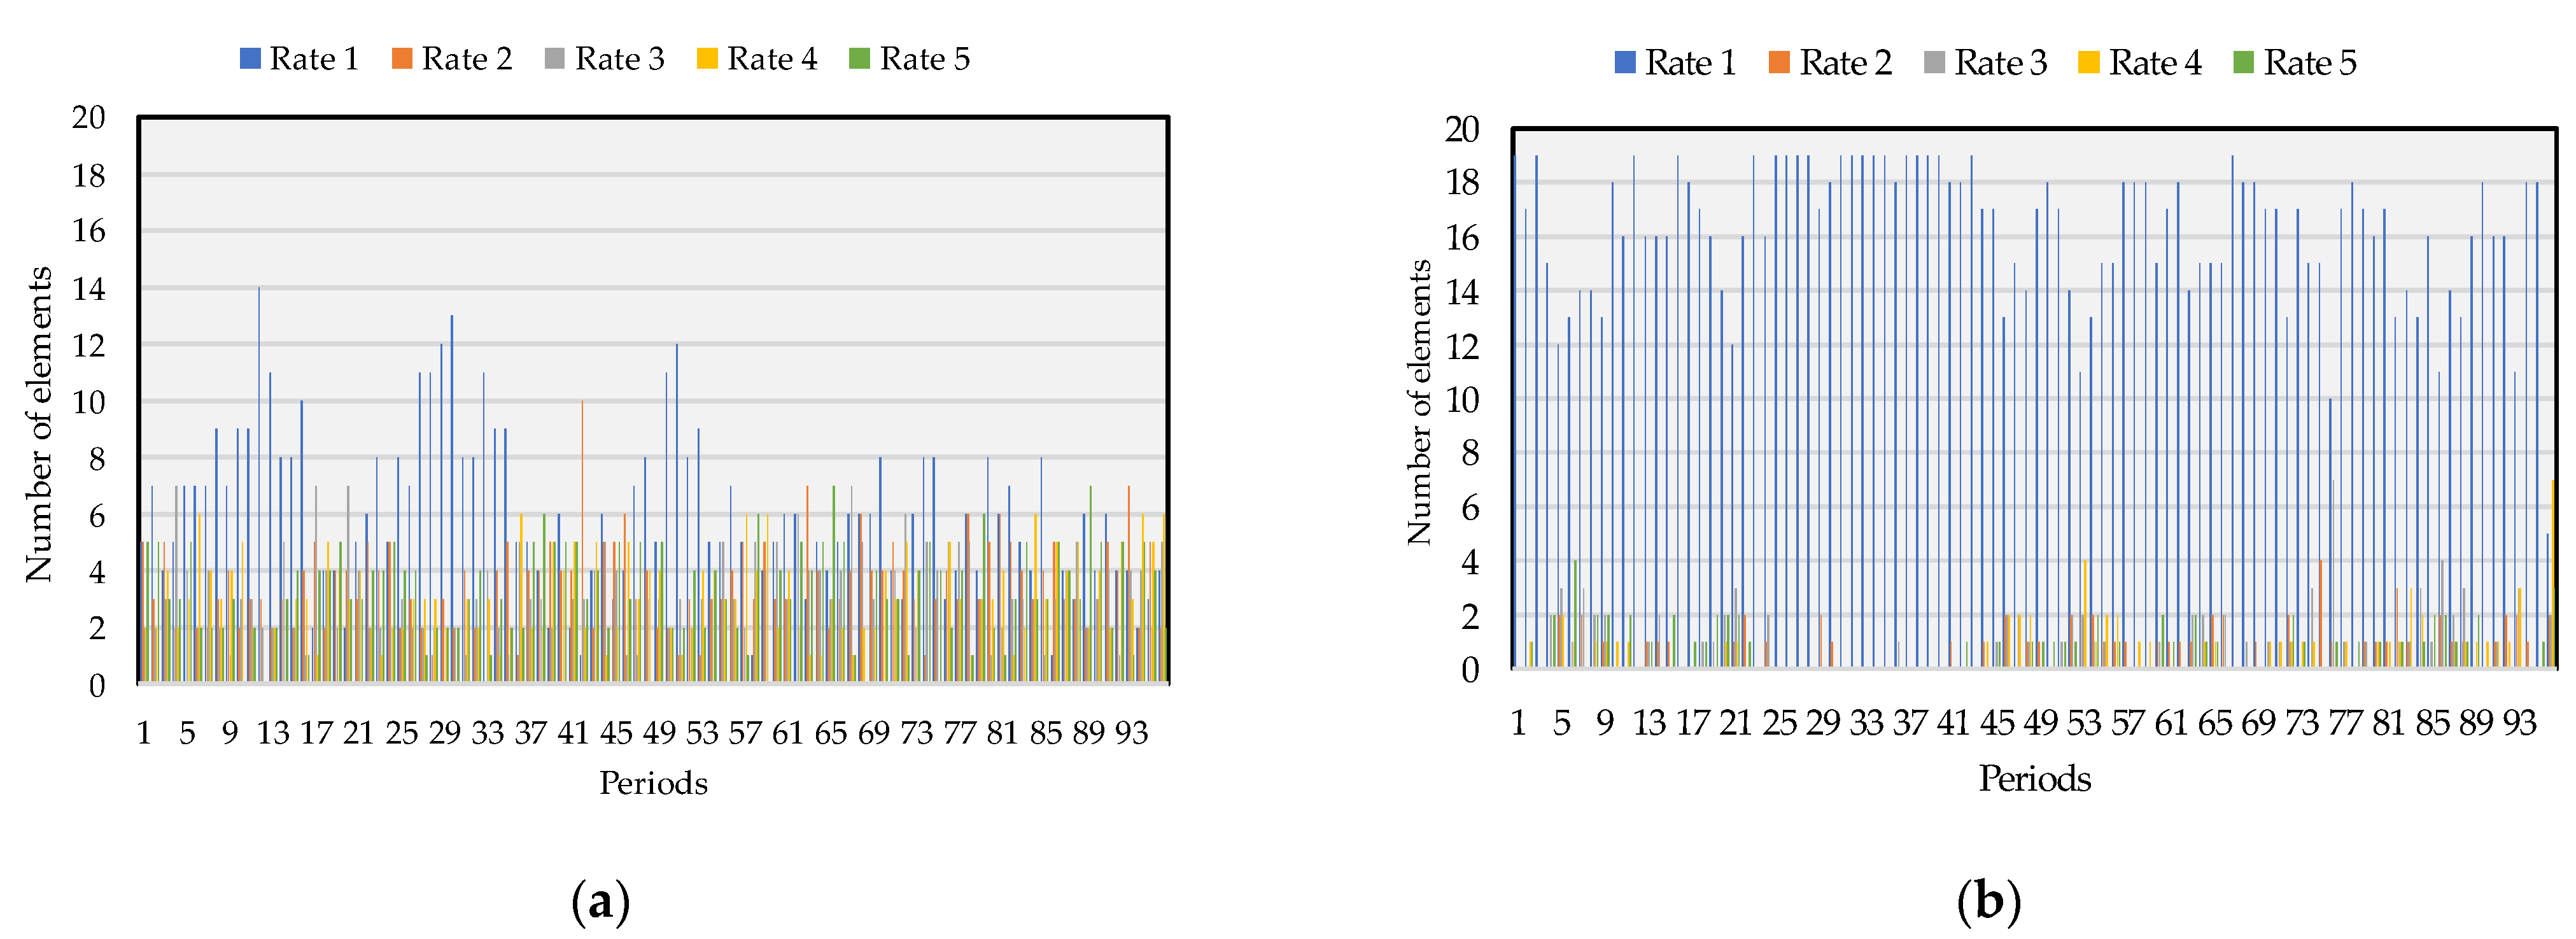
Finally, the last remuneration method, considering the rate created by the authors, is the CTR.
Table 7 shows the total obtained per rate throughout the day according to the participants’ performance—the actual distribution can be seen in
Figure 8. For both cases, rate 1 is the one with more prosumers—mainly on BES discharging, as seen in the blue columns in
Figure 8b. Throughout the 96 periods, 584 lower rates were attributed to the load flexibility and 1554 regarding BESS discharging.
The remuneration obtained with this approach can be seen in
Table 8. Focusing on the actual flexibility from the participants’ load reduction, as already shown previously, the results are around 160 m.u. for the three case studies. However, when comparing with the results from
Table 5, the overall remuneration decreased near 20.27 m.u. Although the ones with better performance receive better compensation, mainly during peak hours, the number of participants with a rate of 5 is still low.
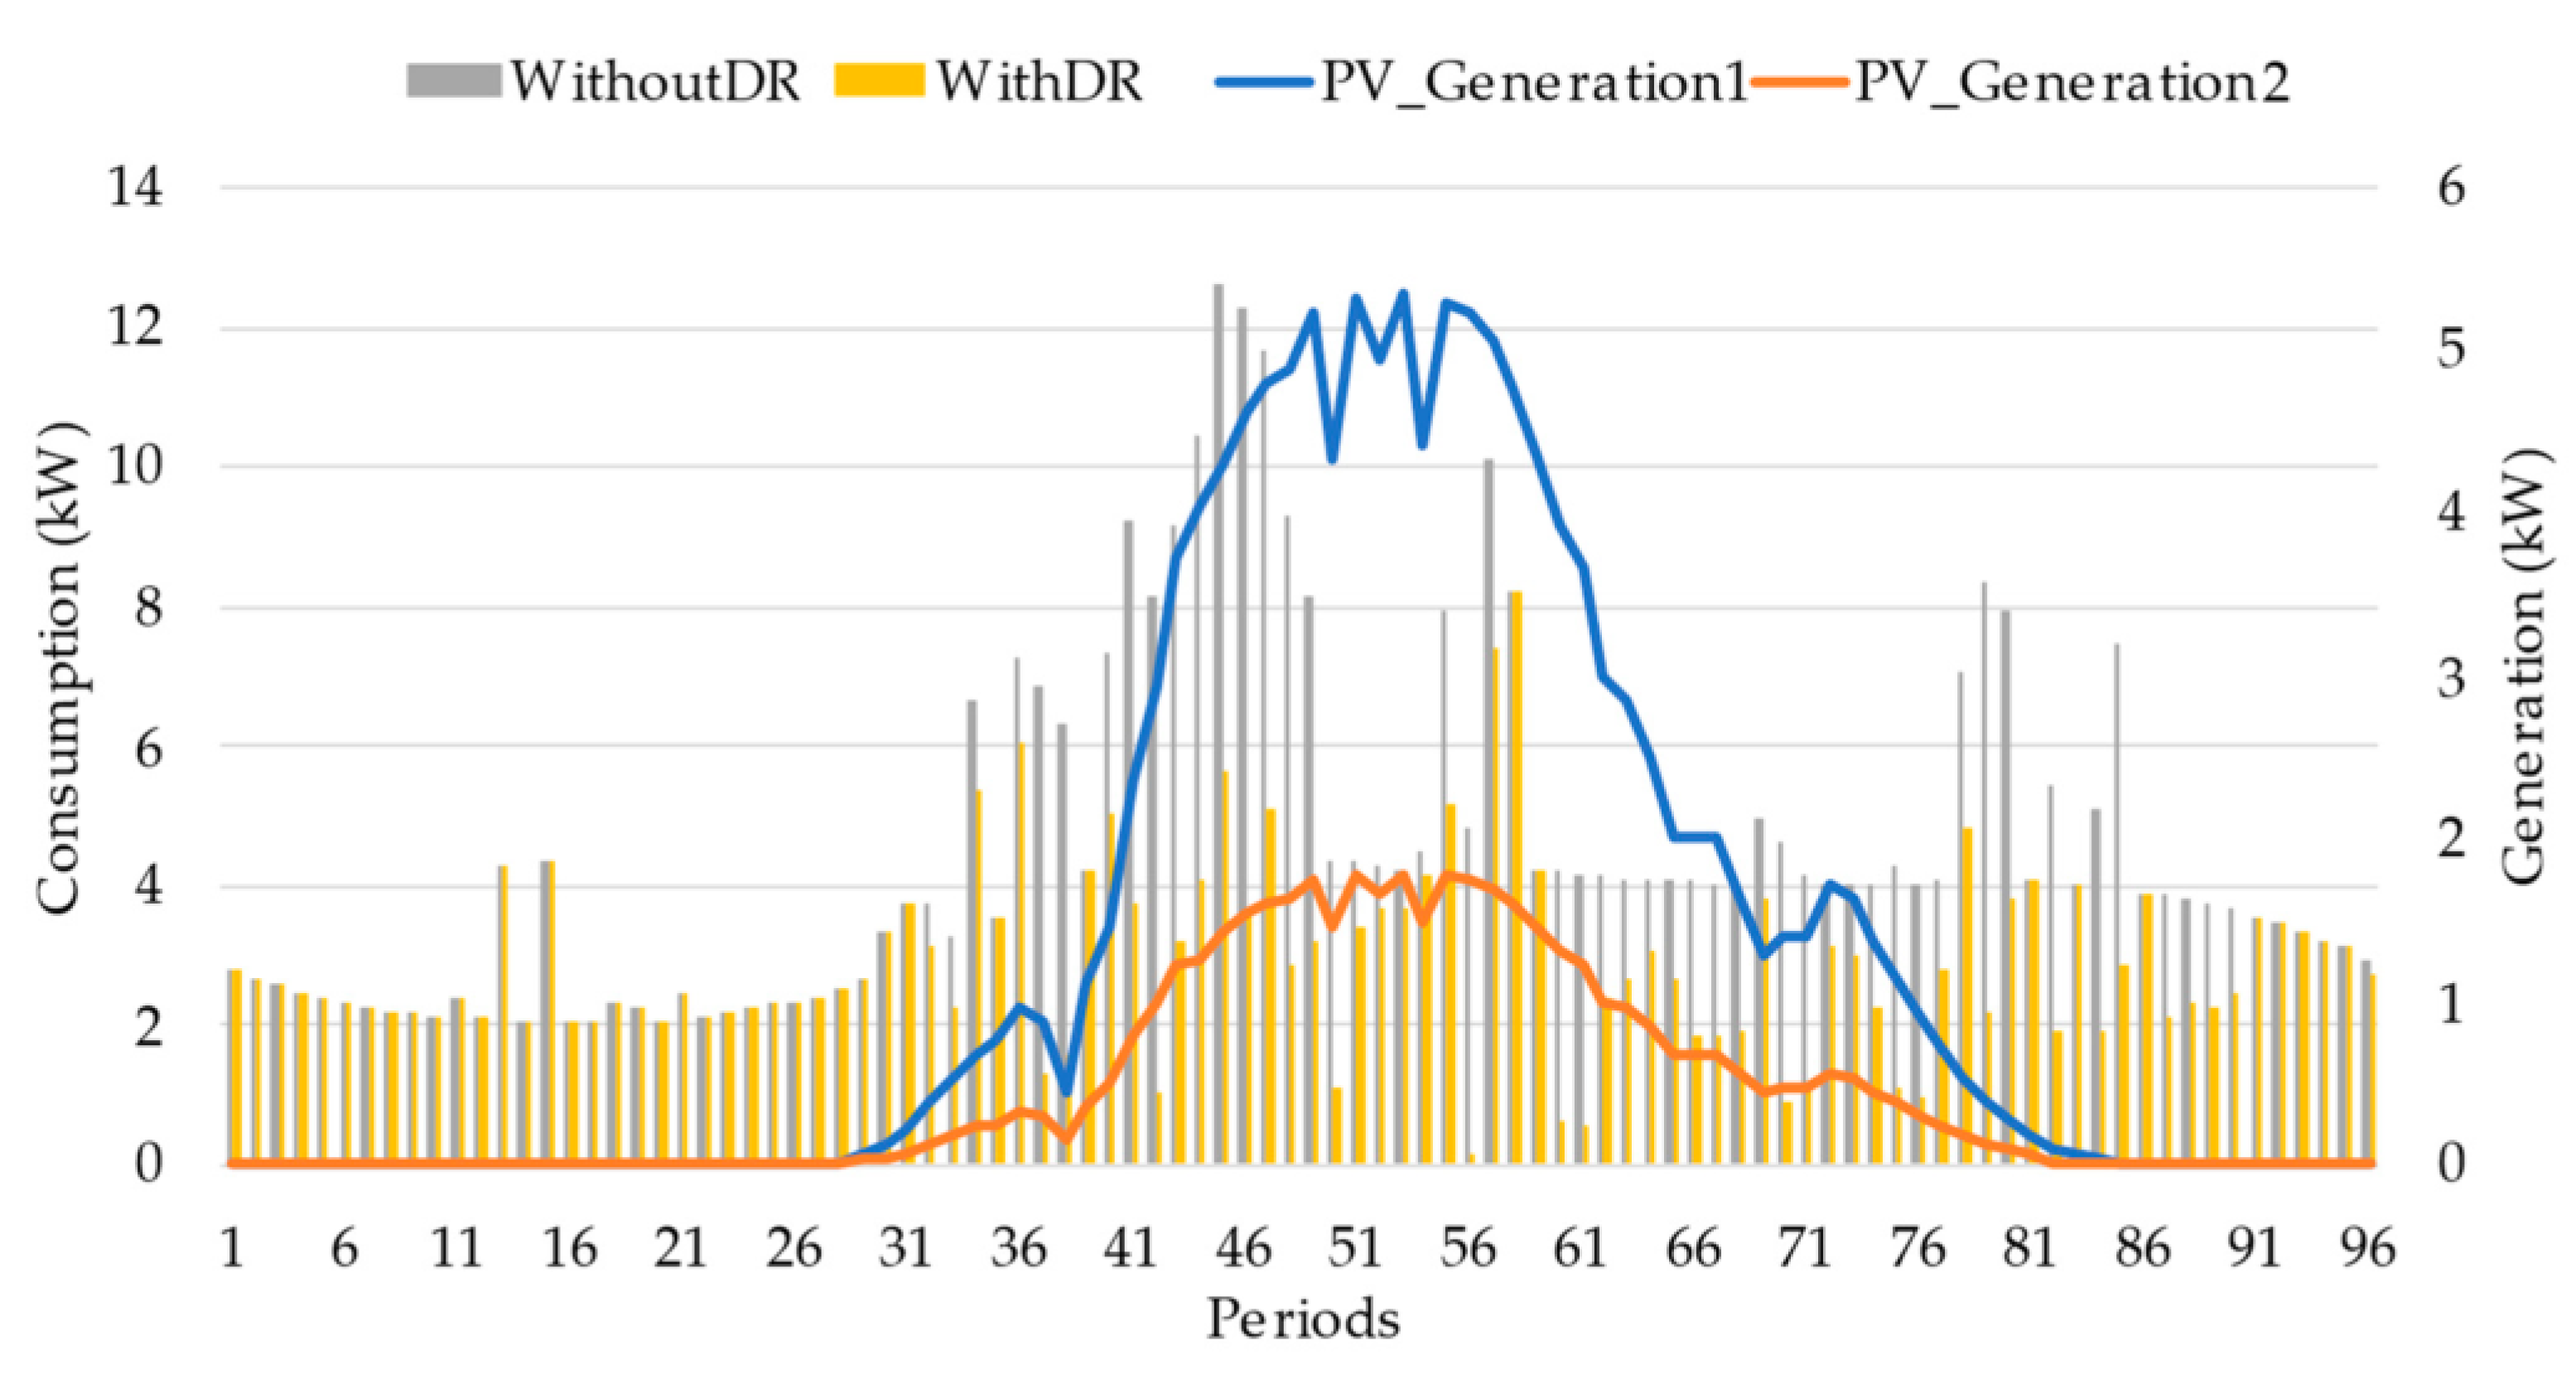
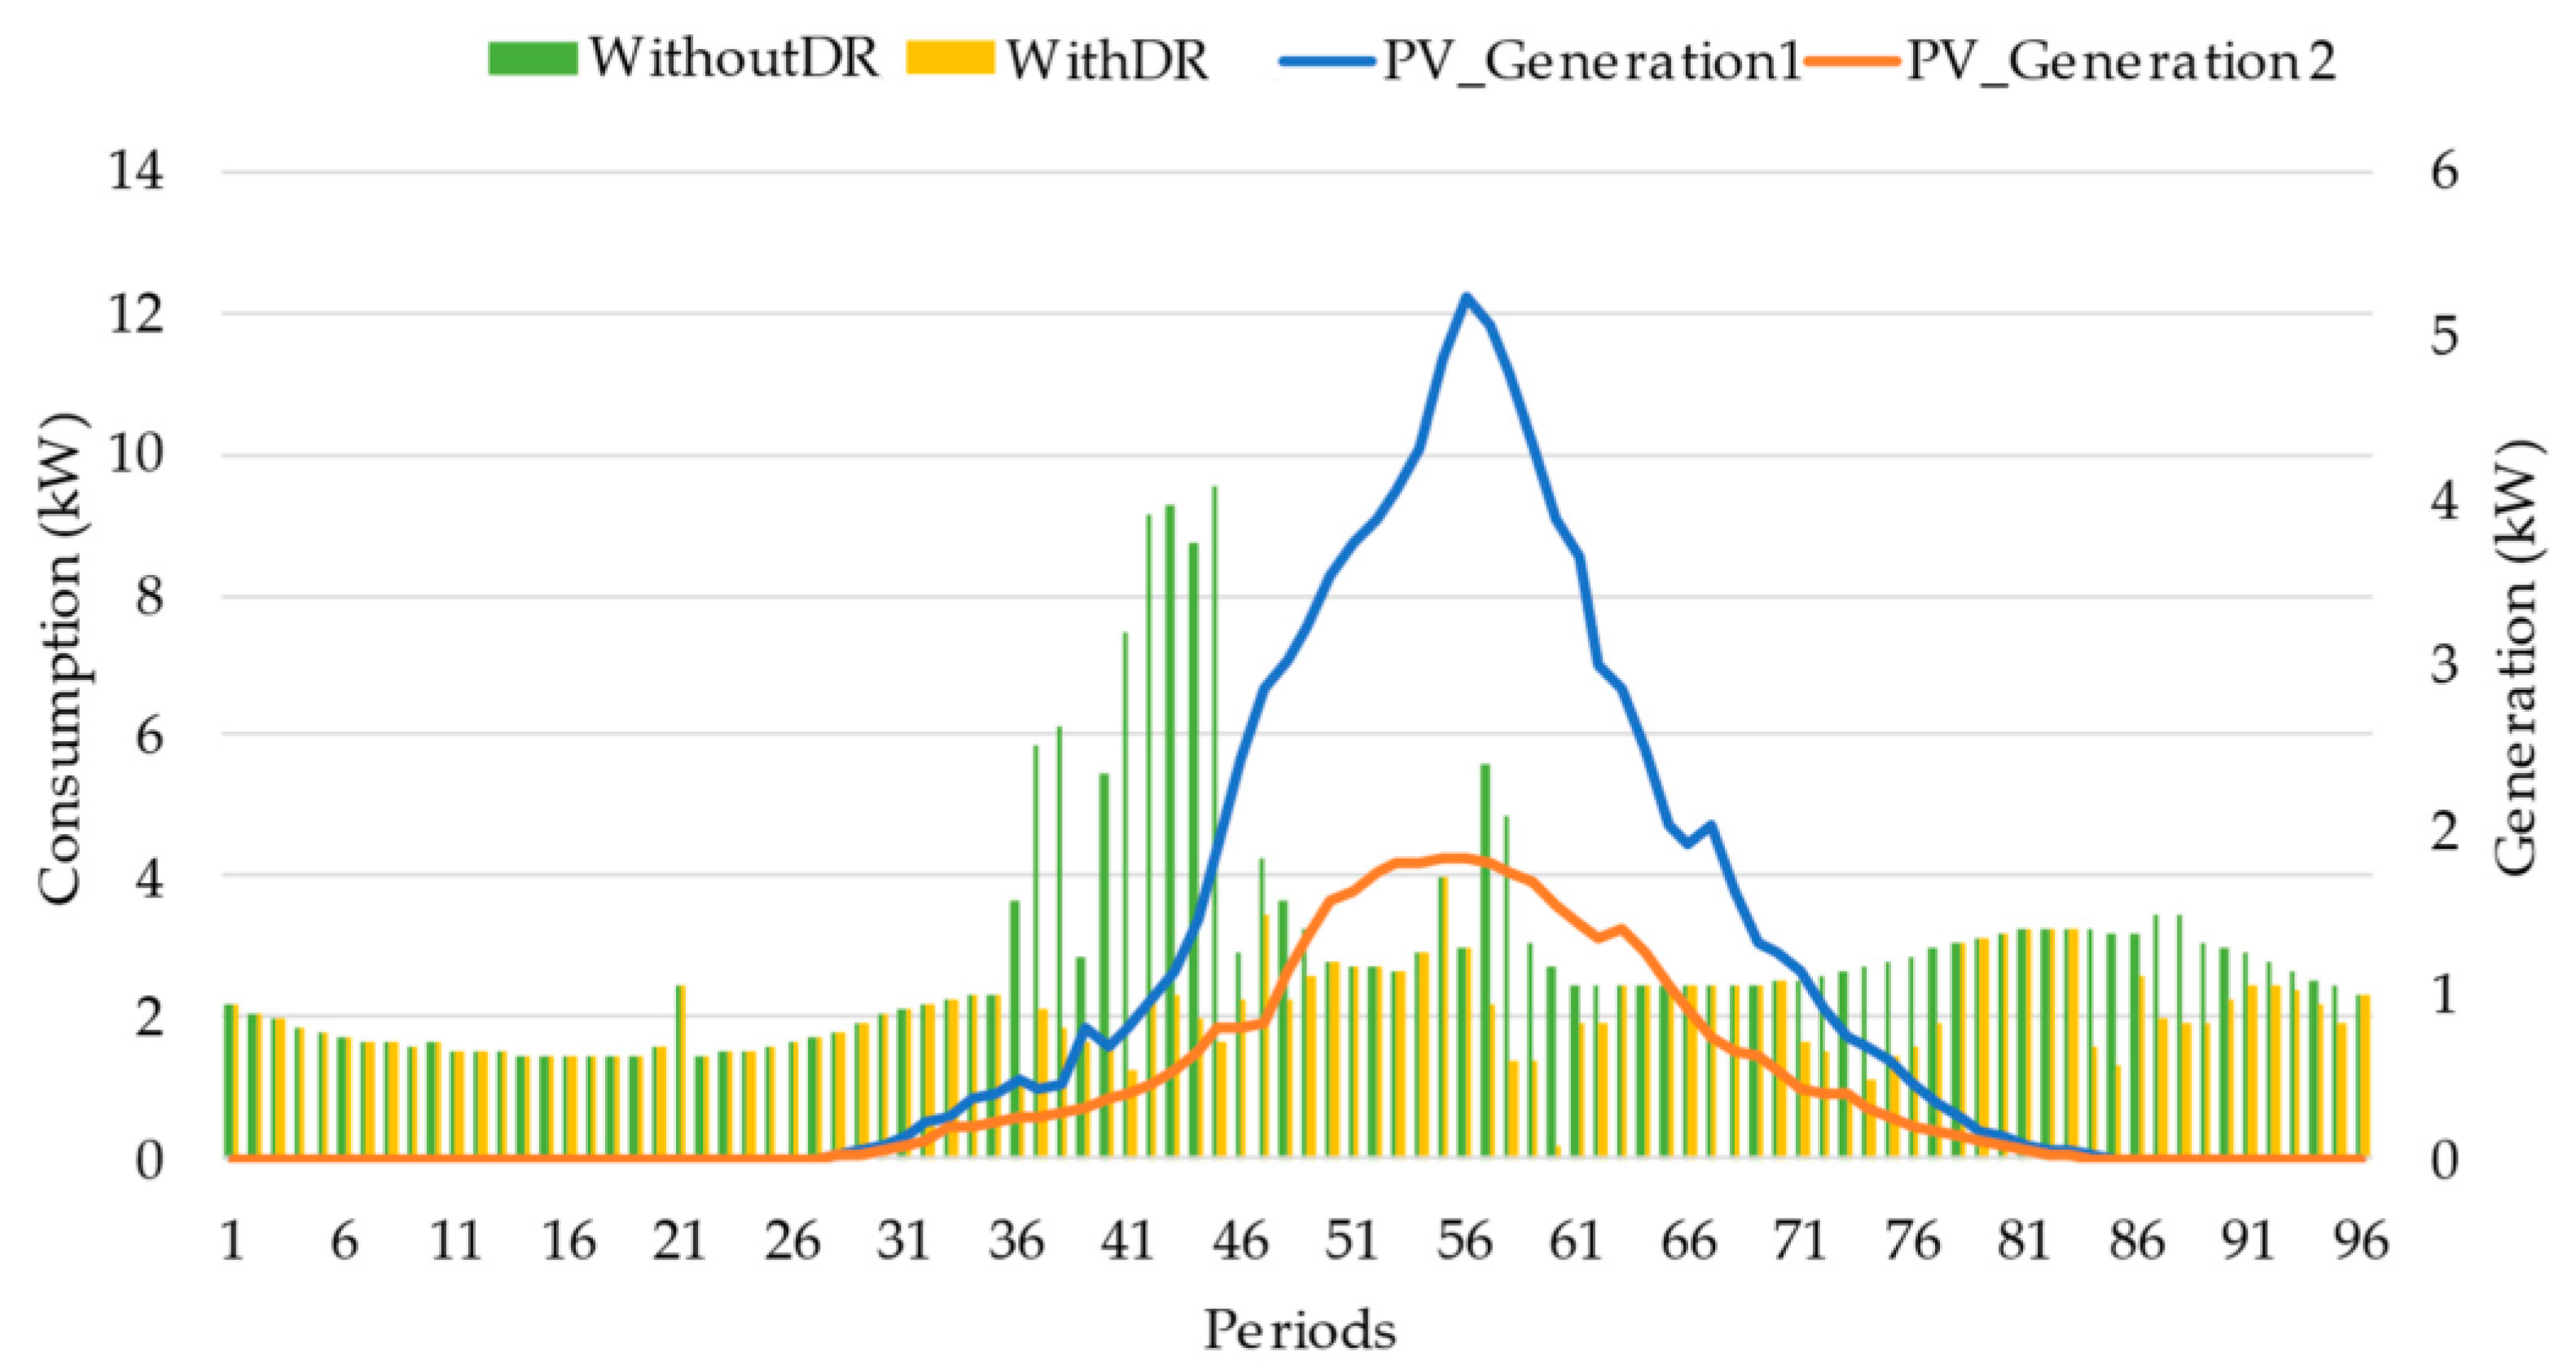
To validate the proposed methodology and support the claim that resources from DR participation in market transactions can bring economic benefits to both players and aggregators, an individual perspective comparing two prosumers with similar behaviors will be analyzed. Although remuneration approach 1 provided low values of total remuneration, which is better from the aggregator perspective, the CTR fair remuneration had a close result to the single fair remuneration and has the advantage of increasing the remuneration by increasing the rate. In the end, this is advantageous for both sides—increasing trustworthiness and giving the proper knowledge regarding community members. With this, the chosen program for this comparison was remuneration approach 4, case study 3.
Figure 9 and
Figure 10 show the comparison-resulting load diagram and generation for prosumer ID2 and prosumer ID6, respectively. It can be seen that the load peak for both prosumers is in a different period from the generation. Participating in the DR event can move their consumption where self-consumption can be applied through their PV generation and saving money, mainly prosumer ID6 from period 36 to 46. Furthermore, prosumer ID 2, from participating in DR events, received a total of 7.58 m.u., and prosumer ID 6 received 8.69 m.u.
5. Conclusions
The consumer’s role is changing in the power and energy market. With the smart grid concept being implemented in the real market, their market influence will increase, not only by providing load flexibility, but also by upgrading their portfolio with distributed generation resources, such as renewable bases like photovoltaic panels and battery energy storage systems. For the present paper’s case studies, the authors aim to better understand the influence of the power and energy price on community resource scheduling and their willingness to move their load consumption by participating in demand response events.
From the results obtained in the study presented in this paper, the prosumers’ flexibility to participate was not impacted by the energy price fluctuation for different schedules. The residential prosumers and their reluctance to change their behavior to avoid jeopardizing their comfort are still a complex problem. Although flexibility was provided, it was expected to have a higher level of demand response participation, since the energy prices increased for several periods. Nevertheless, the authors know that higher participation levels will move load consumption to other periods. This fact must be well managed to avoid a rebound effect after the demand response event, considering that prosumers will also reduce the load requested to the grid and, sometimes, help to balance the generation resources associated by selling their excess, namely from battery energy storage. Regarding battery energy storage discharging flexibility, the response to energy price changes in the scheduling phase was observed for this case. Although photovoltaic generation was also considered in these case studies, battery energy storage is much more predictable and controllable, which is useful for load consumption satisfaction for both the owner and the community-associated.
Regarding the perspective of remuneration, although the single approach had the lower values of remuneration, the authors believe that the approach with a rate that classifies the performance from the demand response participants can benefit from the aggregator perspective without jeopardizing the fairness—the ones with a higher level of trustworthiness will still have higher values of compensation. Furthermore, this approach will also motivate continuous participation to increase the rate assigned and have better benefits, sometimes not paying for the energy prices, since their compensation from the flexibility provided may be higher.
To conclude, the authors summarize the results found in this study and compare them with the current state of the art reviewed previously (
Table 1):
On the simulated scheduling results, the contextual energy price did not much change the behavior from the prosumer load flexibility. However, BES was used several times when PV generation was low, as mentioned [
16,
17].
Single fair remuneration was the one with the lowest total value of remuneration. From the community manager’s perspective, fair remuneration can still be applied, since the participants will receive higher compensation values for DR participation. In [
20], single fair remuneration was also considered in the case studies, but not for prosumers.
Clustering fair remuneration was the one with the higher total value of remuneration. From the prosumer perspective, aggregating the participants into three groups might be interesting, as providing higher flexibility can help them join different groups. This approach was also considered in [
21] but might be highly costly for the community manager.
CTR fair remuneration had results close to the single fair remuneration plus and has the advantage of increasing the remuneration by increasing the rate. This is advantageous for both sides, increasing trustworthiness and giving the proper knowledge regarding community, as in [
19].
In future works, the authors will add electric vehicles as prosumer resources for other types of consumers, such as office buildings. Furthermore, one factor that might impact the results and was not considered was the ramp period and the number of cycles of charge and discharge, which can be considered a disadvantage of the proposed methodology.


