


Using Sensor Technology to Measure Gait Capacity and Gait Performance in Rehabilitation Inpatients with Neurological Disorders

 , , , and
Abstract
1. Introduction
2. Materials and Methods
2.1. Study Design and Approval
2.2. Participants
2.3. Equipment
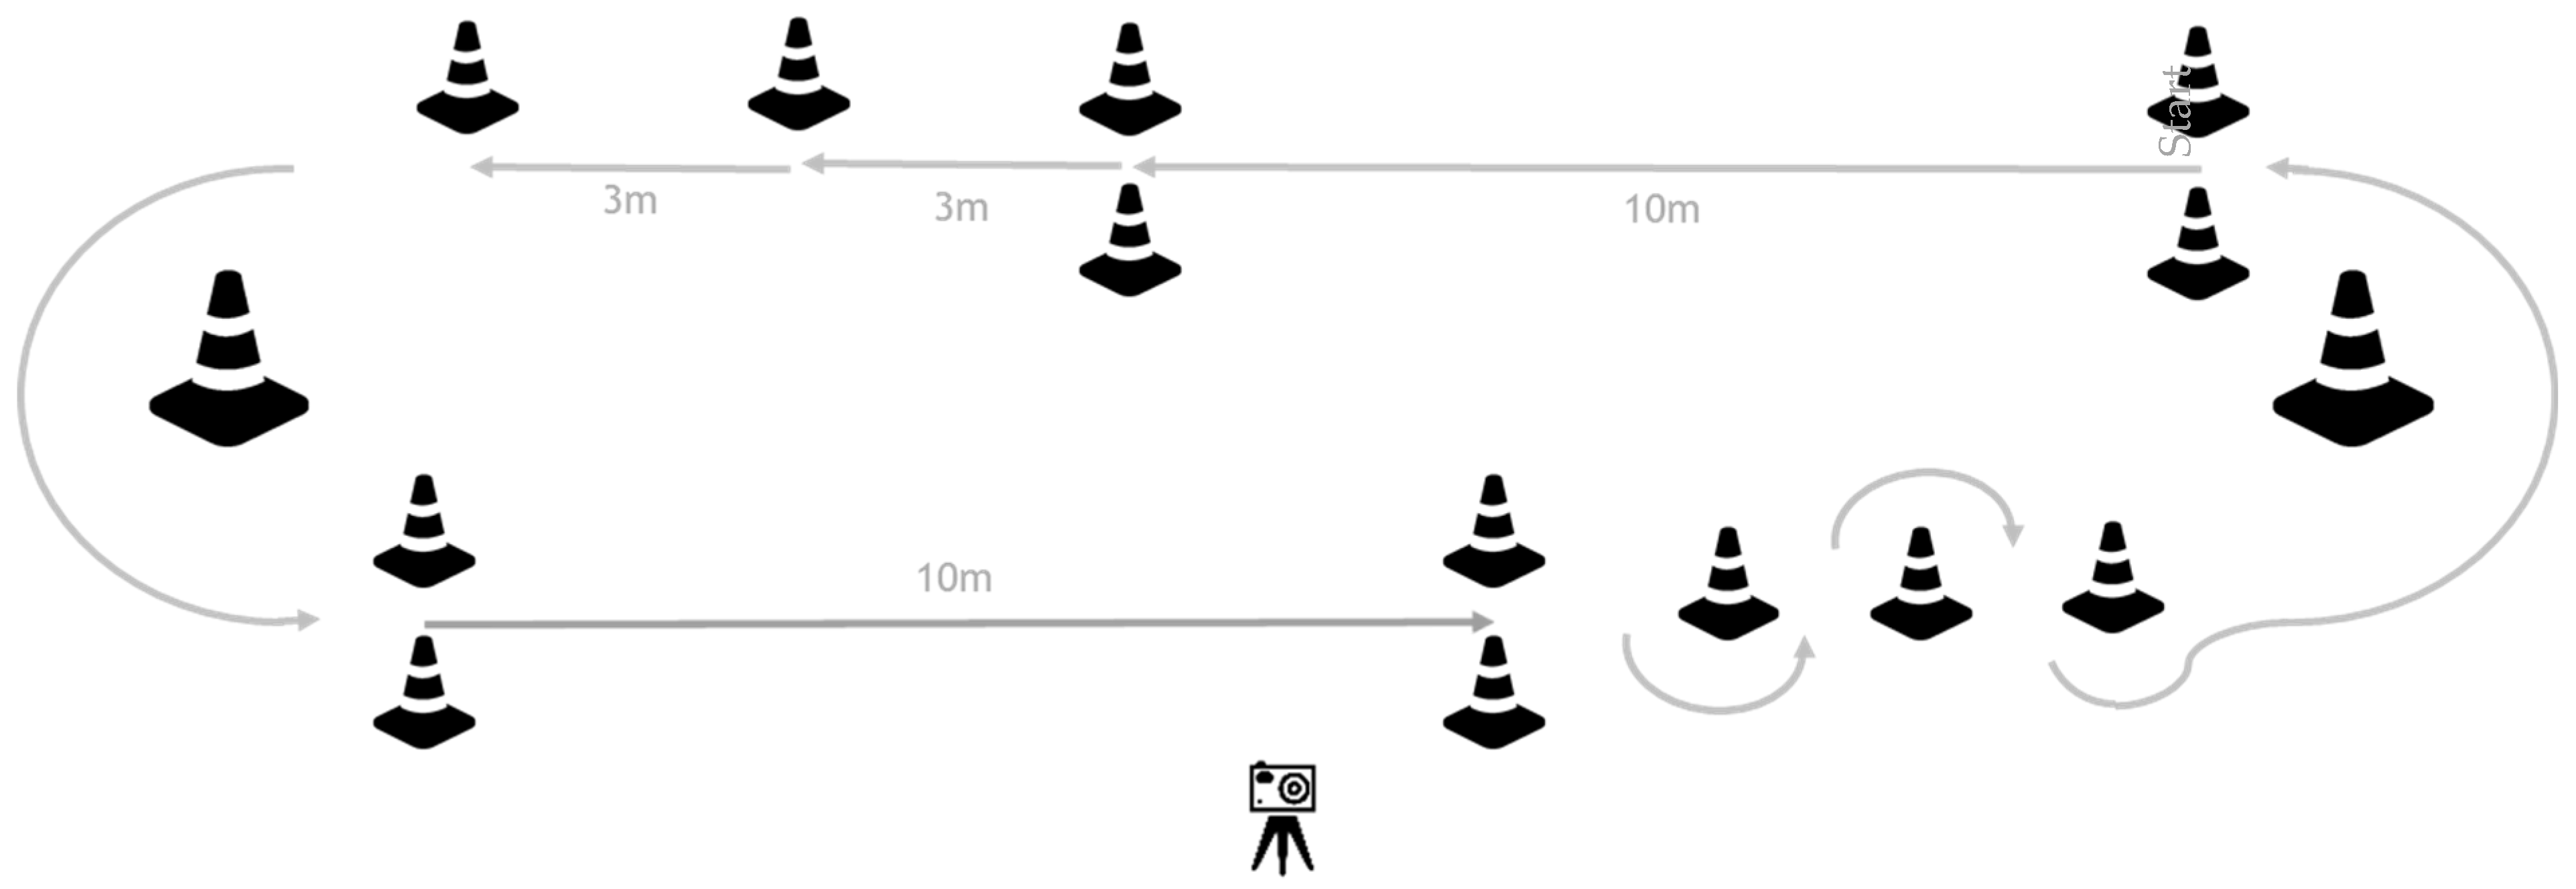
2.4. Gait Capacity Assessment
2.5. Gait Performance Assessment
2.6. Data Processing and Analysis
2.6.1. IMU Gait Algorithm
2.6.2. Gait Capacity
2.6.3. Gait Performance
2.7. Statistical Analysis
2.7.1. Validation of IMU Data and Algorithm
2.7.2. Gait Performance
2.7.3. Relationship between Gait Capacity and Gait Performance
3. Results
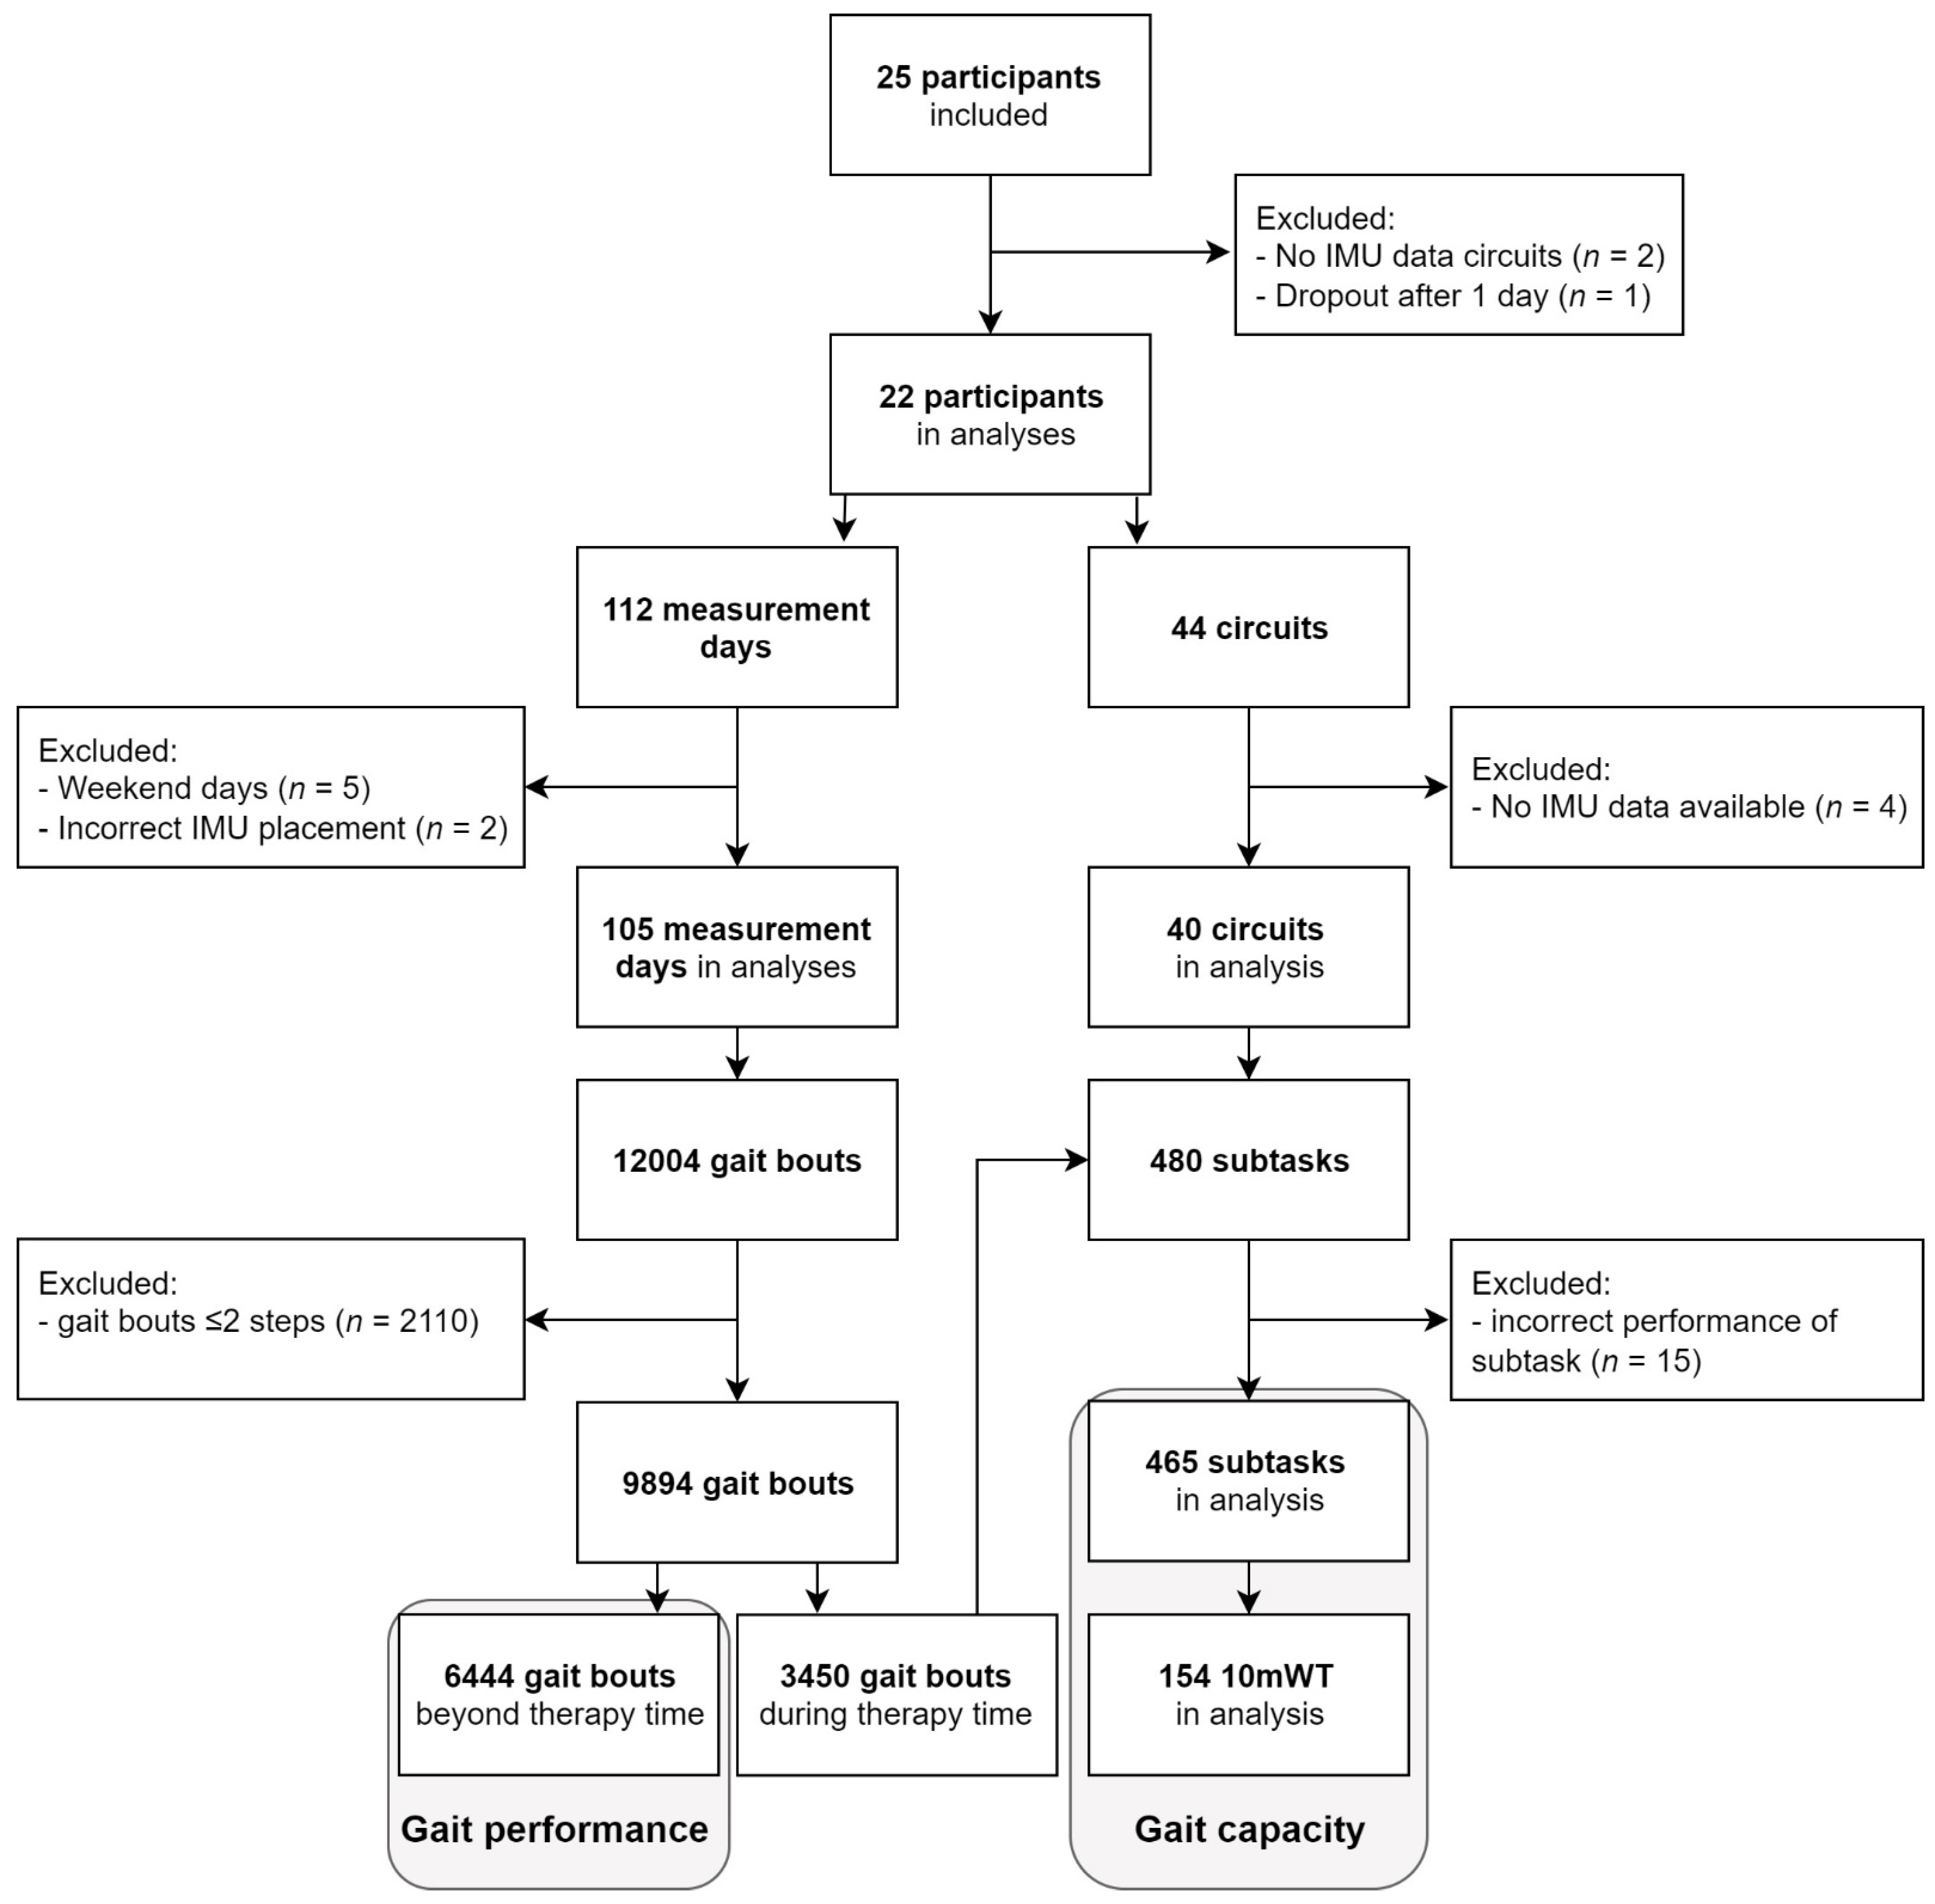
3.1. Participants
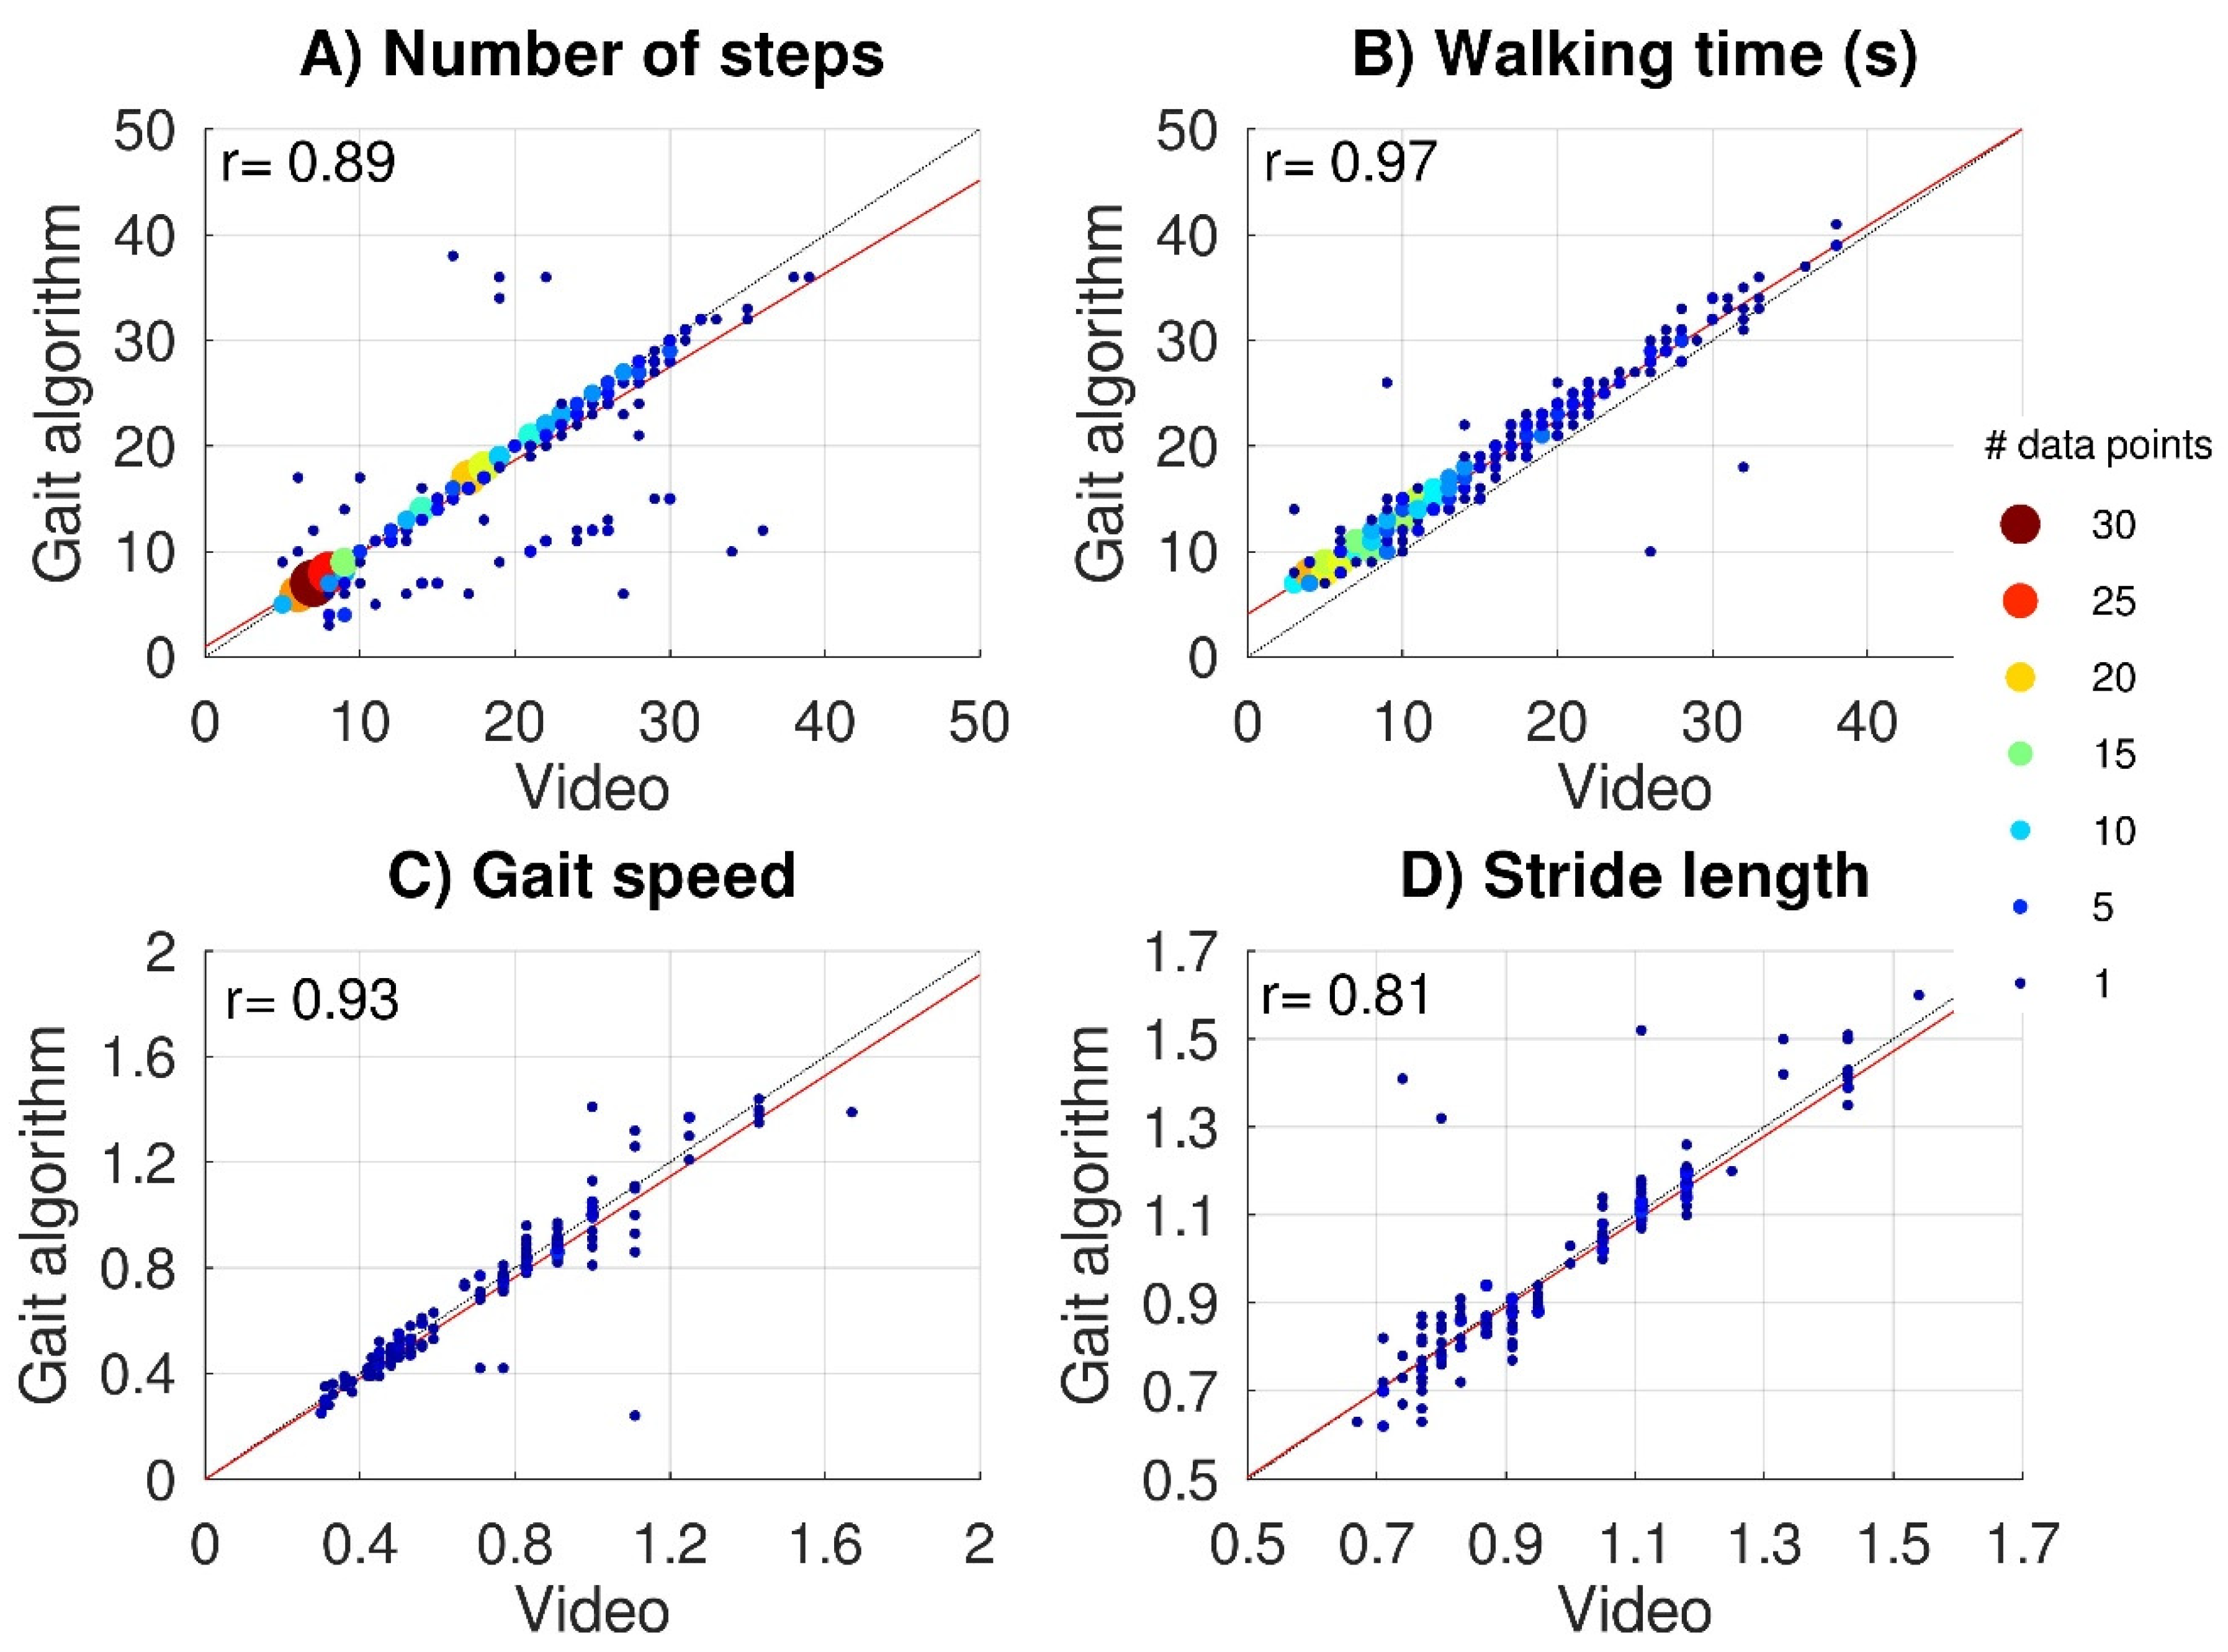
3.2. Validation of IMU Data and Algorithm
3.3. Gait Performance
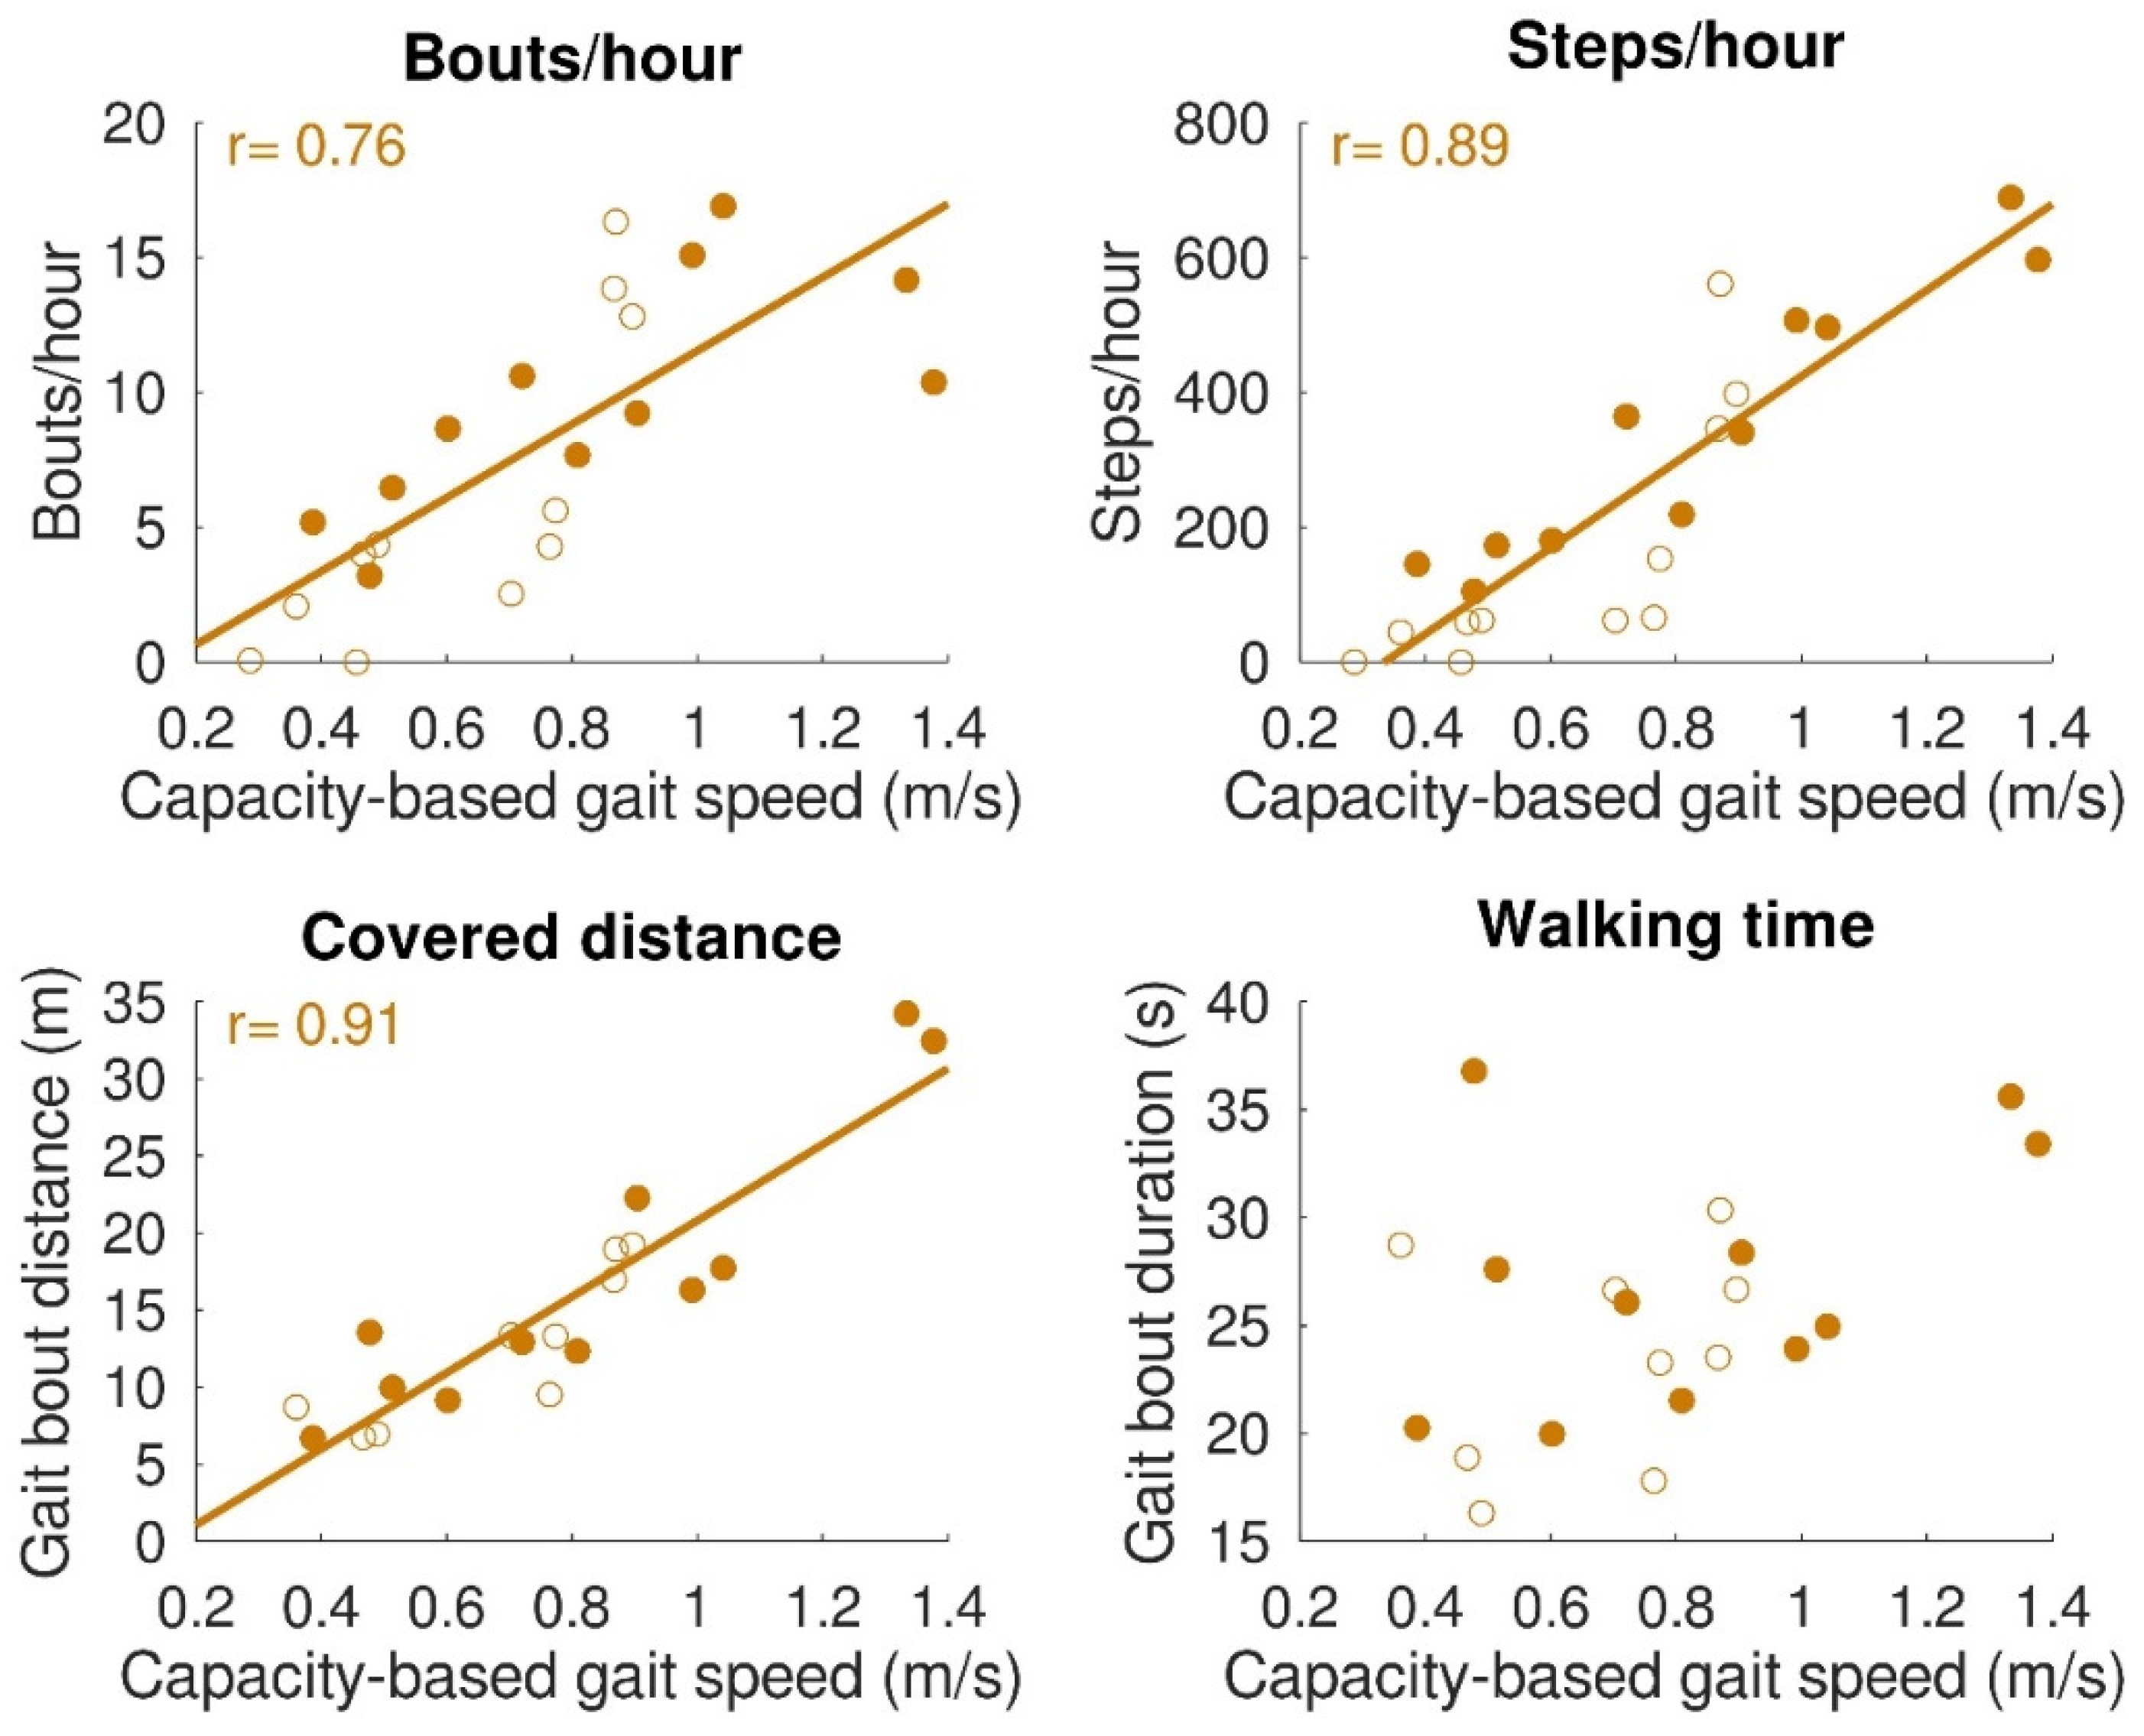
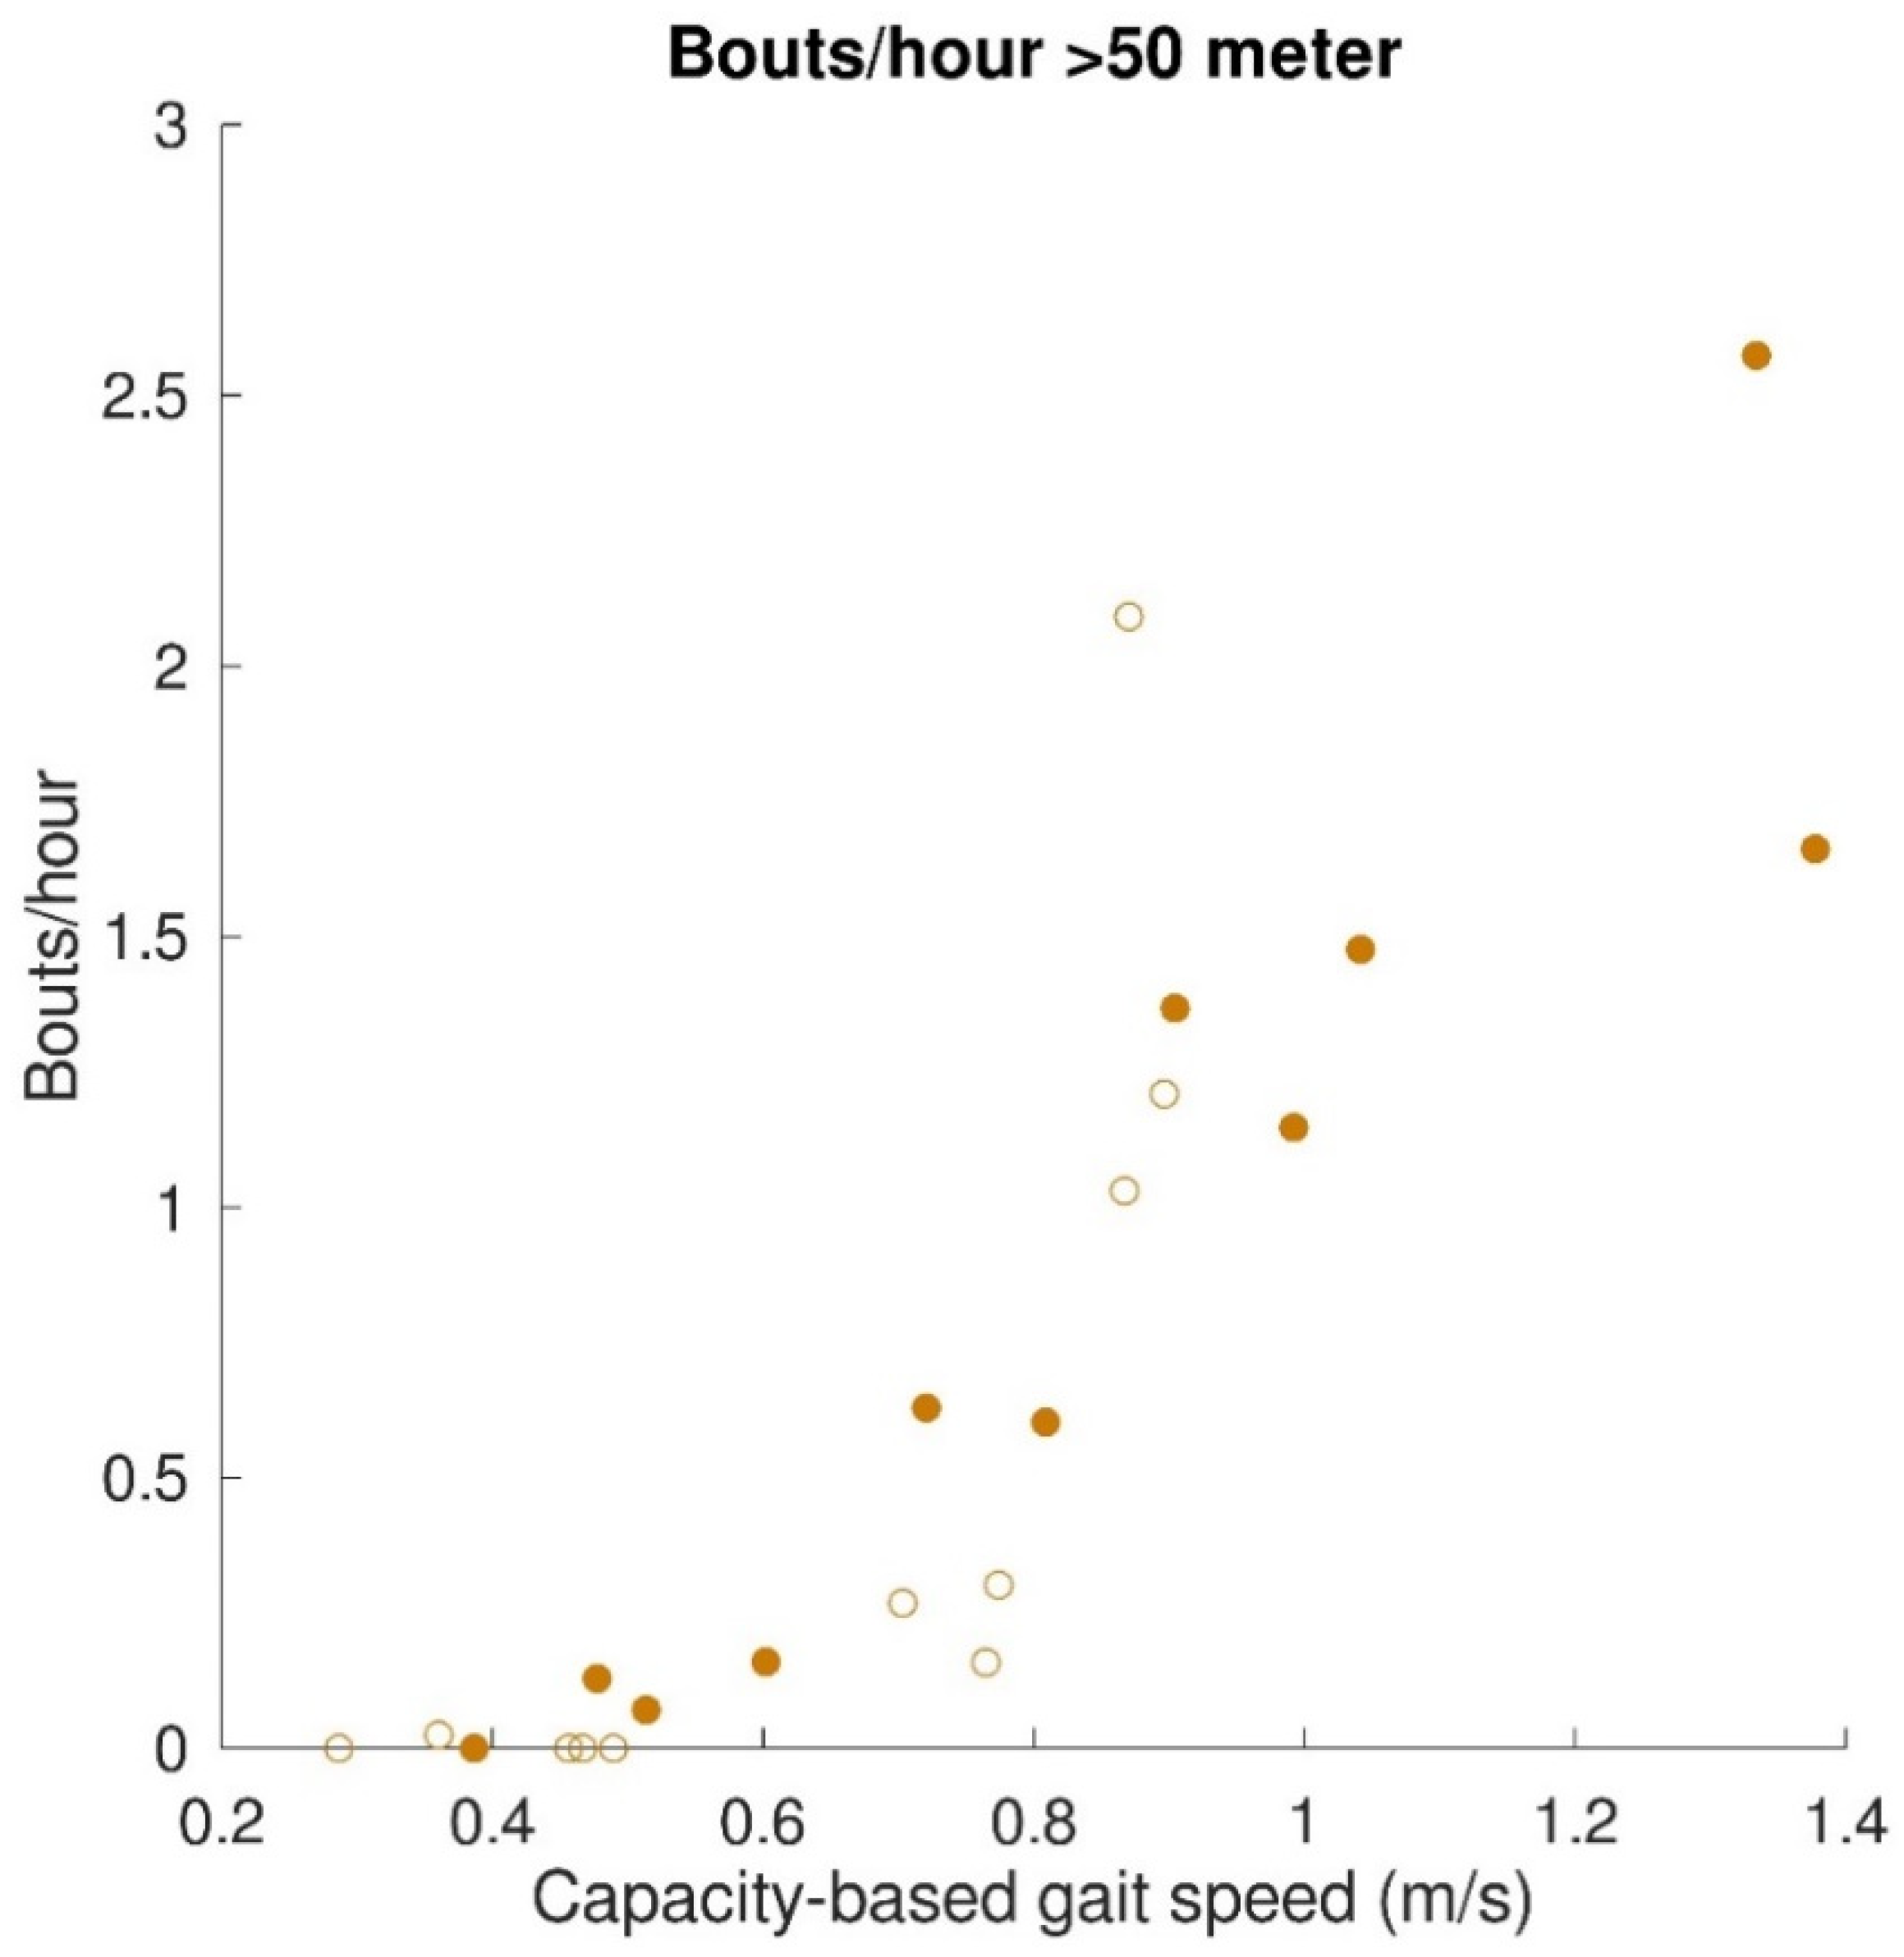
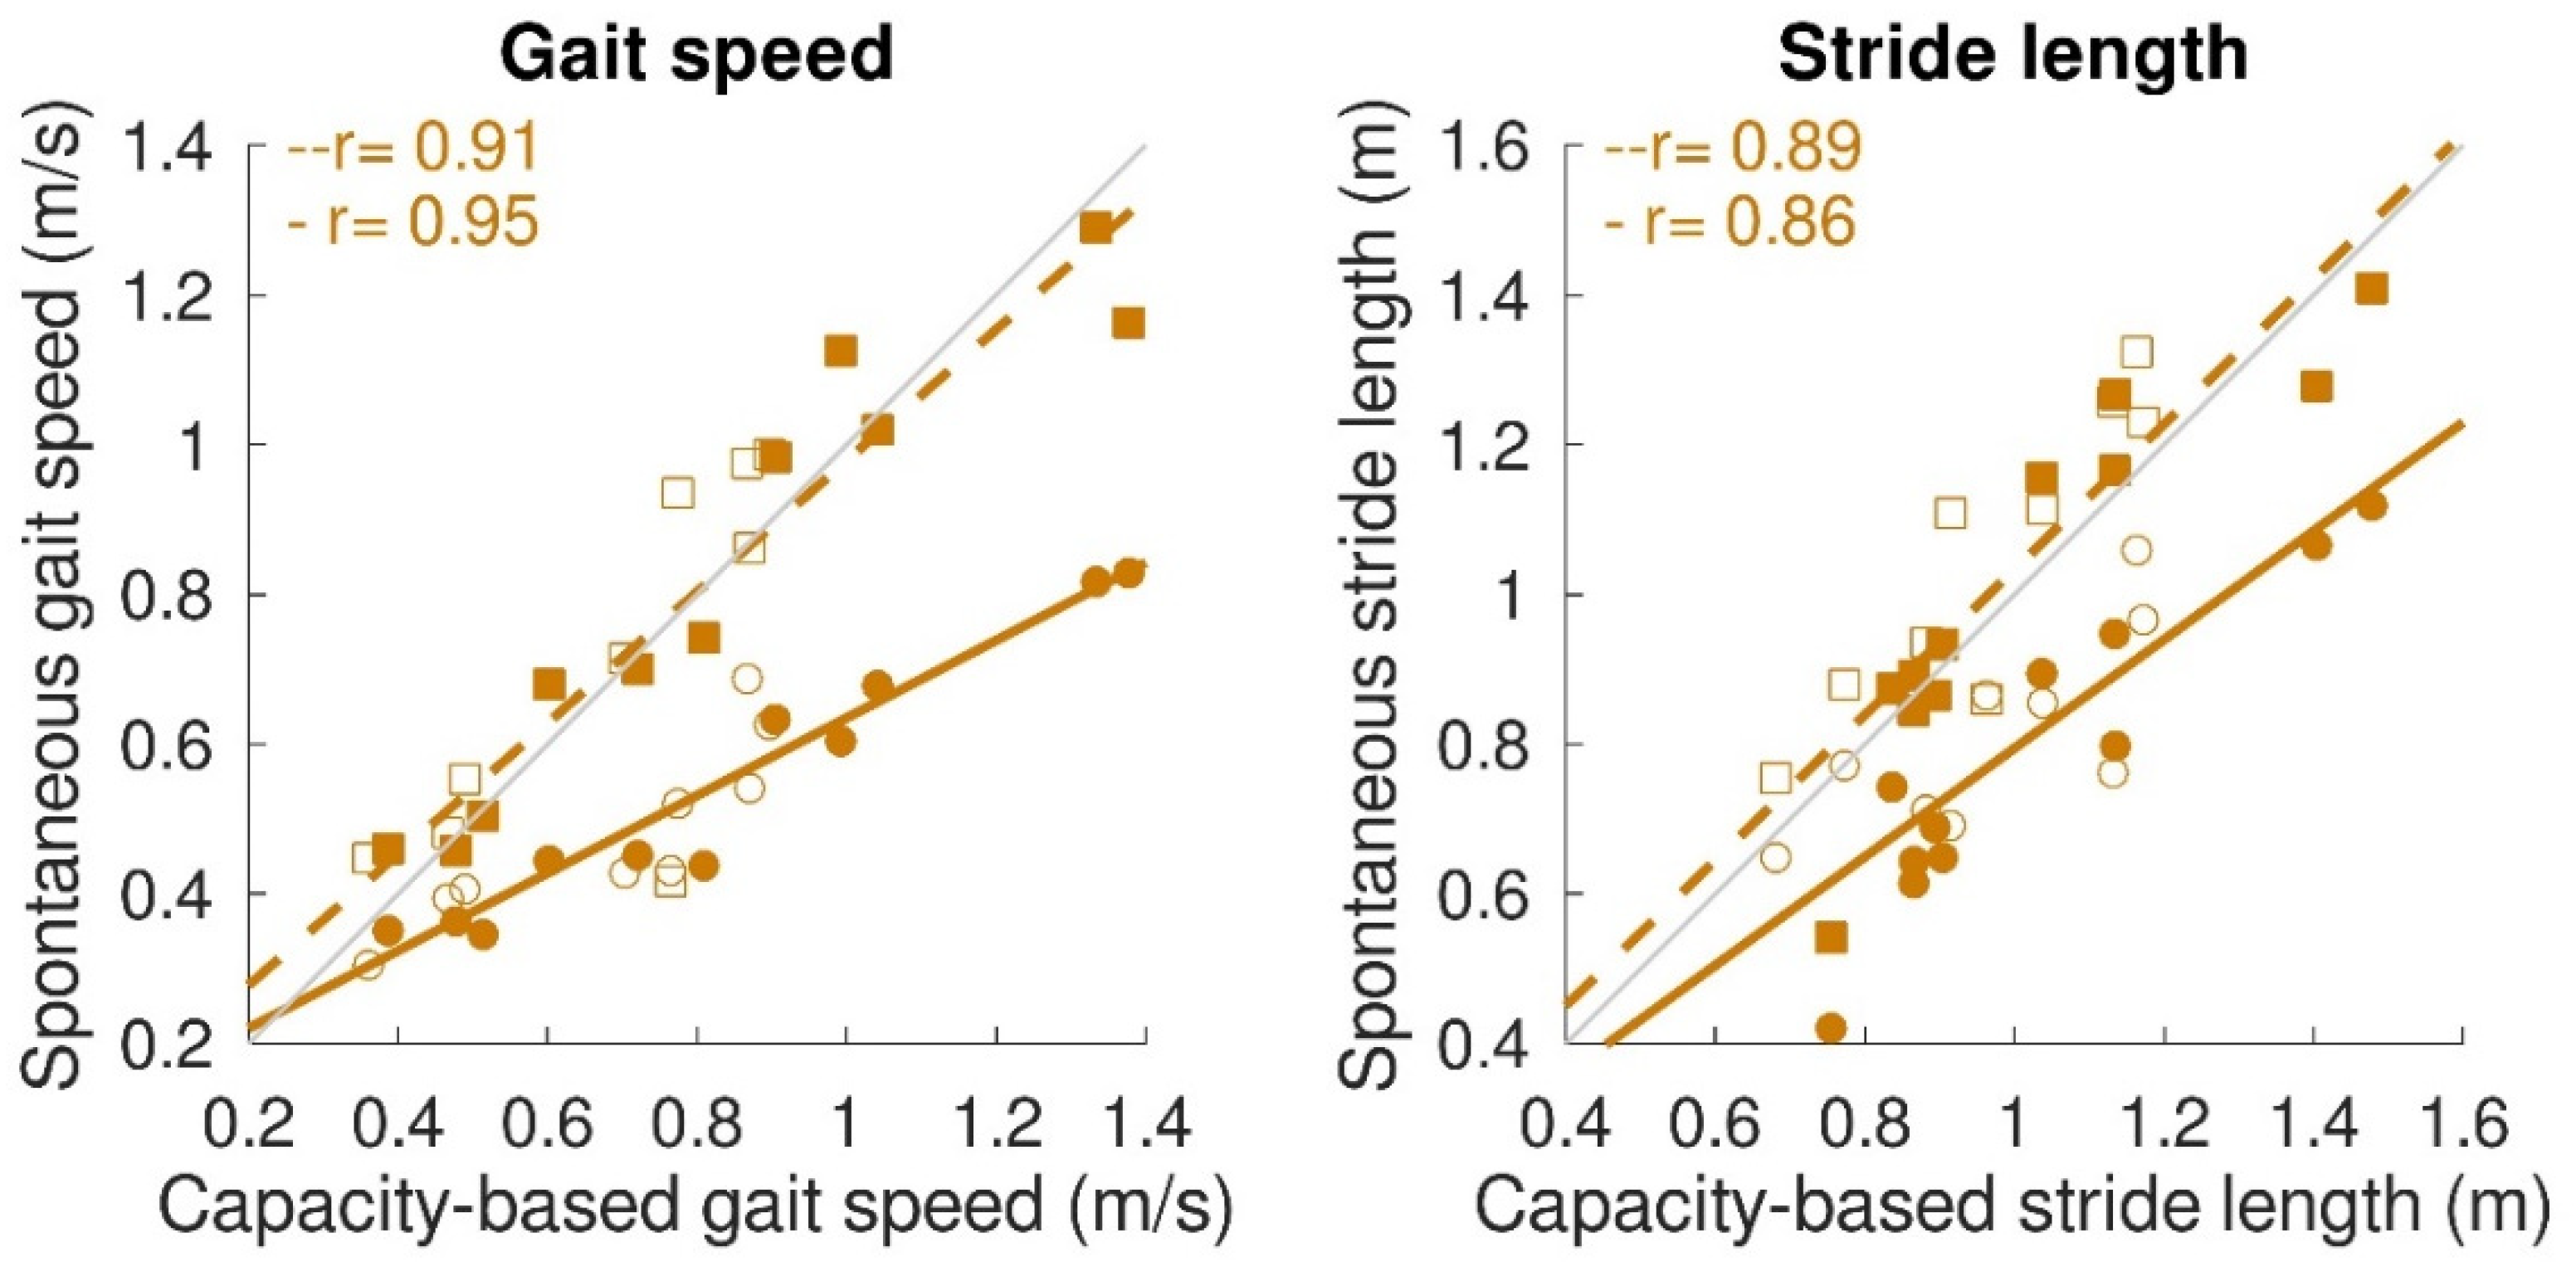
3.4. Relationship between Gait Capacity and Gait Performance
4. Discussion
Author Contributions
Funding
Institutional Review Board Statement
Informed Consent Statement
Data Availability Statement
Acknowledgments
Conflicts of Interest
References
- Frazer, S.W.T.; Hellebrand, W.E.H.; Keijsers, N.W. Variation and achievement of ambulatory activity among pa tients with chronic stroke. J. Rehabil. Med. 2013, 45, 848–853. [Google Scholar] [CrossRef] [PubMed]
- Gebruers, N.; Vanroy, C.; Truijen, S.; Engelborghs, S.; De Deyn, P.P. Monitoring of Physical Activity After Stroke: A Systematic Review of Accelerometry-Based Measures. Arch. Phys. Med. Rehabil. 2010, 91, 288–297. [Google Scholar] [CrossRef] [PubMed]
- Teeter, L.; Gassaway, J.; Taylor, S.; LaBarbera, J.; McDowell, S.; Backus, D.; Zanca, J.M.; Natale, A.; Cabrera, J.; Smout, R.J.; et al. Relationship of physical therapy inpatient rehabilitation interventions and patient characteristics to outcomes following spinal cord injury: The SCIRehab project. J. Spinal Cord Med. 2012, 35, 503–526. [Google Scholar] [CrossRef] [PubMed]
- Mansfield, A.; Wong, J.S.; Bryce, J.; Brunton, K.; Inness, E.L.; Knorr, S.; Jones, S.; Taati, B.; McIlroy, W.E. Use of Accelerometer-Based Feedback of Walking Activity for Appraising Progress with Walking-Related Goals in Inpatient Stroke Rehabilitation. Neurorehabil. Neural Repair 2015, 29, 847–857. [Google Scholar] [CrossRef] [PubMed]
- Ditunno, P.L.; Patrick, M.; Stineman, M.; Ditunno, J.F. Who wants to walk? Preferences for recovery after SCI: A longitudinal and cross-sectional study. Spinal Cord 2008, 46, 500–506. [Google Scholar] [CrossRef]
- Bohannon, R.W.; Andrews, A.W.; Smith, M.B. Rehabilitation goals of patients with hemiplegia. Int. J. Rehabil. Res. 1988, 11, 181–184. [Google Scholar] [CrossRef]
- Klassen, T.D.; Simpson, L.A.; Lim, S.B.; Louie, D.R.; Parappilly, B.; Sakakibara, B.M.; Zbogar, D.; Eng, J.J. “Stepping up” activity poststroke: Ankle-positioned accelerometer can accurately record steps during slow walking. Phys. Ther. 2016, 96, 355–360. [Google Scholar] [CrossRef]
- Billinger, S.A.; Arena, R.; Bernhardt, J.; Eng, J.J.; Franklin, B.A.; Johnson, C.M.; Mackay-Lyons, M.; Macko, R.F.; Mead, G.E.; Roth, E.J.; et al. Physical activity and exercise recommendations for stroke survivors: A statement for healthcare professionals from the American Heart Association/American Stroke Association. Stroke 2014, 45, 2532–2553. [Google Scholar] [CrossRef]
- Scivoletto, G.; Morganti, B.; Molinari, M. Early versus delayed inpatient spinal cord injury rehabilitation: An Italian study. Arch. Phys. Med. Rehabil. 2005, 86, 512–516. [Google Scholar] [CrossRef]
- Klassen, T.D.; Dukelow, S.P.; Bayley, M.T.; Benavente, O.; Hill, M.D.; Krassioukov, A.; Liu-Ambrose, T.; Pooyania, S.; Poulin, M.J.; Schneeberg, A.; et al. Higher Doses Improve Walking Recovery During Stroke Inpatient Rehabilitation. Stroke 2020, 51, 2639–2648. [Google Scholar] [CrossRef]
- Yeung, J.; Catolico, D.; Fullmer, N.; Daniel, R.; Lovell, R.; Tang, R.; Pearson, E.M.; Rosenberg, S.S. Evaluating the Sensoria Smart Socks Gait Monitoring System for Rehabilitation Outcomes. Phys. Med. Rehabil. 2019, 11, 512–521. [Google Scholar] [CrossRef]
- Maetzler, W.; Rochester, L.; Bhidayasiri, R.; Espay, A.J.; Sanchez-Ferro, A.; van Uem, J.M.T. Modernizing Daily Function Assessment in Parkinson’s Disease Using Capacity, Perception, and Performance Measures. Mov. Disord. 2021, 36, 76–82. [Google Scholar] [CrossRef] [PubMed]
- Atrsaei, A.; Corra, M.F.; Dadashi, F.; Vila-Cha, N.; Maia, L.; Mariani, B.; Maetzler, W.; Aminian, K. Gait speed in clinical and daily living assessments in Parkinson’s disease patients: Performance versus capacity. NPJ Park. Dis. 2021, 7, 24. [Google Scholar] [CrossRef] [PubMed]
- Kijima, Y.; Kiyama, R.; Sekine, M.; Tamura, T.; Fujimoto, T.; Maeda, T.; Ohshige, T. Estimation of Gait Independence Using a Tri-Axial Accelerometer in Stroke Patients. J. Aging Phys. Act. 2018, 26, 61–67. [Google Scholar] [CrossRef] [PubMed]
- Mirelman, A.; Shema, S.; Maidan, I.; Hausdorff, J.M. Gait. Handb. Clin. Neurol. 2018, 159, 119–134. [Google Scholar] [CrossRef]
- Zbogar, D.; Eng, J.J.; Miller, W.C.; Krassioukov, A.V.; Verrier, M.C. Physical activity outside of structured therapy during inpatient spinal cord injury rehabilitation. J. Neuroeng. Rehabil. 2016, 13, 1–11. [Google Scholar] [CrossRef]
- Capela, N.A.; Lemaire, E.D.; Baddour, N.; Rudolf, M.; Goljar, N.; Burger, H. Evaluation of a smartphone human activity recognition application with able-bodied and stroke participants. J. Neuroeng. Rehabil. 2016, 13, 5. [Google Scholar] [CrossRef]
- Tao, W.; Liu, T.; Zheng, R.; Feng, H. Gait analysis using wearable sensors. Sensors 2012, 12, 2255–2283. [Google Scholar] [CrossRef]
- Washabaugh, E.P.; Kalyanaraman, T.; Adamczyk, P.G.; Claflin, E.S.; Krishnan, C. Validity and repeatability of inertial measurement units for measuring gait parameters. Gait Posture 2017, 55, 87–93. [Google Scholar] [CrossRef]
- Shull, P.B.; Jirattigalachote, W.; Hunt, M.A.; Cutkosky, M.R.; Delp, S.L. Quantified self and human movement: A review on the clinical impact of wearable sensing and feedback for gait analysis and intervention. Gait Posture 2014, 40, 11–19. [Google Scholar] [CrossRef]
- Mayagoitia, R.E.; Nene, A.V.; Veltink, P.H. Accelerometer and rate gyroscope measurement of kinematics: An inexpensive alternative to optical motion analysis systems. J. Biomech. 2002, 35, 537–542. [Google Scholar] [CrossRef]
- Hillel, I.; Gazit, E.; Nieuwboer, A.; Avanzino, L.; Rochester, L.; Cereatti, A.; Croce, U.D.; Rikkert, M.O.; Bloem, B.R.; Pelosin, E.; et al. Is every-day walking in older adults more analogous to dual-task walking or to usual walking? Elucidating the gaps between gait performance in the lab and during 24/7 monitoring. Eur. Rev. Aging Phys. Act. 2019, 16, 6. [Google Scholar] [CrossRef] [PubMed]
- Tudor-Locke, C.; Craig, C.L.; Aoyagi, Y.; Bell, R.C.; Croteau, K.A.; De Bourdeaudhuij, I.; Ewald, B.; Gardner, A.W.; Hatano, Y.; Lutes, L.D.; et al. How many steps/day are enough? For older adults and special populations. Int. J. Behav. Nutr. Phys. Act. 2011, 8, 1–19. [Google Scholar] [CrossRef] [PubMed]
- Takayanagi, N.; Sudo, M.; Yamashiro, Y.; Lee, S.; Kobayashi, Y.; Niki, Y.; Shimada, H. Relationship between Daily and In-laboratory Gait Speed among Healthy Community-dwelling Older Adults. Sci. Rep. 2019, 9, 2–3. [Google Scholar] [CrossRef]
- Prasanth, H.; Caban, M.; Keller, U.; Courtine, G.; Ijspeert, A.; Vallery, H.; von Zitzewitz, J. Wearable Sensor-Based Real-Time Gait Detection: A Systematic Review. Sensors 2021, 21, 2727. [Google Scholar] [CrossRef]
- Holden, M.K.; Gill, K.M.; Magliozzi, M.R.; Nathan, J.; Piehl-baker, L. Clinical gait assessment in the neurologically impaired. Reliability and meaningfulness. Phys. Ther. 1984, 64, 35–40. [Google Scholar] [CrossRef]
- Kirshblum, S.C.; Waring, W.; Biering-Sorensen, F.; Burns, S.P.; Johansen, M.; Schmidt-Read, M.; Donovan, W.; Graves, D.; Jha, A.; Jones, L.; et al. Reference for the 2011 revision of the International Standards for Neurological Classification of Spinal Cord Injury. J. Spinal Cord Med. 2011, 34, 547–554. [Google Scholar] [CrossRef]
- Hendriks, M.M.S.; Vos-Van der Hulst, M.; Keijsers, N.L.W. Feasibility of a sensor-based technological platform in assessing gait and sleep of in-hospital stroke and incomplete spinal cord injury (iSCI) patients. Sensors 2020, 20, 2748. [Google Scholar] [CrossRef]
- Patterson, M.R.; Whelan, D.; Reginatto, B.; Caprani, N.; Walsh, L.; Smeaton, A.F.; Inomata, A.; Caulfield, B. Does external walking environment affect gait patterns? In Proceedings of the 36th Annual International Conference of the IEEE Engineering in Medicine and Biology Society, Chicago, IL, USA, 26–30 August 2014; pp. 2981–2984. [Google Scholar] [CrossRef]
- Kobsar, D.; Charlton, J.M.; Tse, C.T.; Esculier, J.-F.; Graffos, A.; Krowchuk, N.M.; Thatcher, D.; Hunt, M.A. Validity and reliability of wearable inertial sensors in healthy adult walking: A systematic review and meta-analysis. J. Neuroeng. Rehabil. 2020, 17, 1–21. [Google Scholar] [CrossRef]
- Mukaka, M. Statistics corner: A guide to appropriate use of correlation in medical research. Malawi Med. J. 2012, 24, 69–71. [Google Scholar]
- Yang, S.; Li, Q. Inertial sensor-based methods in walking speed estimation: A systematic review. Sensors 2012, 12, 6102–6116. [Google Scholar] [CrossRef] [PubMed]
- Trojaniello, D.; Cereatti, A.; Pelosin, E.; Avanzino, L.; Mirelman, A.; Hausdorff, J.M.; Della Croce, U. Estimation of step-by-step spazio-temporal parameters of normal and impaired gait using shank-mounted magneto-inertial sensors. J. Neuroeng. Rehabil. 2014, 11, 1–12. [Google Scholar] [CrossRef]
- Storm, F.A.; Buckley, C.J.; Mazzà, C. Gait event detection in laboratory and real life settings: Accuracy of ankle and waist sensor based methods. Gait Posture 2016, 50, 42–46. [Google Scholar] [CrossRef] [PubMed]
- Patterson, M.R.; Johnston, W.; O’Mahony, N.; O’Mahony, S.; Nolan, E.; Caulfield, B. Validation of temporal gait metrics from three IMU locations to the gold standard force plate. In Proceedings of the 2016 38th Annual International Conference of the IEEE Engineering in Medicine and Biology Society (EMBC), Orlando, FL, USA, 16–20 August 2016; pp. 667–671. [Google Scholar] [CrossRef]
- Handlery, R.; Regan, E.W.; Stewart, J.C.; Pellegrini, C.; Monroe, C.; Hainline, G.; Handlery, K.; Fritz, S.L. Predictors of daily steps at 1-year poststroke: A secondary analysis of a randomized controlled trial. Stroke 2021, 52, 1768–1777. [Google Scholar] [CrossRef] [PubMed]
- Fini, N.A.; Bernhardt, J.; Holland, A.E. Low gait speed is associated with low physical activity and high sedentary time following stroke. Disabil. Rehabil. 2021, 43, 2001–2008. [Google Scholar] [CrossRef] [PubMed]
- Hofstad, C.J.; Bongers, K.T.J.; Didden, M.; van Ee, R.F.; Keijsers, N.L.W. Maximal Walking Distance in Persons with a Lower Limb Amputation. Sensors 2020, 20, 6770. [Google Scholar] [CrossRef]
- Ryall, N.H.; Eyres, S.B.; Neumann, V.C.; Bhakta, B.B.; Tennant, A. The SIGAM mobility grades: A new population-specific measure for lower limb amputees. Disabil. Rehabil. 2003, 25, 833–844. [Google Scholar] [CrossRef]
- Perry, J.; Garrett, M.; Gronley, J.K.; Mulroy, S.J. Classification of Walking Handicap in the Stroke Population. Stroke 1995, 26, 982–989. [Google Scholar] [CrossRef]
- Dickstein, R. Rehabilitation of gait speed after stroke: A critical review of intervention approaches. Neurorehabil. Neural Repair 2008, 22, 649–660. [Google Scholar] [CrossRef]
- Wang, Y.; Mukaino, M.; Ohtsuka, K.; Otaka, Y.; Tanikawa, H.; Matsuda, F.; Tsuchiyama, K.; Yamada, J.; Saitoh, E. Gait characteristics of post-stroke hemiparetic patients with different walking speeds. Int. J. Rehabil. Res. 2020, 43, 69–75. [Google Scholar] [CrossRef]
- Promkeaw, D.; Arrayawichanon, P.; Thaweewannakij, T.; Mato, L.; Amatachaya, P.; Amatachaya, S. Various surfaces challenge gait characteristics of ambulatory patients with spinal cord injury. Spinal Cord 2019, 57, 805–813. [Google Scholar] [CrossRef] [PubMed]
- Van Ancum, J.M.; van Schooten, K.S.; Jonkman, N.H.; Huijben, B.; van Lummel, R.C.; Meskers, C.G.M.; Maier, A.B.; Pijnappels, M. Gait speed assessed by a 4-m walk test is not representative of daily-life gait speed in community-dwelling adults. Maturitas 2019, 121, 28–34. [Google Scholar] [CrossRef]
- Celik, Y.; Stuart, S.; Woo, W.L.; Sejdic, E.; Godfrey, A. Multi-modal gait: A wearable, algorithm and data fusion approach for clinical and free-living assessment. Inf. Fusion 2022, 78, 57–70. [Google Scholar] [CrossRef]
- Pham, T.T.; Suh, Y.S. Conditional Generative Adversarial Network-based Regression Approach for Walking Distance Estimation using Waist-mounted Inertial Sensors. IEEE Trans. Instrum. Meas. 2022, 71, 1–13. [Google Scholar] [CrossRef]
- Bohannon, R.W.; Glenney, S.S. Minimal clinically important difference for change in comfortable gait speed of adults with pathology: A systematic review. J. Eval. Clin. Pract. 2014, 20, 295–300. [Google Scholar] [CrossRef]


| Terminology | Explanation | Outcome Parameters |
|---|---|---|
| Gait capacity | A person’s ability to walk in a controlled and safe environment. It reflects what someone can do (in this study during formal gait therapy). |
|
| Gait performance | A person’s actual execution of walking activity in an uncontrolled and unsupervised environment. It reflects what someone actually does (in this study, beyond therapy time). | See qualifiers (below) |
| Walking activity | A qualifier of gait performance: a person’s actual walking activities expressed per hour, based on gait bouts (continuous periods of walking). |
|
| Spontaneous gait characteristics | A qualifier of gait performance: a person’s actual gait speed and stride length during bouts of spontaneous walking activity. |
|
| Disease | Sex (M/F) | Age (Years) | Affected Hemisphere (L/R) | FAC Score (0–5) | AIS Score | Lesion Level | |
|---|---|---|---|---|---|---|---|
| Stroke (n = 11) | 1 | F | 77 | R | 2 | - | - |
| 2 | M | 58 | L | 5 | - | - | |
| 3 | F | 79 | L | 4 | - | - | |
| 4 | M | 50 | R | 5 | - | - | |
| 5 | F | 73 | R | 4 | - | - | |
| 6 | F | 66 | L | 4 | - | - | |
| 7 | M | 67 | L | 4 | - | - | |
| 8 | F | 81 | L | 4 | - | - | |
| 9 | M | 74 | R | 2 | - | - | |
| 10 | M | 63 | R | 3 | - | - | |
| 11 | M | 66 | L | 4 | - | - | |
| iSCI (n = 11) | 12 | M | 48 | - | - | C | C3 |
| 13 | M | 53 | - | - | D | L3 | |
| 14 | M | 76 | - | - | D | T11 | |
| 15 | M | 80 | - | - | D | L2 | |
| 16 | M | 78 | - | - | D | T3 | |
| 17 | M | 38 | - | - | D | C4 | |
| 18 | F | 63 | - | - | D | T4 | |
| 19 | F | 62 | - | - | D | T9 | |
| 20 | M | 68 | - | - | D | C4 | |
| 21 | F | 55 | - | - | D | T11 | |
| 22 | M | 68 | - | - | D | C2 |
| Walking Activity (bouts > 2 Steps) | Median (Range) |
|---|---|
| Steps/hour | 177 (0–689) |
| Bouts/hour | 7 (0–17) |
| Distance covered/hour (m) | 75 (0–482) |
| Walking time/hour (s) | 169 (0–505) |
| Steps/bout | 28 (0–58) |
| Maximum steps/bout | 280 (0–2165) |
| Distance covered/bout (m) | 13 (0–34) |
| Maximum distance covered/bout (m) | 137 (0–2169) |
| Walking time/bout (s) | 24 (0–37) |
| Maximum walking time/bout (s) | 205 (0–923) |
| Spontaneous gait characteristics (bouts 10–100 steps) | Mean (SD) |
| Average spontaneous gait speed (m/s) | 0.51 ± 0.16 |
| Maximum spontaneous gait speed (m/s) | 0.78 ± 0.27 |
| Average spontaneous stride length (m) | 0.92 ± 0.18 |
| Maximum spontaneous stride length (m) | 1.04 ± 0.23 |
Publisher’s Note: MDPI stays neutral with regard to jurisdictional claims in published maps and institutional affiliations. |
© 2022 by the authors. Licensee MDPI, Basel, Switzerland. This article is an open access article distributed under the terms and conditions of the Creative Commons Attribution (CC BY) license (https://creativecommons.org/licenses/by/4.0/).
Share and Cite
Hendriks, M.M.S.; Vos-van der Hulst, M.; Weijs, R.W.J.; van Lotringen, J.H.; Geurts, A.C.H.; Keijsers, N.L.W. Using Sensor Technology to Measure Gait Capacity and Gait Performance in Rehabilitation Inpatients with Neurological Disorders. Sensors 2022, 22, 8387. https://doi.org/10.3390/s22218387
Hendriks MMS, Vos-van der Hulst M, Weijs RWJ, van Lotringen JH, Geurts ACH, Keijsers NLW. Using Sensor Technology to Measure Gait Capacity and Gait Performance in Rehabilitation Inpatients with Neurological Disorders. Sensors. 2022; 22(21):8387. https://doi.org/10.3390/s22218387
Chicago/Turabian StyleHendriks, Maartje M. S., Marije Vos-van der Hulst, Ralf W. J. Weijs, Jaap H. van Lotringen, Alexander C. H. Geurts, and Noel L. W. Keijsers. 2022. "Using Sensor Technology to Measure Gait Capacity and Gait Performance in Rehabilitation Inpatients with Neurological Disorders" Sensors 22, no. 21: 8387. https://doi.org/10.3390/s22218387
APA StyleHendriks, M. M. S., Vos-van der Hulst, M., Weijs, R. W. J., van Lotringen, J. H., Geurts, A. C. H., & Keijsers, N. L. W. (2022). Using Sensor Technology to Measure Gait Capacity and Gait Performance in Rehabilitation Inpatients with Neurological Disorders. Sensors, 22(21), 8387. https://doi.org/10.3390/s22218387