
IoT Device Identification Using Directional Packet Length Sequences and 1D-CNN
Abstract
1. Introduction
- We propose a new feature extraction technique based on the directions and lengths of the packets in network traces which is fundamentally different from other IoT device identification methods. This may provide different insights compared to other feature extraction techniques used in this field.
- Based on an evaluation of experimental results, our method performs better than previous work in terms of classification precision, recall, and F-1 score.
2. Background and Related Work
2.1. IoT Device Identification
2.2. Deep Learning
3. Methodology
3.1. System Overview
3.2. Data Preprocessing
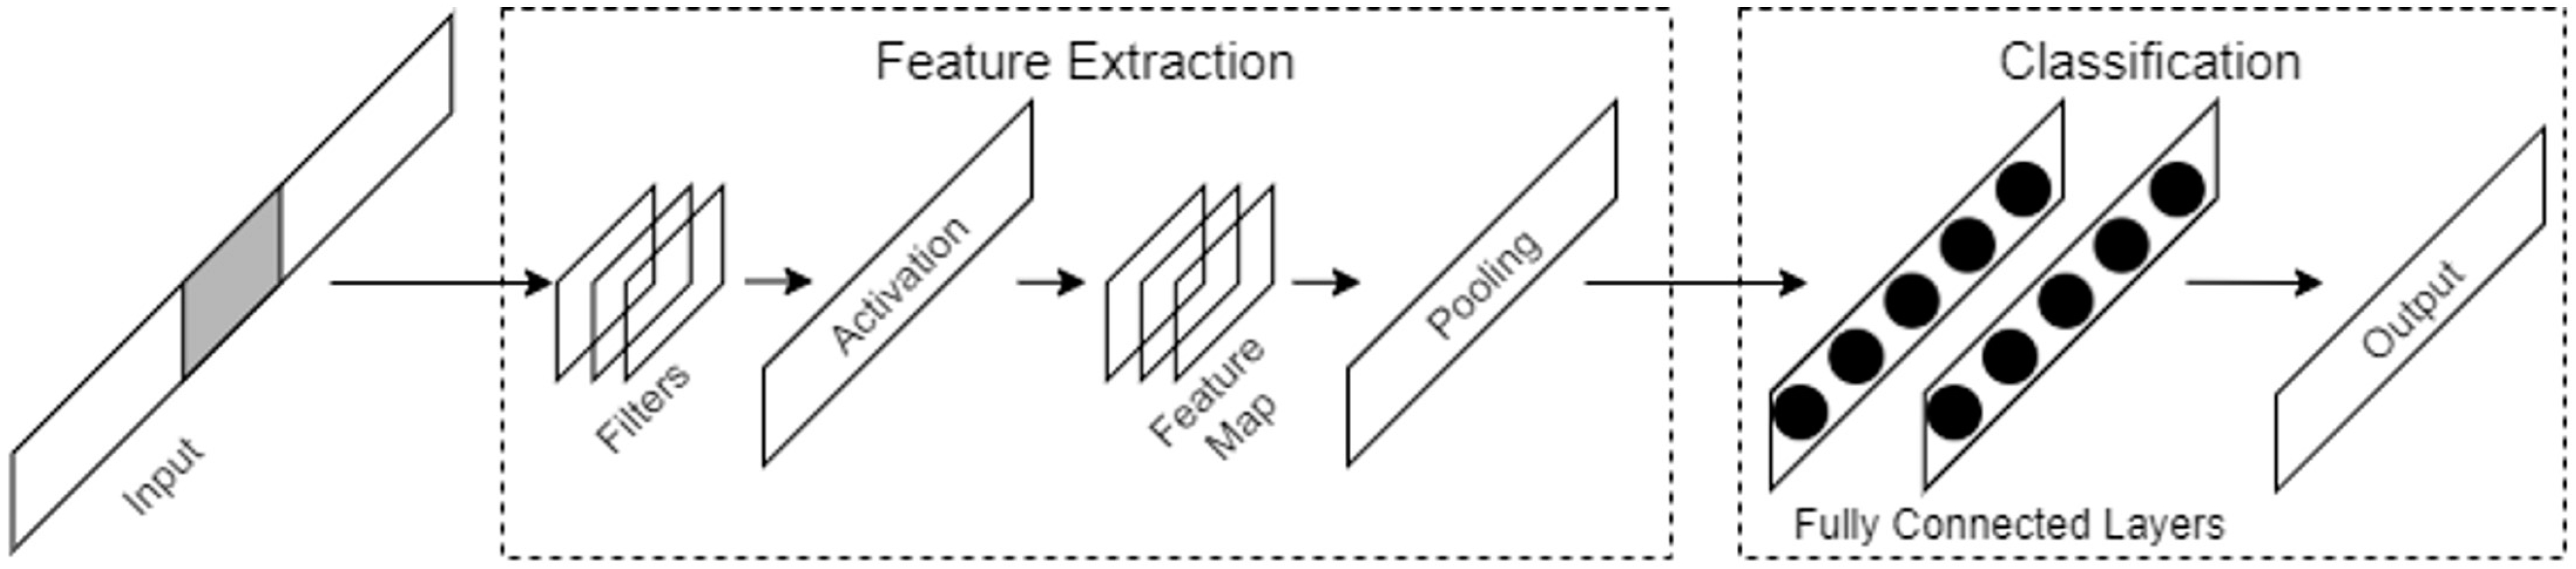
3.3. Convolutional Neural Networks
3.4. CNN Hyperparameter Tuning
4. Experimental Evaluation
4.1. Experimental Setup and Datasets
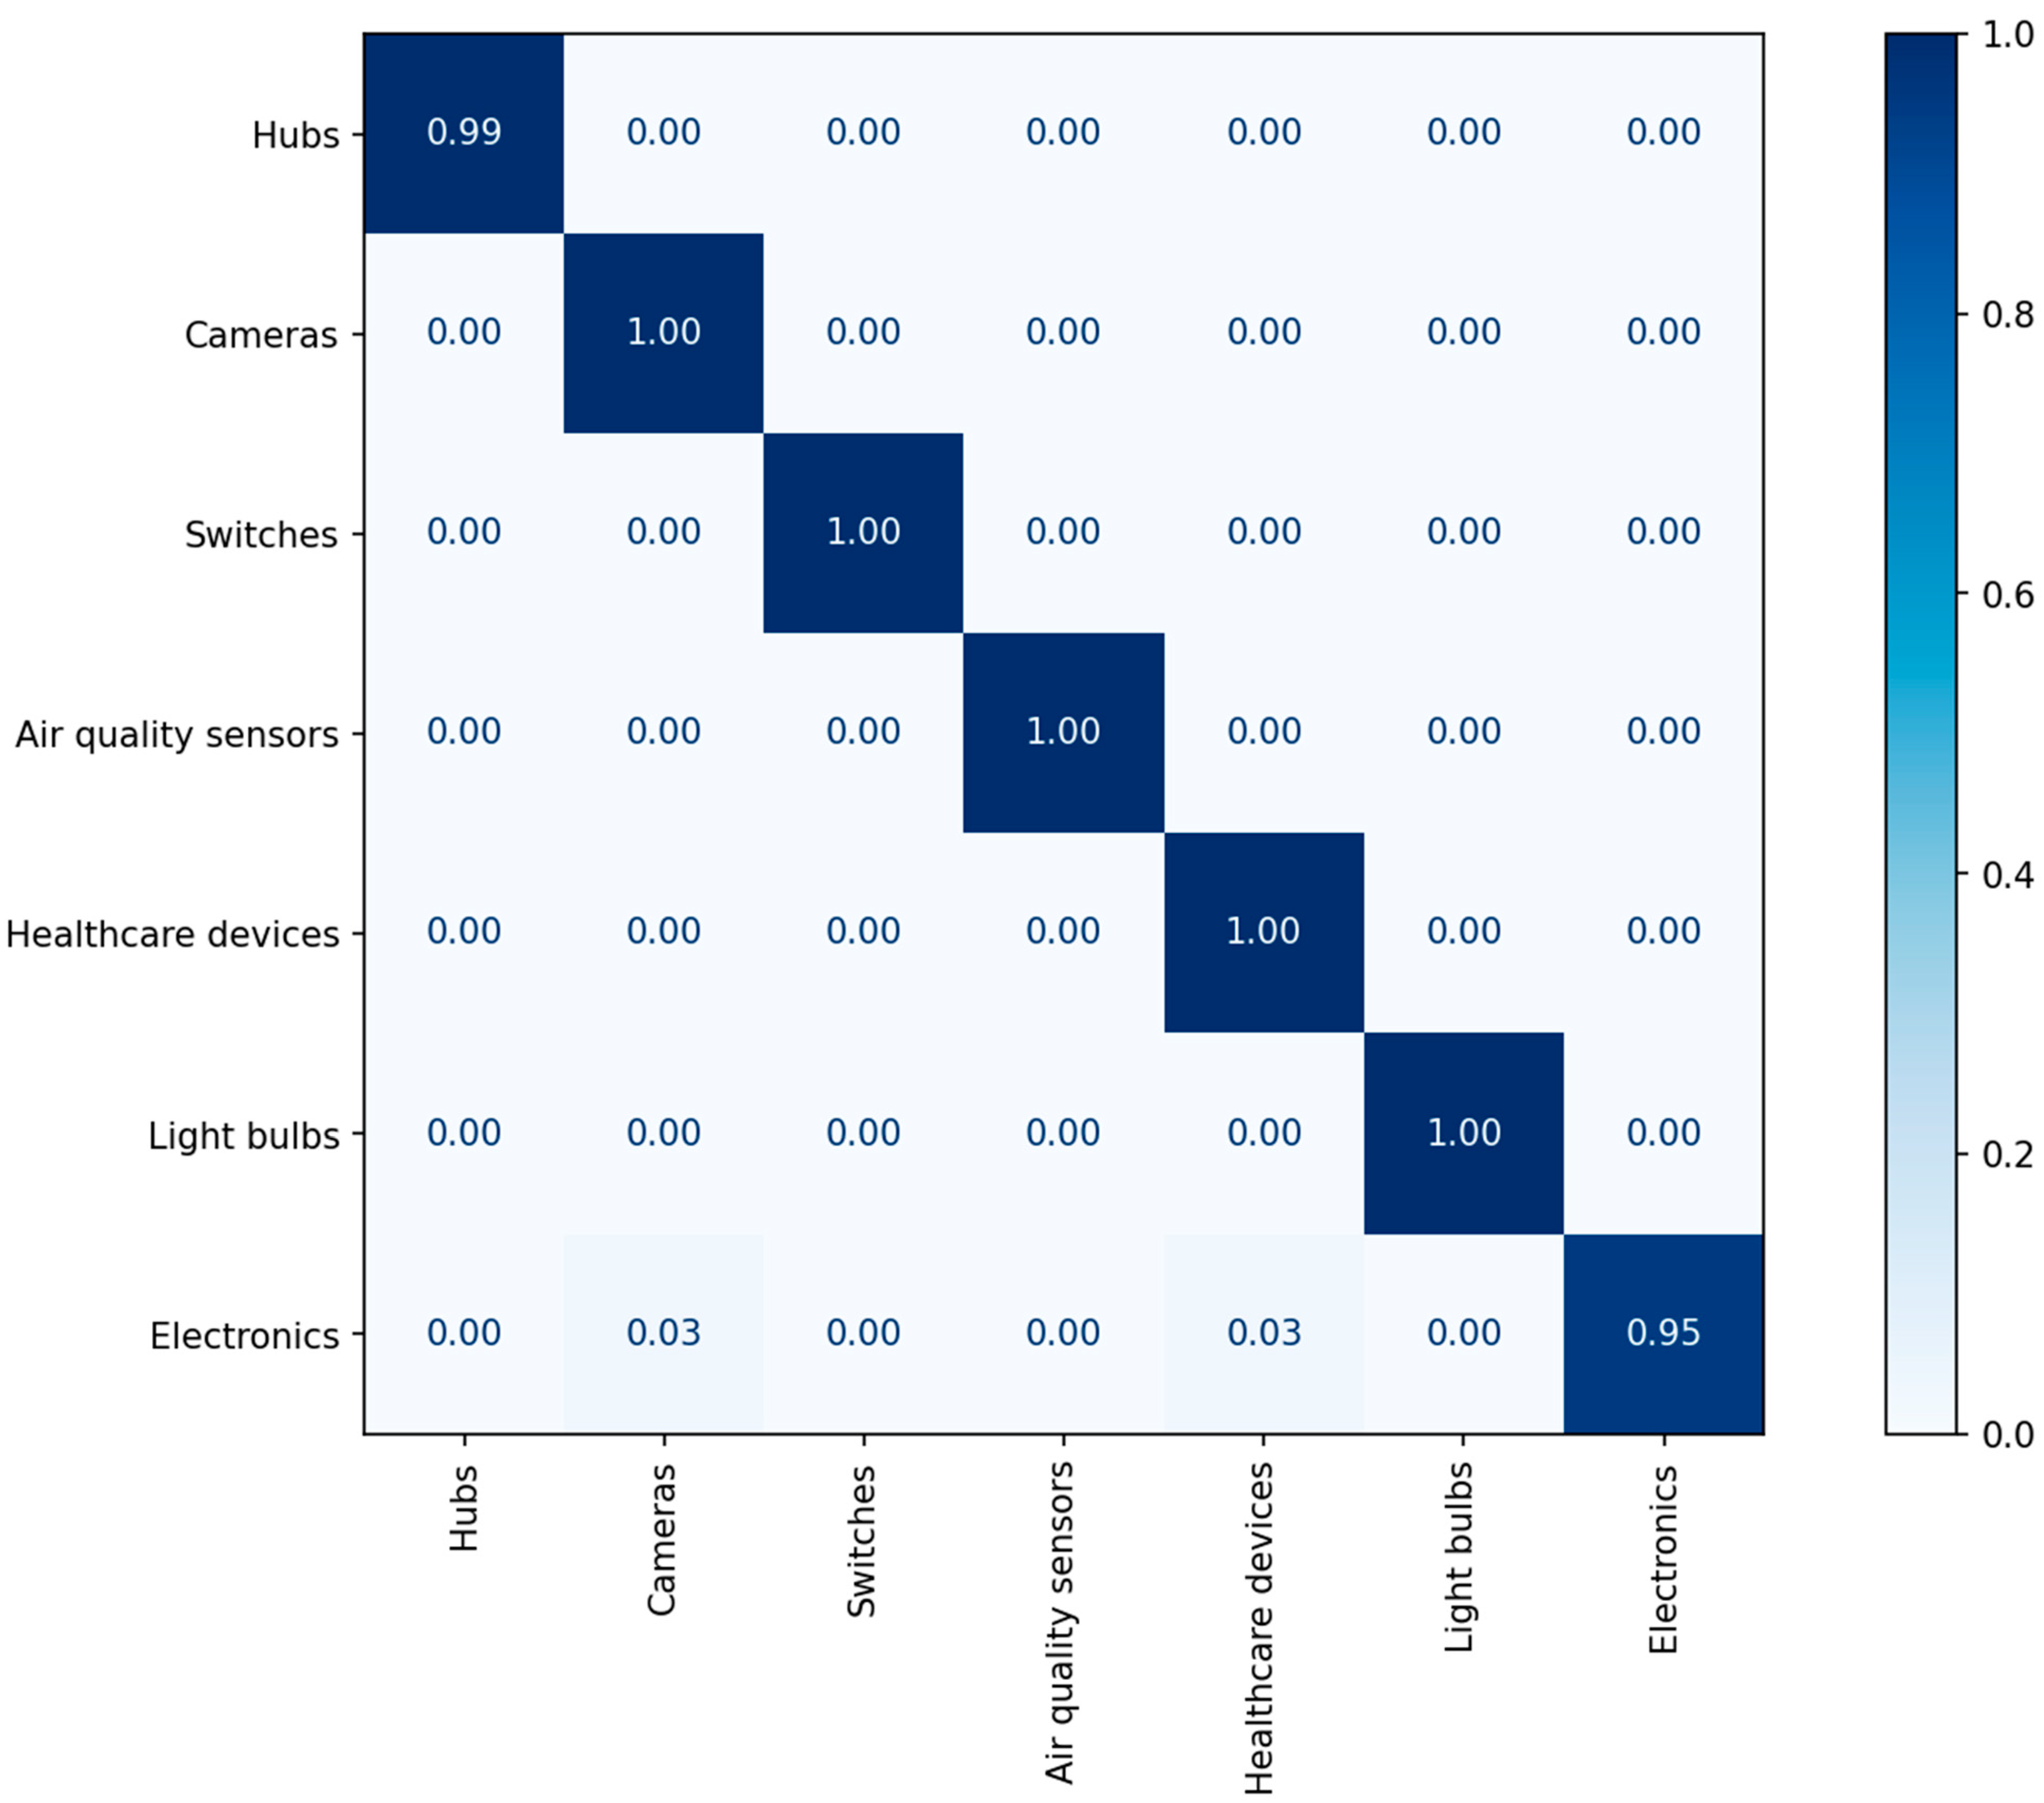
4.2. Device Category Identification
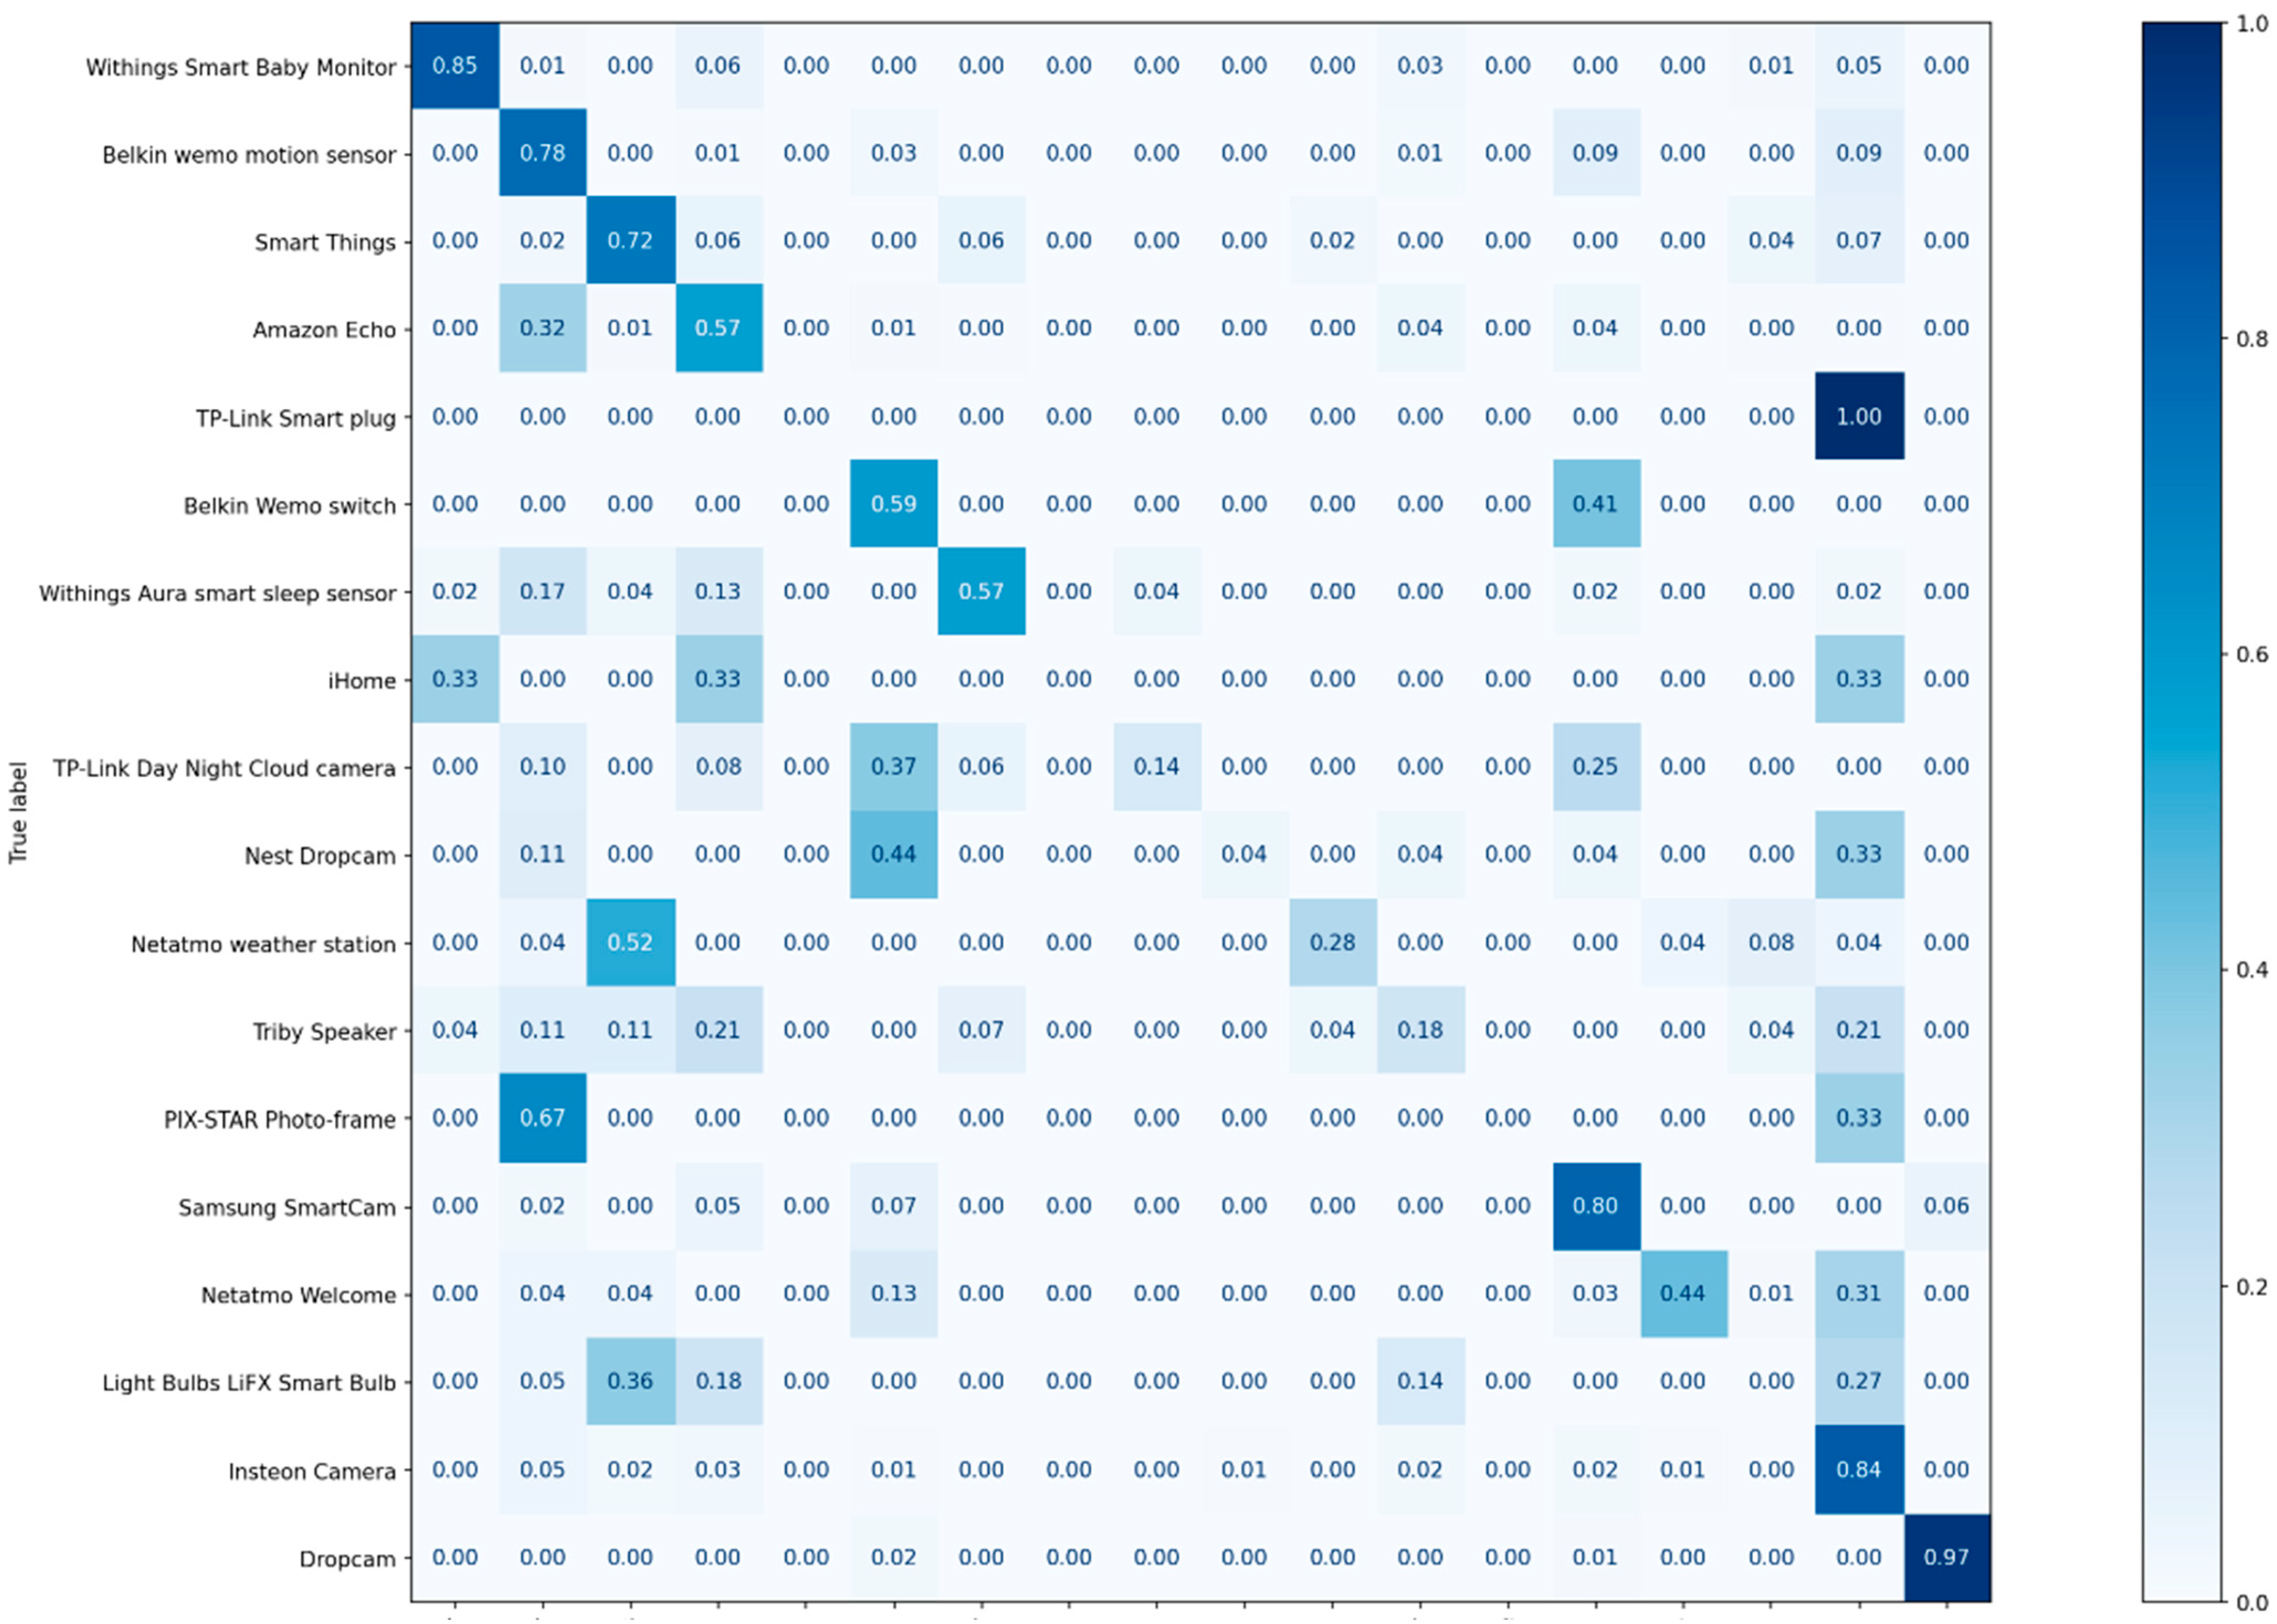
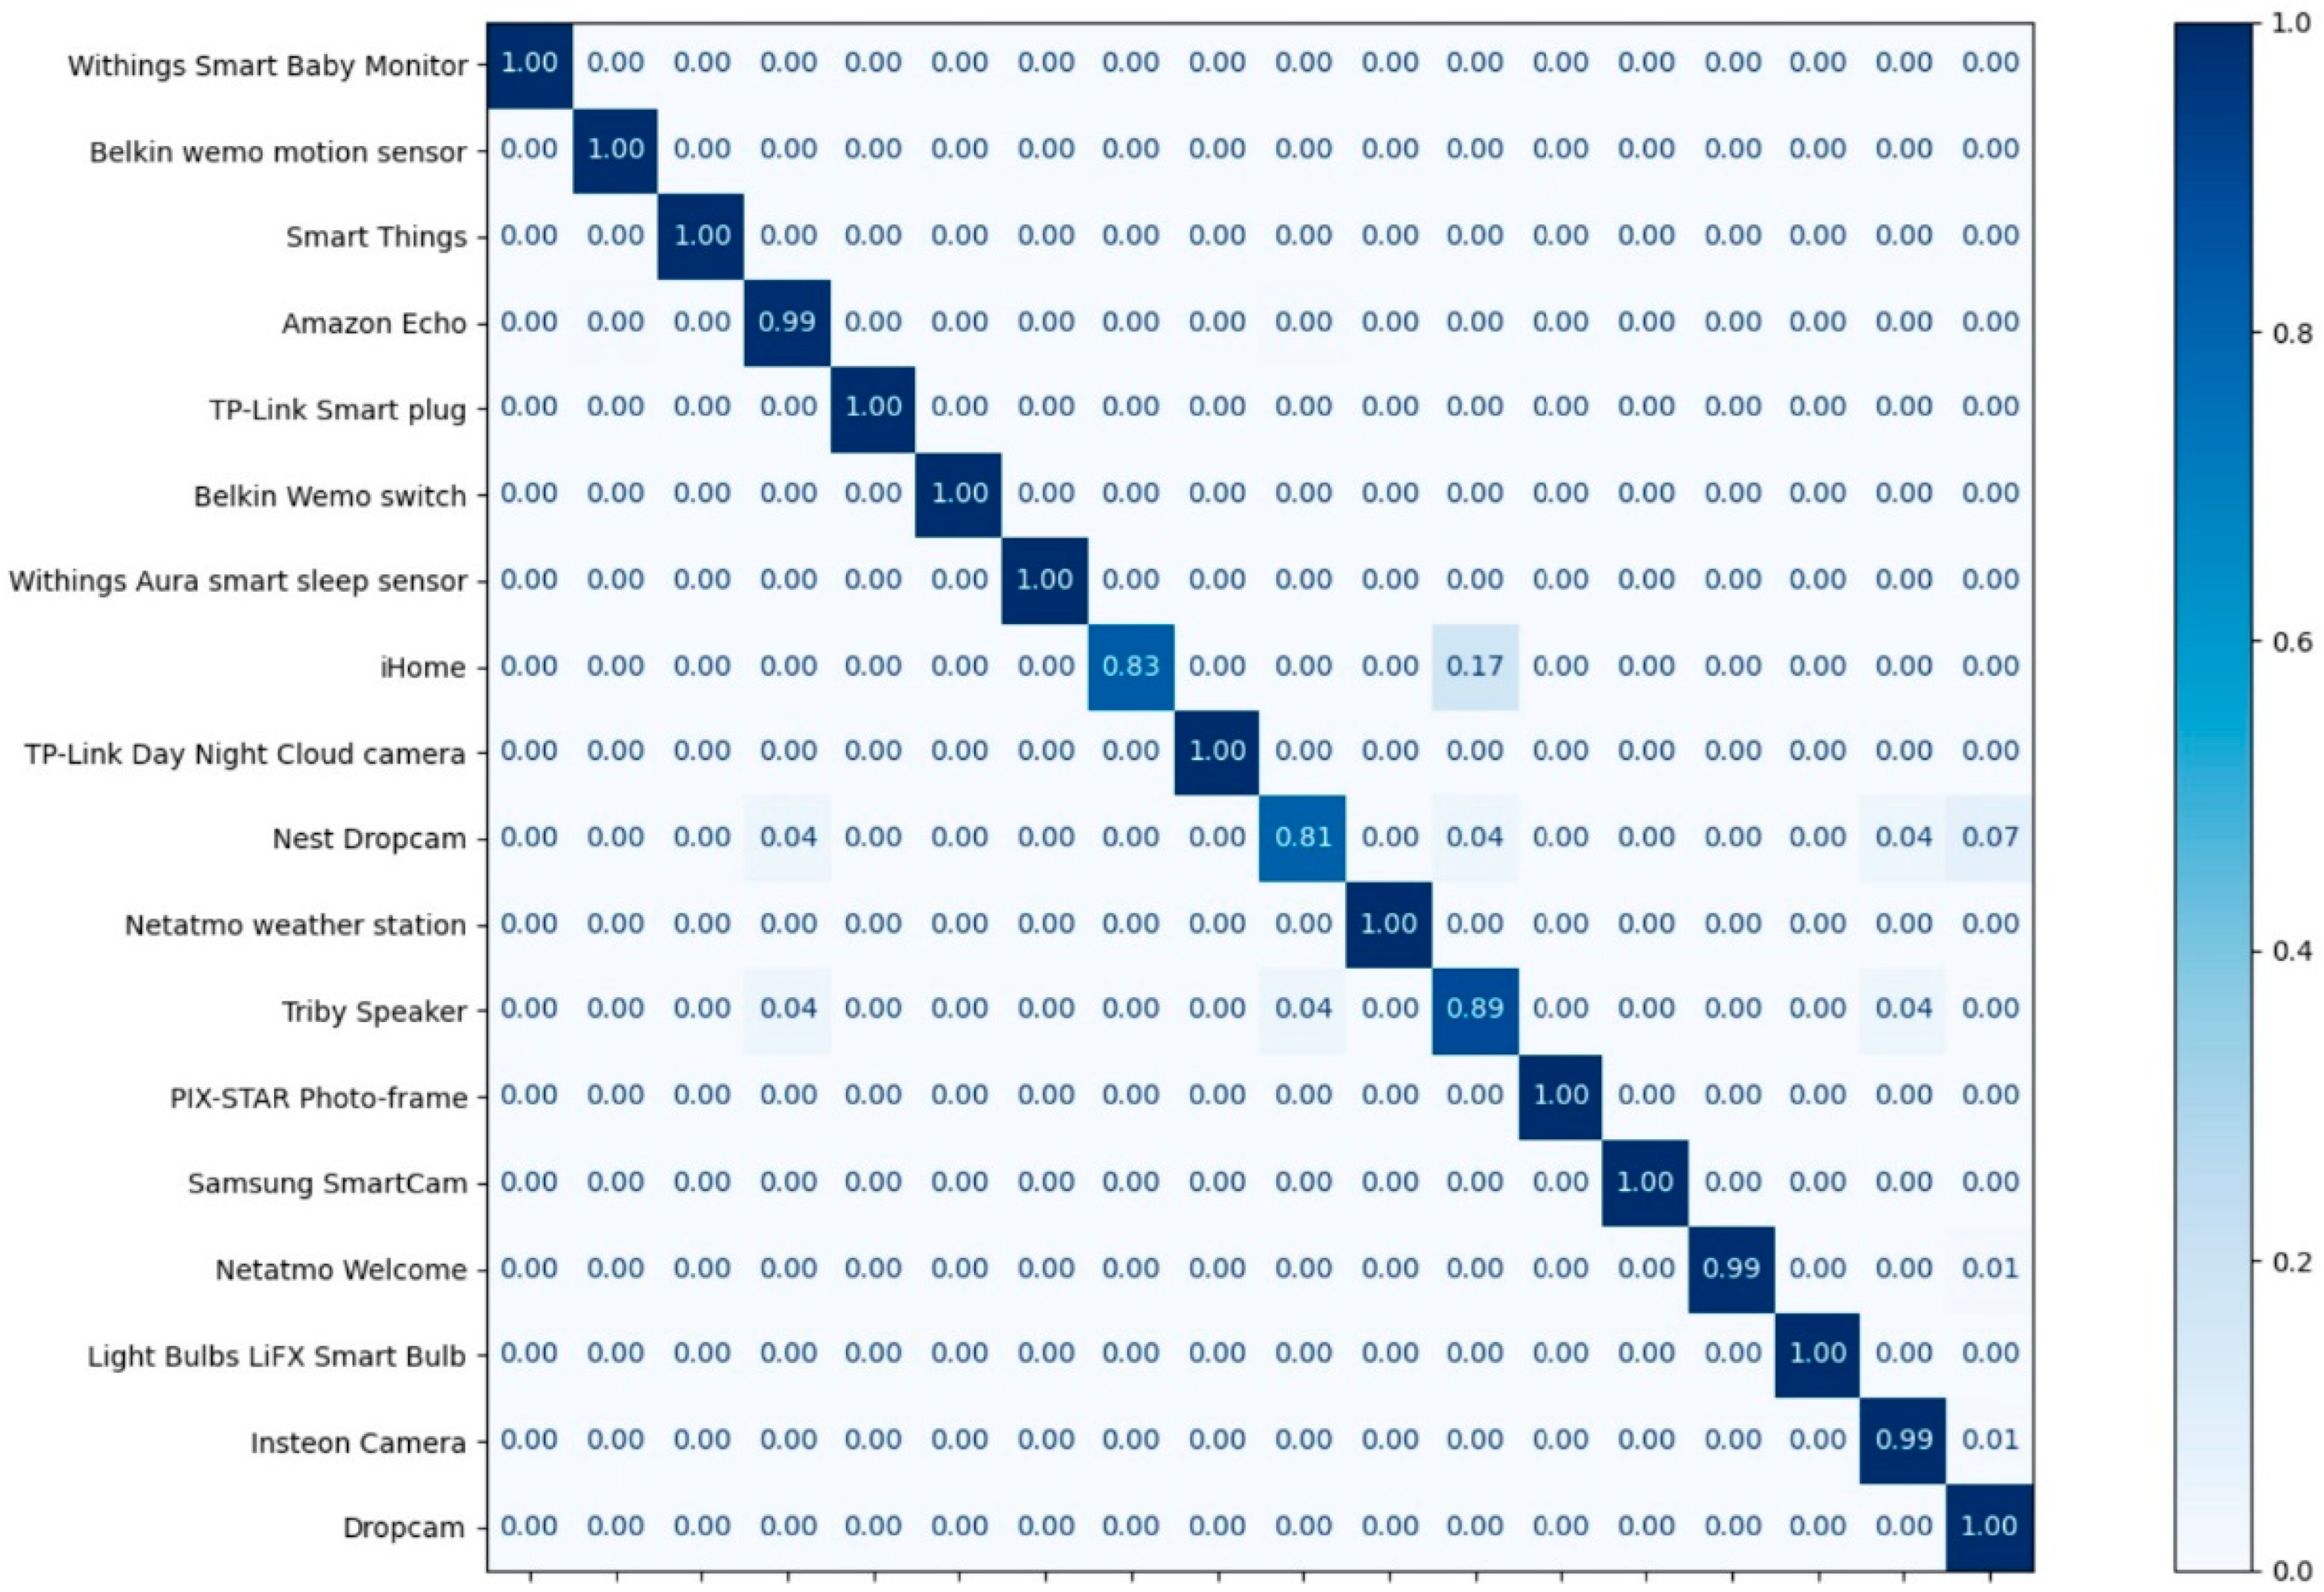
4.3. Device Model Identification
5. Discussion and Limitation
6. Conclusions
Author Contributions
Funding
Institutional Review Board Statement
Informed Consent Statement
Data Availability Statement
Conflicts of Interest
References
- Internet of Things (IoT) Connected Devices Installed Base Worldwide from 2015 to 2025. Available online: https://www.statista.com/statistics/471264/iot-number-of-connected-devices-worldwide/ (accessed on 10 October 2022).
- Chaabouni, N.; Mosbah, M.; Zemmari, A.; Sauvignac, C.; Faruki, P. Network Intrusion Detection for IoT Security Based on Learning Techniques. IEEE Commun. Surv. Tutor. 2019, 21, 2671–2701. [Google Scholar] [CrossRef]
- Hussain, F.; Hussain, R.; Hassan, S.A.; Hossain, E. Machine Learning in IoT Security: Current Solutions and Future Challenges. IEEE Commun. Surv. Tutor. 2020, 22, 1686–1721. [Google Scholar] [CrossRef]
- Zarpelão, B.B.; Miani, R.S.; Kawakani, C.T.; de Alvarenga, S.C. A survey of intrusion detection in Internet of Things. J. Netw. Comput. Appl. 2017, 84, 25–37. [Google Scholar] [CrossRef]
- Tekler, Z.D.; Low, R.; Yuen, C.; Blessing, L. Plug-Mate: An IoT-based occupancy-driven plug load management system in smart buildings. Build. Environ. 2022, 223, 109472. [Google Scholar] [CrossRef]
- Wang, D.; Wang, H.; Fu, Y. Blockchain-based IoT device identification and management in 5G smart grid. EURASIP J. Wirel. Commun. Netw. 2021, 2021, 1–19. [Google Scholar] [CrossRef]
- Hamdi, M.; Messaoud, H.; Bouguila, N. A new approach of electrical appliance identification in residential buildings. Electr. Power Syst. Res. 2020, 178, 106037. [Google Scholar] [CrossRef]
- Salman, O.; Elhajj, I.H.; Chehab, A.; Kayssi, A. A machine learning based framework for IoT device identification and abnormal traffic detection. Trans. Emerg. Telecommun. Technol. 2022, 33, e3743. [Google Scholar] [CrossRef]
- Miettinen, M.; Marchal, S.; Hafeez, I.; Asokan, N.; Sadeghi, A.-R.; Tarkoma, S. IoT SENTINEL: Automated Device-Type Identification for Security Enforcement in IoT. In Proceedings of the 2017 IEEE 37th International Conference on Distributed Computing Systems (ICDCS), Atlanta, GA, USA, 5–8 June 2017; pp. 2177–2184. [Google Scholar]
- Bezawada, B.; Bachani, M.; Peterson, J.; Shirazi, H.; Ray, I.; Ray, I. Iotsense: Behavioral fingerprinting of iot devices. arXiv 2018, arXiv:1804.03852. [Google Scholar]
- Kostas, K.; Just, M.; Lones, M.A. IoTDevID: A Behaviour-Based Fingerprinting Method for Device Identification in the IoT. arXiv 2021, arXiv:2102.08866. [Google Scholar]
- Shahid, M.R.; Blanc, G.; Zhang, Z.; Debar, H. IoT devices recognition through network traffic analysis. In Proceedings of the 2018 IEEE International Conference on Big Data (Big Data), Seattle, WA, USA, 10–13 December 2018; pp. 5187–5192. [Google Scholar]
- Thangavelu, V.; Divakaran, D.M.; Sairam, R.; Bhunia, S.S.; Gurusamy, M. DEFT: A distributed IoT fingerprinting technique. IEEE Internet Things J. 2018, 6, 940–952. [Google Scholar] [CrossRef]
- Oser, P.; Kargl, F.; Lüders, S. Identifying devices of the internet of things using machine learning on clock characteristics. In Proceedings of the International Conference on Security, Privacy and Anonymity in Computation, Communication and Storage, Melbourne, NSW, Australia, 11–13 December 2018; pp. 417–427. [Google Scholar]
- Selis, V.; Marshall, A. A classification-based algorithm to detect forged embedded machines in IoT environments. IEEE Syst. J. 2018, 13, 389–399. [Google Scholar] [CrossRef]
- Sivanathan, A.; Gharakheili, H.H.; Loi, F.; Radford, A.; Wijenayake, C.; Vishwanath, A.; Sivaraman, V. Classifying IoT devices in smart environments using network traffic characteristics. IEEE Trans. Mob. Comput. 2018, 18, 1745–1759. [Google Scholar] [CrossRef]
- Msadek, N.; Soua, R.; Engel, T. Iot device fingerprinting: Machine learning based encrypted traffic analysis. In Proceedings of the 2019 IEEE Wireless Communications and Networking Conference (WCNC), Marrakech, Morocco, 15–19 April 2019; pp. 1–8. [Google Scholar]
- Sivanathan, A.; Sherratt, D.; Gharakheili, H.H.; Radford, A.; Wijenayake, C.; Vishwanath, A.; Sivaraman, V. Characterizing and classifying IoT traffic in smart cities and campuses. In Proceedings of the 2017 IEEE Conference on Computer Communications Workshops (INFOCOM WKSHPS), Atlanta, GA, USA, 1–4 May 2017; pp. 559–564. [Google Scholar]
- Marchal, S.; Miettinen, M.; Nguyen, T.D.; Sadeghi, A.-R.; Asokan, N. Audi: Toward autonomous iot device-type identification using periodic communication. IEEE J. Sel. Areas Commun. 2019, 37, 1402–1412. [Google Scholar] [CrossRef]
- Pinheiro, A.J.; de M. Bezerra, J.; Burgardt, C.A.P.; Campelo, D.R. Identifying IoT devices and events based on packet length from encrypted traffic. Comput. Commun. 2019, 144, 8–17. [Google Scholar] [CrossRef]
- Tekler, Z.D.; Low, R.; Zhou, Y.; Yuen, C.; Blessing, L.; Spanos, C. Near-real-time plug load identification using low-frequency power data in office spaces: Experiments and applications. Appl. Energy 2020, 275, 115391. [Google Scholar] [CrossRef]
- Duan, C.; Gao, H.; Song, G.; Yang, J.; Wang, Z. ByteIoT: A Practical IoT Device Identification System based on Packet Length Distribution. IEEE Trans. Netw. Serv. Manag. 2021, 19, 1. [Google Scholar] [CrossRef]
- Meidan, Y.; Bohadana, M.; Shabtai, A.; Guarnizo, J.D.; Ochoa, M.; Tippenhauer, N.O.; Elovici, Y. ProfilIoT: A Machine Learning Approach for IoT Device Identification Based on Network Traffic Analysis. In Proceedings of the Proceedings of the Symposium on Applied Computing, Marrakech, Morocco, 3–7 April 2017; pp. 506–509. [Google Scholar]
- Yin, F.; Yang, L.; Wang, Y.; Dai, J. IoT ETEI: End-to-End IoT Device Identification Method. In Proceedings of the 2021 IEEE Conference on Dependable and Secure Computing (DSC), Aizuwakamatsu, Fukushima, Japan, 30 January–2 February 2021; pp. 1–8. [Google Scholar]
- Perdisci, R.; Papastergiou, T.; Alrawi, O.; Antonakakis, M. Iotfinder: Efficient large-scale identification of iot devices via passive dns traffic analysis. In Proceedings of the 2020 IEEE European Symposium on Security and Privacy (EuroS&P), Genoa, Italy, 7–11 September 2020; pp. 474–489. [Google Scholar]
- OConnor, T.; Mohamed, R.; Miettinen, M.; Enck, W.; Reaves, B.; Sadeghi, A.-R. HomeSnitch: Behavior transparency and control for smart home IoT devices. In Proceedings of the Proceedings of the 12th Conference on Security and Privacy in Wireless and Mobile Networks, Miami, FL, USA, 15–17 May 2019; pp. 128–138. [Google Scholar]
- Terrell, J.; Jeffay, K.; Smith, F.D.; Gogan, J.; Keller, J. Passive, streaming inference of TCP connection structure for network server management. In Proceedings of the International Workshop on Traffic Monitoring and Analysis, Aachen, Germany, 11 May 2009; pp. 42–53. [Google Scholar]
- Alrawi, O.; Lever, C.; Antonakakis, M.; Monrose, F. Sok: Security evaluation of home-based iot deployments. In Proceedings of the 2019 IEEE Symposium on Security and Privacy (sp), San Francisco, CA, USA, 19–23 May 2019; pp. 1362–1380. [Google Scholar]
- Trimananda, R.; Varmarken, J.; Markopoulou, A.; Demsky, B. Packet-level signatures for smart home devices. In Proceedings of the Network and Distributed Systems Security (NDSS) Symposium, San Diego, CA, USA, 23–26 February 2020. [Google Scholar]
- Hafeez, I.; Antikainen, M.; Ding, A.Y.; Tarkoma, S. IoT-KEEPER: Detecting malicious IoT network activity using online traffic analysis at the edge. IEEE Trans. Netw. Serv. Manag. 2020, 17, 45–59. [Google Scholar] [CrossRef]
- Ortiz, J.; Crawford, C.; Le, F. DeviceMien: Network device behavior modeling for identifying unknown IoT devices. In Proceedings of the Proceedings of the International Conference on Internet of Things Design and Implementation, Montreal, QC, Canada, 15–18 April 2019; pp. 106–117. [Google Scholar]
- LeCun, Y.; Bengio, Y.; Hinton, G. Deep learning. Nature 2015, 521, 436–444. [Google Scholar] [CrossRef]
- Schmidhuber, J. Deep learning in neural networks: An overview. Neural Netw. 2015, 61, 85–117. [Google Scholar] [CrossRef]
- Rezaei, S.; Liu, X. Deep Learning for Encrypted Traffic Classification: An Overview. IEEE Commun. Mag. 2019, 57, 76–81. [Google Scholar] [CrossRef]
- Rezaei, S.; Liu, X. How to achieve high classification accuracy with just a few labels: A semi-supervised approach using sampled packets. arXiv 2018, arXiv:1812.09761. [Google Scholar]
- Gunasekaran, H.; Ramalakshmi, K.; Arokiaraj, A.R.M.; Kanmani, S.; Venkatesan, C.; Dhas, C.S.G. Analysis of DNA Sequence Classification Using CNN and Hybrid Models. Comput. Math. Methods Med. 2021, 2021, 1835056. [Google Scholar] [CrossRef] [PubMed]
- Li, F.; Liu, M.; Zhao, Y.; Kong, L.; Dong, L.; Liu, X.; Hui, M. Feature extraction and classification of heart sound using 1D convolutional neural networks. EURASIP J. Adv. Signal Process. 2019, 2019, 1–11. [Google Scholar] [CrossRef]


| Work | Year | Algorithms | Features | Dataset | Classes | Results |
|---|---|---|---|---|---|---|
| [9] | 2017 | RF | Packet header-based | [9] | Device Type | 81.5% for 27 devices, 95% for 17 of them. |
| [10] | 2018 | Gradient boosting, kNN, DT | Header payload statistics | Private | Device Type | 99% overall acc. 86–99% TPR |
| [12] | 2018 | t-SNE, RF | Flow statistics | Private | Device Type | 99.9% acc. for 4 types |
| [13] | 2018 | k-means, RF | IoT protocol flow statistics | Private | Device Type | 97% acc. 97% F1-score |
| [14] | 2018 | RF, SVM, MLP | Clock skew and timestamp features | Private | Device Model | 97.03% precision, 94.6% recall, 99.76% acc. for 51 devices |
| [15] | 2018 | RF | Ping timestamp | Private | Real/Virtual Device | 99.5% accuracy using 25 pings and 99.9% over 200 pings. |
| [16] | 2019 | RF | Flow/Packet statistics | [16] | Device Model | 99.88% acc., 5.06% RRSE |
| [17] | 2019 | AdaBoost | Encrypted flow statistics | [18] | Device Model | 95.5% acc. and F1-score |
| [19] | 2019 | Clustering + k-NN | Flow periods (DFT) | Private | Device Type | F1-score above 90% for 21/23% labels and 98.2% overall acc. |
| [20] | 2019 | RF | Packet length statistics | [18] | Device Model | 96% overall acc. |
| [21] | 2020 | k-NN, RF, GB, Bagging | low frequency data | [21] | Device Type | accuracies up to 93% in online setting |
| [22] | 2021 | k-NN | Frequency distribution of packet lengths | [16] | Device Model | Over 99% acc. |
| [11] | 2021 | RF | Header payload statistics | [9,18] | Device Model | 94–99% acc. using different aggregated packets |
| Hyperparameters | Search Space | Final |
| Input Dimension | [100, 1000] | 500 |
| Optimizer | Adam, Adamax | Adam |
| Learning Rate | [0.0009, 0.01] | 0.001 |
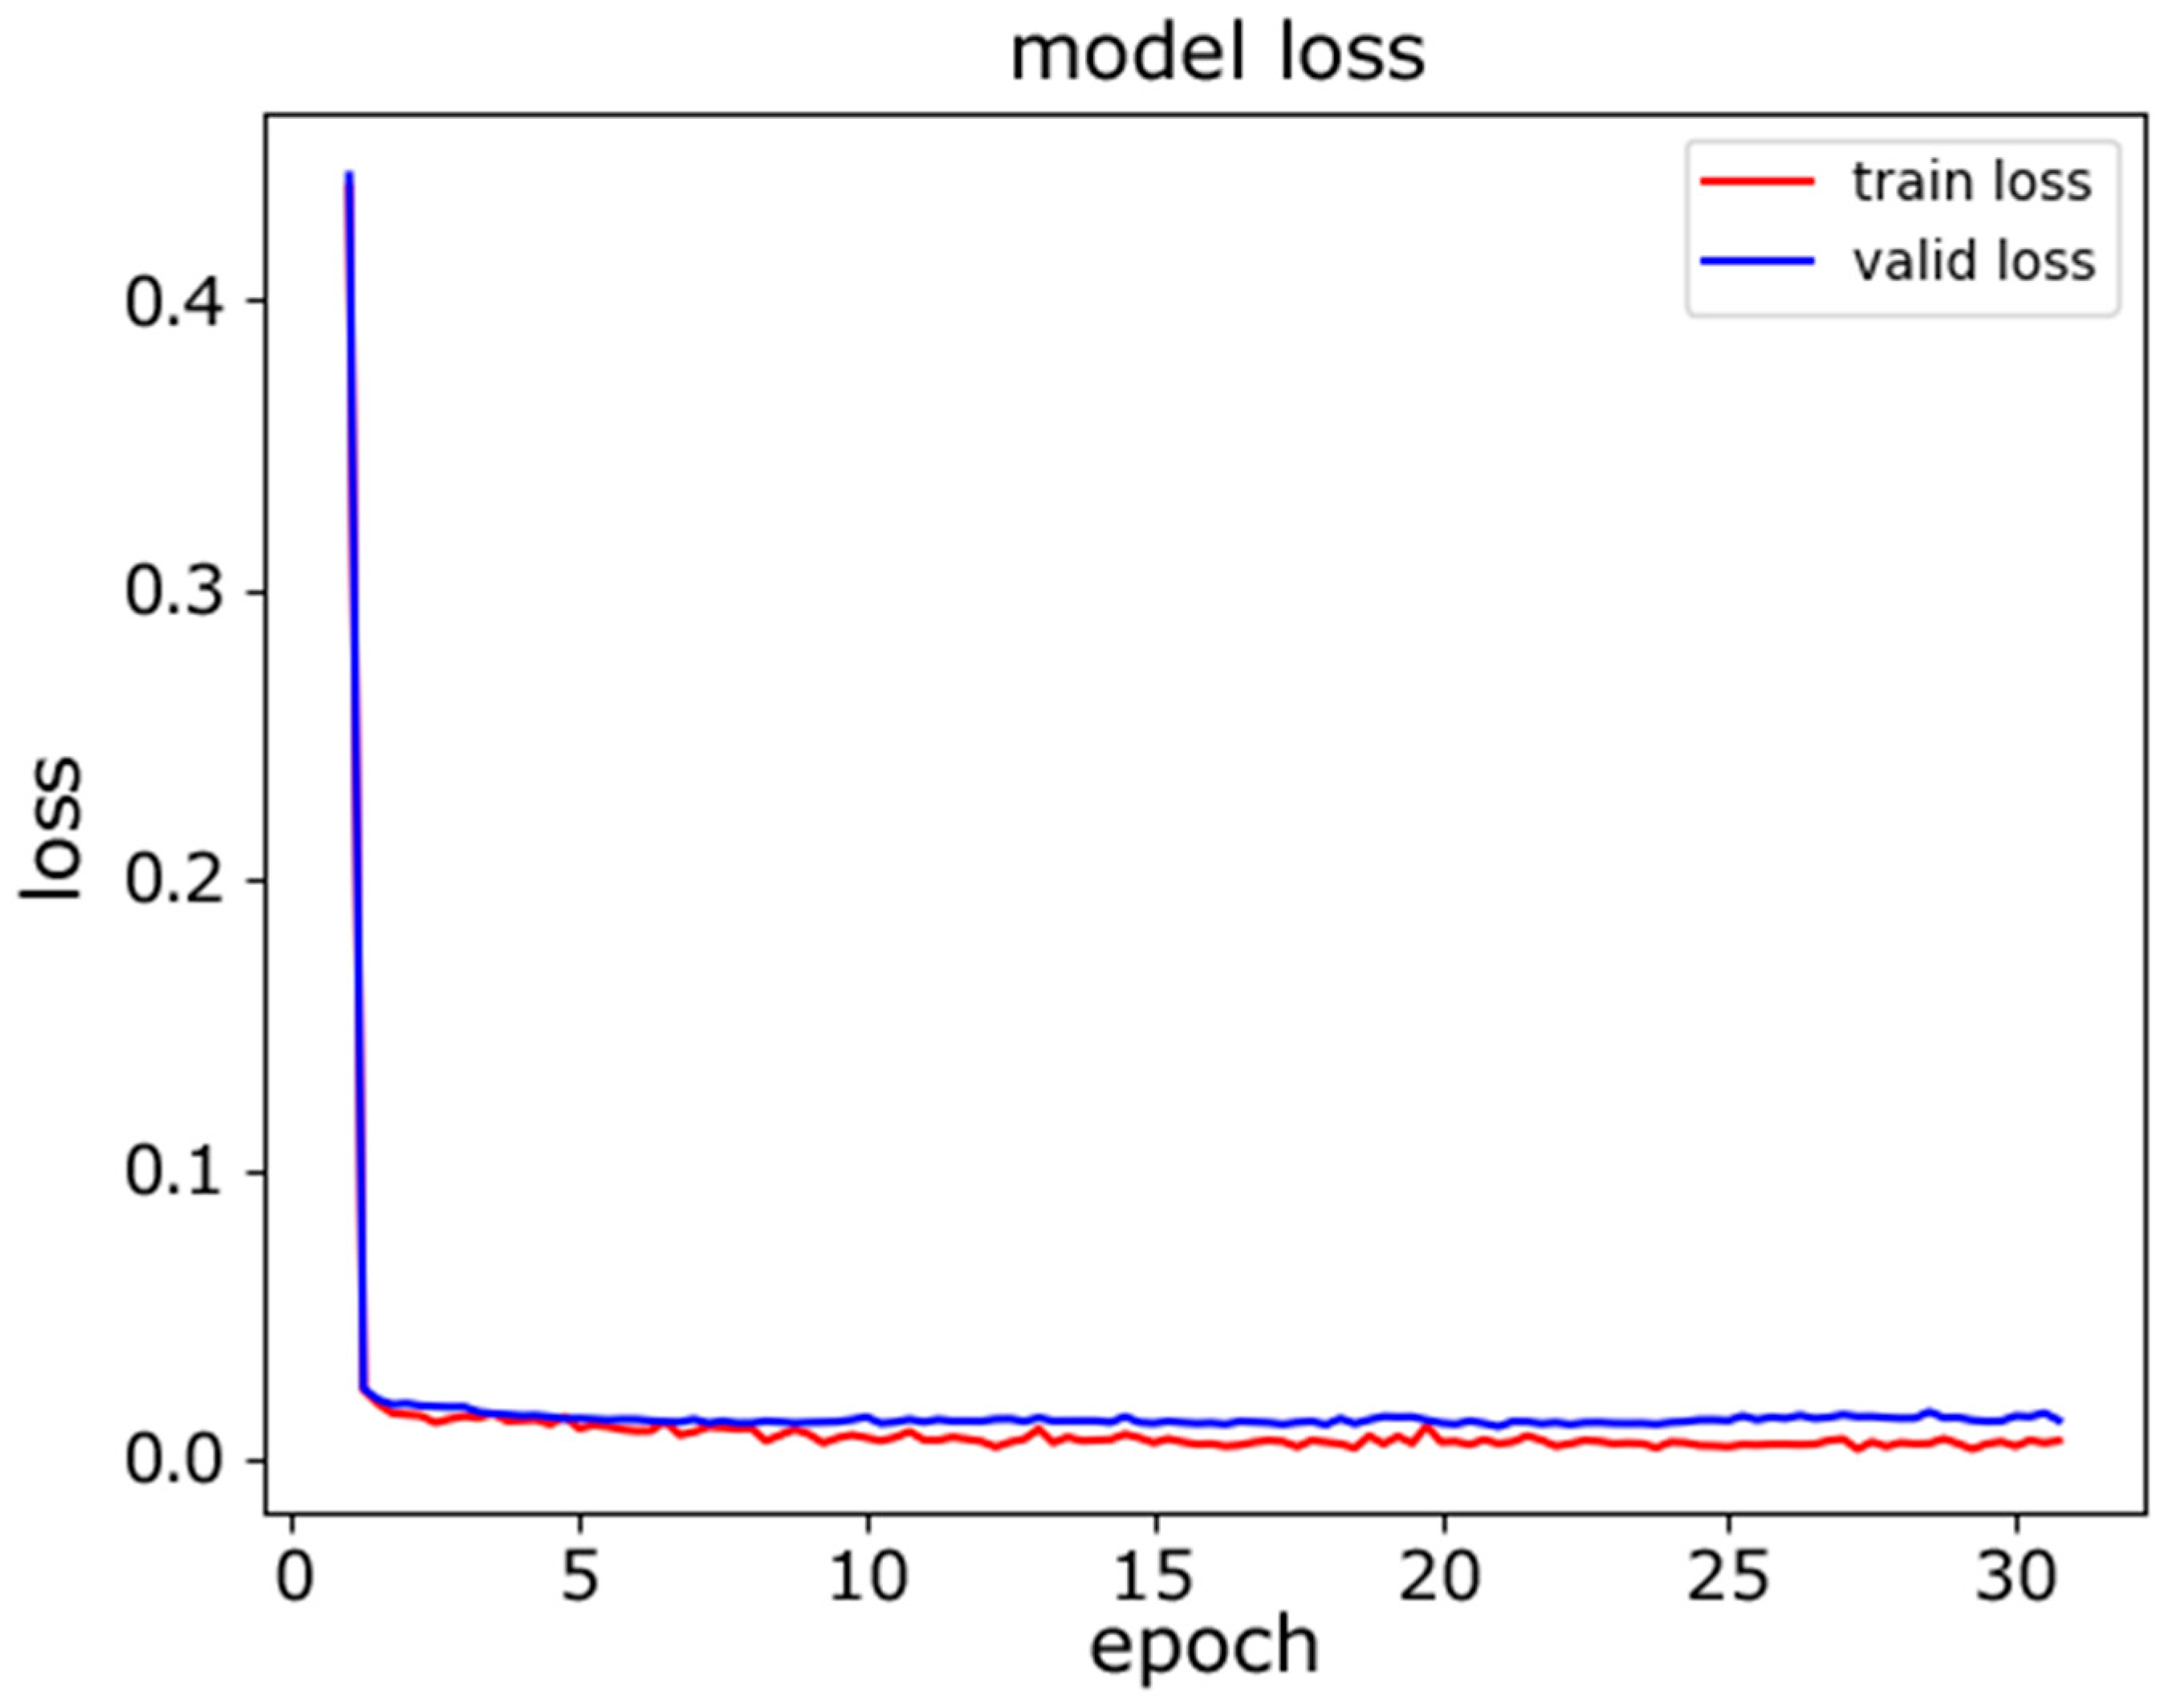
| Training Epochs | [10, 50] | 30 |
| Batch Size | [16, 256] | 100 |
| [Filter, Pool, Stride] Sizes | [2, 16] | [8, 8, 4] |
| Activation Function | Tanh, ReLU, ELU | ELU |
| Number of Filters | ||
| Block 1 [Conv1, Conv2] | [8, 64] | [32, 32] |
| Block 2 [Conv3, Conv4] | [32, 128] | [64, 64] |
| Block 3 [Conv5, Conv6] | [64, 256] | [128, 128] |
| Pooling Layers | [Min, Average, Max] | Max |
| Number of FC Layers | [1, 4] | 2 |
| Hidden Units of FC Layers | [128, 1024] | 512 |
| Dropout [Pooling, FC1, FC2] | [0.1, 0.8] | [0.1, 0.7, 0.5] |
| Block | Layer | Input Shape | Output Shape | Kernel Shape | Param # |
|---|---|---|---|---|---|
| Conv. Block 1 | Conv1d | [-, 1, 500] | [-, 32, 493] | [8] | 288 |
| BatchNorm1d | [-, 32, 493] | [-, 32, 493] | -- | 64 | |
| ELU | [-, 32, 493] | [-, 32, 493] | -- | -- | |
| Conv1d | [-, 32, 493] | [-, 32, 486] | [8] | 8224 | |
| BatchNorm1d | [-, 32, 486] | [-, 32, 486] | -- | -- | |
| ELU | [-, 32, 486] | [-, 32, 486] | -- | -- | |
| MaxPool1d | [-, 32, 486] | [-, 32, 120] | 8 | -- | |
| Dropout | [-, 32, 120] | [-, 32, 120] | -- | -- | |
| Conv. Block 2 | Conv1d | [-, 32, 120] | [-, 64, 113] | [8] | 16,448 |
| BatchNorm1d | [-, 64, 113] | [-, 64, 113] | -- | 128 | |
| ELU | [-, 64, 113] | [-, 64, 113] | -- | -- | |
| Conv1d | [-, 64, 113] | [-, 64, 106] | [8] | 32,832 | |
| BatchNorm1d | [-, 64, 106] | [-, 64, 106] | -- | 128 | |
| ELU | [-, 64, 106] | [-, 64, 106] | -- | -- | |
| MaxPool1d | [-, 64, 106] | [-, 64, 25] | 8 | -- | |
| Dropout | [-, 64, 25] | [-, 64, 25] | -- | -- | |
| Conv. Block 3 | Conv1d | [-, 64, 25] | [-, 128, 18] | [8] | 65,664 |
| BatchNorm1d | [-, 128, 18] | [-, 128, 18] | -- | 256 | |
| ELU | [-, 128, 18] | [-, 128, 18] | -- | -- | |
| Conv1d | [-, 128, 18] | [-, 128, 11] | [8] | 131,200 | |
| BatchNorm1d | [-, 128, 11] | [-, 128, 11] | -- | 256 | |
| ELU | [-, 128, 11] | [-, 128, 11] | -- | -- | |
| MaxPool1d | [-, 128, 11] | [-, 128, 1] | 8 | -- | |
| Dropout | [-, 128, 1] | [-, 128, 1] | -- | -- | |
| FC Block 1 | Flatten | [-, 128, 1] | [-, 128] | -- | -- |
| Linear | [-, 128] | [-, 512] | -- | 66,048 | |
| BatchNorm1d | [-, 512] | [-, 512] | -- | 1024 | |
| ReLU | [-, 512] | [-, 512] | -- | -- | |
| Dropout | [-, 512] | [-, 512] | -- | -- | |
| FC Block 2 | Linear | [-, 512] | [-, 512] | -- | 262,656 |
| BatchNorm1d | [-, 512] | [-, 512] | -- | 1024 | |
| ReLU | [-, 512] | [-, 512] | -- | -- | |
| Dropout | [-, 512] | [-, 512] | -- | -- | |
| Output | Linear | [-, 512] | [-, 18] | -- | 9234 |
| Total parameters: 595,538 | |||||
| Category | Device | Wireless/Wired |
|---|---|---|
| Hubs | Smart Things | Wired |
| Amazon Echo | Wireless | |
| Cameras | Netatmo Welcome | Wireless |
| TP-Link Day Night Cloud camera | Wireless | |
| Samsung SmartCam | Wireless | |
| Dropcam | Wireless | |
| Insteon Camera | Wired/Wireless | |
| Nest Dropcam | Wireless | |
| Withings Smart Baby Monitor | Wired | |
| Switches & Triggers | Belkin Wemo switch | Wireless |
| TP-Link Smart plug | Wireless | |
| iHome | Wireless | |
| Belkin wemo motion sensor | Wireless | |
| Air quality sensors | Netatmo weather station | Wireless |
| Healthcare devices | Withings Aura smart sleep sensor | Wireless |
| Light Bulbs | LiFX Smart Bulb | Wireless |
| Electronics | Triby Speaker | Wireless |
| Pix-Star Photo-frame | Wireless |
| Device | Data Instances |
|---|---|
| Dropcam | 8266 |
| Amazon Echo | 2009 |
| Samsung SmartCam | 1915 |
| Insteon Camera | 1419 |
| Belkin wemo motion sensor | 1268 |
| Withings Smart Baby Monitor | 1116 |
| Belkin Wemo switch | 935 |
| Smart Things | 931 |
| Netatmo Welcome | 874 |
| Withings Aura smart sleep sensor | 647 |
| TP-Link Day Night Cloud camera | 526 |
| Nest Dropcam | 299 |
| Netatmo weather station | 272 |
| LiFX Smart Bulb | 251 |
| Triby Speaker | 248 |
| PIX-STAR Photo-frame | 93 |
| iHome | 80 |
| TP-Link Smart plug | 45 |
| Device | Data Instances |
|---|---|
| Hubs | 2940 |
| Cameras | 14,415 |
| Switches & Triggers | 2328 |
| Air quality sensors | 272 |
| Healthcare devices | 647 |
| Light bulbs | 251 |
| Electronics | 341 |
| Category | Precision | Recall | F1-Score | Support |
|---|---|---|---|---|
| Hubs | 1.00 | 0.99 | 1.00 | 292 |
| Cameras | 1.00 | 1.00 | 1.00 | 1439 |
| Switches | 1.00 | 1.00 | 1.00 | 248 |
| Air quality sensors | 1.00 | 1.00 | 1.00 | 25 |
| Healthcare devices | 0.98 | 1.00 | 0.99 | 54 |
| Light bulbs | 1.00 | 1.00 | 1.00 | 22 |
| Electronics | 0.97 | 0.95 | 0.96 | 40 |
| Weighted average | 1.00 | 1.00 | 1.00 | 2120 |
| Layer | Neurons | Input Dimension | Activation |
|---|---|---|---|
| 1 | 512 | 500 | ReLU |
| 2 | 128 | - | ReLU |
| 3 | 18 | - | sigmoid |
| Device | Precision | Recall | F1-Score | Support |
|---|---|---|---|---|
| Withings Smart Baby Monitor | 0.96 | 0.85 | 0.90 | 104 |
| Belkin wemo motion sensor | 0.48 | 0.78 | 0.60 | 138 |
| Smart Things | 0.64 | 0.72 | 0.68 | 83 |
| Amazon Echo | 0.71 | 0.57 | 0.63 | 209 |
| TP-Link Smart plug | 0.00 | 0.00 | 0.00 | 4 |
| Belkin Wemo switch | 0.43 | 0.59 | 0.50 | 100 |
| Withings Aura smart sleep sensor | 0.74 | 0.57 | 0.65 | 54 |
| iHome | 0.00 | 0.00 | 0.00 | 6 |
| TP-Link Day Night Cloud camera | 0.78 | 0.14 | 0.23 | 51 |
| Nest Dropcam | 0.50 | 0.04 | 0.07 | 27 |
| Netatmo weather station | 0.70 | 0.28 | 0.40 | 25 |
| Triby Speaker | 0.20 | 0.18 | 0.19 | 28 |
| PIX-STAR Photo-frame | 0.00 | 0.00 | 0.00 | 12 |
| Samsung SmartCam | 0.61 | 0.80 | 0.70 | 179 |
| Netatmo Welcome | 0.91 | 0.44 | 0.59 | 94 |
| Light Bulbs LiFX Smart Bulb | 0.00 | 0.00 | 0.00 | 22 |
| Insteon Camera | 0.56 | 0.84 | 0.67 | 130 |
| Dropcam | 0.99 | 0.97 | 0.98 | 854 |
| weighted average | 0.77 | 0.76 | 0.75 | 2120 |
| Device | Precision | Recall | F1-Score | Support |
|---|---|---|---|---|
| Withings Smart Baby Monitor | 1.00 | 1.00 | 1.00 | 104 |
| Belkin wemo motion sensor | 0.99 | 1.00 | 1.00 | 138 |
| Smart Things | 1.00 | 1.00 | 1.00 | 83 |
| Amazon Echo | 0.99 | 0.99 | 0.99 | 209 |
| TP-Link Smart plug | 1.00 | 1.00 | 1.00 | 4 |
| Belkin Wemo switch | 1.00 | 1.00 | 1.00 | 100 |
| Withings Aura smart sleep sensor | 1.00 | 1.00 | 1.00 | 54 |
| iHome | 1.00 | 0.83 | 0.91 | 6 |
| TP-Link Day Night Cloud camera | 1.00 | 1.00 | 1.00 | 51 |
| Nest Dropcam | 0.81 | 0.81 | 0.81 | 27 |
| Netatmo weather station | 1.00 | 1.00 | 1.00 | 25 |
| Triby Speaker | 0.93 | 0.89 | 0.91 | 28 |
| PIX-STAR Photo-frame | 1.00 | 1.00 | 1.00 | 12 |
| Samsung SmartCam | 1.00 | 1.00 | 1.00 | 179 |
| Netatmo Welcome | 1.00 | 0.99 | 0.99 | 94 |
| Light Bulbs LiFX Smart Bulb | 1.00 | 1.00 | 1.00 | 22 |
| Insteon Camera | 0.98 | 0.99 | 0.99 | 130 |
| Dropcam | 1.00 | 1.00 | 1.00 | 854 |
| weighted average | 0.99 | 0.99 | 0.99 | 2120 |
Publisher’s Note: MDPI stays neutral with regard to jurisdictional claims in published maps and institutional affiliations. |
© 2022 by the authors. Licensee MDPI, Basel, Switzerland. This article is an open access article distributed under the terms and conditions of the Creative Commons Attribution (CC BY) license (https://creativecommons.org/licenses/by/4.0/).
Share and Cite
Liu, X.; Han, Y.; Du, Y. IoT Device Identification Using Directional Packet Length Sequences and 1D-CNN. Sensors 2022, 22, 8337. https://doi.org/10.3390/s22218337
Liu X, Han Y, Du Y. IoT Device Identification Using Directional Packet Length Sequences and 1D-CNN. Sensors. 2022; 22(21):8337. https://doi.org/10.3390/s22218337
Chicago/Turabian StyleLiu, Xiangyu, Yi Han, and Yanhui Du. 2022. "IoT Device Identification Using Directional Packet Length Sequences and 1D-CNN" Sensors 22, no. 21: 8337. https://doi.org/10.3390/s22218337
APA StyleLiu, X., Han, Y., & Du, Y. (2022). IoT Device Identification Using Directional Packet Length Sequences and 1D-CNN. Sensors, 22(21), 8337. https://doi.org/10.3390/s22218337