
Rapid Detection of Amitriptyline in Dried Blood and Dried Saliva Samples with Surface-Enhanced Raman Spectroscopy


Abstract
1. Introduction
2. Experimental
2.1. Materials and Instrumentation
2.2. AgNP Synthesis and Casting Procedure
2.3. Biological Samples
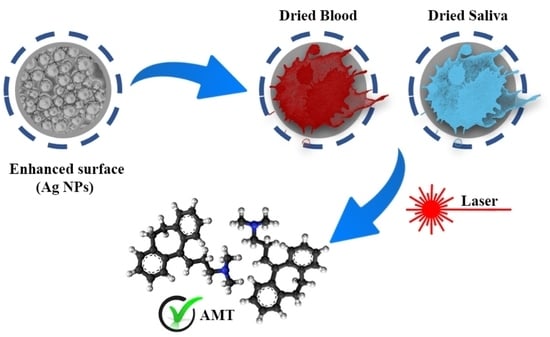
2.4. Results and Discussion
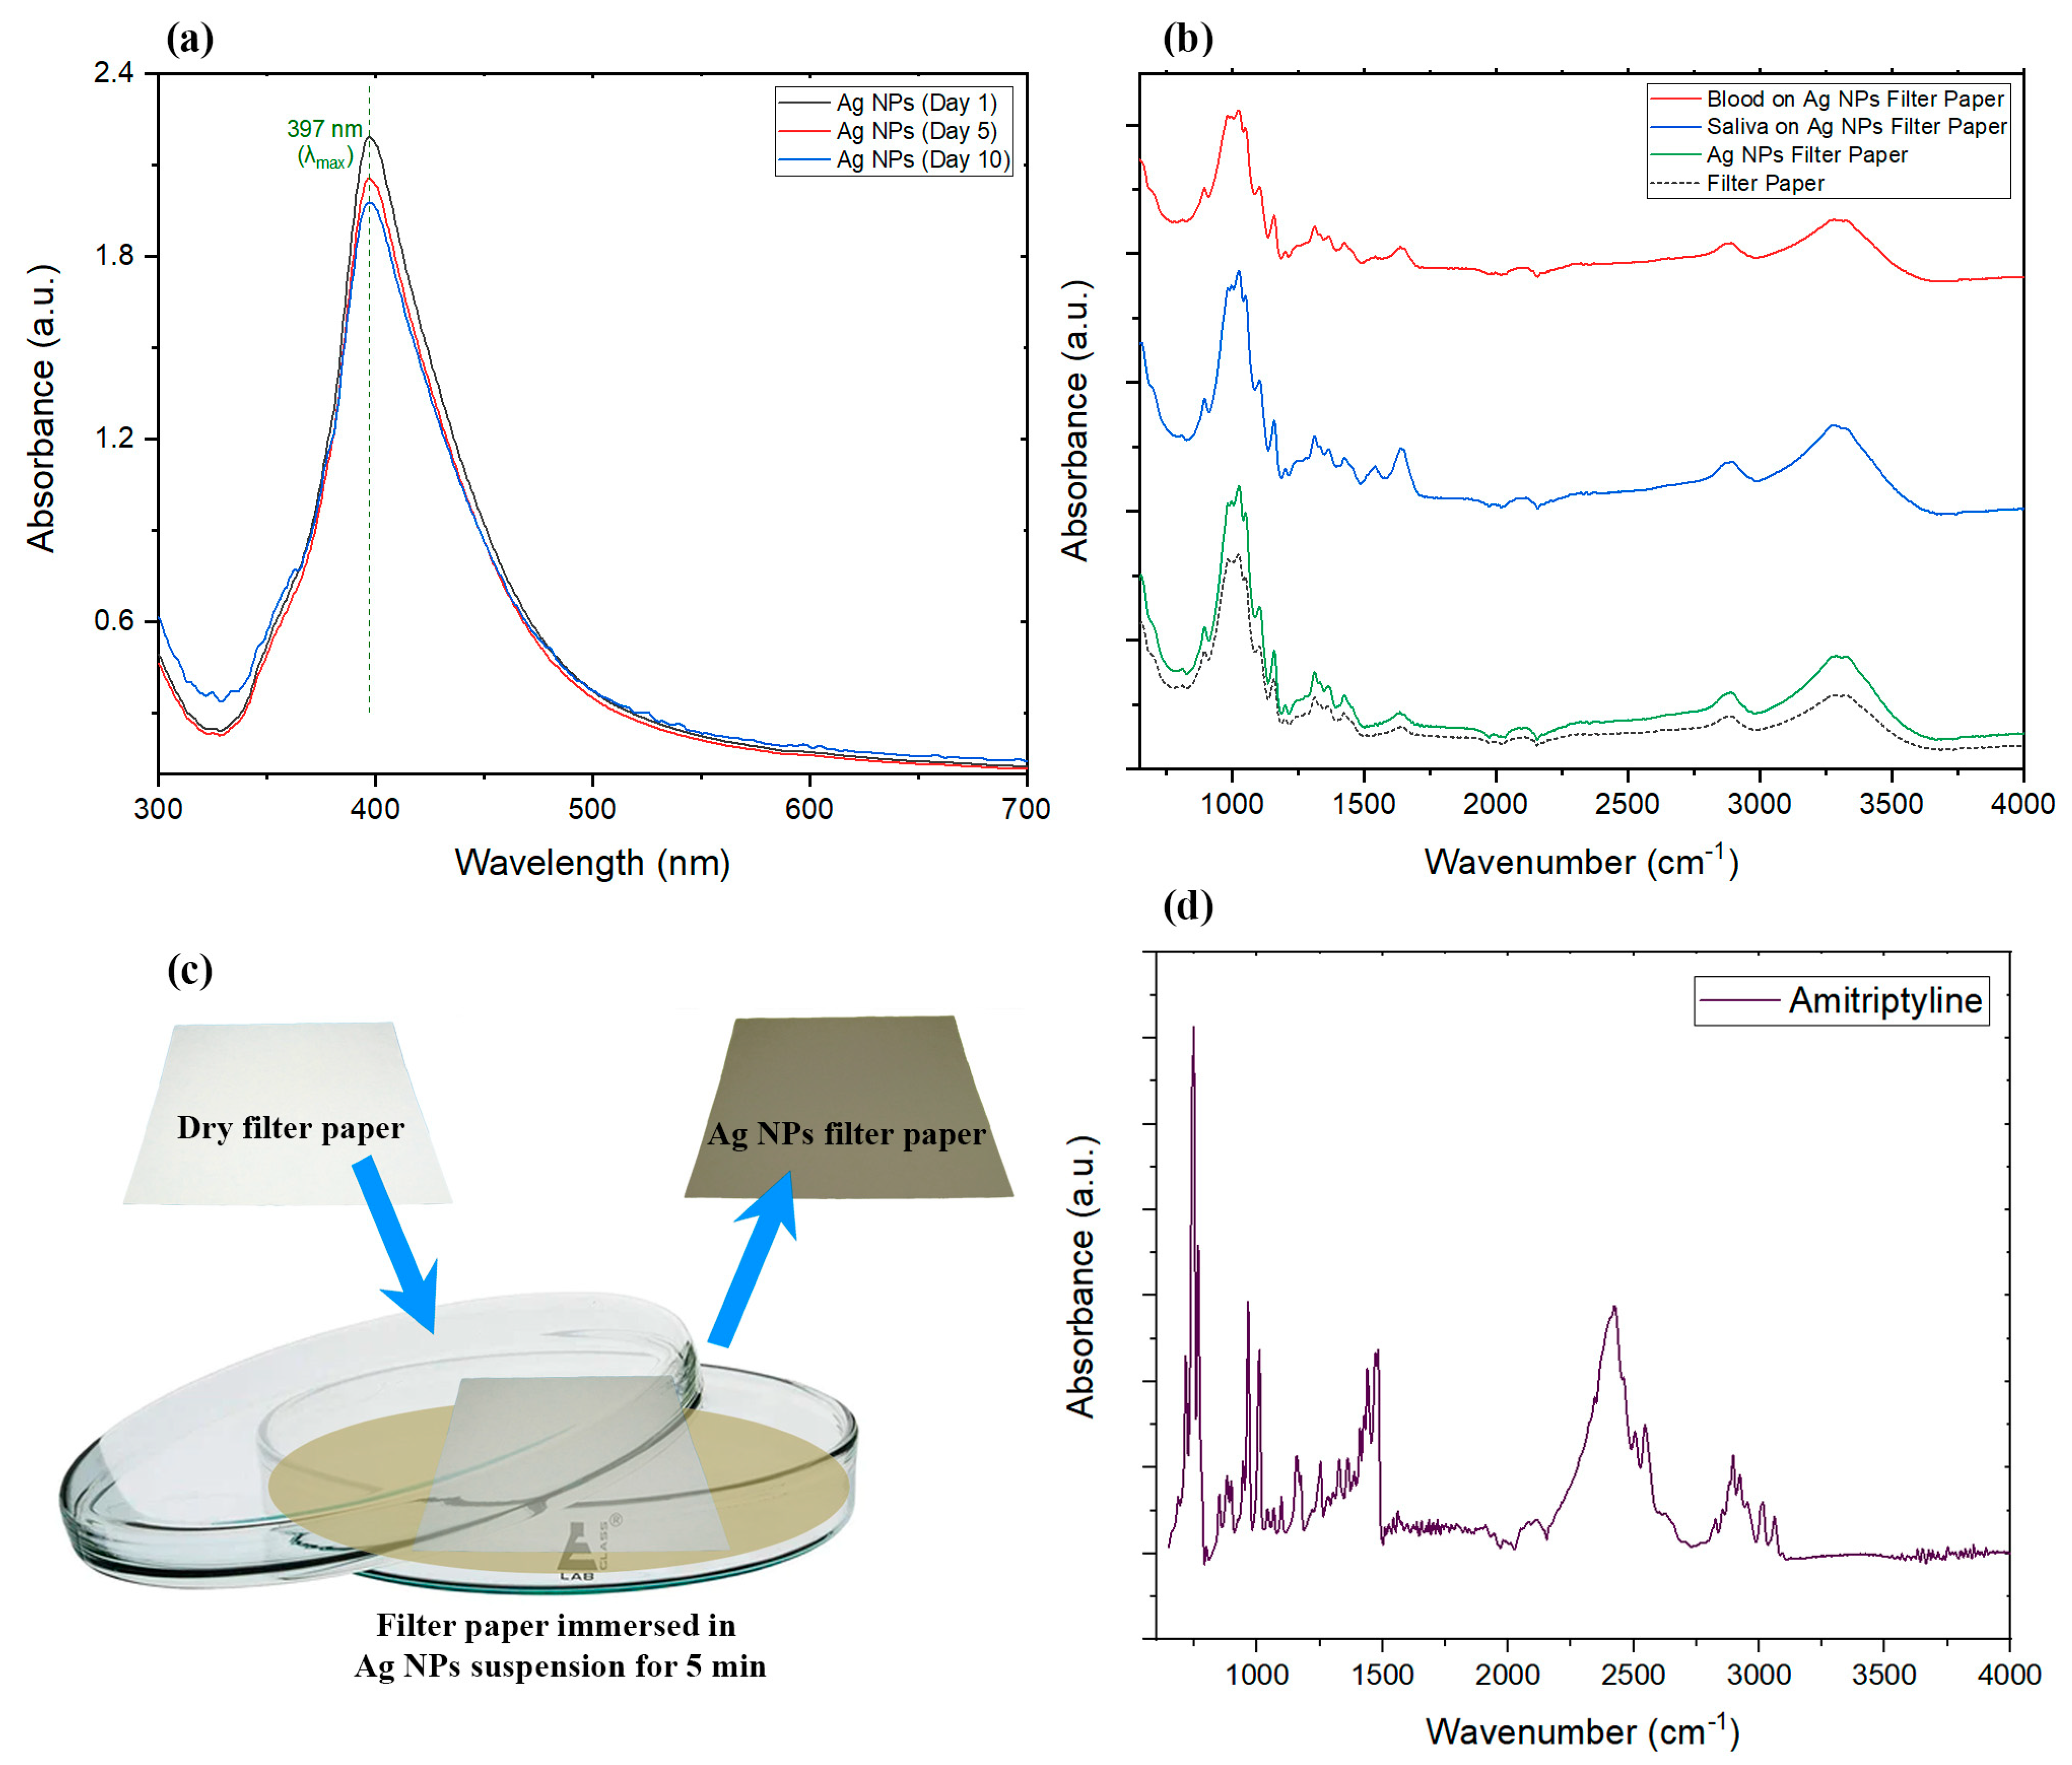
2.4.1. FTIR and UV/Vis
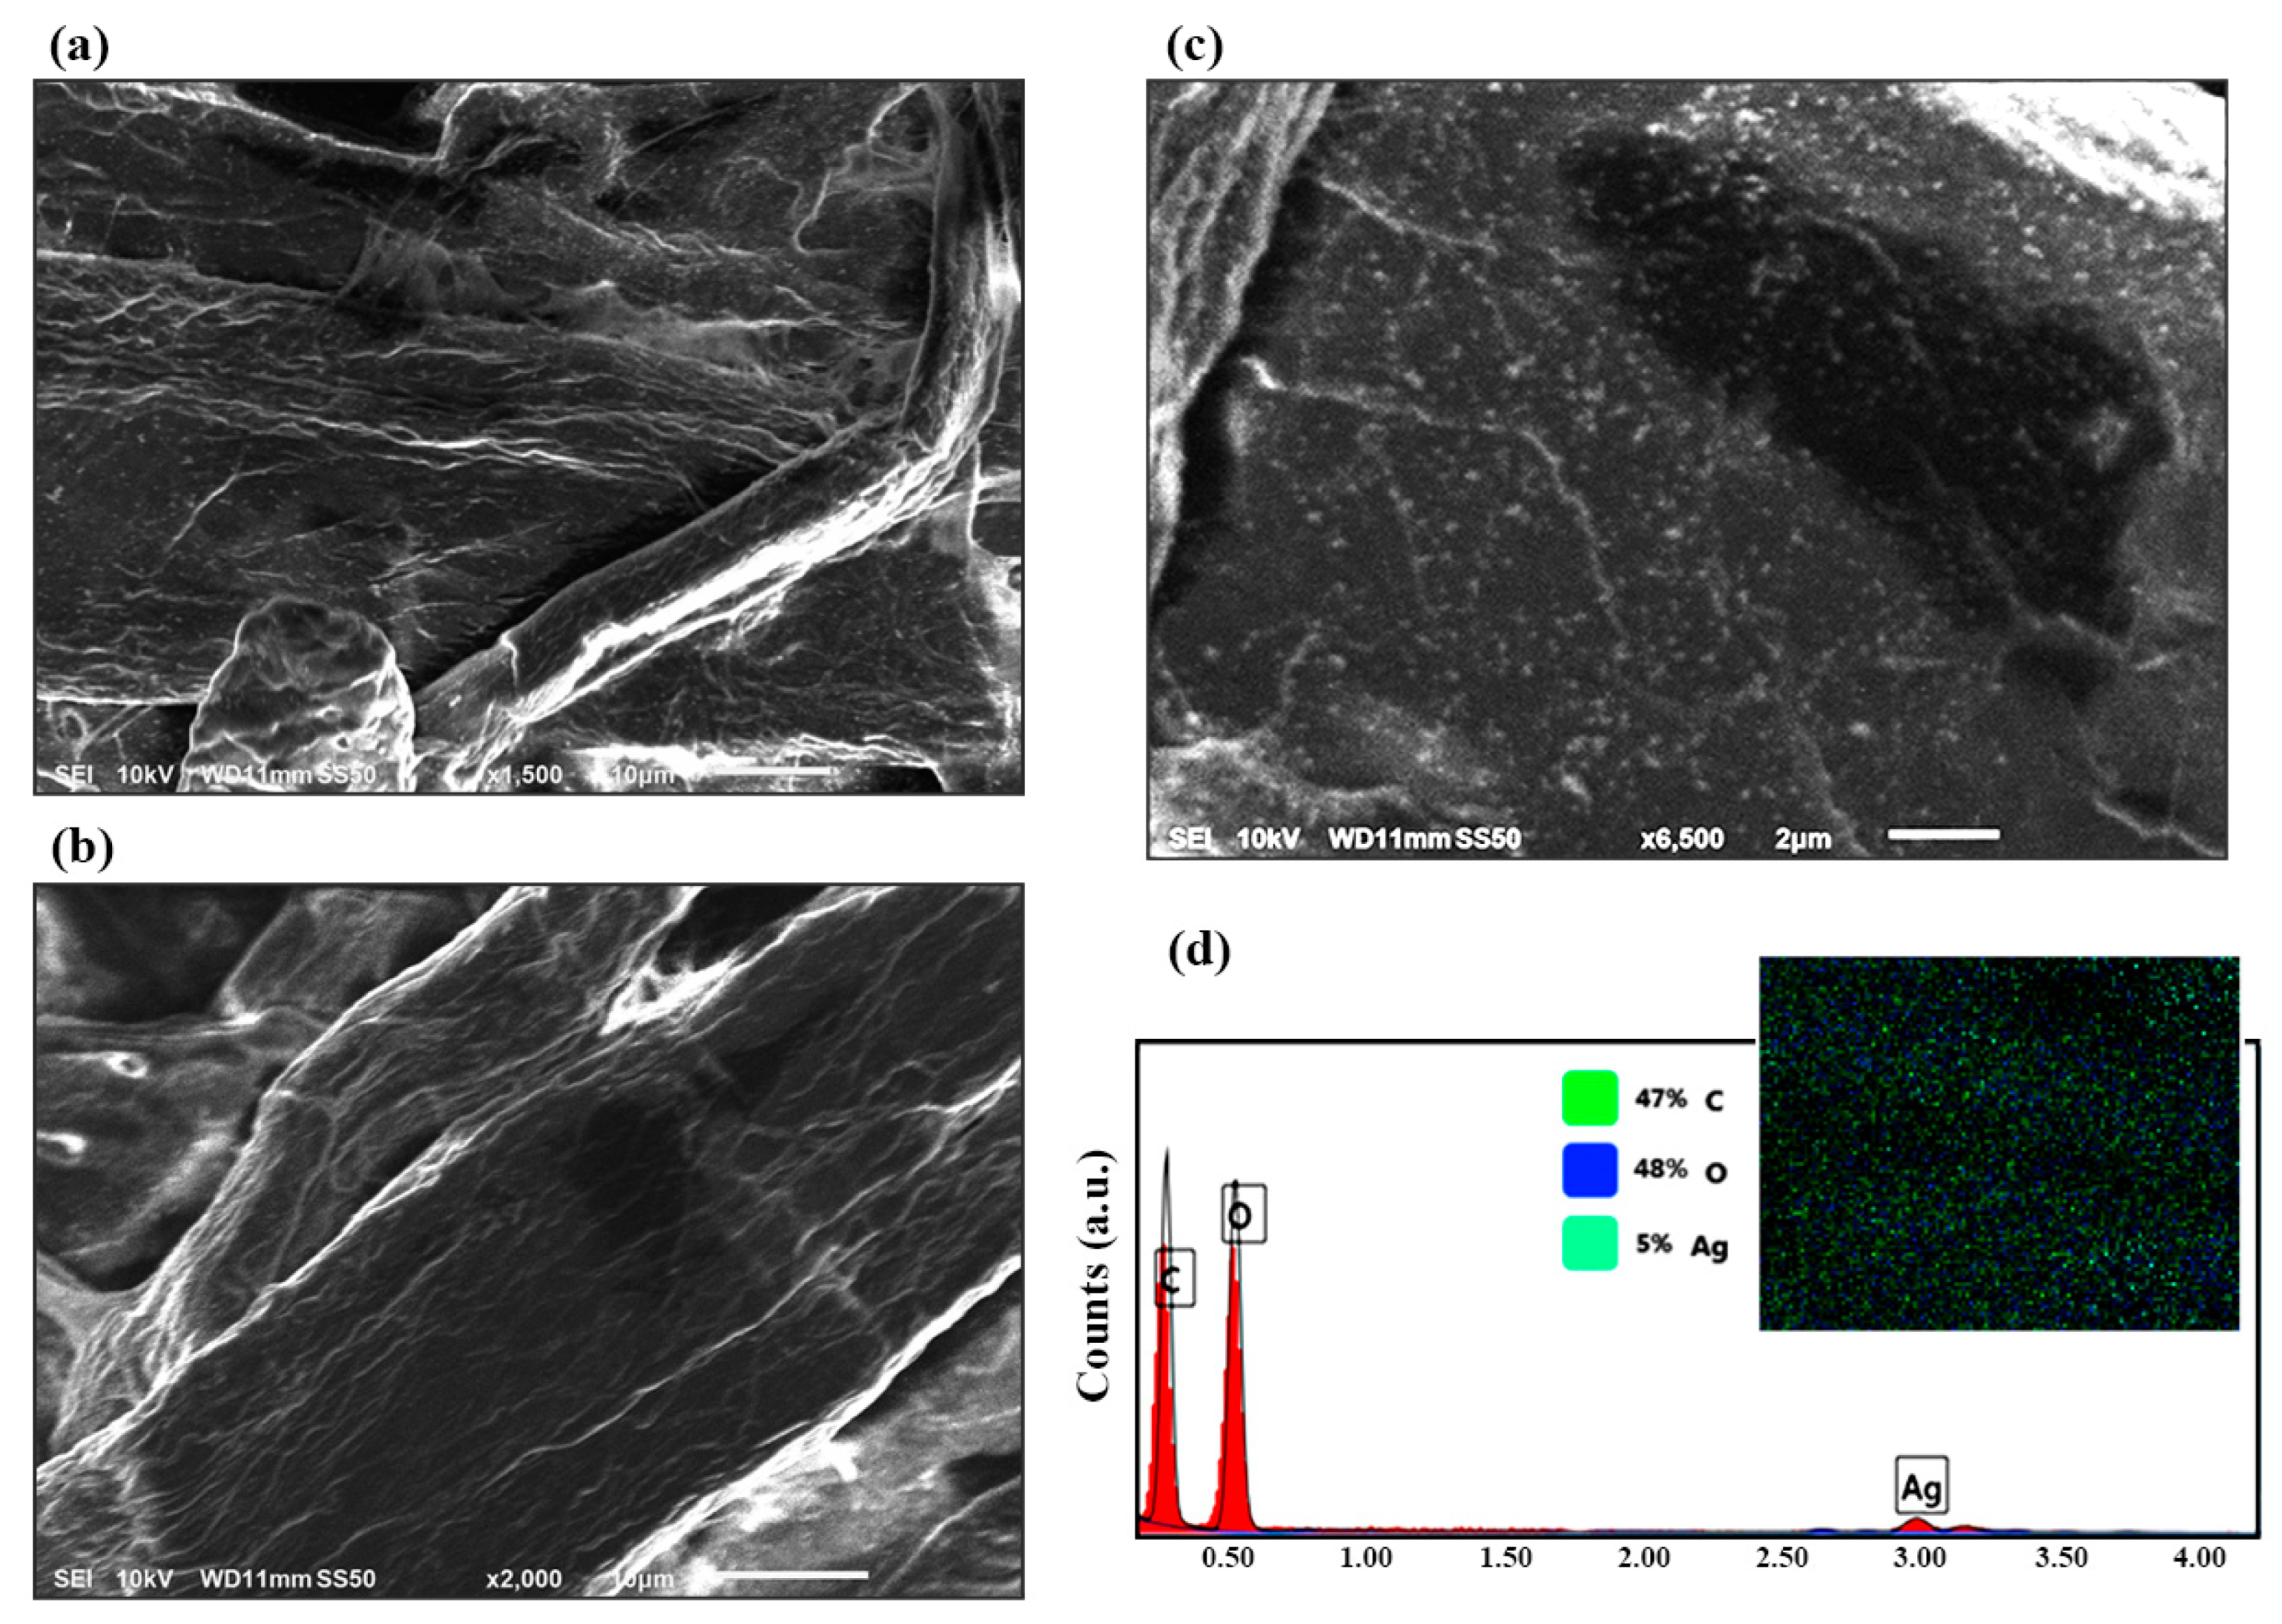
2.4.2. SEM and EDAX
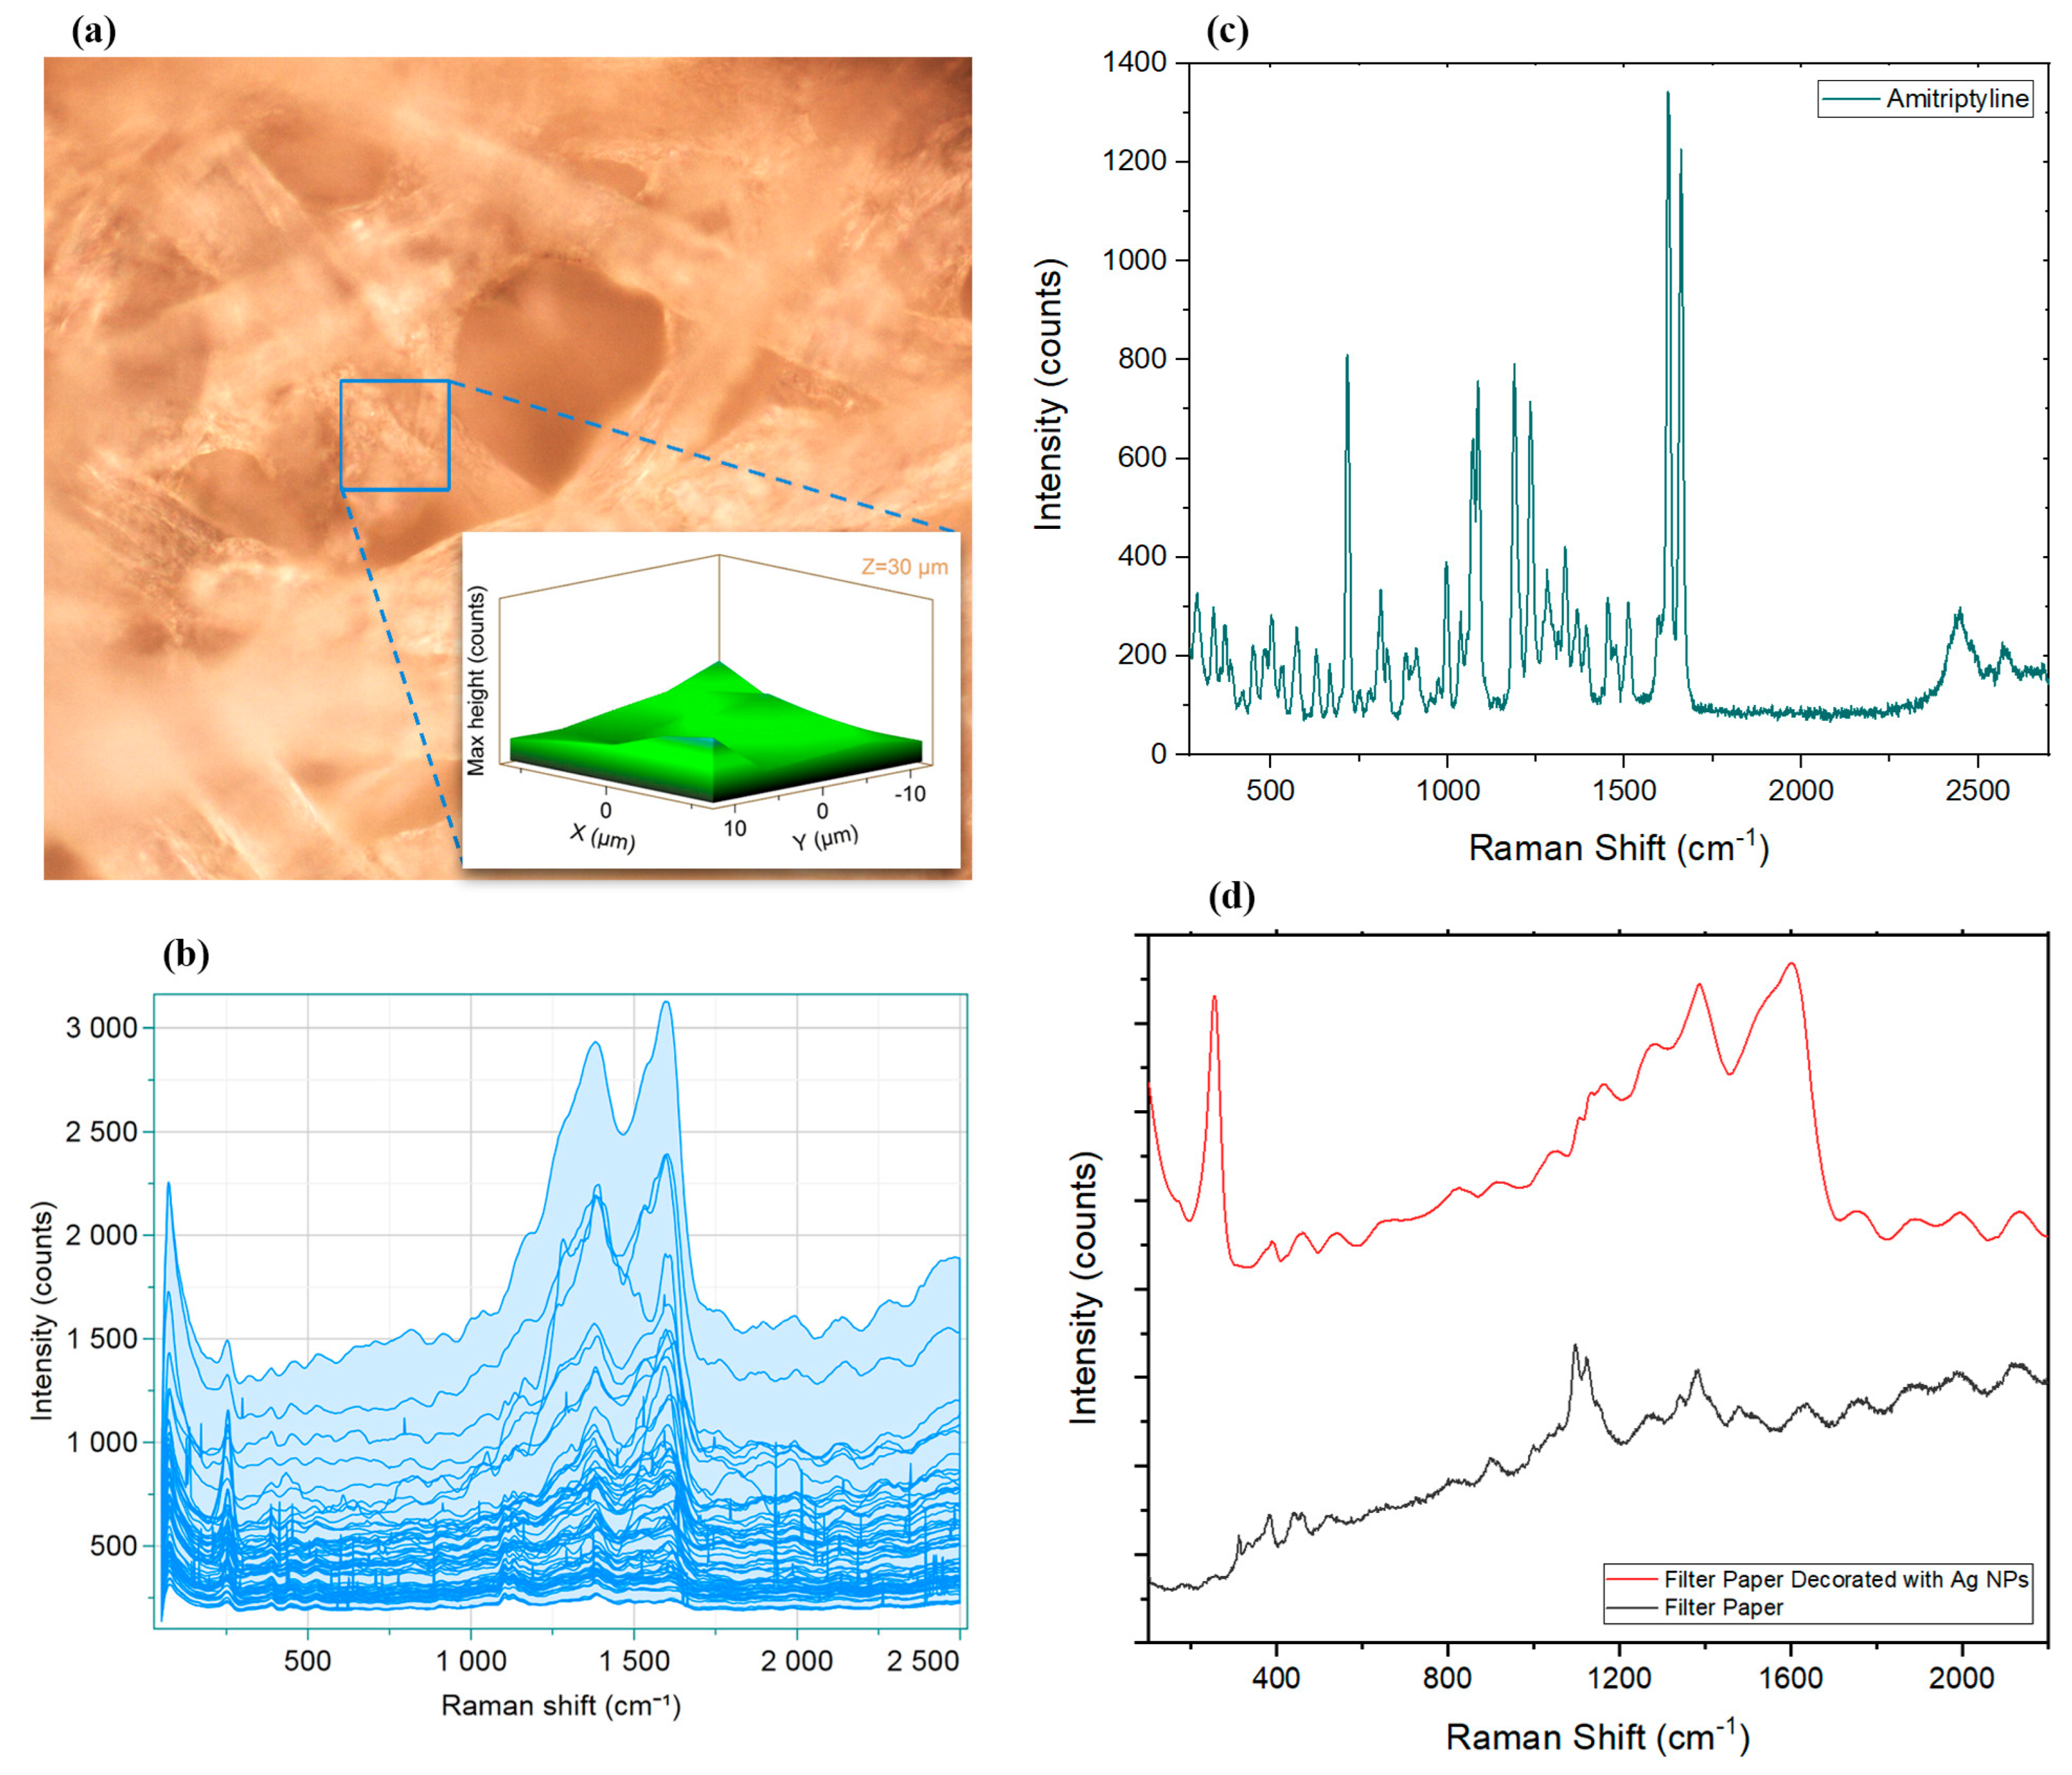
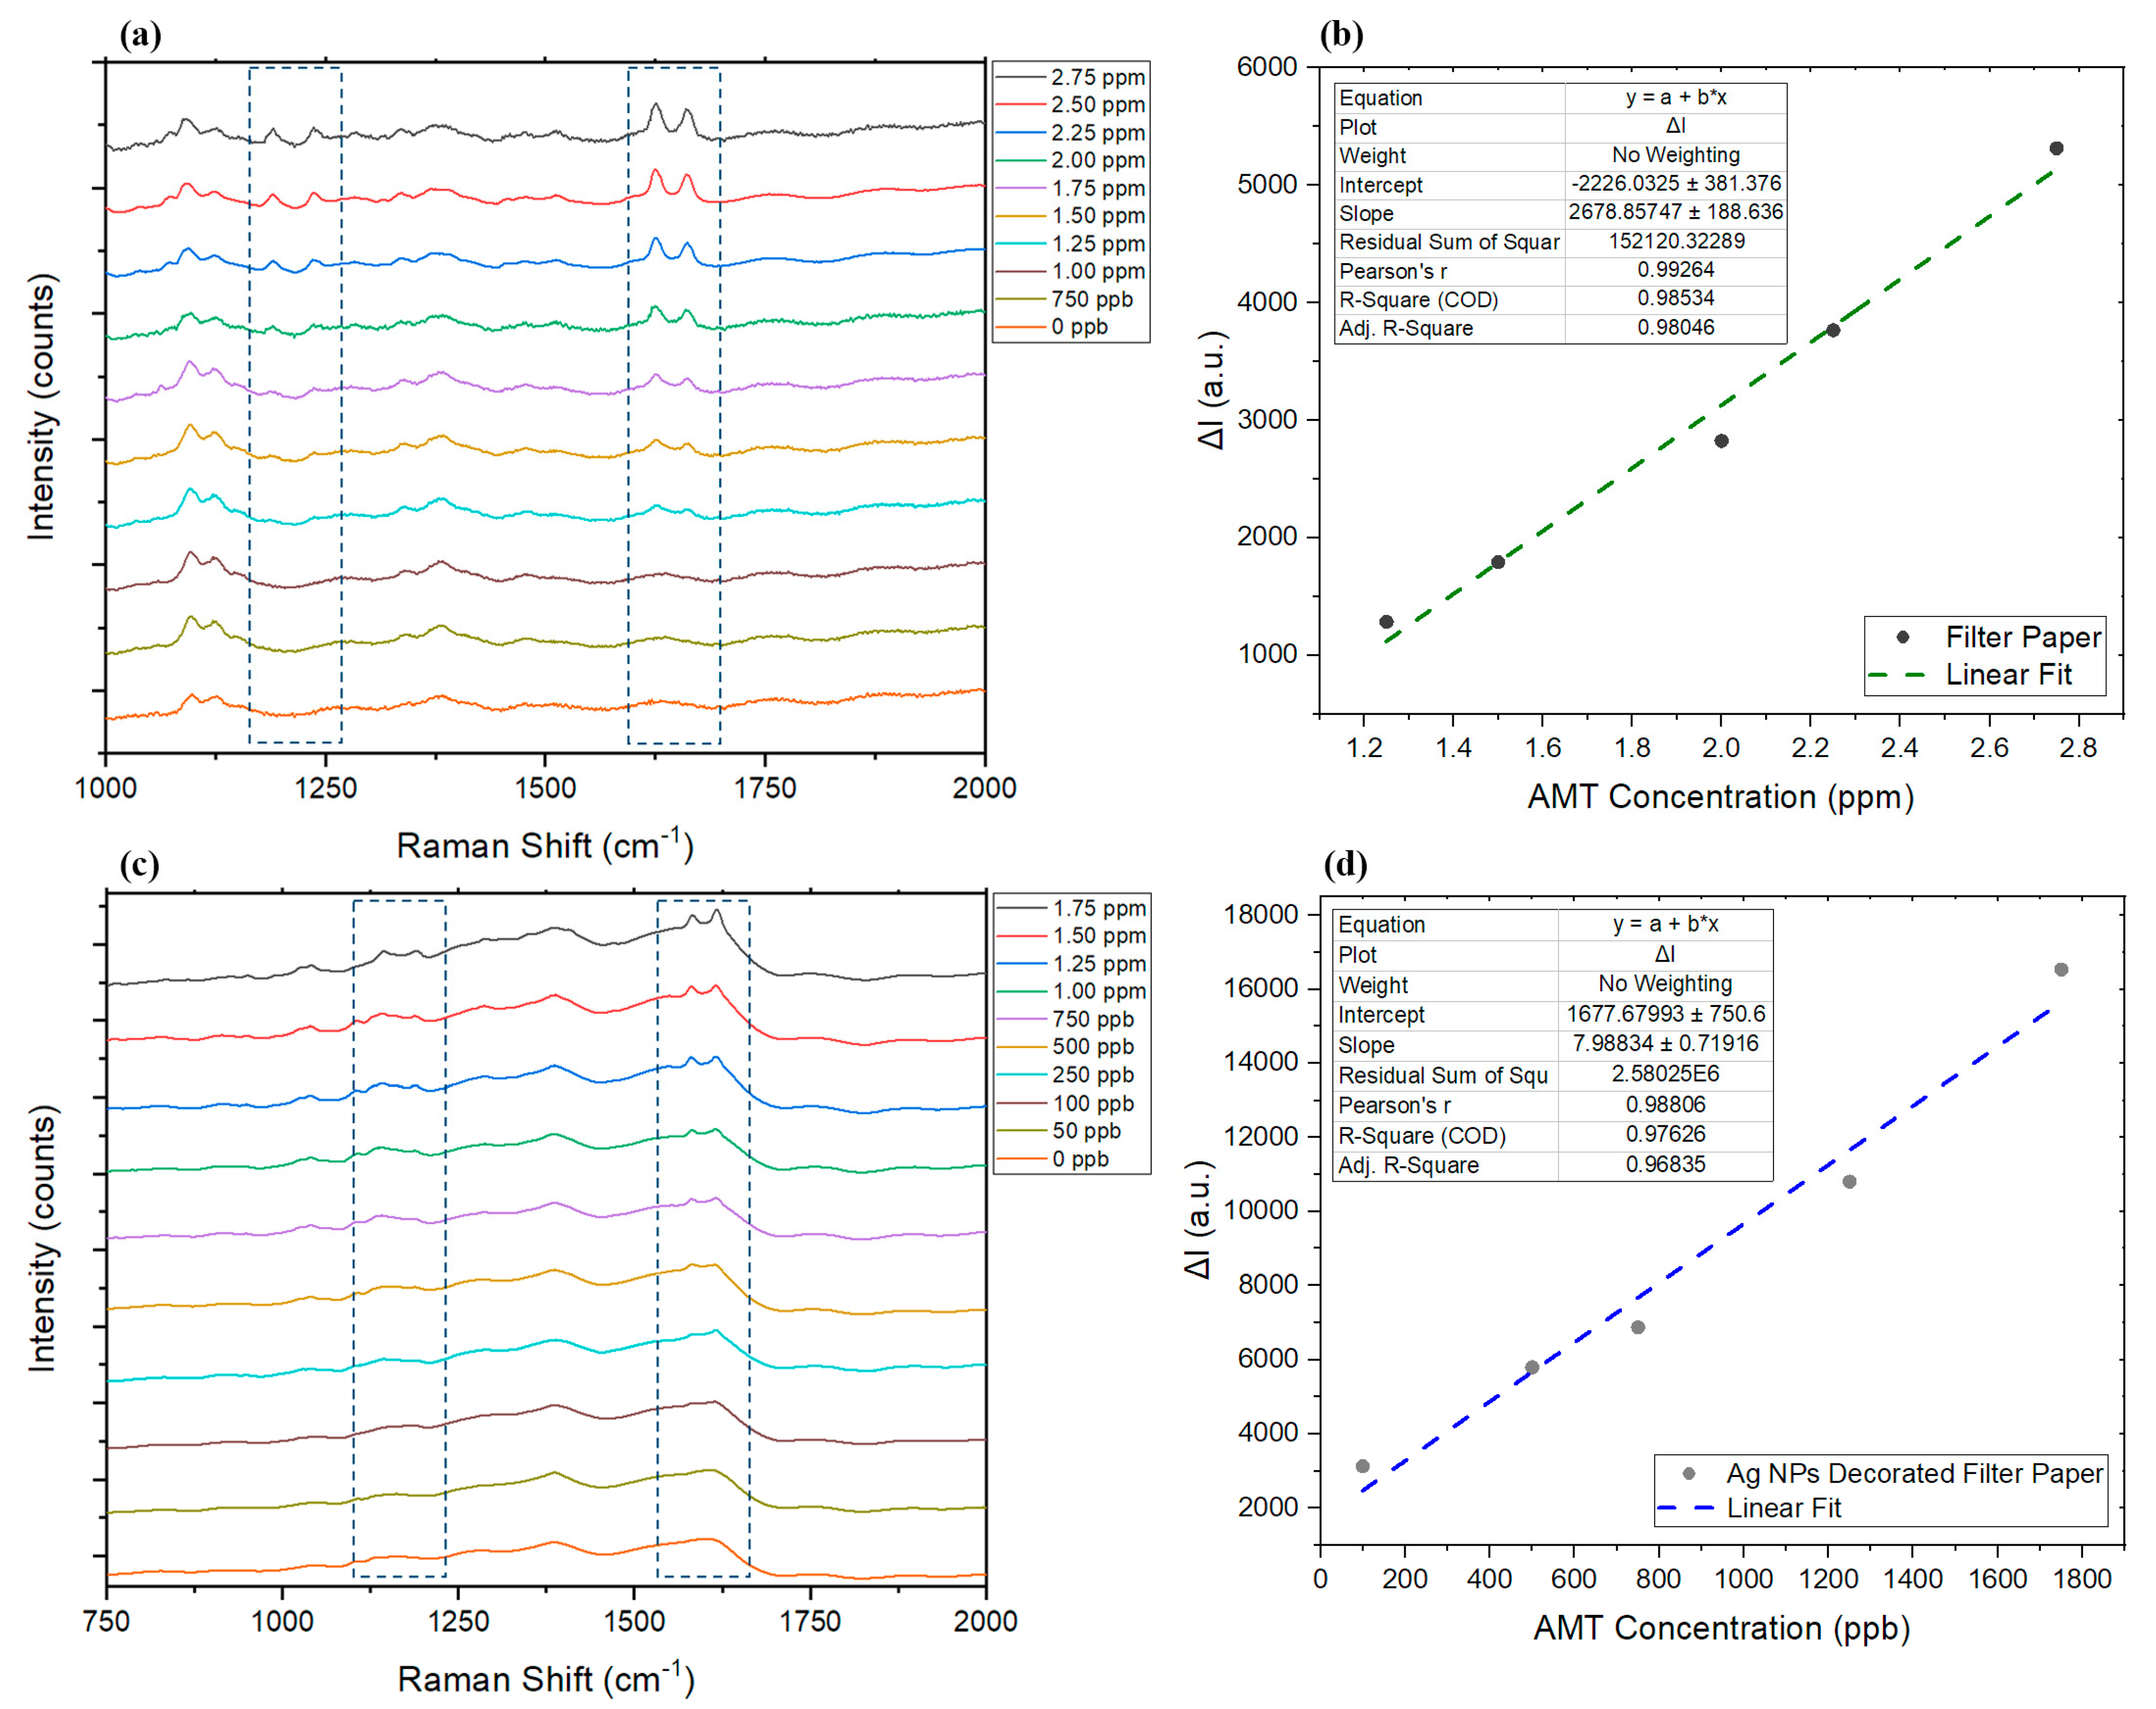
2.4.3. SERS
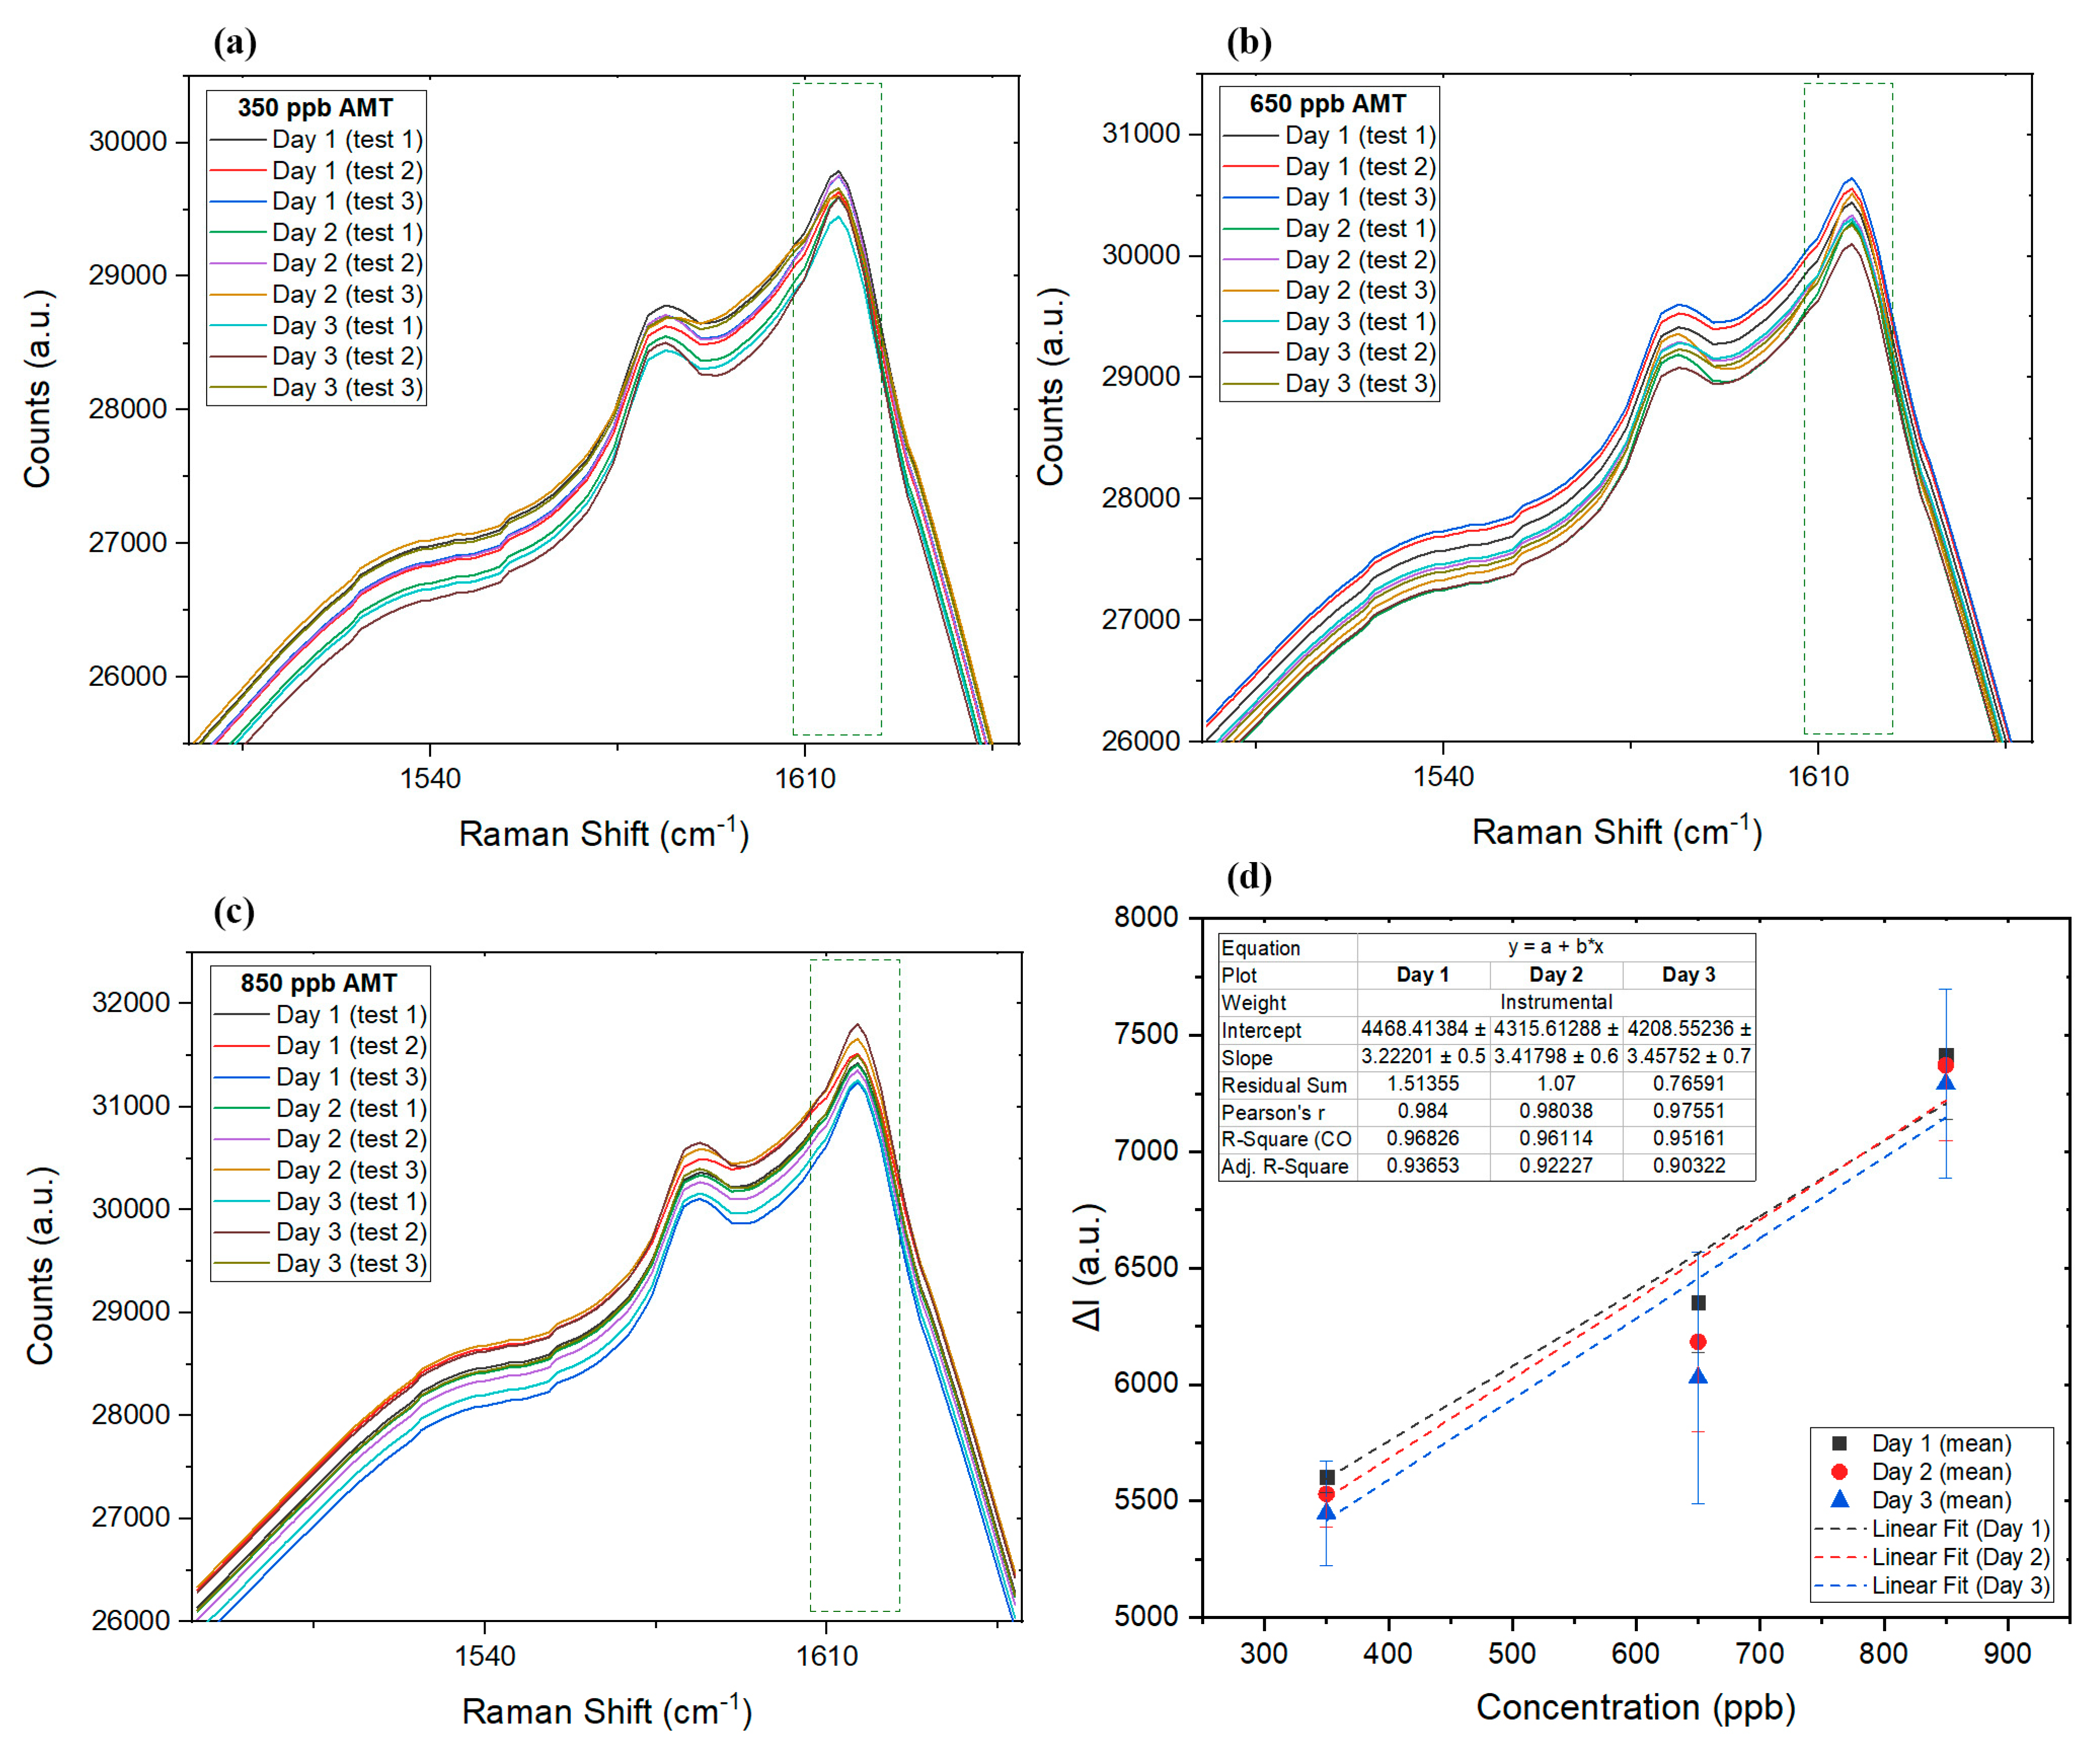
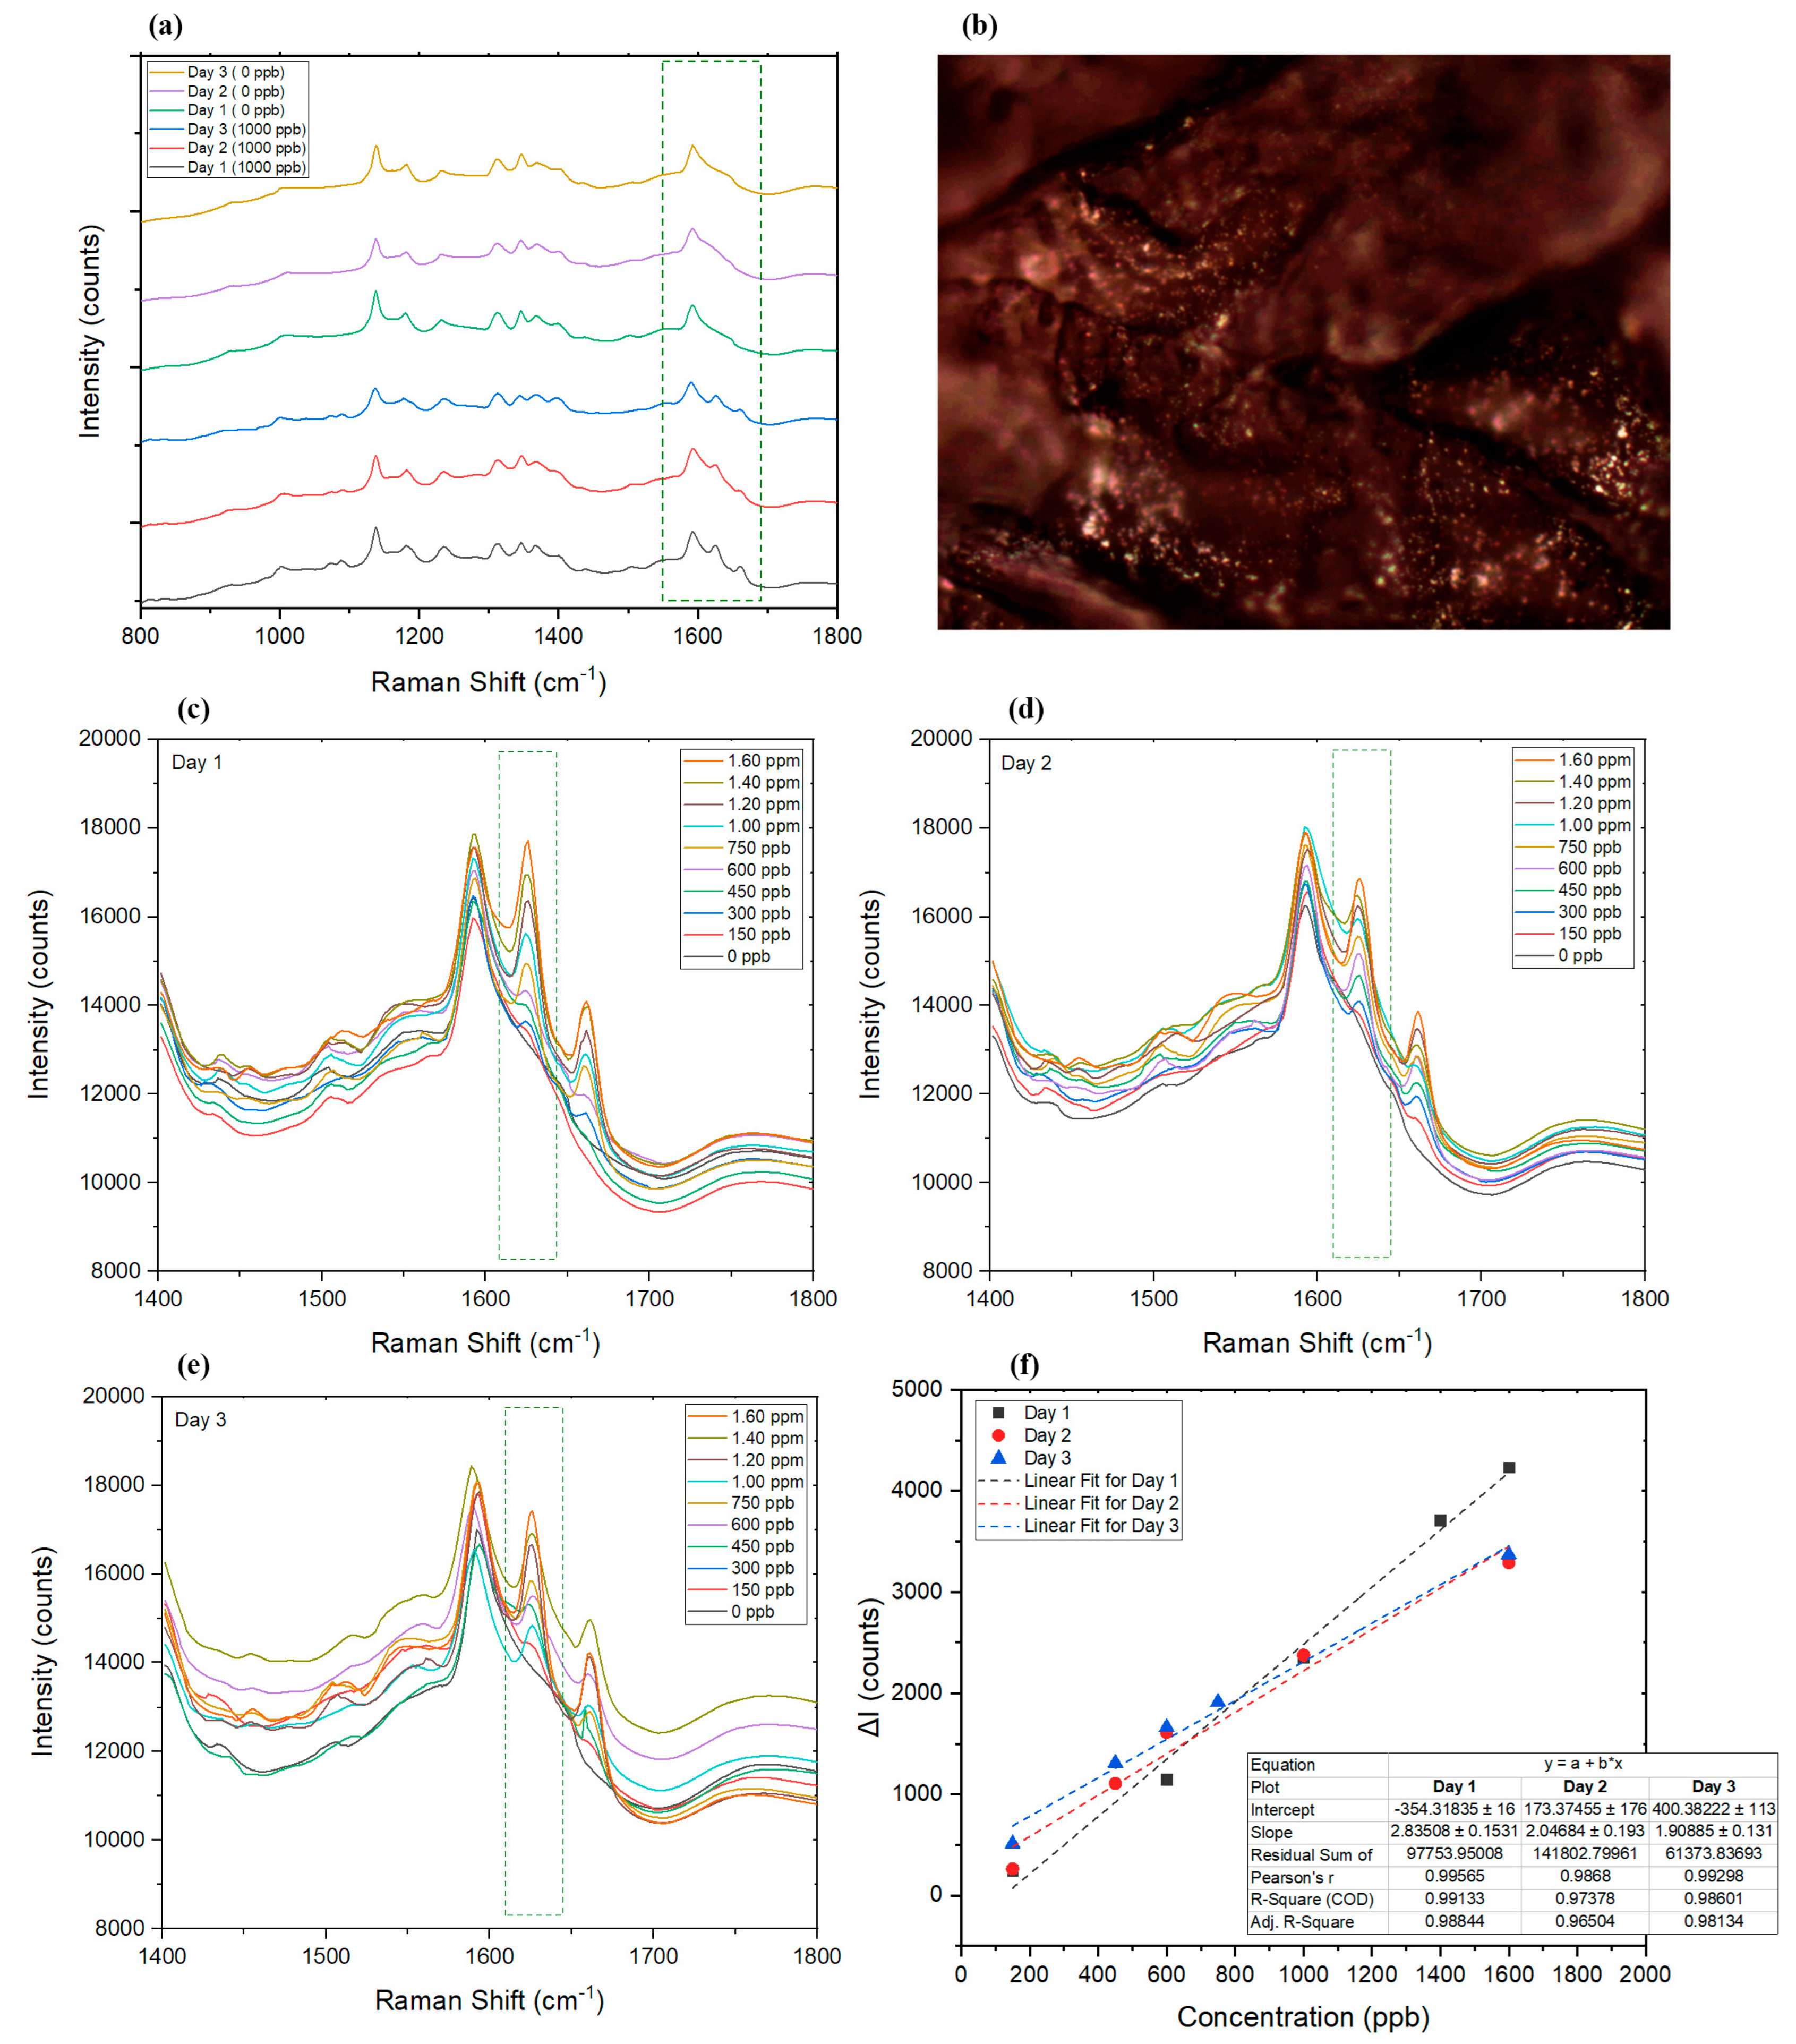
2.4.4. Dried Blood
Validation Parameters for Blood
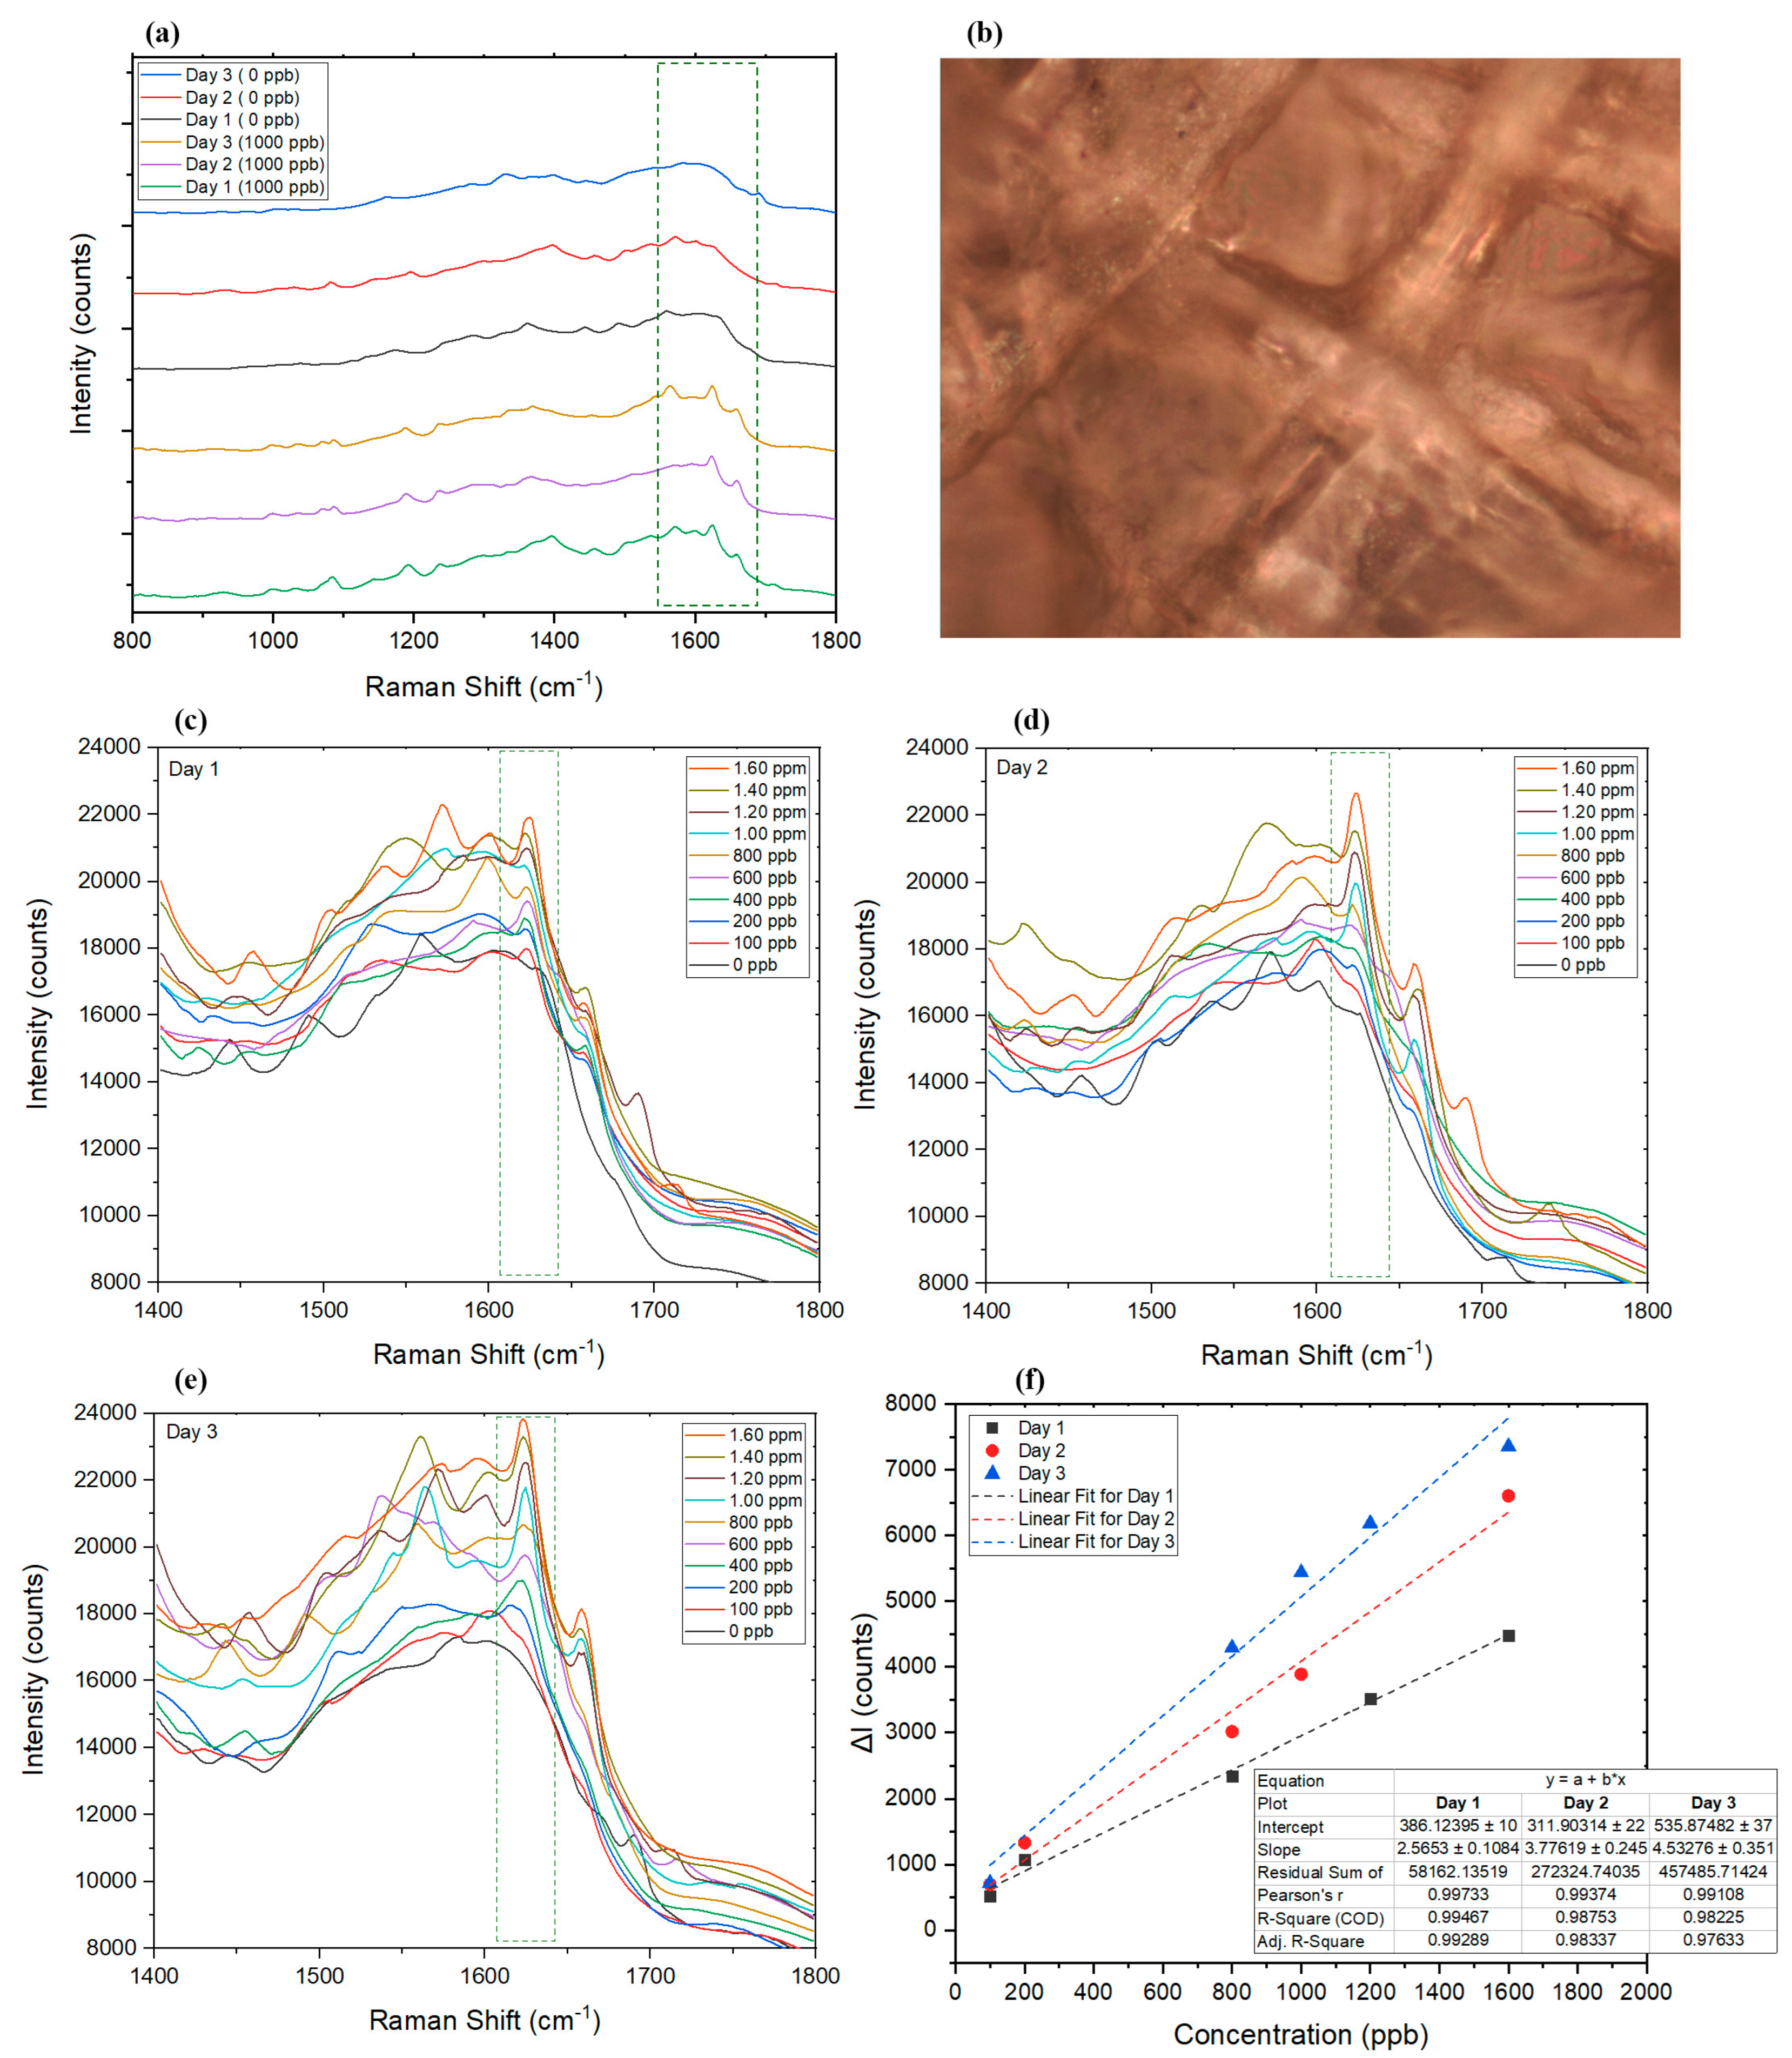
2.4.5. Dried Saliva
Validation Parameters for Saliva
2.5. Performance Comparisons of the Detection of Amitriptyline with Other Methods
3. Conclusions
Author Contributions
Funding
Informed Consent Statement
Conflicts of Interest
References
- Bryson, H.M.; Wilde, M.I.J.D. Amitriptyline. Drugs Aging 1996, 8, 459–476. [Google Scholar] [CrossRef] [PubMed]
- Boroujerdi, R.; Abdelkader, A.; Paul, R. Highly sensitive and selective detection of the antidepressant amitriptyline using functionalised graphene-based sensor. ChemNanoMat 2022, 8, e202200209. [Google Scholar] [CrossRef]
- Świądro, M.; Stelmaszczyk, P.; Wietecha-Posłuszny, R.; Dudek, D. Development of a new method for drug detection based on a combination of the dried blood spot method and capillary electrophoresis. J. Chromatogr. B 2020, 1157, 122339. [Google Scholar] [CrossRef]
- Berm, E.J.; Paardekooper, J.; Brummel-Mulder, E.; Hak, E.; Wilffert, B.; Maring, J.G.T. A simple dried blood spot method for therapeutic drug monitoring of the tricyclic antidepressants amitriptyline, nortriptyline, imipramine, clomipramine, and their active metabolites using LC-MS/MS. Talanta 2015, 134, 165–172. [Google Scholar] [CrossRef] [PubMed]
- Van Brunt, N. The clinical utility of tricyclic antidepressant blood levels: A review of the literature. Ther. Drug Monit. 1983, 5, 1–10. [Google Scholar] [CrossRef] [PubMed]
- Qiu, X.; Chen, C.; Shi, Y.; Chen, K.; Li, M.; Xu, H.; Wu, X.; Takai, Y.; Shimasaki, Y.; Oshima, Y. Persistent impact of amitriptyline on the behavior, brain neurotransmitter, and transcriptional profile of zebrafish (Danio rerio). Aquat. Toxicol. 2022, 245, 106129. [Google Scholar] [CrossRef]
- Abdollahi, M.; Mostafalou, S. Tricyclic Antidepressants. In Encyclopedia of Toxicology, 3rd ed.; Wexler, P., Ed.; Academic Press: Oxford, UK, 2014; pp. 838–845. [Google Scholar]
- Yang, K.L.; Dantzker, D.R. Reversible Brain Death: A Manifestation of Amitriptyline Overdose. Chest 1991, 99, 1037–1038. [Google Scholar] [CrossRef][Green Version]
- Coull, D.C.; Dingwall-Fordyce, I.; Crooks, J.; Scott, A.M.; Weir, R.D. Amitriptyline and Cardiac Disease: Risk of Sudden Death Identified by Monitoring System. Lancet 1970, 296, 590–591. [Google Scholar] [CrossRef]
- Moir, D.C.; Cornwell, W.B.; Dingwall-Fordyce, I.; Crooks, J.; O’Malley, K.; Turnbull, M.J.; Weir, R.D. Cardiotoxicity of Amitriptyline. Lancet 1972, 300, 561–564. [Google Scholar] [CrossRef]
- Prahlow, J.A.; Landrum, J.E. Amitriptyline abuse and misuse. Am. J. Forensic Med. Pathol. 2005, 26, 86–88. [Google Scholar] [CrossRef]
- Boroujerdi, R.; Paul, R. Graphene-Based Electrochemical Sensors for Psychoactive Drugs. Nanomaterials 2022, 12, 2250. [Google Scholar] [CrossRef] [PubMed]
- DiMaio, V.; DiMaio, D. Interpretive toxicology: Drug abuse and drug deaths. Forensic Pathol. 2001, 521–524. [Google Scholar]
- Garrido-Suárez, B.B.; Garrido, G.; Bellma Menéndez, A.; Merino, N.; Valdés, O.; Delgado-Hernández, R.; Granados-Soto, V. Synergistic interaction between amitriptyline and paracetamol in persistent and neuropathic pain models: An isobolografic analysis. Neurochem. Int. 2021, 150, 105160. [Google Scholar] [CrossRef]
- Blahova, J.; Doubkova, V.; Plhalova, L.; Lakdawala, P.; Medkova, D.; Vecerek, V.; Svobodova, Z.; Faggio, C. Embryotoxicity of selective serotonin reuptake inhibitors—Comparative sensitivity of zebrafish (Danio rerio) and african clawed frog (xenopus laevis) embryos. Appl. Sci. 2021, 11, 10015. [Google Scholar] [CrossRef]
- Richmond, E.K.; Rosi, E.J.; Walters, D.M.; Fick, J.; Hamilton, S.K.; Brodin, T.; Sundelin, A.; Grace, M.R. A diverse suite of pharmaceuticals contaminates stream and riparian food webs. Nat. Commun. 2018, 9, 4491. [Google Scholar] [CrossRef]
- Bezerra, R.D.; Morais, A.I.; Osajima, J.A.; Nunes, L.C.; Silva Filho, E.C. Development of new phosphated cellulose for application as an efficient biomaterial for the incorporation/release of amitriptyline. Int. J. Biol. Macromol. 2016, 86, 362–375. [Google Scholar] [CrossRef] [PubMed]
- Chen, Y.; Xiao, M.; Wang, Z.; Jiang, W.; Guo, Y.; Liu, Z. Oxidation of amitriptyline and nortriptyline by ferrate (VI): Efficiency and reaction pathways. Desalin. Water Treat. 2016, 52, 12882–12890. [Google Scholar] [CrossRef]
- Melin, V.; Salgado, P.; Thiam, A.; Henríquez, A.; Mansilla, H.D.; Yáñez, J.; Salazar, C. Study of degradation of amitriptyline antidepressant by different electrochemical advanced oxidation processes. Chemosphere 2021, 274, 129683. [Google Scholar] [CrossRef] [PubMed]
- Guthrie, R.; Susi, A. A simple phenylalanine method for detecting phenylketonuria in large populations of newborn infants. Pediatrics 1963, 32, 338–343. [Google Scholar] [CrossRef] [PubMed]
- Bezerra, C.S.; Portilho, M.M.; Barbosa, J.R.; de Azevedo, C.P.; Mendonça, A.C.d.F.; da Cruz, J.N.M.; Frota, C.C.; do Lago, B.V.; Villar, L.M. Dried blood spot sampling for hepatitis B virus quantification, sequencing and mutation detection. Sci. Rep. 2022, 12, 1651. [Google Scholar] [CrossRef]
- Warszawski, J.; Beaumont, A.-L.; Seng, R.; de Lamballerie, X.; Rahib, D.; Lydié, N.; Slama, R.; Durrleman, S.; Raynaud, P.; Sillard, P.; et al. Prevalence of SARS-CoV-2 antibodies and living conditions: The French national random population-based EPICOV cohort. BMC Infect. Dis. 2022, 22, 41. [Google Scholar] [CrossRef] [PubMed]
- Thevis, M.; Kuuranne, T.; Geyer, H. Annual banned-substance review: Analytical approaches in human sports drug testing 2020/2021. Drug Test. Anal. 2022, 14, 7–30. [Google Scholar] [CrossRef] [PubMed]
- Li, W.; Tse, F.L. Dried blood spot sampling in combination with LC-MS/MS for quantitative analysis of small molecules. Biomed. Chromatogr. 2010, 24, 49–65. [Google Scholar] [CrossRef] [PubMed]
- Edelbroek, P.M.; van der Heijden, J.; Stolk, L.M. Dried blood spot methods in therapeutic drug monitoring: Methods, assays, and pitfalls. Ther. Drug Monit. 2009, 31, 327–336. [Google Scholar] [CrossRef] [PubMed]
- La Marca, G.; Malvagia, S.; Filippi, L.; Luceri, F.; Moneti, G.; Guerrini, R. A new rapid micromethod for the assay of phenobarbital from dried blood spots by LC-tandem mass spectrometry. Epilepsia 2009, 50, 2658–2662. [Google Scholar] [CrossRef]
- Parker, S.; Cubitt, W.D. The use of the dried blood spot sample in epidemiological studies. J. Clin. Pathol. 1999, 52, 633. [Google Scholar] [CrossRef]
- Iacuzzi, V.; Posocco, B.; Zanchetta, M.; Gagno, S.; Poetto, A.S.; Guardascione, M.; Toffoli, G. Dried Blood Spot Technique Applied in Therapeutic Drug Monitoring of Anticancer Drugs: A Review on Conversion Methods to Correlate Plasma and Dried Blood Spot Concentrations. Pharm. Res. 2021, 38, 759–778. [Google Scholar] [CrossRef]
- Hansen, S.H.; Pedersen-Bjergaard, S.; Rasmussen, K. Introduction to Pharmaceutical Chemical Analysis; John Wiley & Sons: Hoboken, NJ, USA, 2011. [Google Scholar]
- Breyer-Pfaff, U. The metabolic fate of amitriptyline, nortriptyline and amitriptylinoxide in man. Drug Metab. Rev. 2004, 36, 723–746. [Google Scholar] [CrossRef]
- Langman, L.J. The use of oral fluid for therapeutic drug management: Clinical and forensic toxicology. Ann. N. Y. Acad. Sci. 2007, 1098, 145–166. [Google Scholar] [CrossRef]
- Brodie, B.B. Physicochemical and biochemical aspects of pharmacology. Jama 1967, 202, 600–609. [Google Scholar] [CrossRef]
- Elmongy, H.; Abdel-Rehim, M. Saliva as an alternative specimen to plasma for drug bioanalysis: A review. TrAC Trends Anal. Chem. 2016, 83, 70–79. [Google Scholar] [CrossRef]
- Almeida, E.; Soares, S.; Gonçalves, J.; Rosado, T.; Fernández, N.; Rodilla, J.M.; Passarinha, L.A.; Barroso, M.; Gallardo, E. Stability of Cocaine, Opiates, and Metabolites in Dried Saliva Spots. Molecules 2022, 27, 641. [Google Scholar] [CrossRef]
- Soares, S.; Rosado, T.; Barroso, M.; Gallardo, E. New method for the monitoring of antidepressants in oral fluid using dried spot sampling. Pharmaceuticals 2021, 14, 1284. [Google Scholar] [CrossRef]
- Han, Y.; Li, X.-L.; Zhang, M.; Wang, J.; Zeng, S.; Min, J.Z. Potential use of a dried saliva spot (DSS) in therapeutic drug monitoring and disease diagnosis. J. Pharm. Anal. 2021. [Google Scholar] [CrossRef]
- Arntson, A.; Ofsa, B.; Lancaster, D.; Simon, J.R.; McMullin, M.; Logan, B. Validation of a novel immunoassay for the detection of synthetic cannabinoids and metabolites in urine specimens. J. Anal. Toxicol. 2013, 37, 284–290. [Google Scholar] [CrossRef]
- Nieddu, M.; Trignano, C.; Burrai, L.; Pirisi, M.A.; Boatto, G. Cross-reactivities of 41 new amphetamine designer drugs to EMIT® immunoassays. Forensic Toxicol. 2013, 31, 133–137. [Google Scholar] [CrossRef]
- Mostowtt, T.; McCord, B. Surface enhanced Raman spectroscopy (SERS) as a method for the toxicological analysis of synthetic cannabinoids. Talanta 2017, 164, 396–402. [Google Scholar] [CrossRef]
- Krieg, A.K.; Gauglitz, G. Ultrasensitive label-free immunoassay for optical determination of amitriptyline and related tricyclic antidepressants in human serum. Anal. Chem. 2015, 87, 8845–8850. [Google Scholar] [CrossRef]
- Barnes, A.J.; Young, S.; Spinelli, E.; Martin, T.M.; Klette, K.L.; Huestis, M.A. Evaluation of a homogenous enzyme immunoassay for the detection of synthetic cannabinoids in urine. Forensic Sci. Int. 2014, 241, 27–34. [Google Scholar] [CrossRef]
- Grüner, N.; Stambouli, O.; Ross, R.S. Dried blood spots-preparing and processing for use in immunoassays and in molecular techniques. JoVE (J. Vis. Exp.) 2015, 97, e52619. [Google Scholar] [CrossRef]
- Dronova, M.; Smolianitski, E.; Lev, O. Electrooxidation of new synthetic cannabinoids: Voltammetric determination of drugs in seized street samples and artificial saliva. Anal. Chem. 2016, 88, 4487–4494. [Google Scholar] [CrossRef] [PubMed]
- Wolff, K.; Agombar, R.; Clatworthy, A.; Cowan, D.; Forrest, R.; Osselton, D.; Scott-Ham, M.; Johnston, A. Expert Panel Review of Alternative Biological Matrices for Use as an Evidential Sample for Drug Driving; National Academies of Sciences, Engineering, and Medicine: Washington, DC, USA, 2017. [Google Scholar]
- Williams, D.; Sebastine, I. Tissue engineering and regenerative medicine: Manufacturing challenges. IEE Proc. Nanobiotechnol. 2005, 152, 207–210. [Google Scholar] [CrossRef] [PubMed]
- Farquharson, S.; Shende, C.; Sengupta, A.; Huang, H.; Inscore, F. Rapid detection and identification of overdose drugs in saliva by surface-enhanced Raman scattering using fused gold colloids. Pharmaceutics 2011, 3, 425–439. [Google Scholar] [CrossRef] [PubMed]
- Dana, K.; Shende, C.; Huang, H.; Farquharson, S. Rapid analysis of cocaine in saliva by surface-enhanced Raman spectroscopy. J. Anal. Bioanal. Tech. 2015, 6, 1. [Google Scholar] [PubMed]
- Feng, S.; Huang, S.; Lin, D.; Chen, G.; Xu, Y.; Li, Y.; Huang, Z.; Pan, J.; Chen, R.; Zeng, H. Surface-enhanced Raman spectroscopy of saliva proteins for the noninvasive differentiation of benign and malignant breast tumors. Int. J. Nanomed. 2015, 10, 537. [Google Scholar] [CrossRef]
- Sharma, B.; Frontiera, R.R.; Henry, A.-I.; Ringe, E.; Van Duyne, R.P. SERS: Materials, applications, and the future. Mater. Today 2012, 15, 16–25. [Google Scholar] [CrossRef]
- Rodriguez, R.D.; Sheremet, E.; Nesterov, M.; Moras, S.; Rahaman, M.; Weiss, T.; Hietschold, M.; Zahn, D.R. Aluminum and copper nanostructures for surface-enhanced Raman spectroscopy: A one-to-one comparison to silver and gold. Sens. Actuators B Chem. 2018, 262, 922–927. [Google Scholar] [CrossRef]
- He, S.; Chua, J.; Tan, E.K.M.; Kah, J.C.Y. Optimizing the SERS enhancement of a facile gold nanostar immobilized paper-based SERS substrate. RSC Adv. 2017, 7, 16264–16272. [Google Scholar] [CrossRef]
- Zhang, W.; Liu, J.; Niu, W.; Yan, H.; Lu, X.; Liu, B.J. Tip-selective growth of silver on gold nanostars for surface-enhanced raman scattering. ACS Appl. Mater. Interfaces 2018, 10, 14850–14856. [Google Scholar] [CrossRef]
- Oliveira, M.J.; Quaresma, P.; Peixoto de Almeida, M.; Araújo, A.; Pereira, E.; Fortunato, E.; Martins, R.; Franco, R.; Águas, H. Office paper decorated with silver nanostars-an alternative cost effective platform for trace analyte detection by SERS. Sci. Rep. 2017, 7, 2480. [Google Scholar] [CrossRef]
- Fierro-Mercado, P.M.; Hernández-Rivera, S.P. Highly sensitive filter paper substrate for SERS trace explosives detection. Int. J. Spectrosc. 2012, 2012, 716527. [Google Scholar] [CrossRef]
- Ngo, Y.H.; Li, D.; Simon, G.P.; Garnier, G. Gold nanoparticle–paper as a three-dimensional surface enhanced Raman scattering substrate. Langmuir 2012, 28, 8782–8790. [Google Scholar] [CrossRef] [PubMed]
- Nguyen, B.H.; Nguyen, V.H.; Tran, H.N. Rich variety of substrates for surface enhanced Raman spectroscopy. Nanotechnol. Adv. Nat. Sci. Nanosci. Nanotechnol. 2016, 7, 033001. [Google Scholar] [CrossRef]
- Mosier-Boss, P.A. Review of SERS substrates for chemical sensing. Nanomaterials 2017, 7, 142. [Google Scholar] [CrossRef]
- Živanović, V.; Madzharova, F.; Heiner, Z.; Arenz, C.; Kneipp, J. Specific interaction of tricyclic antidepressants with gold and silver nanostructures as revealed by combined one-and two-photon vibrational spectroscopy. J. Phys. Chem. C 2017, 121, 22958–22968. [Google Scholar] [CrossRef]
- Sun, F.; Hung, H.-C.; Sinclair, A.; Zhang, P.; Bai, T.; Galvan, D.D.; Jain, P.; Li, B.; Jiang, S.; Yu, Q. Hierarchical zwitterionic modification of a SERS substrate enables real-time drug monitoring in blood plasma. Nat. Commun. 2016, 7, 13437. [Google Scholar] [CrossRef]
- Lee, P.; Meisel, D. Adsorption and surface-enhanced Raman of dyes on silver and gold sols. J. Phys. Chem. 1982, 86, 3391–3395. [Google Scholar] [CrossRef]
- McLaughlin, G.; Doty, K.C.; Lednev, I.K. Discrimination of human and animal blood traces via Raman spectroscopy. Forensic Sci. Int. 2014, 238, 91–95. [Google Scholar] [CrossRef]
- Paramelle, D.; Sadovoy, A.; Gorelik, S.; Free, P.; Hobley, J.; Fernig, D.G. A rapid method to estimate the concentration of citrate capped silver nanoparticles from UV-visible light spectra. Analyst 2014, 139, 4855–4861. [Google Scholar] [CrossRef]
- Bibikova, O.; Haas, J.; López-Lorente, Á.I.; Popov, A.; Kinnunen, M.; Ryabchikov, Y.; Kabashin, A.; Meglinski, I.; Mizaikoff, B. Surface enhanced infrared absorption spectroscopy based on gold nanostars and spherical nanoparticles. Anal. Chim. Acta 2017, 990, 141–149. [Google Scholar] [CrossRef]
- Kurrey, R.; Deb, M.K.; Shrivas, K. Surface enhanced infra-red spectroscopy with modified silver nanoparticles (AgNPs) for detection of quaternary ammonium cationic surfactants. New J. Chem. 2019, 43, 8109–8121. [Google Scholar] [CrossRef]
- Zhang, K.; Wang, M.; Wu, M.; Wu, Q.; Liu, J.; Yang, J.; Zhang, J. Fabrication of robust superhydrophobic filter paper for oil/water separation based on the combined octadecanoyl chain bonding and polymer grafting via surface-initiated ATRP. Cellulose 2020, 27, 469–480. [Google Scholar] [CrossRef]
- Ou, R.; Xie, Y.; Shen, X.; Yuan, F.; Wang, H.; Wang, Q. Solid biopolymer electrolytes based on all-cellulose composites prepared by partially dissolving cellulosic fibers in the ionic liquid 1-butyl-3-methylimidazolium chloride. J. Mater. Sci. 2012, 47, 5978–5986. [Google Scholar] [CrossRef]
- Yu, P.; Yu, H.; Sun, Q.; Ma, B. Filter paper supported nZVI for continuous treatment of simulated dyeing wastewater. Sci. Rep. 2019, 9, 11322. [Google Scholar] [CrossRef] [PubMed]
- Wu, L.M.; Tong, D.S.; Zhao, L.Z.; Yu, W.H.; Zhou, C.H.; Wang, H. Fourier transform infrared spectroscopy analysis for hydrothermal transformation of microcrystalline cellulose on montmorillonite. Appl. Clay Sci. 2014, 95, 74–82. [Google Scholar] [CrossRef]
- Barth, A. Infrared spectroscopy of proteins. Biochim. Biophys. Acta Bioenerg. 2007, 1767, 1073–1101. [Google Scholar] [CrossRef] [PubMed]
- Surewicz, W.K.; Mantsch, H.H.; Chapman, D. Determination of protein secondary structure by Fourier transform infrared spectroscopy: A critical assessment. Biochemistry 1993, 32, 389–394. [Google Scholar] [CrossRef]
- Dovbeshko, G.I.; Gridina, N.Y.; Kruglova, E.B.; Pashchuk, O.P. FTIR spectroscopy studies of nucleic acid damage. Talanta 2000, 53, 233–246. [Google Scholar] [CrossRef]
- Góralski, P. Interactions between cholesterol and triacylglycerols in carbon tetrachloride: Calorimetric and spectroscopic studies. Thermochim. Acta 1996, 274, 45–52. [Google Scholar] [CrossRef]
- Jessen, T.E.; Höskuldsson, A.T.; Bjerrum, P.J.; Verder, H.; Sørensen, L.; Bratholm, P.S.; Christensen, B.; Jensen, L.S.; Jensen, M.A.B. Simultaneous determination of glucose, triglycerides, urea, cholesterol, albumin and total protein in human plasma by Fourier transform infrared spectroscopy: Direct clinical biochemistry without reagents. Clin. Biochem. 2014, 47, 1306–1312. [Google Scholar] [CrossRef]
- Rohman, A.; Windarsih, A.; Lukitaningsih, E.; Rafi, M.; Betania, K.; Fadzillah, N.A. The use of FTIR and Raman spectroscopy in combination with chemometrics for analysis of biomolecules in biomedical fluids: A review. Biomed. Spectrosc. Imaging 2019, 8, 55–71. [Google Scholar] [CrossRef]
- Kalyani, G.; Adjuad, B.; Baghel, D.B.D.; Sahu, C.; Singh, R. Formulation and in-vitro evaluation of sustained release matrix tablet of amitriptyline. World J. Pharm. Pharm. Sci. 2016, 5, 1313–1327. [Google Scholar]
- Hoppmann, E.P.; Yu, W.W.; White, I.M. Highly sensitive and flexible inkjet printed SERS sensors on paper. Methods 2013, 63, 219–224. [Google Scholar] [CrossRef] [PubMed]
- Jaworska, A.; Malek, K. A comparison between adsorption mechanism of tricyclic antidepressants on silver nanoparticles and binding modes on receptors. Surface-enhanced Raman spectroscopy studies. J. Colloid Interface Sci. 2014, 431, 117–124. [Google Scholar] [CrossRef]
- Lin, S.; Lin, X.; Lou, X.-T.; Yang, F.; Lin, D.-Y.; Lu, Z.W. Rapid fabrication of self-assembled interfacial film decorated filter paper as an excellent surface-enhanced Raman scattering substrate. Anal. Methods 2014, 6, 9547–9553. [Google Scholar]
- Wu, D.; Fang, Y. The adsorption behavior of p-hydroxybenzoic acid on a silver-coated filter paper by surface enhanced Raman scattering. J. Colloid Interface Sci. 2003, 265, 234–238. [Google Scholar] [CrossRef]
- Joshi, N.; Jain, N.; Pathak, A.; Singh, J.; Prasad, R.; Upadhyaya, C.P. Biosynthesis of silver nanoparticles using Carissa carandas berries and its potential antibacterial activities. J. Sol-Gel Sci. Technol. 2018, 86, 682–689. [Google Scholar] [CrossRef]
- Cai, Y.; Piao, X.; Gao, W.; Zhang, Z.; Nie, E.; Sun, Z. Large-scale and facile synthesis of silver nanoparticles via a microwave method for a conductive pen. RSC Adv. 2017, 7, 34041–34048. [Google Scholar] [CrossRef]
- Tan, C.; Zhang, Z.; Qu, Y.; He, L. Ag2O/TiO2 nanocomposite heterostructure as a dual functional semiconducting substrate for SERS/SEIRAS application. Langmuir 2017, 33, 5345–5352. [Google Scholar] [CrossRef]
- Chong, N.S.; Smith, K.A.; Setti, S.; Ooi, B.G. Application of gold and silver colloidal nanoparticles for the surface-enhanced Raman spectrometric analysis of melamine and 4-aminobiphenyl. Int. J. Environ. Technol. Manag. 2013, 16, 3–20. [Google Scholar]
- Binks, M.J.; Bleakley, A.S.; Rathnayake, G.; Pizzutto, S.; Chang, A.B.; McWhinney, B.; Ungerer, J. Can dried blood spots be used to accurately measure vitamin D metabolites? Clin. Chim. Acta 2021, 518, 70–77. [Google Scholar] [CrossRef]
- Han, Y.; Shi, Q.; Xu, C.-Y.; Di, L.; Zhao, L.-L.; Jin, W.; Min, J.Z. A convenient sampling and noninvasive dried spot method of uric acid in human saliva: Comparison of serum uric acid value and salivary uric acid in healthy volunteers and hyperuricemia patients. J. Chromatogr. B 2021, 1164, 122528. [Google Scholar] [CrossRef]
- Franci, G.; Falanga, A.; Galdiero, S.; Palomba, L.; Rai, M.; Morelli, G.; Galdiero, M. Silver nanoparticles as potential antibacterial agents. Molecules 2015, 20, 8856–8874. [Google Scholar] [CrossRef]
- Tang, S.; Zheng, J. Antibacterial activity of silver nanoparticles: Structural effects. Adv. Healthc. Mater. 2018, 7, 1701503. [Google Scholar] [CrossRef]
- Baker, C.; Pradhan, A.; Pakstis, L.; Pochan, D.J.; Shah, S.I. Synthesis and antibacterial properties of silver nanoparticles. J. Nanosci. Nanotechnol. 2005, 5, 244–249. [Google Scholar] [CrossRef]
- Atkins, C.G.; Buckley, K.; Blades, M.W.; Turner, R.F. Raman spectroscopy of blood and blood components. Appl. Spectrosc. 2017, 71, 767–793. [Google Scholar] [CrossRef]
- Doty, K.C.; Muro, C.K.; Lednev, I.K. Predicting the time of the crime: Bloodstain aging estimation for up to two years. Forensic Chem. 2017, 5, 1–7. [Google Scholar] [CrossRef]
- Takamura, A.; Watanabe, D.; Shimada, R.; Ozawa, T. Comprehensive modeling of bloodstain aging by multivariate Raman spectral resolution with kinetics. Commun. Chem. 2019, 2, 115. [Google Scholar] [CrossRef]
- Chen, Y.; Liang, J.; Liu, L.; Lu, X.; Deng, J.; Pozdnyakov, I.P.; Zuo, Y. Photosensitized degradation of amitriptyline and its active metabolite nortriptyline in aqueous fulvic acid solution. J. Environ. Qual. 2017, 46, 1081–1087. [Google Scholar] [CrossRef]
- Carlomagno, C.; Banfi, P.; Gualerzi, A.; Picciolini, S.; Volpato, E.; Meloni, M.; Lax, A.; Colombo, E.; Ticozzi, N.; Verde, F.; et al. Human salivary Raman fingerprint as biomarker for the diagnosis of Amyotrophic Lateral Sclerosis. Sci. Rep. 2020, 10, 10175. [Google Scholar] [CrossRef]
- Chiappin, S.; Antonelli, G.; Gatti, R.; Elio, F. Saliva specimen: A new laboratory tool for diagnostic and basic investigation. Clin. Chim. Acta 2007, 383, 30–40. [Google Scholar] [CrossRef]
- Qiu, S.; Xu, Y.; Huang, L.; Zheng, W.; Huang, C.; Huang, S.; Lin, J.; Lin, D.; Feng, S.; Chen, R.; et al. Non-invasive detection of nasopharyngeal carcinoma using saliva surface-enhanced Raman spectroscopy. Oncol. Lett. 2016, 11, 884–890. [Google Scholar] [CrossRef]
- Ma, L.; Zhang, Z.; Li, X. Non-invasive disease diagnosis using surface-enhanced Raman spectroscopy of urine and saliva. Appl. Spectrosc. Rev. 2020, 55, 197–219. [Google Scholar] [CrossRef]
- Zamora-Mendoza, B.; Espinosa-Tanguma, R.; Ramírez-Elías, M.; Cabrera-Alonso, R.; Montero-Moran, G.; Portales-Pérez, D.; Rosales-Romo, J.; Gonzalez, J.; Gonzalez, C. Surface-enhanced raman spectroscopy: A non invasive alternative procedure for early detection in childhood asthma biomarkers in saliva. Photodiagnosis Photodyn. Ther. 2019, 27, 85–91. [Google Scholar] [CrossRef]
- Joye, T.; Sidibé, J.; Déglon, J.; Karmime, A.; Sporkert, F.; Widmer, C.; Favrat, B.; Lescuyer, P.; Augsburger, M.; Thomas, A. Liquid chromatography-high resolution mass spectrometry for broad-spectrum drug screening of dried blood spot as microsampling procedure. Anal. Chim. Acta 2019, 1063, 110–116. [Google Scholar] [CrossRef]
- Stern, M.; Giebels, M.; Fey, T.; Lübking, M.; Alferink, J.; Hempel, G. Validation and clinical application of a volumetric absorptive microsampling method for 14 psychiatric drugs. Bioanalysis 2020, 12, 1129–1147. [Google Scholar] [CrossRef]
- Guzinski, M.; Lindner, E.; Pendley, B.; Chaum, E. Electrochemical sensor for tricyclic antidepressants with low nanomolar detection limit: Quantitative Determination of Amitriptyline and Nortriptyline in blood. Talanta 2022, 239, 123072. [Google Scholar] [CrossRef]
- Zoheira Bagheri, N.; Fariba Garkani, N. Electrochemical Sensor Based on a Modified Graphite Screen Printed Electrode for Amitriptyline Determination. Surf. Eng. Appl. Electrochem. 2022, 58, 100–108. [Google Scholar] [CrossRef]
- Sanguarnsak, C.; Promsuwan, K.; Saichanapan, J.; Soleh, A.; Saisahas, K.; Phua, C.H.; Limbut, W. Voltammetric Amitriptyline Determination Using a Metal-Free Electrode Based on Phosphorus-Doped Multi-Walled Carbon Nanotubes. J. Electrochem. Soc. 2022, 169, 017510. [Google Scholar] [CrossRef]


| Type of Precision | Spiked Amount of AMT (ppb) | 350 | 650 | 850 | |
|---|---|---|---|---|---|
| Analytical Variables | |||||
| Intraday | Day 1 | Number of experiments | 3 | 3 | 3 |
| Mean | 341.366 | 622.985 | 814.943 | ||
| Relative standard deviation | 3.048% | 2.017% | 4.121% | ||
| Error | 2.467% | 4.156% | 4.124% | ||
| Day 2 | Number of experiments | 3 | 3 | 3 | |
| Mean | 332.163 | 601.582 | 809.192 | ||
| Relative standard deviation | 3.438% | 2.473% | 2.539% | ||
| Error | 5.096% | 7.449% | 4.801% | ||
| Day 3 | Number of experiments | 3 | 3 | 3 | |
| Mean | 321.797 | 582.324 | 799.176 | ||
| Relative standard deviation | 4.198% | 2.291% | 2.201% | ||
| Error | 8.058% | 10.412% | 5.979% | ||
| Interday | Number of experiments | 9 | 9 | 9 | |
| Mean | 331.775 | 602.297 | 807.770 | ||
| Relative standard deviation | 4.012% | 3.521% | 2.803% | ||
| Error | 5.207% | 7.339% | 4.968% | ||
| Spiked Amount of AMT | 350 ppb | 650 ppb | 850 ppb | |||
|---|---|---|---|---|---|---|
| Intraday | Interday | Intraday | Interday | Intraday | Interday | |
| Number of experiments | 3 | 9 | 3 | 9 | 3 | 9 |
| Mean | 338.11 | 332.02 | 612.15 | 609.20 | 818.770 | 801.04 |
| Relative standard deviation | 2.030% | 3.964% | 3.015% | 3.149% | 3.511% | 4.472% |
| Error | 3.397% | 5.137% | 5.823% | 6.277% | 3.674% | 5.760% |
| Spiked Amount of AMT | 350 ppb | 650 ppb | 850 ppb | |||
|---|---|---|---|---|---|---|
| Intraday | Interday | Intraday | Interday | Intraday | Interday | |
| Number of experiments | 3 | 9 | 3 | 9 | 3 | 9 |
| Mean | 329.27 | 334.17 | 609.16 | 598.90 | 802.10 | 813.52 |
| Relative standard deviation | 4.012% | 8.330% | 4.251% | 13.727% | 3.618% | 15.204% |
| Error | 5.923% | 4.523% | 6.283% | 7.862% | 5.635% | 4.292% |
| Technique | Sensing Material | LOD | Linear Range | Run Time | Pre-Treatment | Real Sample (s) | Ref. |
|---|---|---|---|---|---|---|---|
| LSV 1 | Plasticized PVC membrane-coated GCE | 3 nM | 3 nM–3 μM | <1 min | None | Bovine serum albumin, whole blood | [100] |
| CV 2 | GO/Fe3O4@SiO2/GSPE | 0.5 μM | 2 μM–1 mM | <1 min | None | Urine, medical tablets | [101] |
| CV | Phosphorus-doped MWCNTs/GCE | 0.15 μg/mL | 0.5 μg/mL–40 μg/mL | <1 min | None | Urine | [102] |
| CV | rGO/7′-methoxy-[1,1′-binaphthalen]-7-ol | 1 ng/mL | 1 ng/mL–80 μg/mL | <1 min | None | NA | [2] |
| LC–MS/MS | --- | 10.4 μg/mL | 20 μg/mL–500 μg/mL | 4.8 min | None | DBS | [4] |
| LC–HRMS 3 | --- | 10 ng/mL | 5 ng/mL–200 ng/mL | 12.5 min | >4 min | DBS | [98] |
| HPLC–MS | --- | 3.91 μg/mL | 3.91 μg/mL–500 μg/mL | 23 min | 50 min | DBS | [99] |
| CE–MS 4 | --- | 1.76 ng/mL | 1.76 ng/mL–300 ng/mL | NA | 3 h | DBS | [3] |
| SERS | AgNP-decorated cellulose filter paper | 95 ng/mL | 100 ng/mL–1.75 μg/mL | <1 min | None | DBS, DSS | This work |
Publisher’s Note: MDPI stays neutral with regard to jurisdictional claims in published maps and institutional affiliations. |
© 2022 by the authors. Licensee MDPI, Basel, Switzerland. This article is an open access article distributed under the terms and conditions of the Creative Commons Attribution (CC BY) license (https://creativecommons.org/licenses/by/4.0/).
Share and Cite
Boroujerdi, R.; Paul, R.; Abdelkader, A. Rapid Detection of Amitriptyline in Dried Blood and Dried Saliva Samples with Surface-Enhanced Raman Spectroscopy. Sensors 2022, 22, 8257. https://doi.org/10.3390/s22218257
Boroujerdi R, Paul R, Abdelkader A. Rapid Detection of Amitriptyline in Dried Blood and Dried Saliva Samples with Surface-Enhanced Raman Spectroscopy. Sensors. 2022; 22(21):8257. https://doi.org/10.3390/s22218257
Chicago/Turabian StyleBoroujerdi, Ramin, Richard Paul, and Amor Abdelkader. 2022. "Rapid Detection of Amitriptyline in Dried Blood and Dried Saliva Samples with Surface-Enhanced Raman Spectroscopy" Sensors 22, no. 21: 8257. https://doi.org/10.3390/s22218257
APA StyleBoroujerdi, R., Paul, R., & Abdelkader, A. (2022). Rapid Detection of Amitriptyline in Dried Blood and Dried Saliva Samples with Surface-Enhanced Raman Spectroscopy. Sensors, 22(21), 8257. https://doi.org/10.3390/s22218257