
High-Precision ADC Spectrum Testing under Non-Coherent Sampling Conditions

Abstract
:1. Introduction
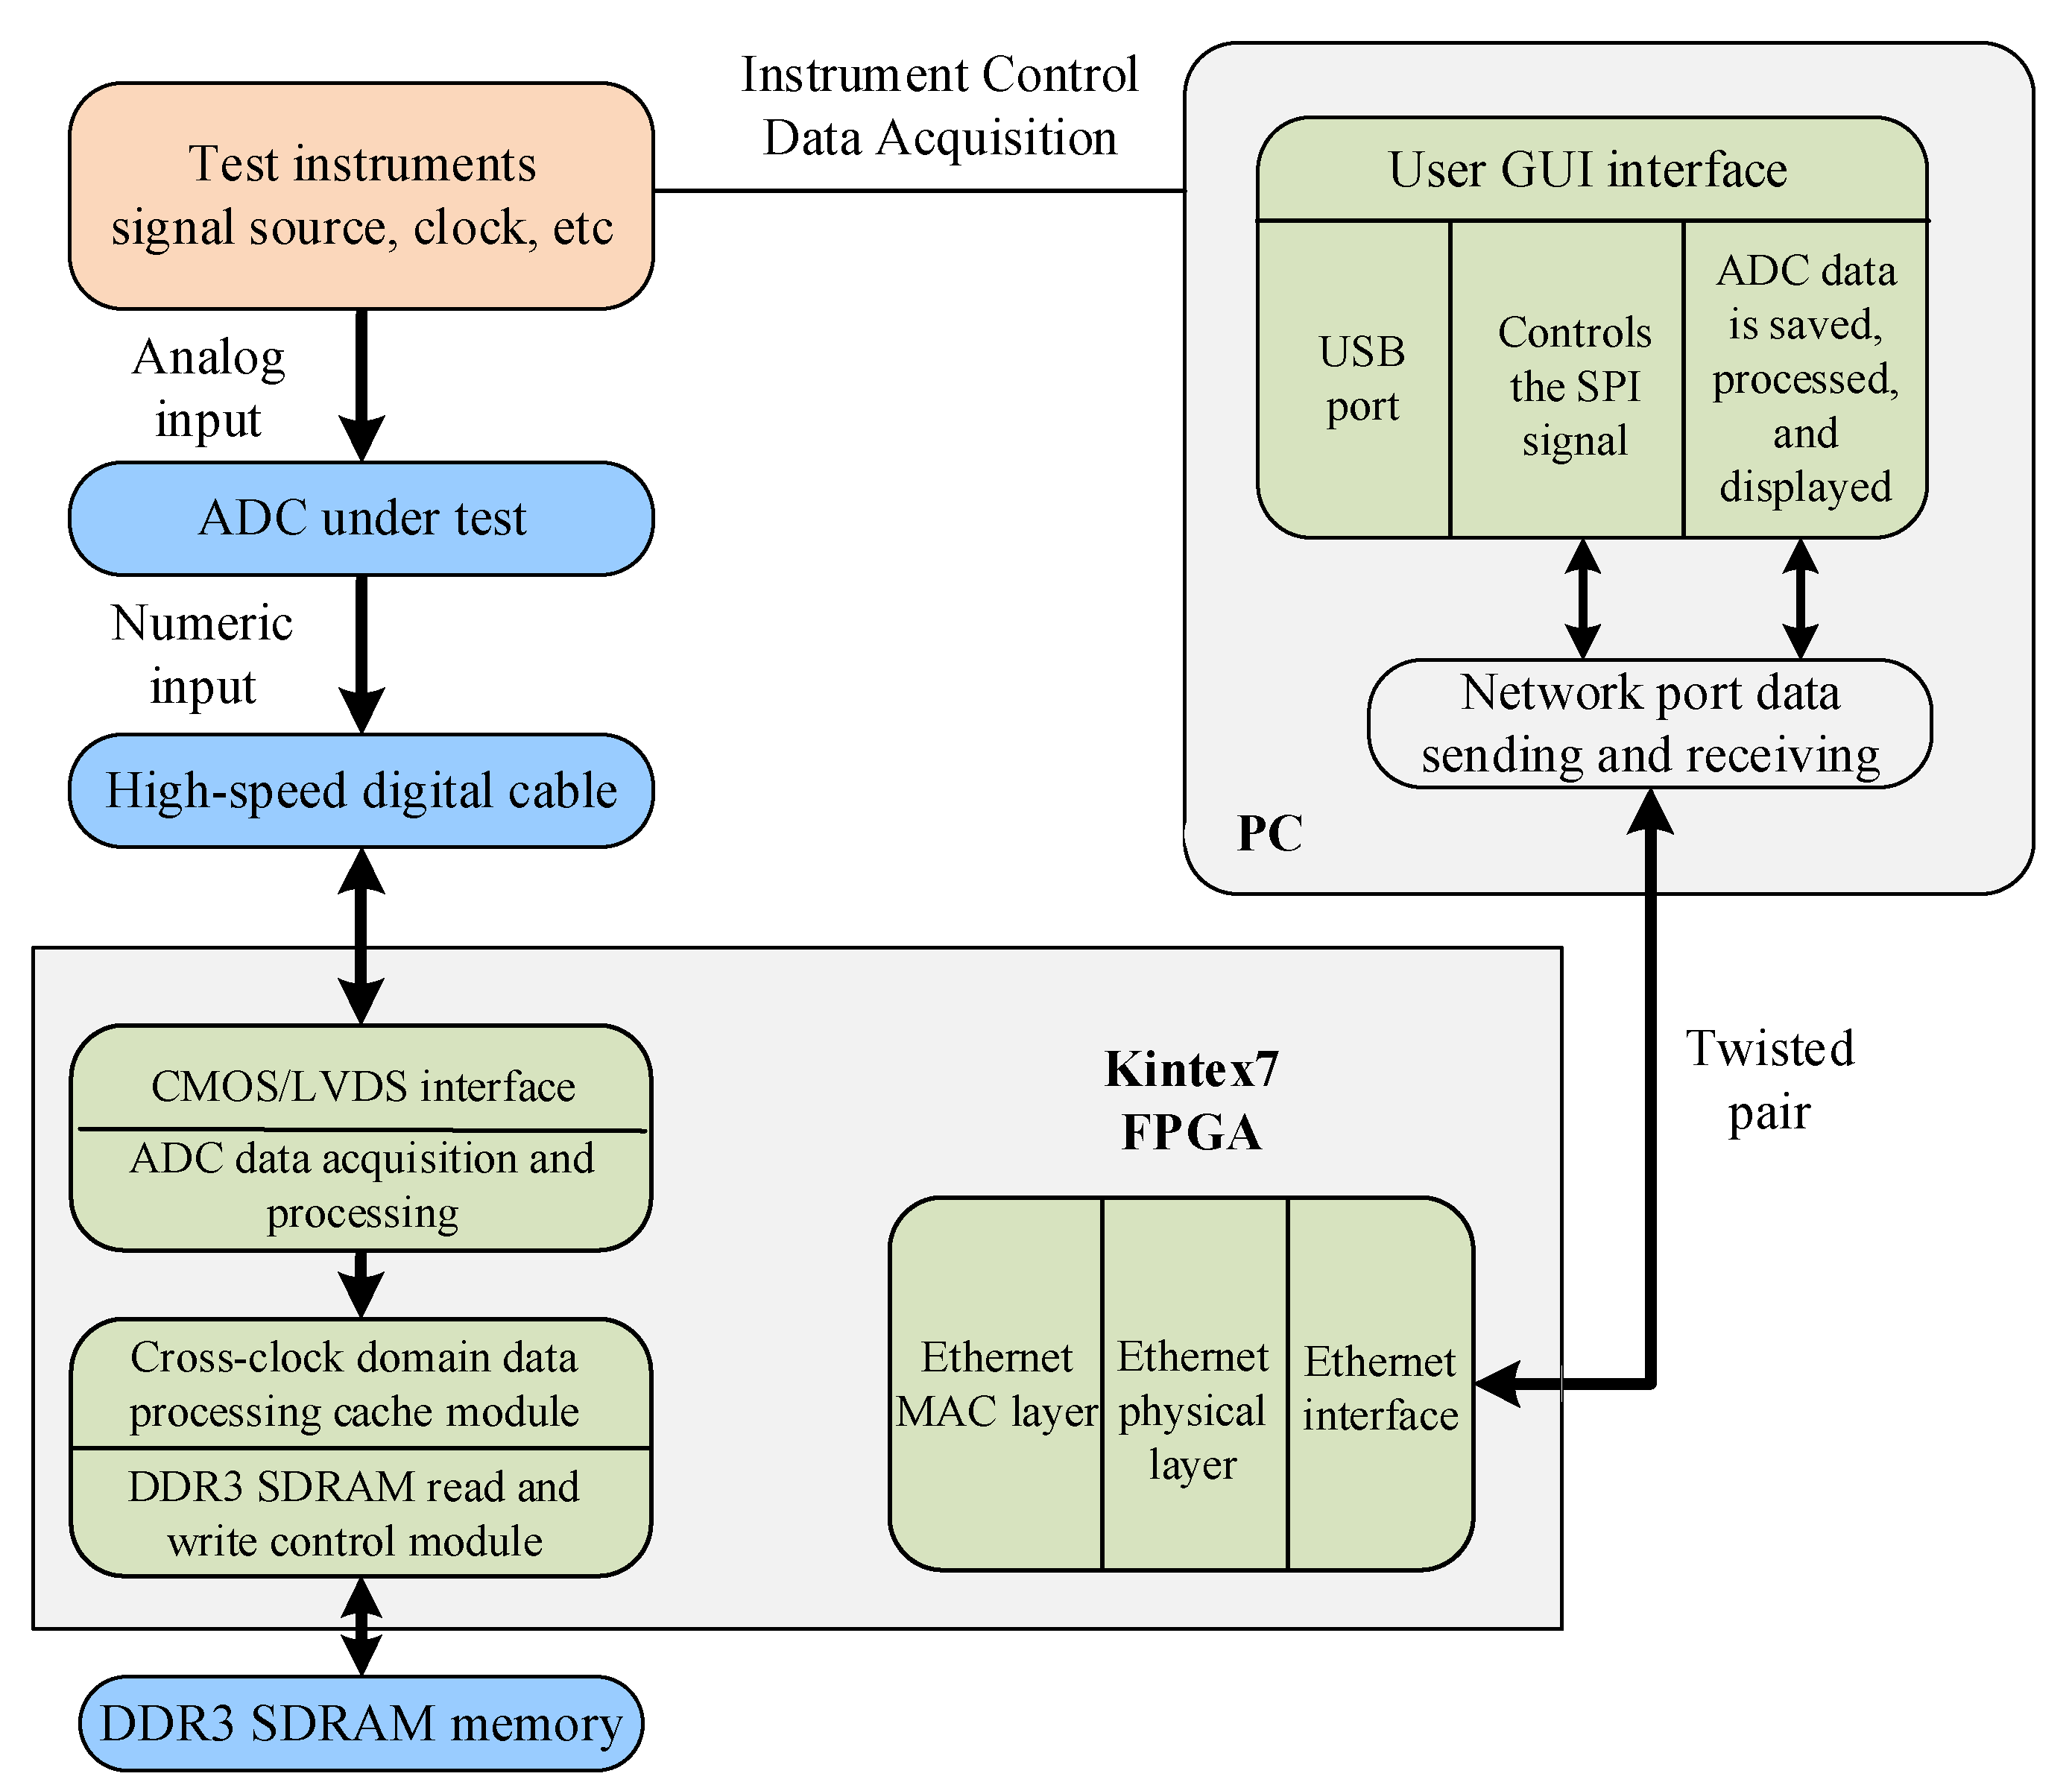
2. ADC Spectrum Testing
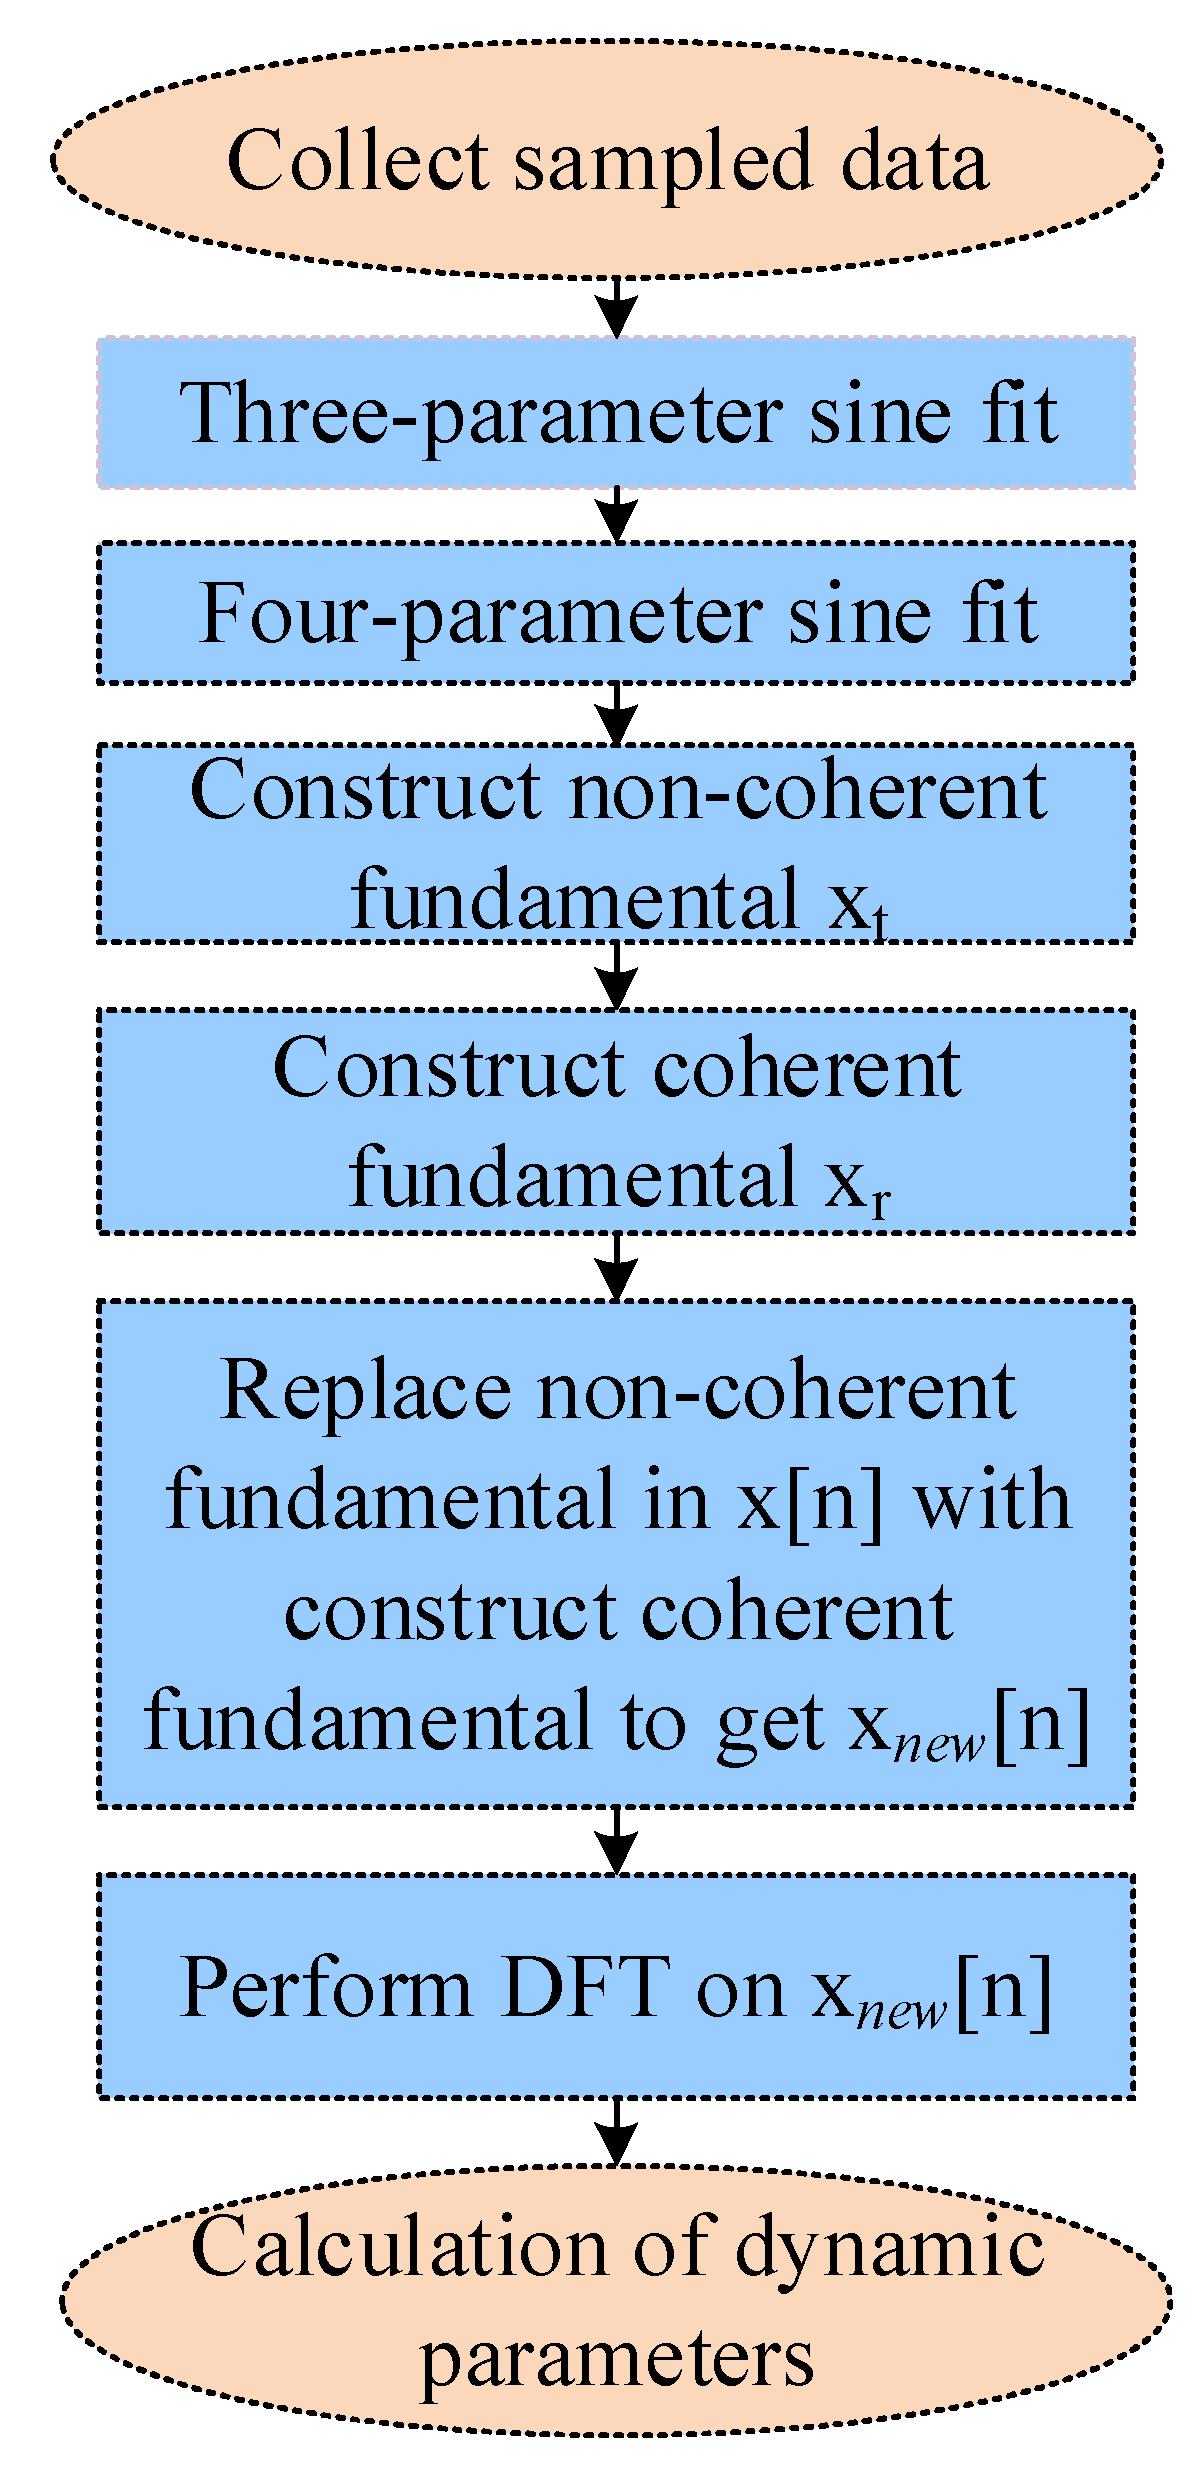
3. Fundamental Waveform Estimation and Reconstruction Algorithm
3.1. Fitting of Sine Test Signals
3.1.1. Three-Parameter Sine-Fitting Method
3.1.2. Four-Parameter Combination Estimation Algorithm
3.2. Reconstructing Coherent Sine Signals
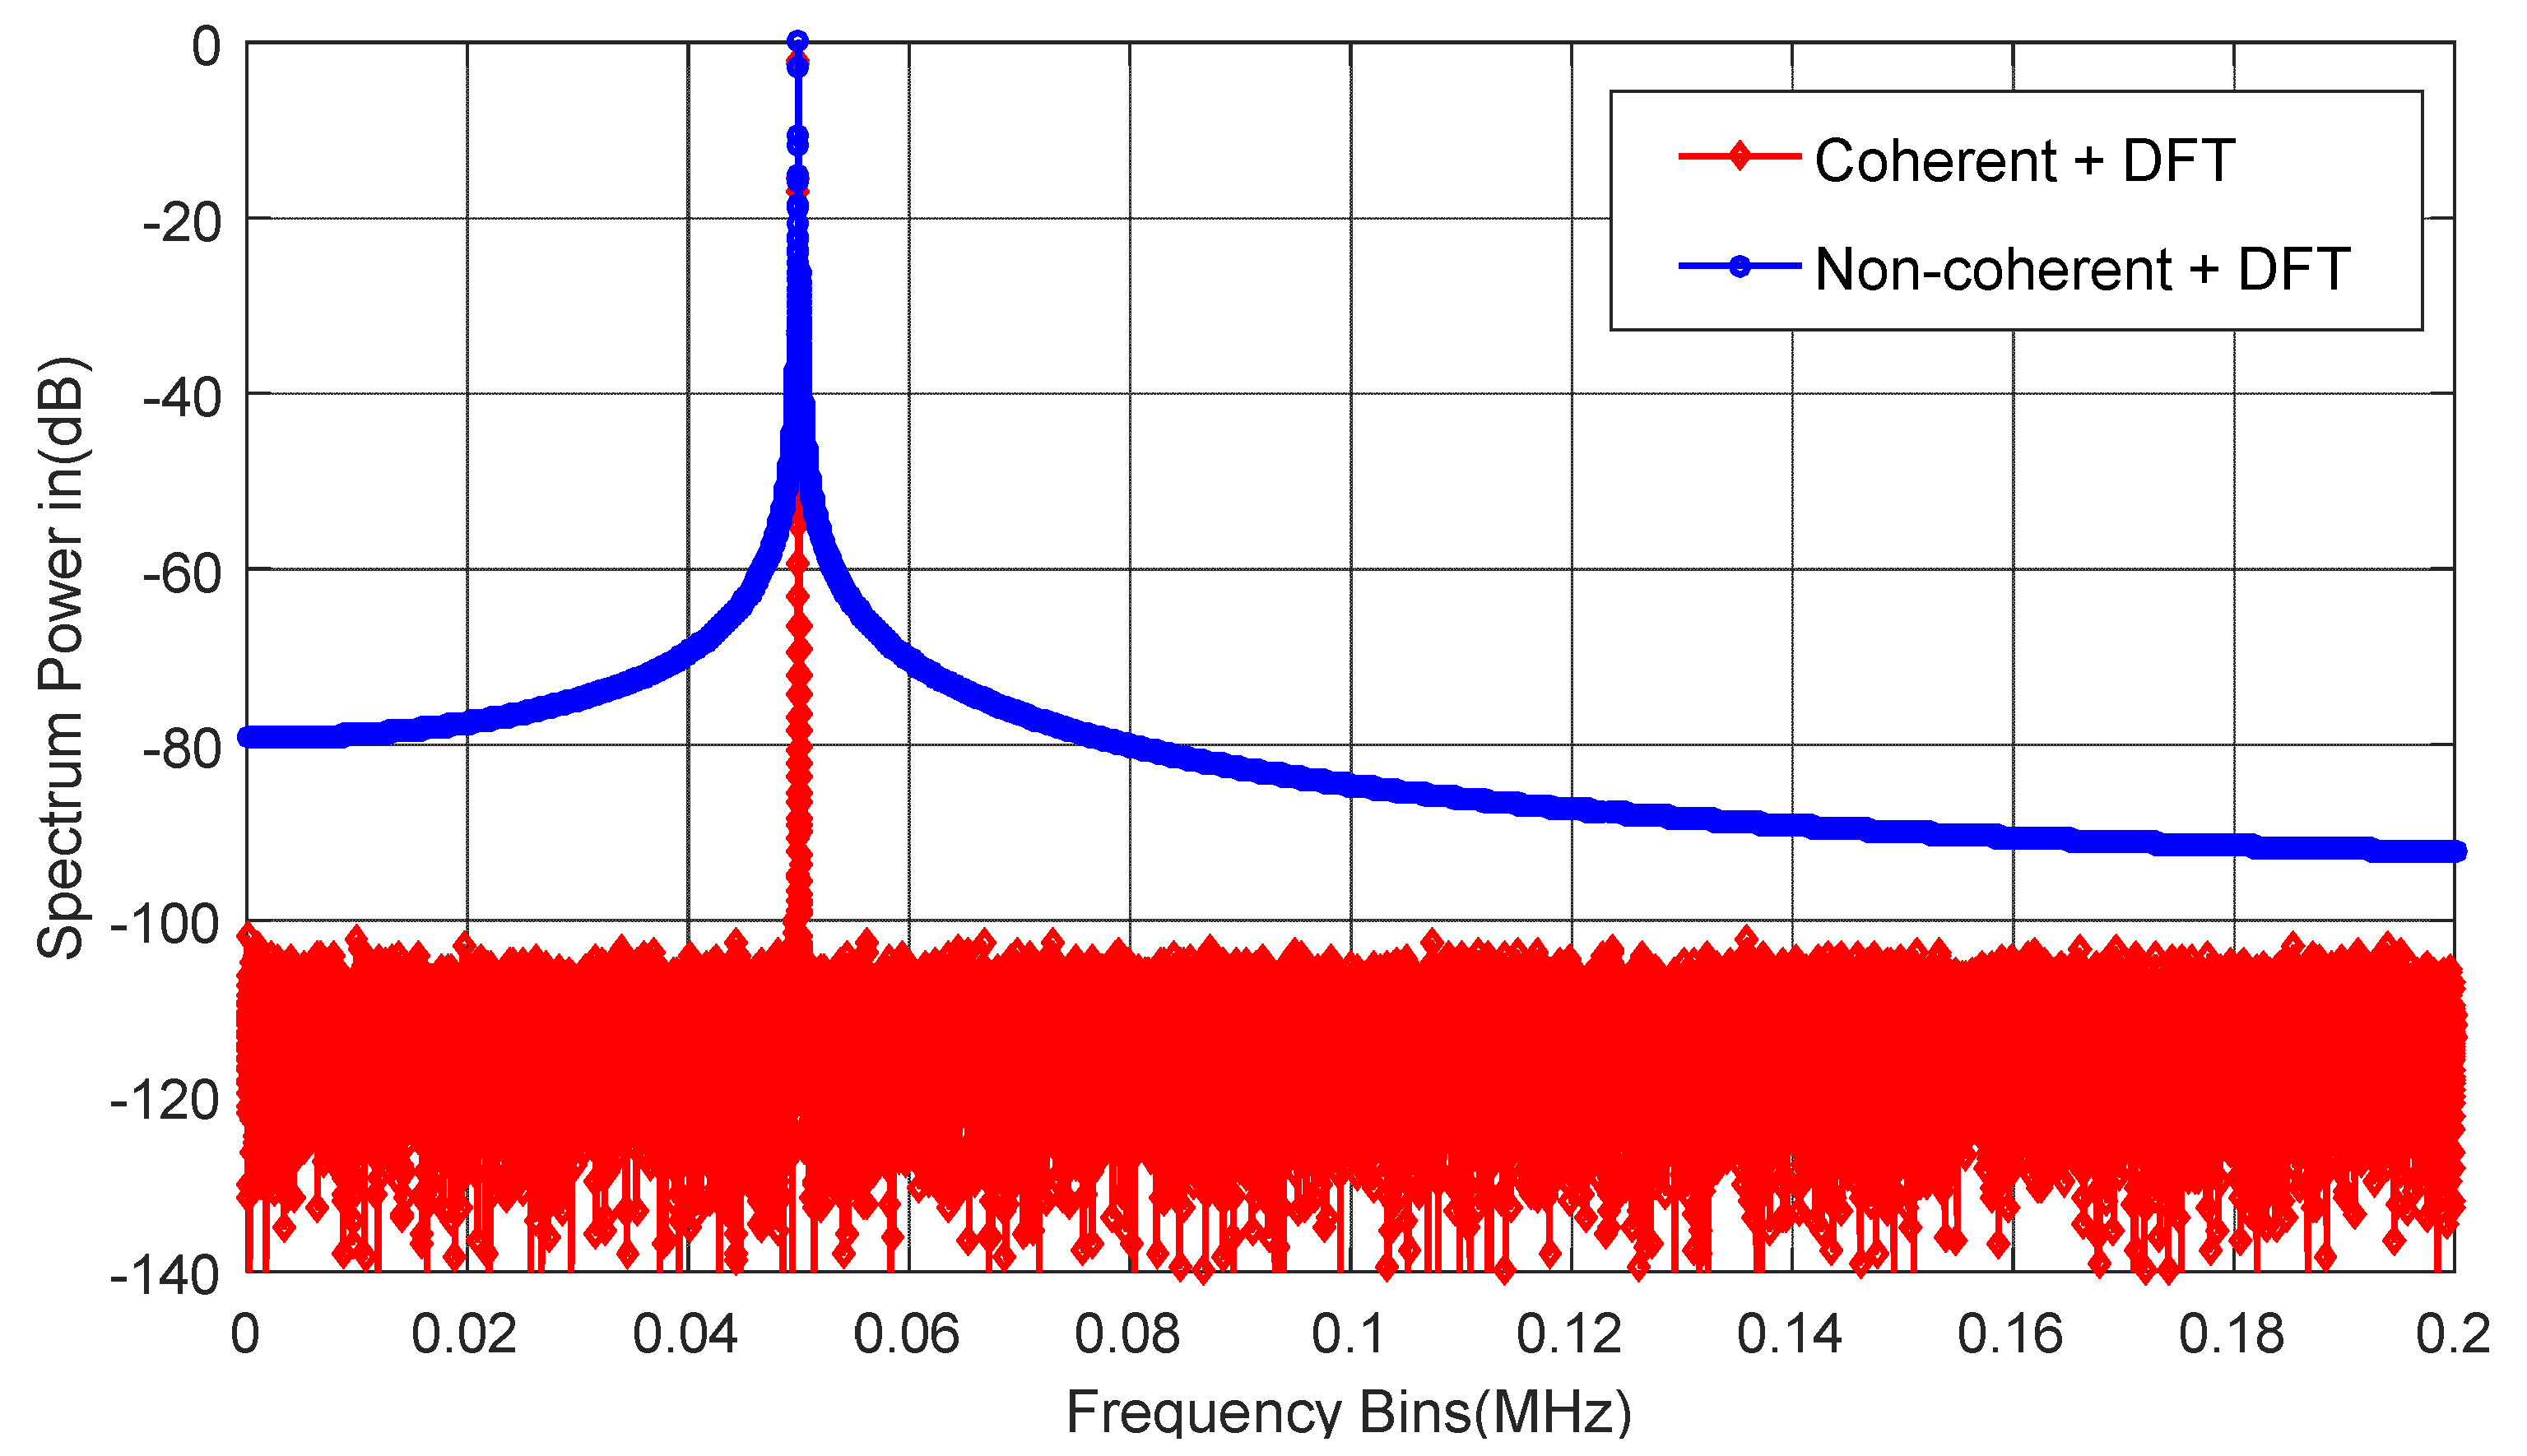
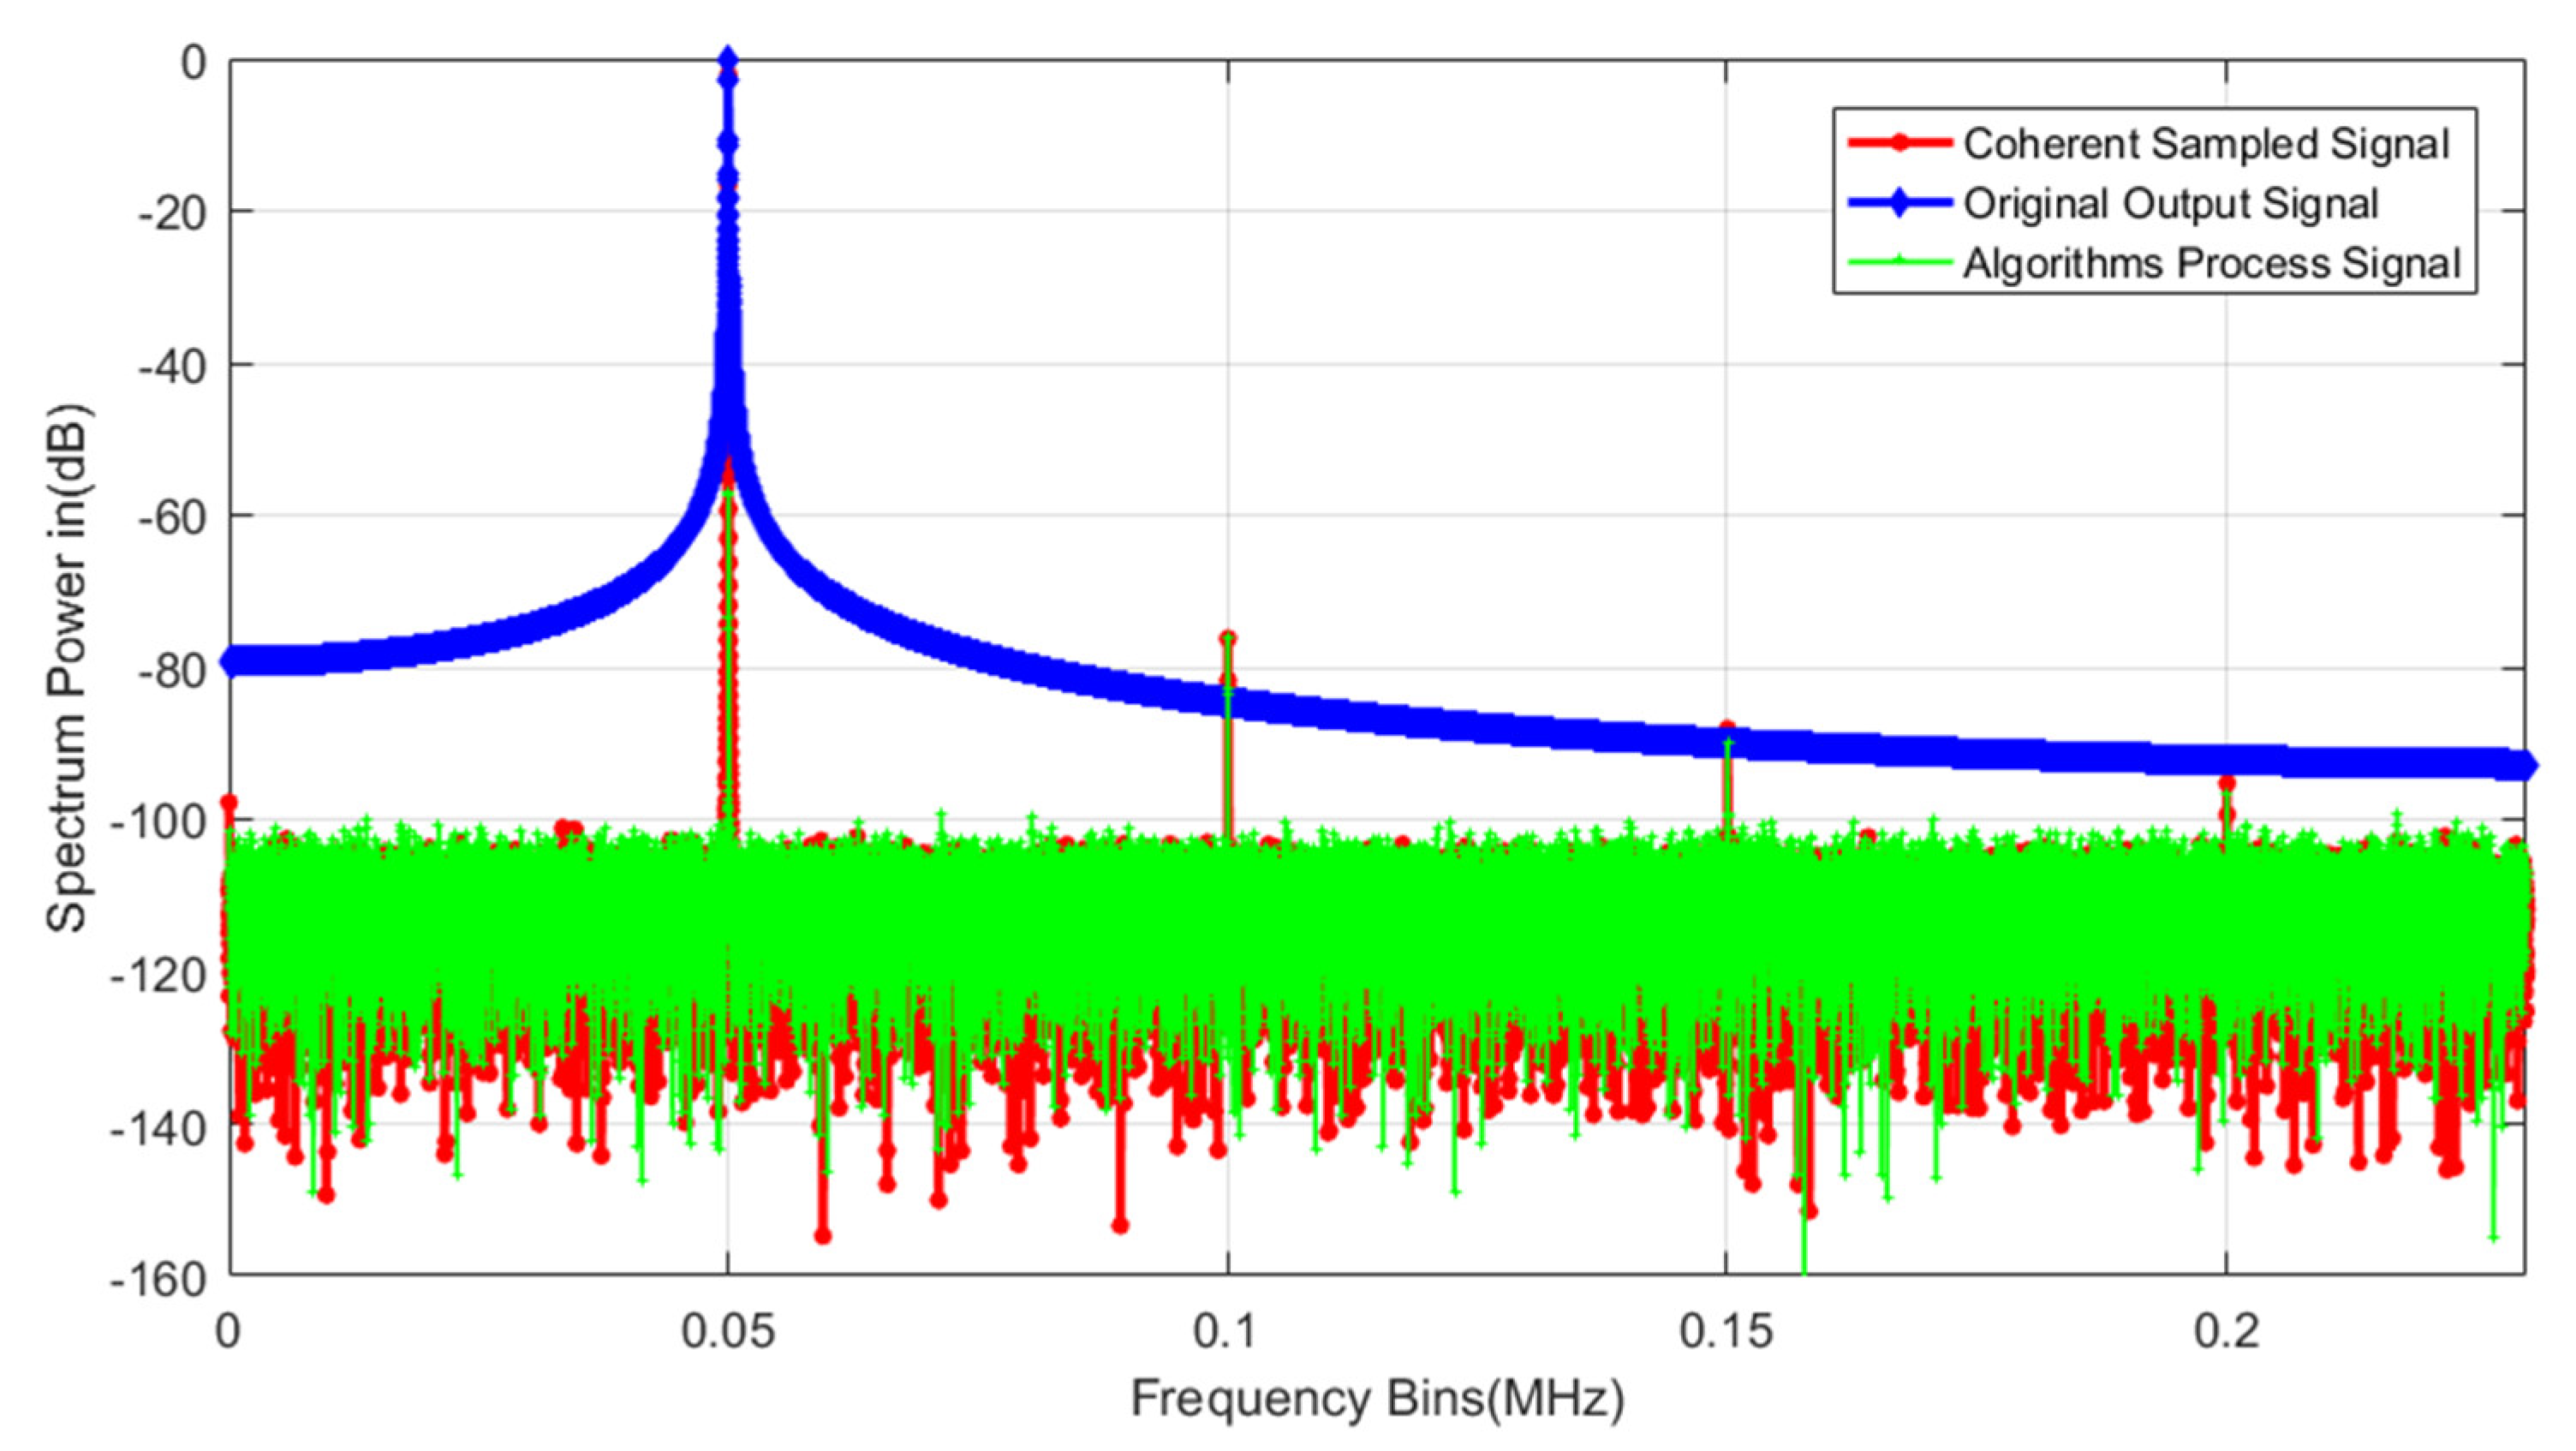
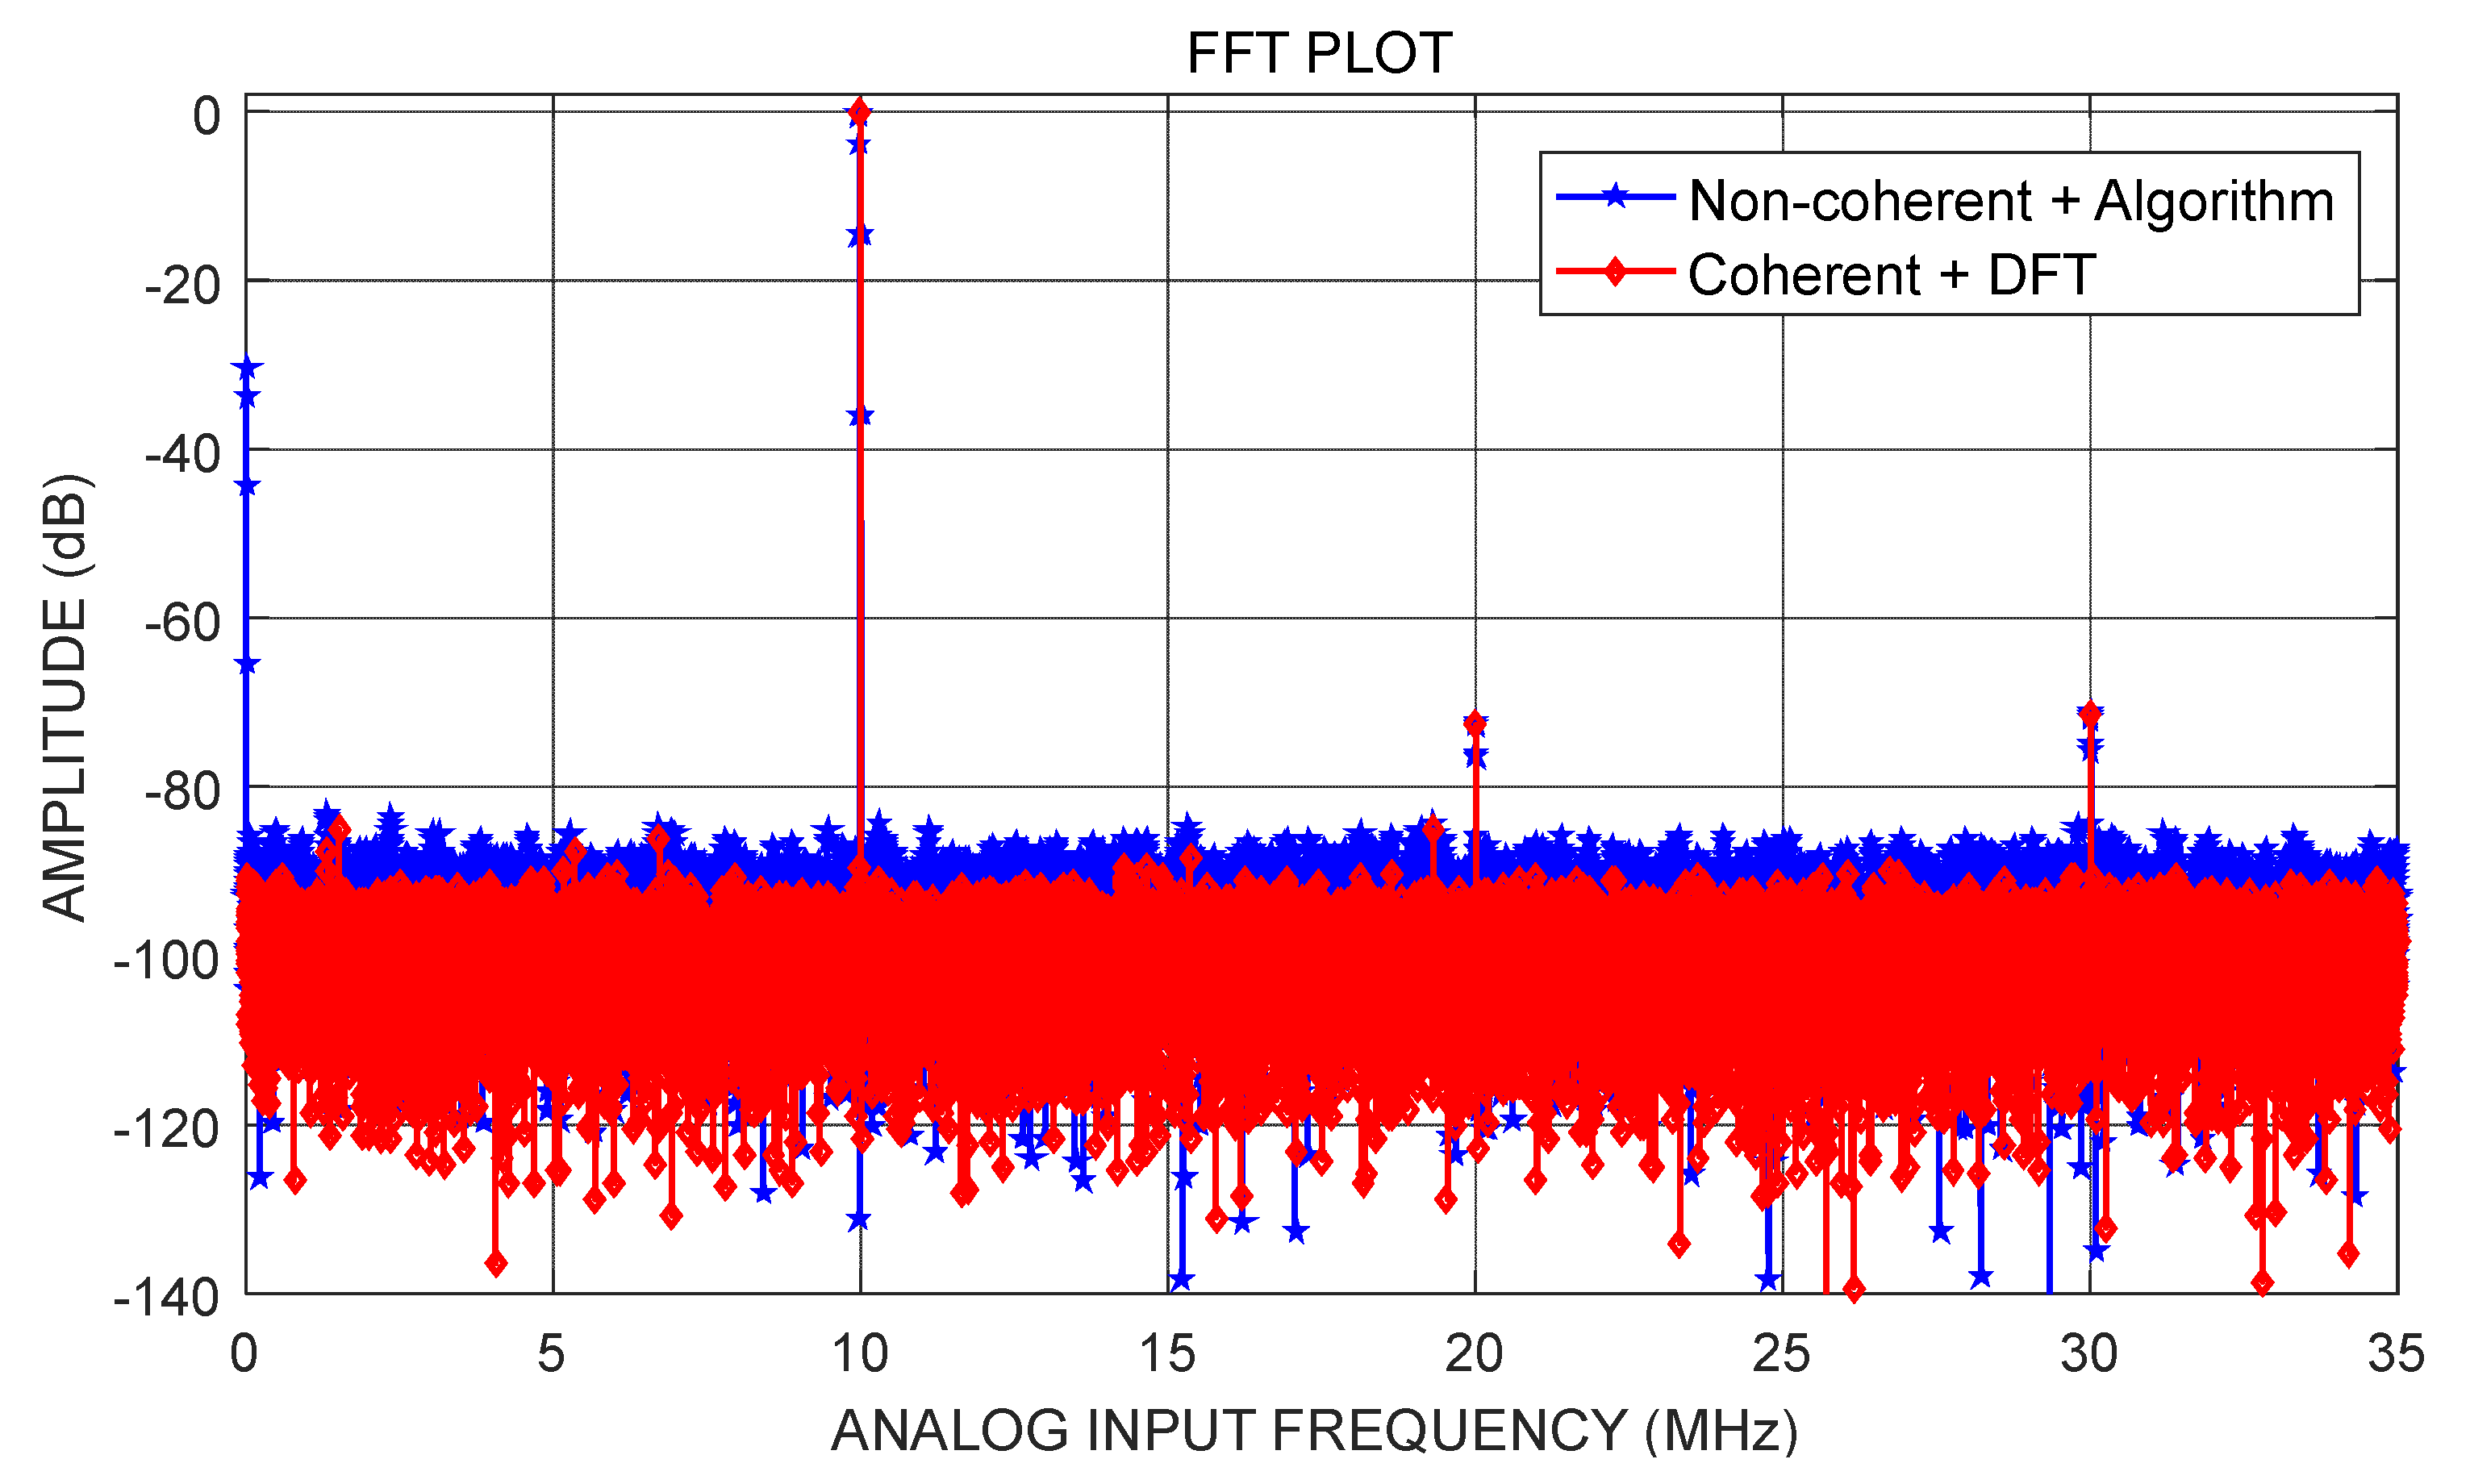
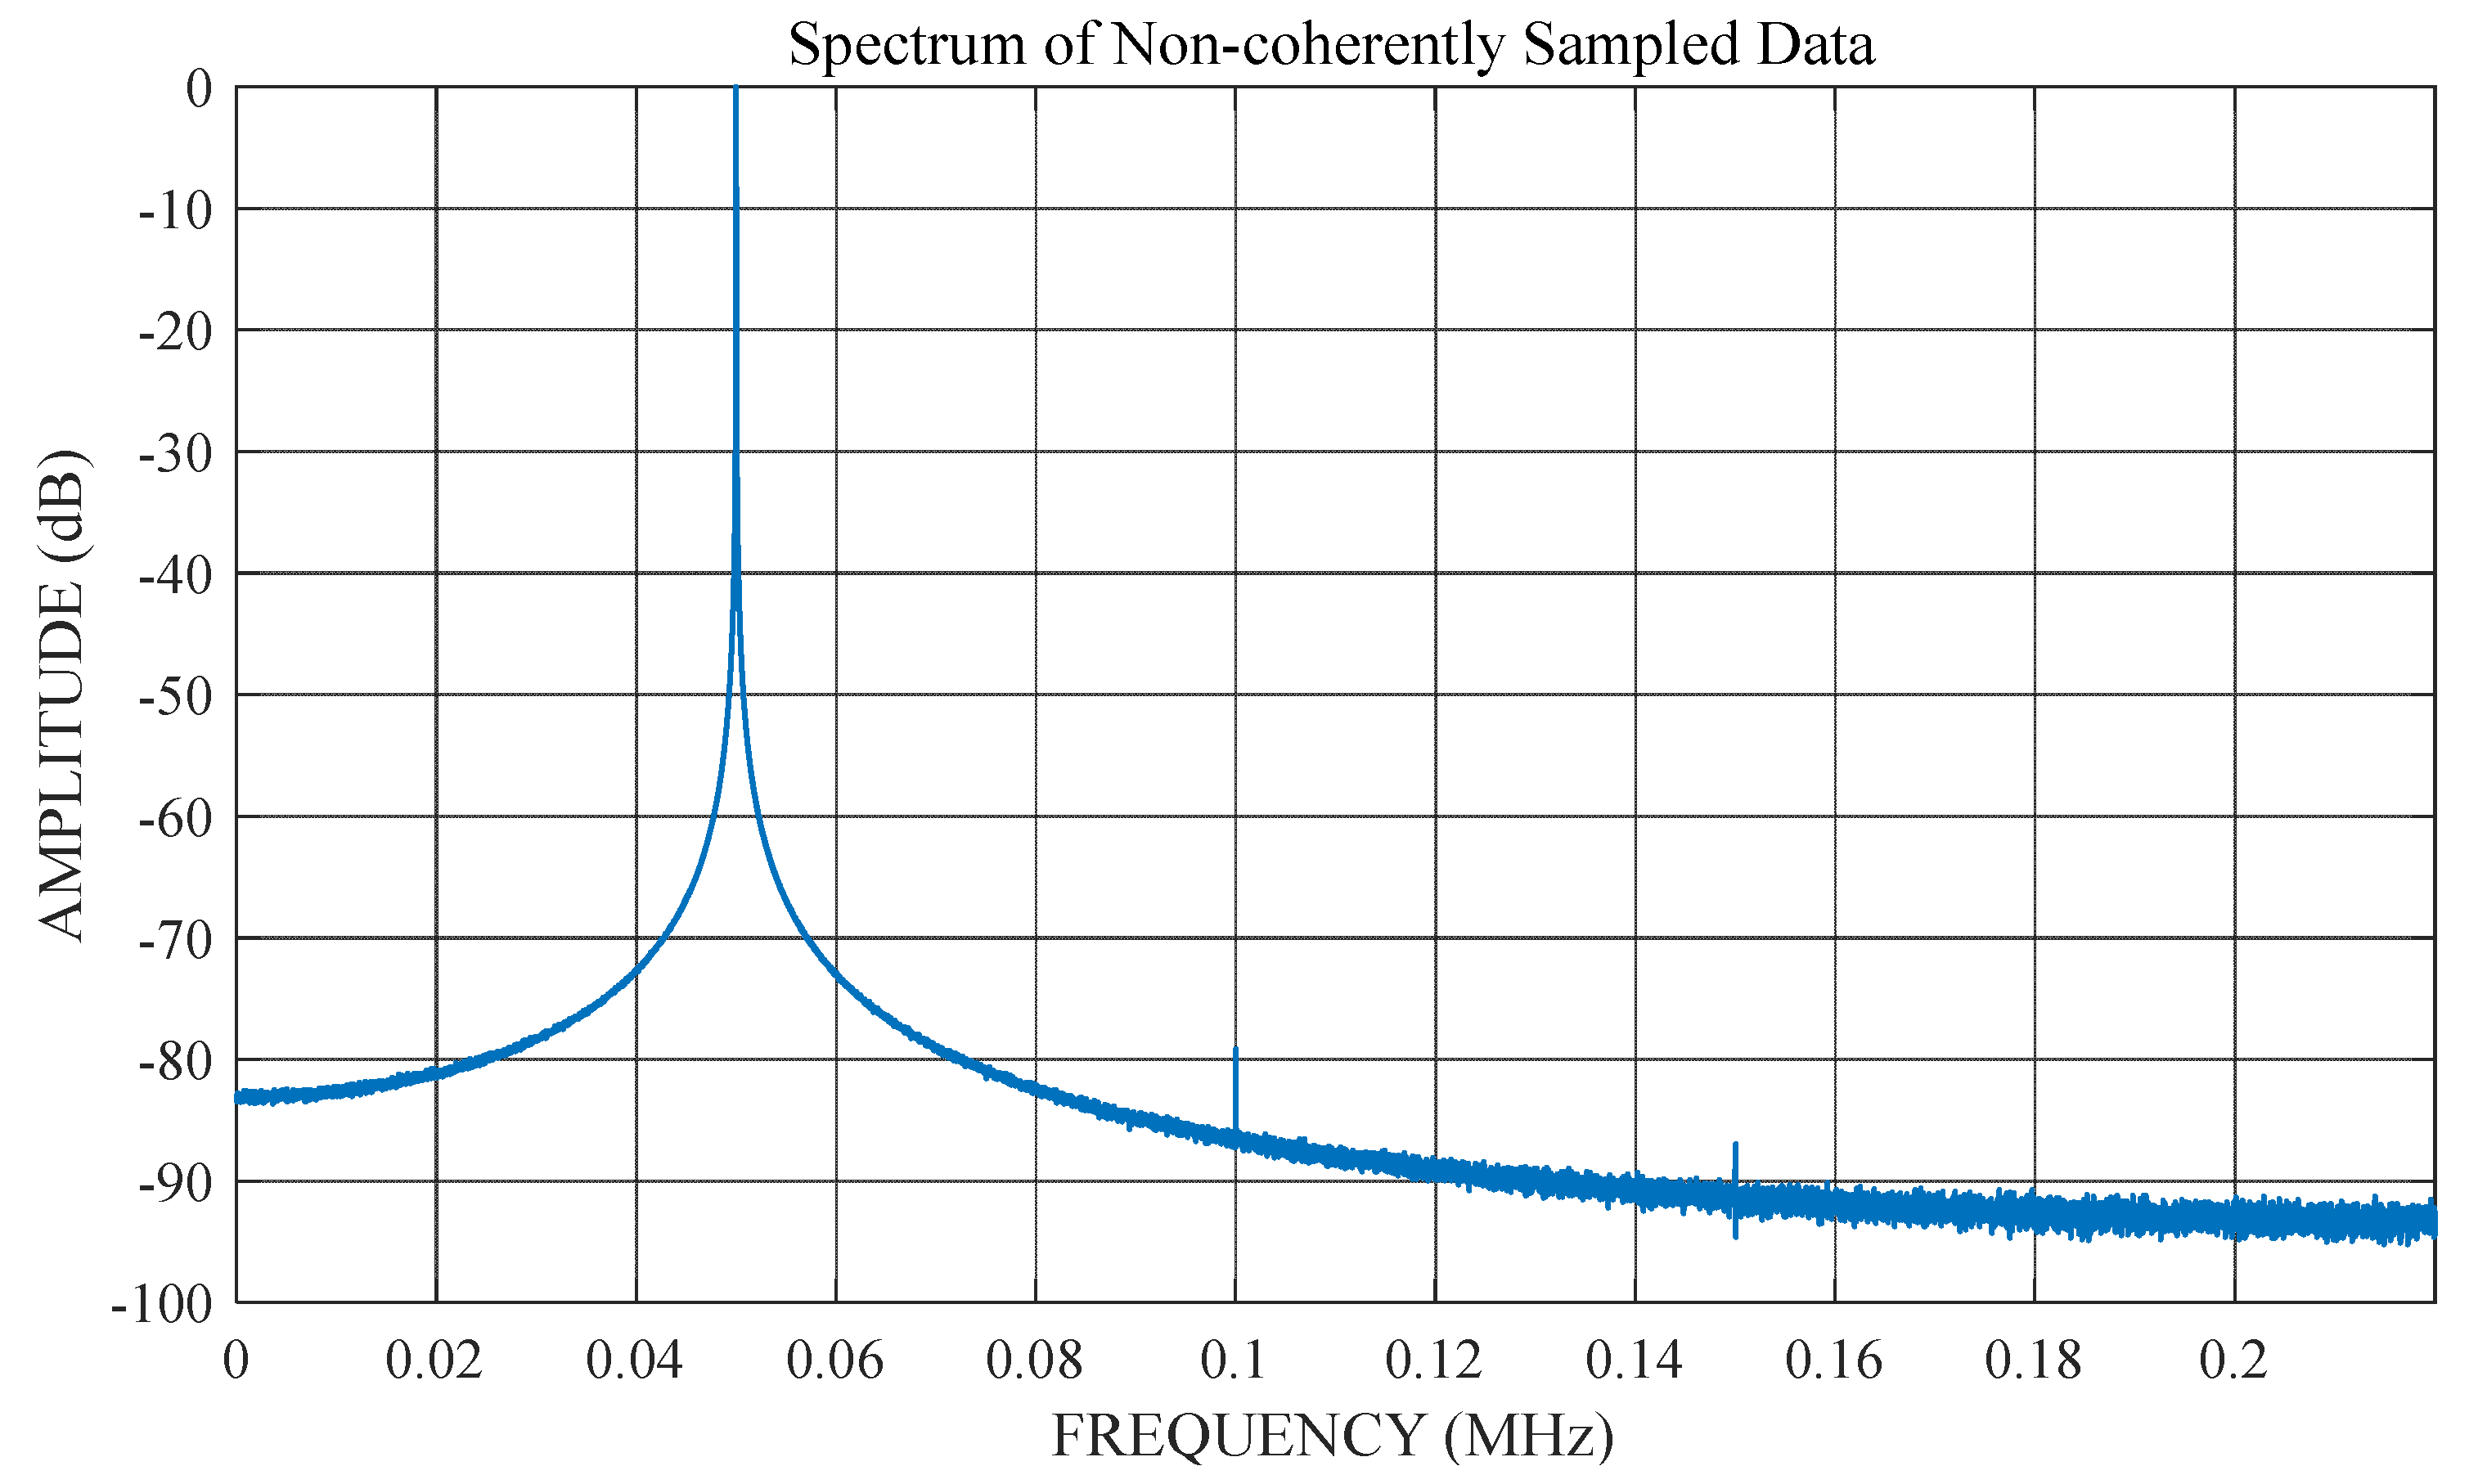
4. Numerical Simulation
4.1. Functionality
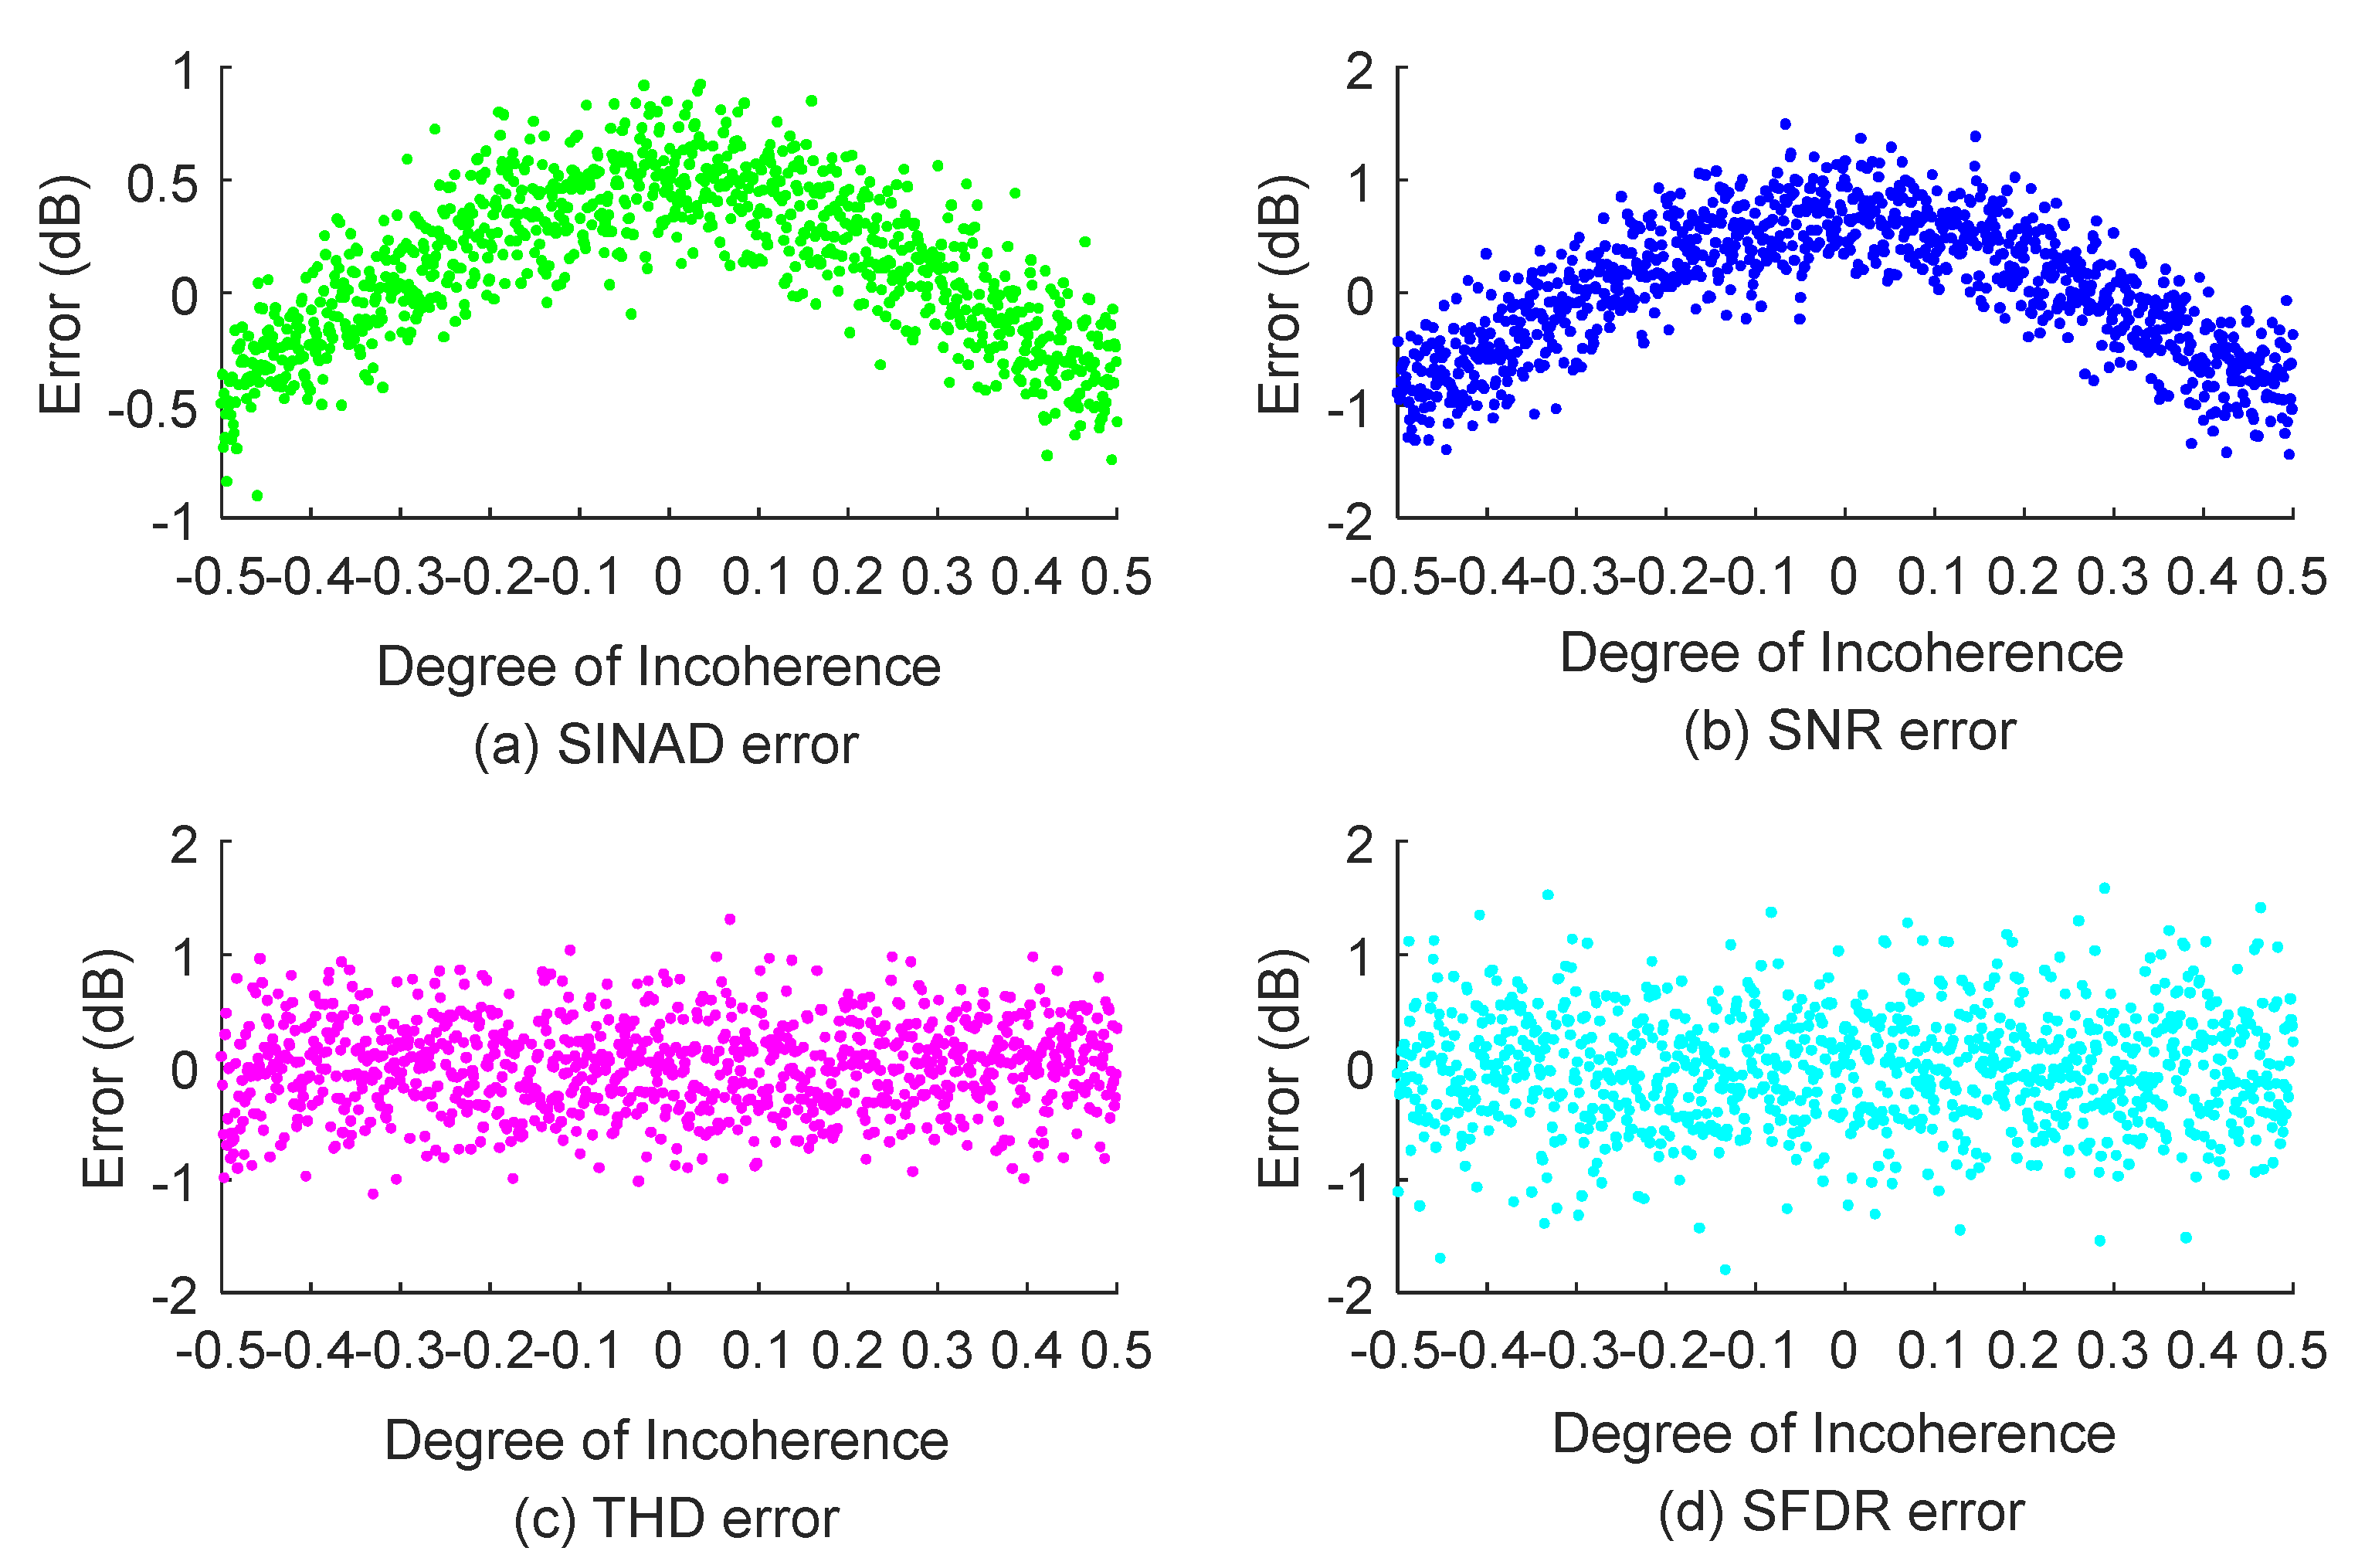
4.2. Robustness
4.3. Computation Time
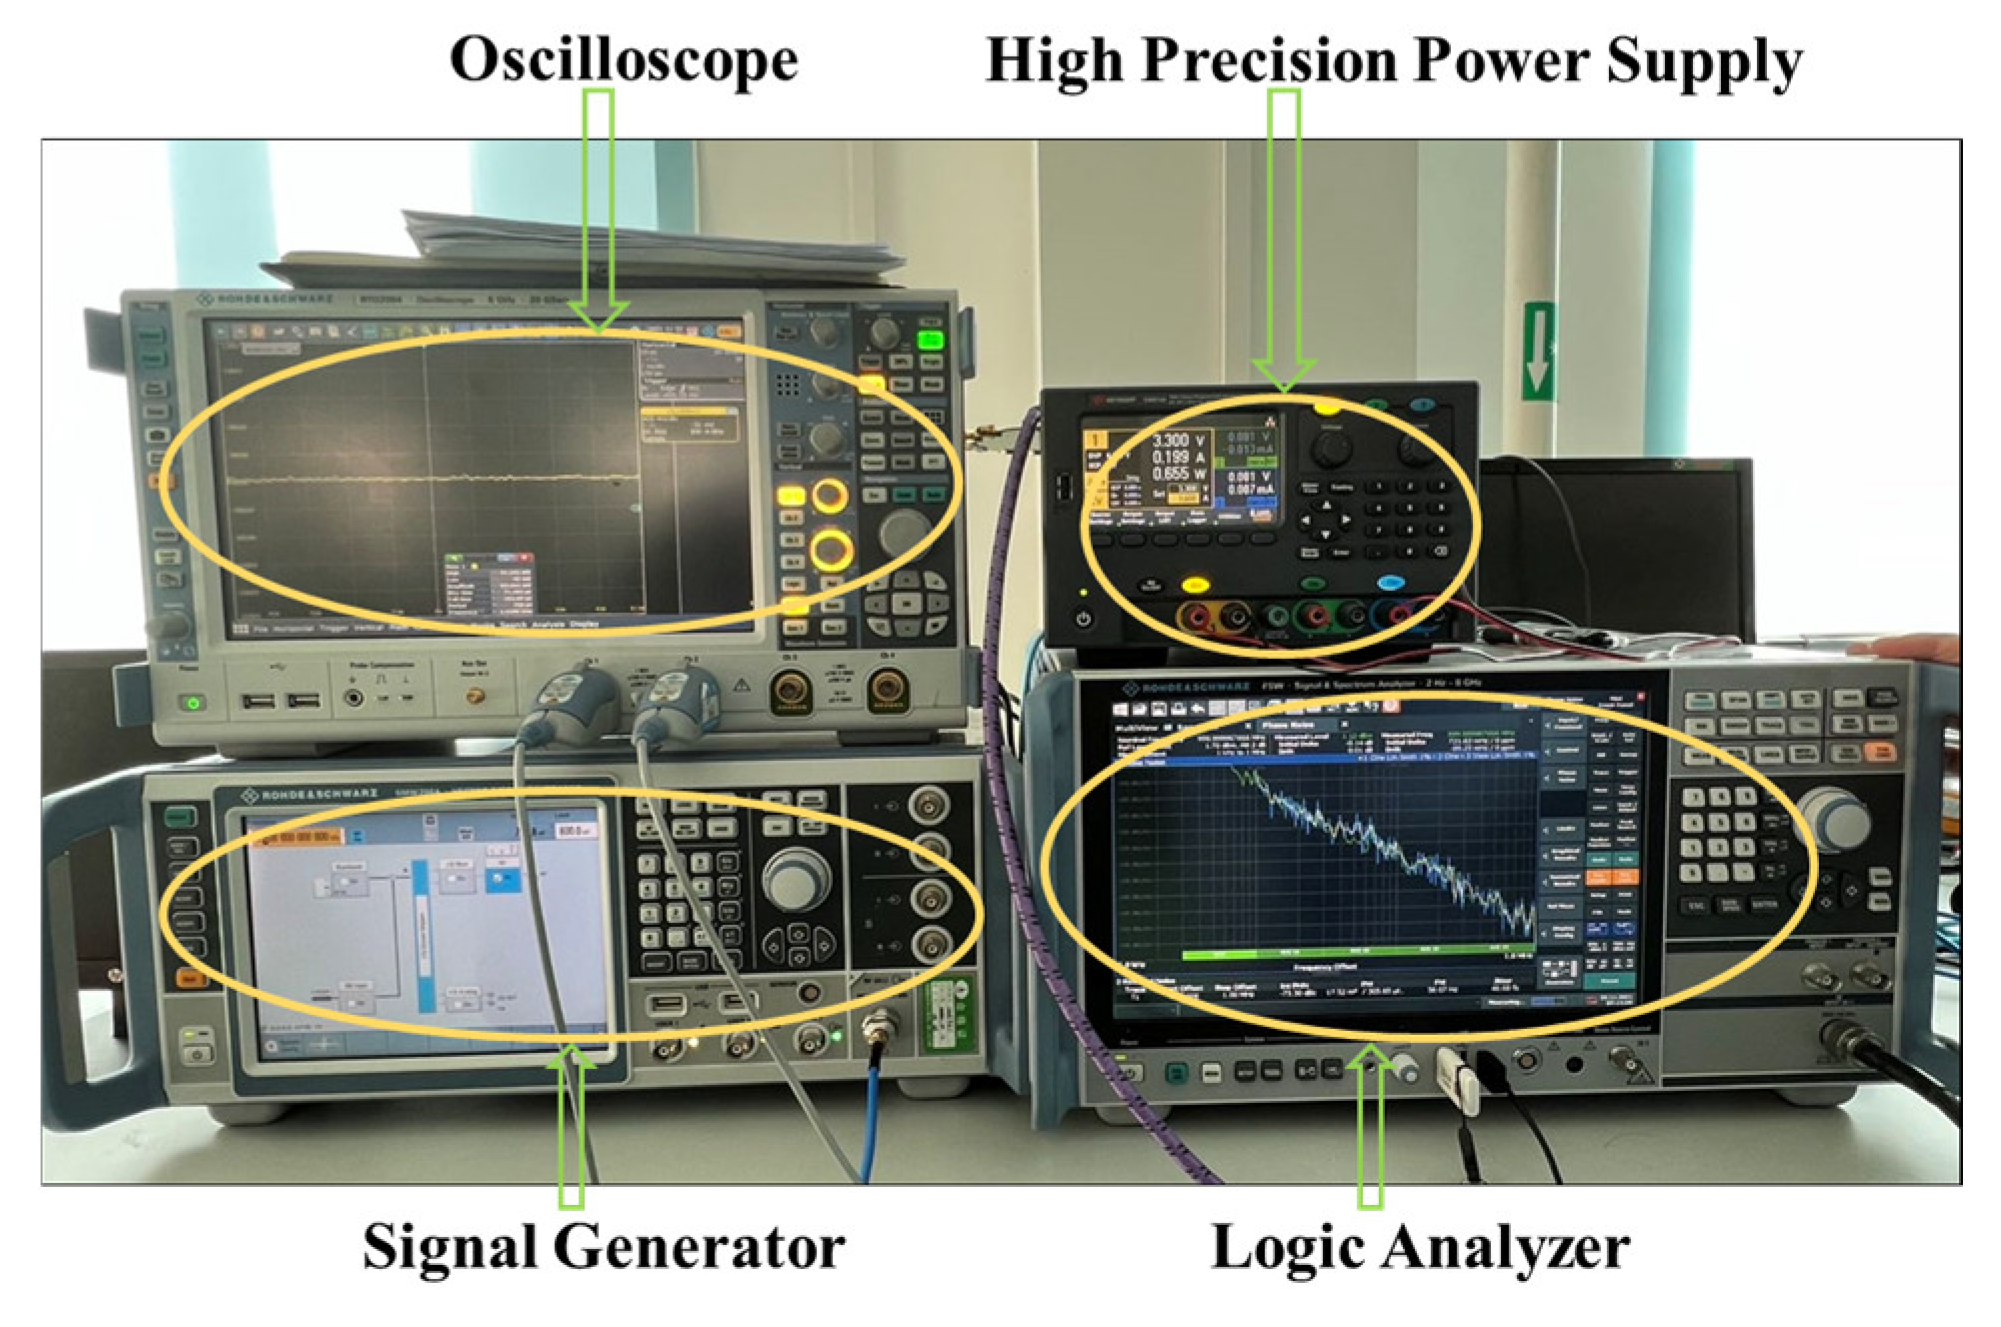
5. Experimental Verification
5.1. AD976 Test
- Connect the AD976 board to be tested to the DC power supply and the evaluation board in the specified environment; input a high-precision sine wave Hz with the sampling frequency set to kHz.
- Power up the device and mode control, and connect the device’s digital output to the digital acquisition terminal through the high-speed interface.
- Provide a frequency-specific analog input signal through a high-performance RF signal source, and connect a fixed-frequency filter to the AD976 analog input.
- Use the logic analyzer/evaluation board to set the AD976 for dynamic conversion and acquisition of the digital output signals of the device.
- DFT to the obtained data to obtain the frequency domain information.
5.2. AD9230 Test
- Apply a 1.8 V power supply.
- Apply a voltage of −1 dBFS amplitude to the ADC under test, then a sine wave source at Hz, and filter the sine wave input to remove distortion and random noise from the input signal.
- Apply a sample clock with the specified sampling frequency Hz to the ADC under test.
- After the ADC has stabilized, collect 32,768 output conversion data points.
- Use the proposed algorithm and DFT to obtain the spectrum.
6. Conclusions
Author Contributions
Funding
Institutional Review Board Statement
Informed Consent Statement
Data Availability Statement
Conflicts of Interest
References
- Varier, V.; Sun, N. High-Precision ADC Testing with Relaxed Reference Voltage Stationarity. IEEE Trans. Instrum. Meas. 2021, 70, 2001809. [Google Scholar] [CrossRef]
- Islam, R.; Maktoomi, M.H.; Ren, H.; Arigong, B. Spectrum Aggregation Dual-Band Real-Time RF/Microwave Analog Signal Processing from Microstrip Line High-Frequency Hilbert Transformer. IEEE Trans. Microw. Theory Tech. 2021, 69, 4647–4657. [Google Scholar] [CrossRef]
- Poczekajlo, P.; Suszynski, R. Modern computing methods for digital signal processing engineering systems. In Proceedings of the 25th KES International Conference on Knowledge-Based and Intelligent Information and Engineering Systems, KES 2021, Szczecin, Poland, 8–10 September 2021; pp. 3534–3541. [Google Scholar]
- IEEE Std 1241TM-2010; IEEE Standard for Terminology and Test Methods for Analog-to-Digital Converters. IEEE: New York, NY, USA, 2011; pp. 1–139.
- 1658-2011; IEEE Standard for Terminology and Test Methods of Digital-to-Analog Converter Devices. IEEE: New York, NY, USA, 2012.
- Kuwalek, P.; Otomanski, P. The effect of the phenomenon of ‘spectrum leakage’ on the measurement of power quality parameters. In Proceedings of the 12th International Conference on Measurement, Smolenice, Slovakia, 27–29 May 2019; pp. 70–73. [Google Scholar]
- Xiao, Q.Y.; Li, J.; Sun, J.D.; Feng, H.; Jin, S.J. Natural-gas pipeline leak location using variational mode decomposition analysis and cross-time-frequency spectrum. Measurement 2018, 124, 163–172. [Google Scholar] [CrossRef]
- Jwo, D.-J.; Chang, W.-Y.; Wu, I.H. Windowing Techniques, the Welch Method for Improvement of Power Spectrum Estimation, Computers. Mater. Contin. 2021, 67, 3983–4003. [Google Scholar]
- Yang, C.; Li, B.; Hu, X.; Fu, Z. Accurate Frequency Estimation Based on Analytical Interpolated Discrete Time Fourier Transform. Diangong Jishu Xuebao/Trans. China Electrotech. Soc. 2022, 37, 1338–1350. [Google Scholar]
- Sudani, S.; Wu, M.; Chen, D. A novel robust and accurate spectral testing method for non-coherent sampling. In Proceedings of the International Test Conference 2011, Anaheim, CA, USA, 18–23 September 2011. [Google Scholar]
- Bilau, T.Z.; Megyeri, T.; Sarhegyi, A.; Markus, J.; Kollar, I. Four-Parameter Fitting of Sine Wave Testing Result: Iteration and Convergence; Elsevier: Amsterdam, The Netherlands, 2004; pp. 51–56. [Google Scholar]
- Agarwal, P.; Kumar, S.; Singh, S.P. Closed form solutions of various window functions in fractional fourier transform domain. In Proceedings of the 6th International Conference on Computing for Sustainable Global Development, INDIACom 2019, New Delhi, India, 13–15 March 2019; pp. 64–68. [Google Scholar]
- Albrecht, H.-H. Tailoring of minimum sidelobe cosine-sum windows for high-resolution measurements. Open Signal Process. J. 2010, 3, 20–29. [Google Scholar] [CrossRef]
- Wang, X.; Lei, K.; Yang, X.; Li, M.; Wang, X. Harmonic analysis based on Blackman Harris self-multiplication window. In Proceedings of the 5th Asia Conference on Power and Electrical Engineering, ACPEE 2020, Chengdu, China, 4–7 June 2020; pp. 2165–2169. [Google Scholar]
- Sulistyaningsih, S.; Putranto, P.; Qurrachman, T.; Desvasari, W.; Daud, P.; Wijayanto, Y.N.; Mahmudin, D.; Kurniadi, D.P.; Rahman, A.N.; Hardiati, S.; et al. Performance comparison of Blackman, bartlett, Hanning, and kaiser window for radar digital signal processing. In Proceedings of the 4th International Conference on Information Technology, Information Systems and Electrical Engineering, ICITISEE 2019, Yogyakarta, Indonesia, 20–21 November 2019; pp. 391–394. [Google Scholar]
- Belega, D.; Petri, D.; Dallet, D. Iterative sine-wave frequency estimation by generalized fourier interpolation algorithms. In Proceedings of the 11th International Symposium on Electronics and Telecommunications, ISETC 2014, Timisoara, Romania, 14–15 November 2014. [Google Scholar]
- Borkowski, J.; Matusiak, A. Dynamic characteristics of Interpolated-DFT-based frequency estimation method with Generalized Maximum Sidelobes Decay Windows. In Proceedings of the 19th IEEE International Conference on Environment and Electrical Engineering and 2019 IEEE Industrial and Commercial Power Systems Europe, EEEIC/I and CPS Europe 2019, Genoa, Italy, 11–14 June 2019. [Google Scholar]
- Yang, C.; Li, B.; Hu, X.; Fu, Z. High-precision Frequency Estimation Based on Iterative DTFT Interpolation. Power Syst. Technol. 2021, 45, 3955–3963. [Google Scholar]
- Sudani, S.; Chen, D.; Geiger, R. A method for accurate full spectrum testing without requiring coherency. In Proceedings of the 2012 IEEE 55th International Midwest Symposium on Circuits and Systems, MWSCAS 2012, Boise, ID, USA, 5–8 August 2012; pp. 346–349. [Google Scholar]
- Sudani, S.K.; Xu, L.; Chen, D. A comparative study of state-of-The-Art high-performance spectral test methods. IEEE Des. Test 2015, 32, 26–35. [Google Scholar] [CrossRef]
- Wang, X.; Lei, K.; Yang, X.; Wang, X. An effective harmonic parameters estimation algorithm based on transformed FFT sequence. In Proceedings of the 2nd International Conference on Information Technologies and Electrical Engineering, ICITEE 2019, Zhuzhou, China, 6–7 December 2019. [Google Scholar]
- Zhuang, Y.; Chen, D. Accurate and Robust Spectral Testing with Relaxed Instrumentation Requirements; Springer International Publishing: Berlin/Heidelberg, Germany, 2018. [Google Scholar]
- Zhuang, Y.; Chen, D. Algorithms for Accurate Spectral Analysis in the Presence of Arbitrary Noncoherency and Large Distortion. IEEE Trans. Instrum. Meas. 2017, 66, 2556–2565. [Google Scholar] [CrossRef]
- Sudani, S.K.; Chen, D. FIRE: A fundamental identification and replacement method for accurate spectral test without requiring coherency. IEEE Trans. Instrum. Meas. 2013, 62, 3015–3025. [Google Scholar] [CrossRef]
- Sudani, S.; Xu, L.; Chen, D. Accurate full spectrum test robust to simultaneous non-coherent sampling and amplitude clipping. In Proceedings of the 44th IEEE International Test Conference, ITC 2013, Anaheim, CA, USA, 10–12 September 2013. [Google Scholar]
- Simon, G.; Pintelon, R.; Sujbert, L.; Schoukens, J. An efficient nonlinear least square multisine fitting algorithm. IEEE Trans. Instrum. Meas. 2002, 51, 750–755. [Google Scholar] [CrossRef]
- Kollar, I.; Blair, J.J. Improved determination of the best fitting sine wave in ADC testing. IEEE Trans. Instrum. Meas. 2005, 54, 1978–1983. [Google Scholar] [CrossRef]
- Da Silva, M.F.; Ramos, P.M.; Serra, A. A new four parameter sine fitting technique. Measurement 2004, 35, 131–137. [Google Scholar] [CrossRef]
- Ramos, P.M.; Radil, T.; Serra, A.C. Four-parameter sine-fitting algorithm for detection and classification of transients and waveform distortions. Metrol. Meas. Syst. 2008, 15, 441–456. [Google Scholar]
- Liang, Z.; Ren, D.; Sun, J.; Zhu, Z. Fitting algorithm of sine wave with partial period waveforms and non-uniform sampling based on least-square method. In Proceedings of the 13th International Conference on Vibration Measurements by Laser and Noncontact Techniques, Ancona, Italy, 20–22 June 2018. [Google Scholar]
- Wu, M.; Ban, C.; Xu, J.; Geng, L.; Chen, D. MIRE: A Multitone Identification and Replacement Method for Multitone Spectral Test Without Requiring Coherent Sampling. IEEE Trans. Instrum. Meas. 2019, 69, 4578–4591. [Google Scholar] [CrossRef]


| Method | Time (ms) | Functionality |
|---|---|---|
| Direct DFT | 39 | Inaccurate |
| Hanning | 40 | Inaccurate |
| Blackman-Nuttall (4-term) | 42 | Inaccurate |
| Window in [13] | 87 | Accurate |
| FIRE | 80 | Accurate |
| Proposed Method | 72 | Accurate |
| Date Set | Method | SNR (dB) | SINAD (dB) | THD (dB) | SFDR (dB) |
|---|---|---|---|---|---|
| Test 1 | Coherent | 75.065 | 75.145 | −90.248 | 81.142 |
| Non-coherent + Algorithm | 74.112 | 73.373 | −88.566 | 79.523 | |
| Non-coherent + Window in [13] | 73.553 | 72.469 | −87.935 | 77.946 | |
| Test 2 | Coherent | 75.213 | 75.314 | −90.568 | 80.997 |
| Non-coherent + Algorithm | 74.248 | 73.674 | −89.023 | 79.653 | |
| Non-coherent + Window in [13] | 73.973 | 71.466 | −88.575 | 78.795 | |
| Test 3 | Coherent | 74.965 | 75.665 | −89.844 | 81.616 |
| Non-coherent + Algorithm | 73.568 | 74.472 | −88.265 | 79.945 | |
| Non-coherent + Window in [13] | 72.761 | 72.429 | −86.963 | 78.149 |
| Dynamic Indicators | Standard Values in Datasheet | Test Results |
|---|---|---|
| SNR | 63.8 dB (Min); 64.6 dB (Typ); | 62.329 dB |
| SINAD | 63.7 dB (Min); 64.5 dB (Typ); | 63.097 dB |
| ENOB | 10.6 bits (Typ) | 9.198 bits |
| WORST HARMONIC (Second OR Third) | −82 dB (Typ); −78 dB (Max); | −78.280 dB |
| WORST OTHER (SFDR Excluding Second and Third) | −89 dB (Typ); −84 dB (Max); | −85.247 dB |
Publisher’s Note: MDPI stays neutral with regard to jurisdictional claims in published maps and institutional affiliations. |
© 2022 by the authors. Licensee MDPI, Basel, Switzerland. This article is an open access article distributed under the terms and conditions of the Creative Commons Attribution (CC BY) license (https://creativecommons.org/licenses/by/4.0/).
Share and Cite
Peng, X.; Li, J.; Zhang, D.; Hu, C.; Sun, N.; Jiang, J. High-Precision ADC Spectrum Testing under Non-Coherent Sampling Conditions. Sensors 2022, 22, 8170. https://doi.org/10.3390/s22218170
Peng X, Li J, Zhang D, Hu C, Sun N, Jiang J. High-Precision ADC Spectrum Testing under Non-Coherent Sampling Conditions. Sensors. 2022; 22(21):8170. https://doi.org/10.3390/s22218170
Chicago/Turabian StylePeng, Xiaofei, Jie Li, Debiao Zhang, Chenjun Hu, Ning Sun, and Jie Jiang. 2022. "High-Precision ADC Spectrum Testing under Non-Coherent Sampling Conditions" Sensors 22, no. 21: 8170. https://doi.org/10.3390/s22218170
APA StylePeng, X., Li, J., Zhang, D., Hu, C., Sun, N., & Jiang, J. (2022). High-Precision ADC Spectrum Testing under Non-Coherent Sampling Conditions. Sensors, 22(21), 8170. https://doi.org/10.3390/s22218170