
Detection and Risk Analysis with Lane-Changing Decision Algorithms for Autonomous Vehicles


Abstract
1. Introduction
- Level 0: No Driving Automation.
- Level 1: Driver Assistance.
- Level 2: Partial Driving Automation.
- Level 3: Conditional Driving Automation.
- Level 4: High Driving Automation.
- Level 5: Full Driving Automation.
- Improving the perception of the environment to provide a correct interpretation of the information returned by the sensors, whatever the lighting and weather conditions.
- Enhance decision-making algorithms so that vehicles can make the right decision, even if they encounter situations not foreseen during development but also so that they behave like humans because, during their travel, autonomous vehicles will have to share the road with non-autonomous vehicles, and it is important that other drivers can understand the actions of the autonomous vehicle.
- Ensure passenger acceptance of the algorithm [4]: indeed, the vehicle must have a behavior similar to a human in terms of risk taking because if it is too careful or takes too much risk, the passengers may have a tendency to reject autonomous driving and regain control of the vehicle.
- To be understandable by other non-autonomous vehicles and pedestrians [5]: on the road, humans adopt behaviors to communicate with other road users non-verbally, such as slowing down to let a vehicle change lanes or pulling to the left of the current lane to signify an intention to change lanes. As long as autonomous vehicles will have to share the road with non-autonomous ones, it is important that they can understand these behaviors and behave the same.
- Faithfully reproduce human decisions based on an artificial intelligence algorithm learning from a database. This point is important for the reasons mentioned above.
- Not be a purely AI-based method, which would make it a black box algorithm. When it comes to security, it is preferable to have a method whose internal behavior can be understood and any failures diagnosed.
2. Related Work
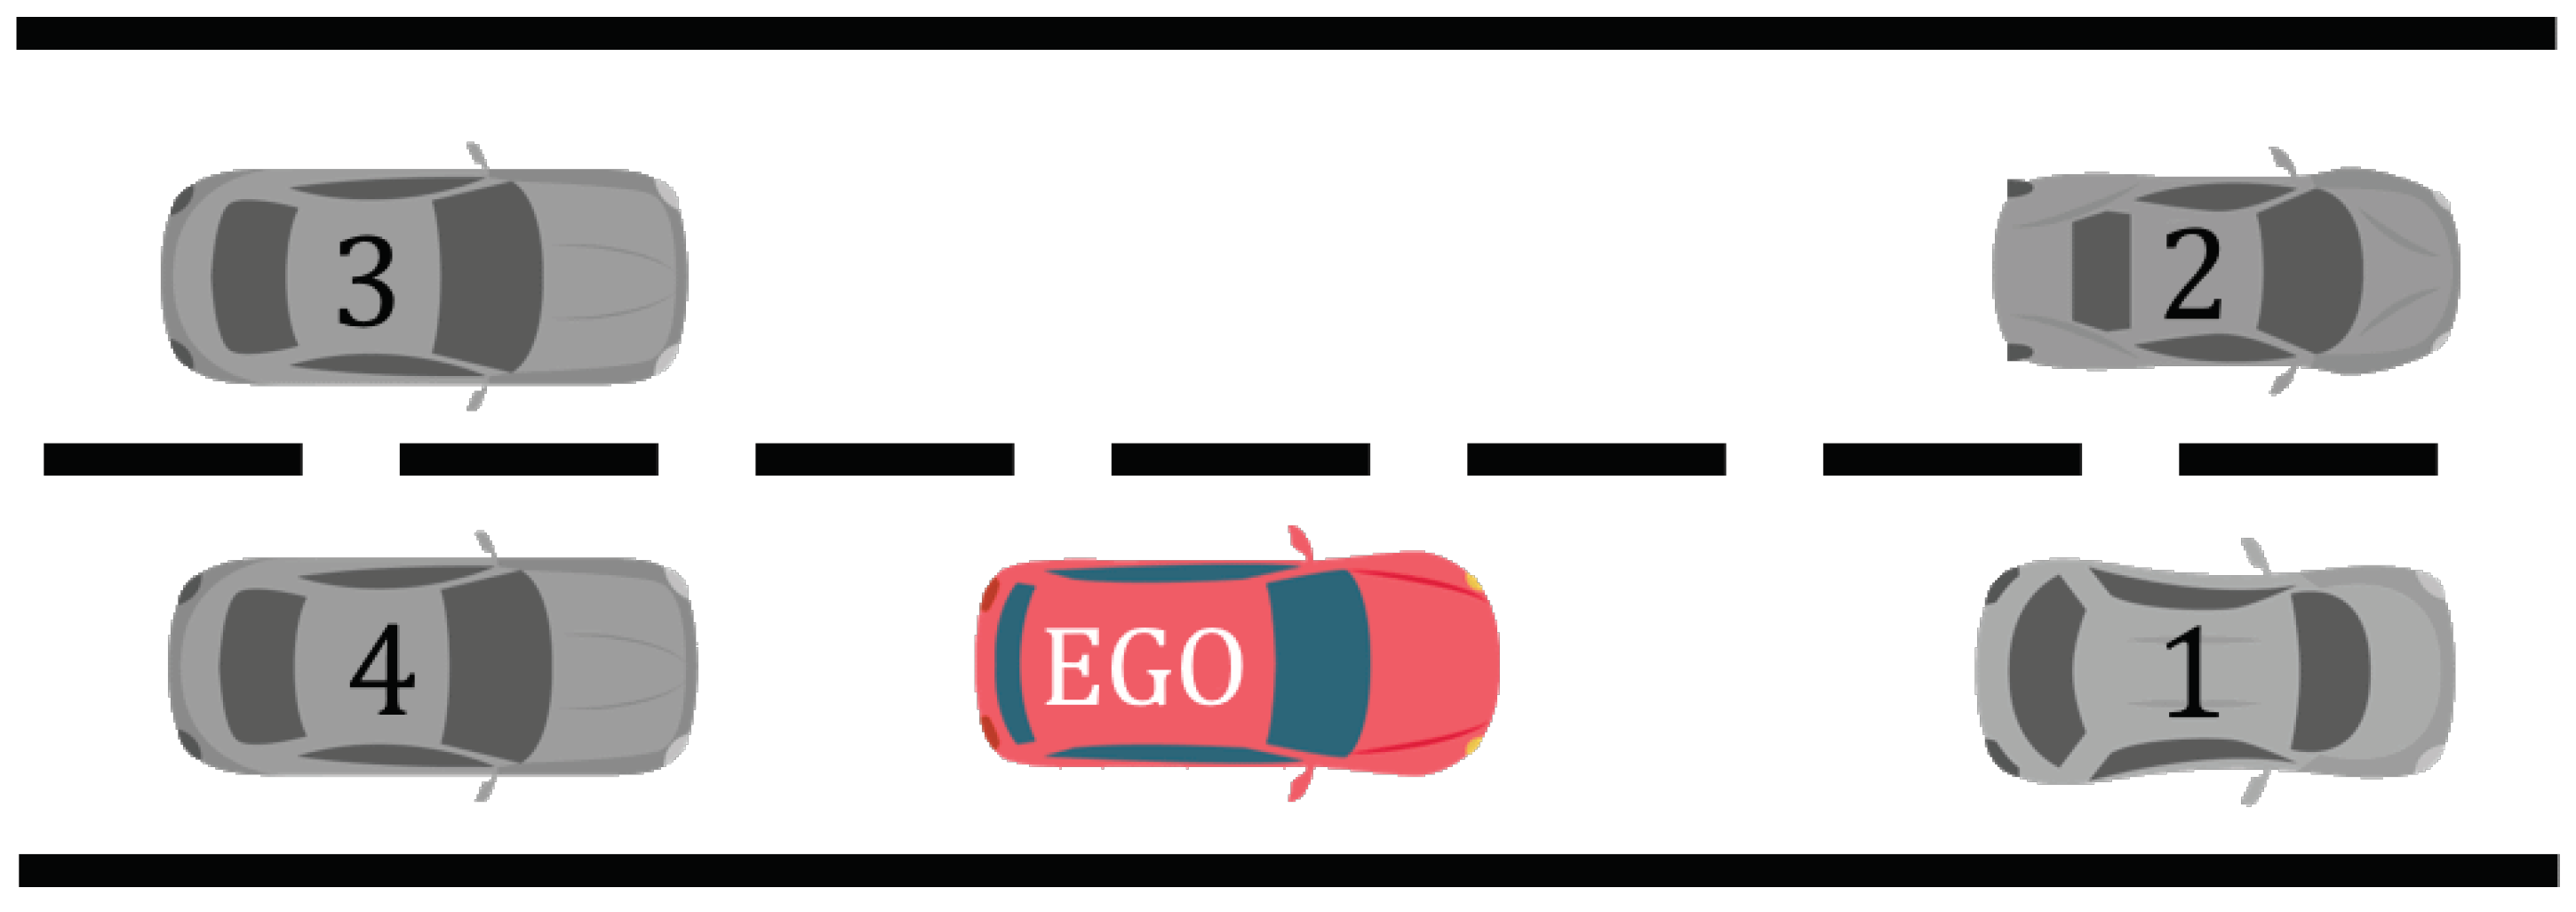
- Inter-vehicular time [12]: Refers to the time separating two successive vehicles in the same traffic lane. The traffic law defines a two-second safety Inter-Vehicular Time (TIV). Depending on the speed, the driver must deduce their safety distance from the vehicle in front of them.
- “Time-To-X”: A time indication where X is a collision-related event, such as the time remaining before the impact or Time-To-Collision (TTC) [13], and it can be compared with the time required to stop the vehicle. It also can be used to warn the driver; in this case, the driver reaction time should be added to the time to stop the vehicle.An additional time indicator that is correlated with the TTC is the Time-To-React (TTR) [14], the amount of time remaining to act before the collision becomes unavoidable. In this case, the reaction time of the driver must be considered.
- Binary collision prediction: Future trajectories are computed for the ego-vehicle and the other vehicle. Trajectories are assumed to be calculated with sufficient accuracy (good model and exact measurements) [15].
- Probabilistic collision prediction: When the future motion of a vehicle is represented by a probability distribution on sample trajectories, probabilistic estimation of risks can be used by computing the collision probability between all possible pairs of trajectories; the more collision detected, the higher the risk [16]. This approach provides a lot of flexibility in the handling of uncertainties and can be adapted for any vehicle trajectory prediction model.
- Rule-based models: Make decisions based on physical parameters measured by the car’s sensors (radars, lidars, and cameras) such as speed and distance of surrounding vehicles, or calculated such as TTC or TTR, and rules that relate to the situation, such as the Gipps model [6], CORridor SIMulation (CORSIM) model [7], Analysis of Road Traffic and Evaluation by Micro-Simulation (ARTEMiS) model [18] and other more advanced versions [19]. The advantage of these models is that they are calculated fast in real time, but on the other hand, they can be difficult to calibrate.
- Artificial Intelligence: Mostly Artificial Neural Network (ANN) [8,20] and fuzzy logic [9,21]. These models are trained from databases or tuned to behave like a human driver. In addition, they can manage relatively uncertain and noisy data. Nevertheless, they have the cons of needing lots of data to be trained for ANNs and the membership functions can be difficult to define for the fuzzy logic models. Moreover, the ANN is a black box model, which means that in cases of failure, it may not be possible to pinpoint the problem and solve it.
- Incentive-based model: It estimates the level of benefit if the lane change is made in addition to other parameters; the model makes the decision to change lanes or not. Minimizing Overall Braking Induced by Lane change (MOBIL) [22] and Lane change Model with Relaxation and Synchronization (LMRS) [23] are the main models in this category.
3. Methodology
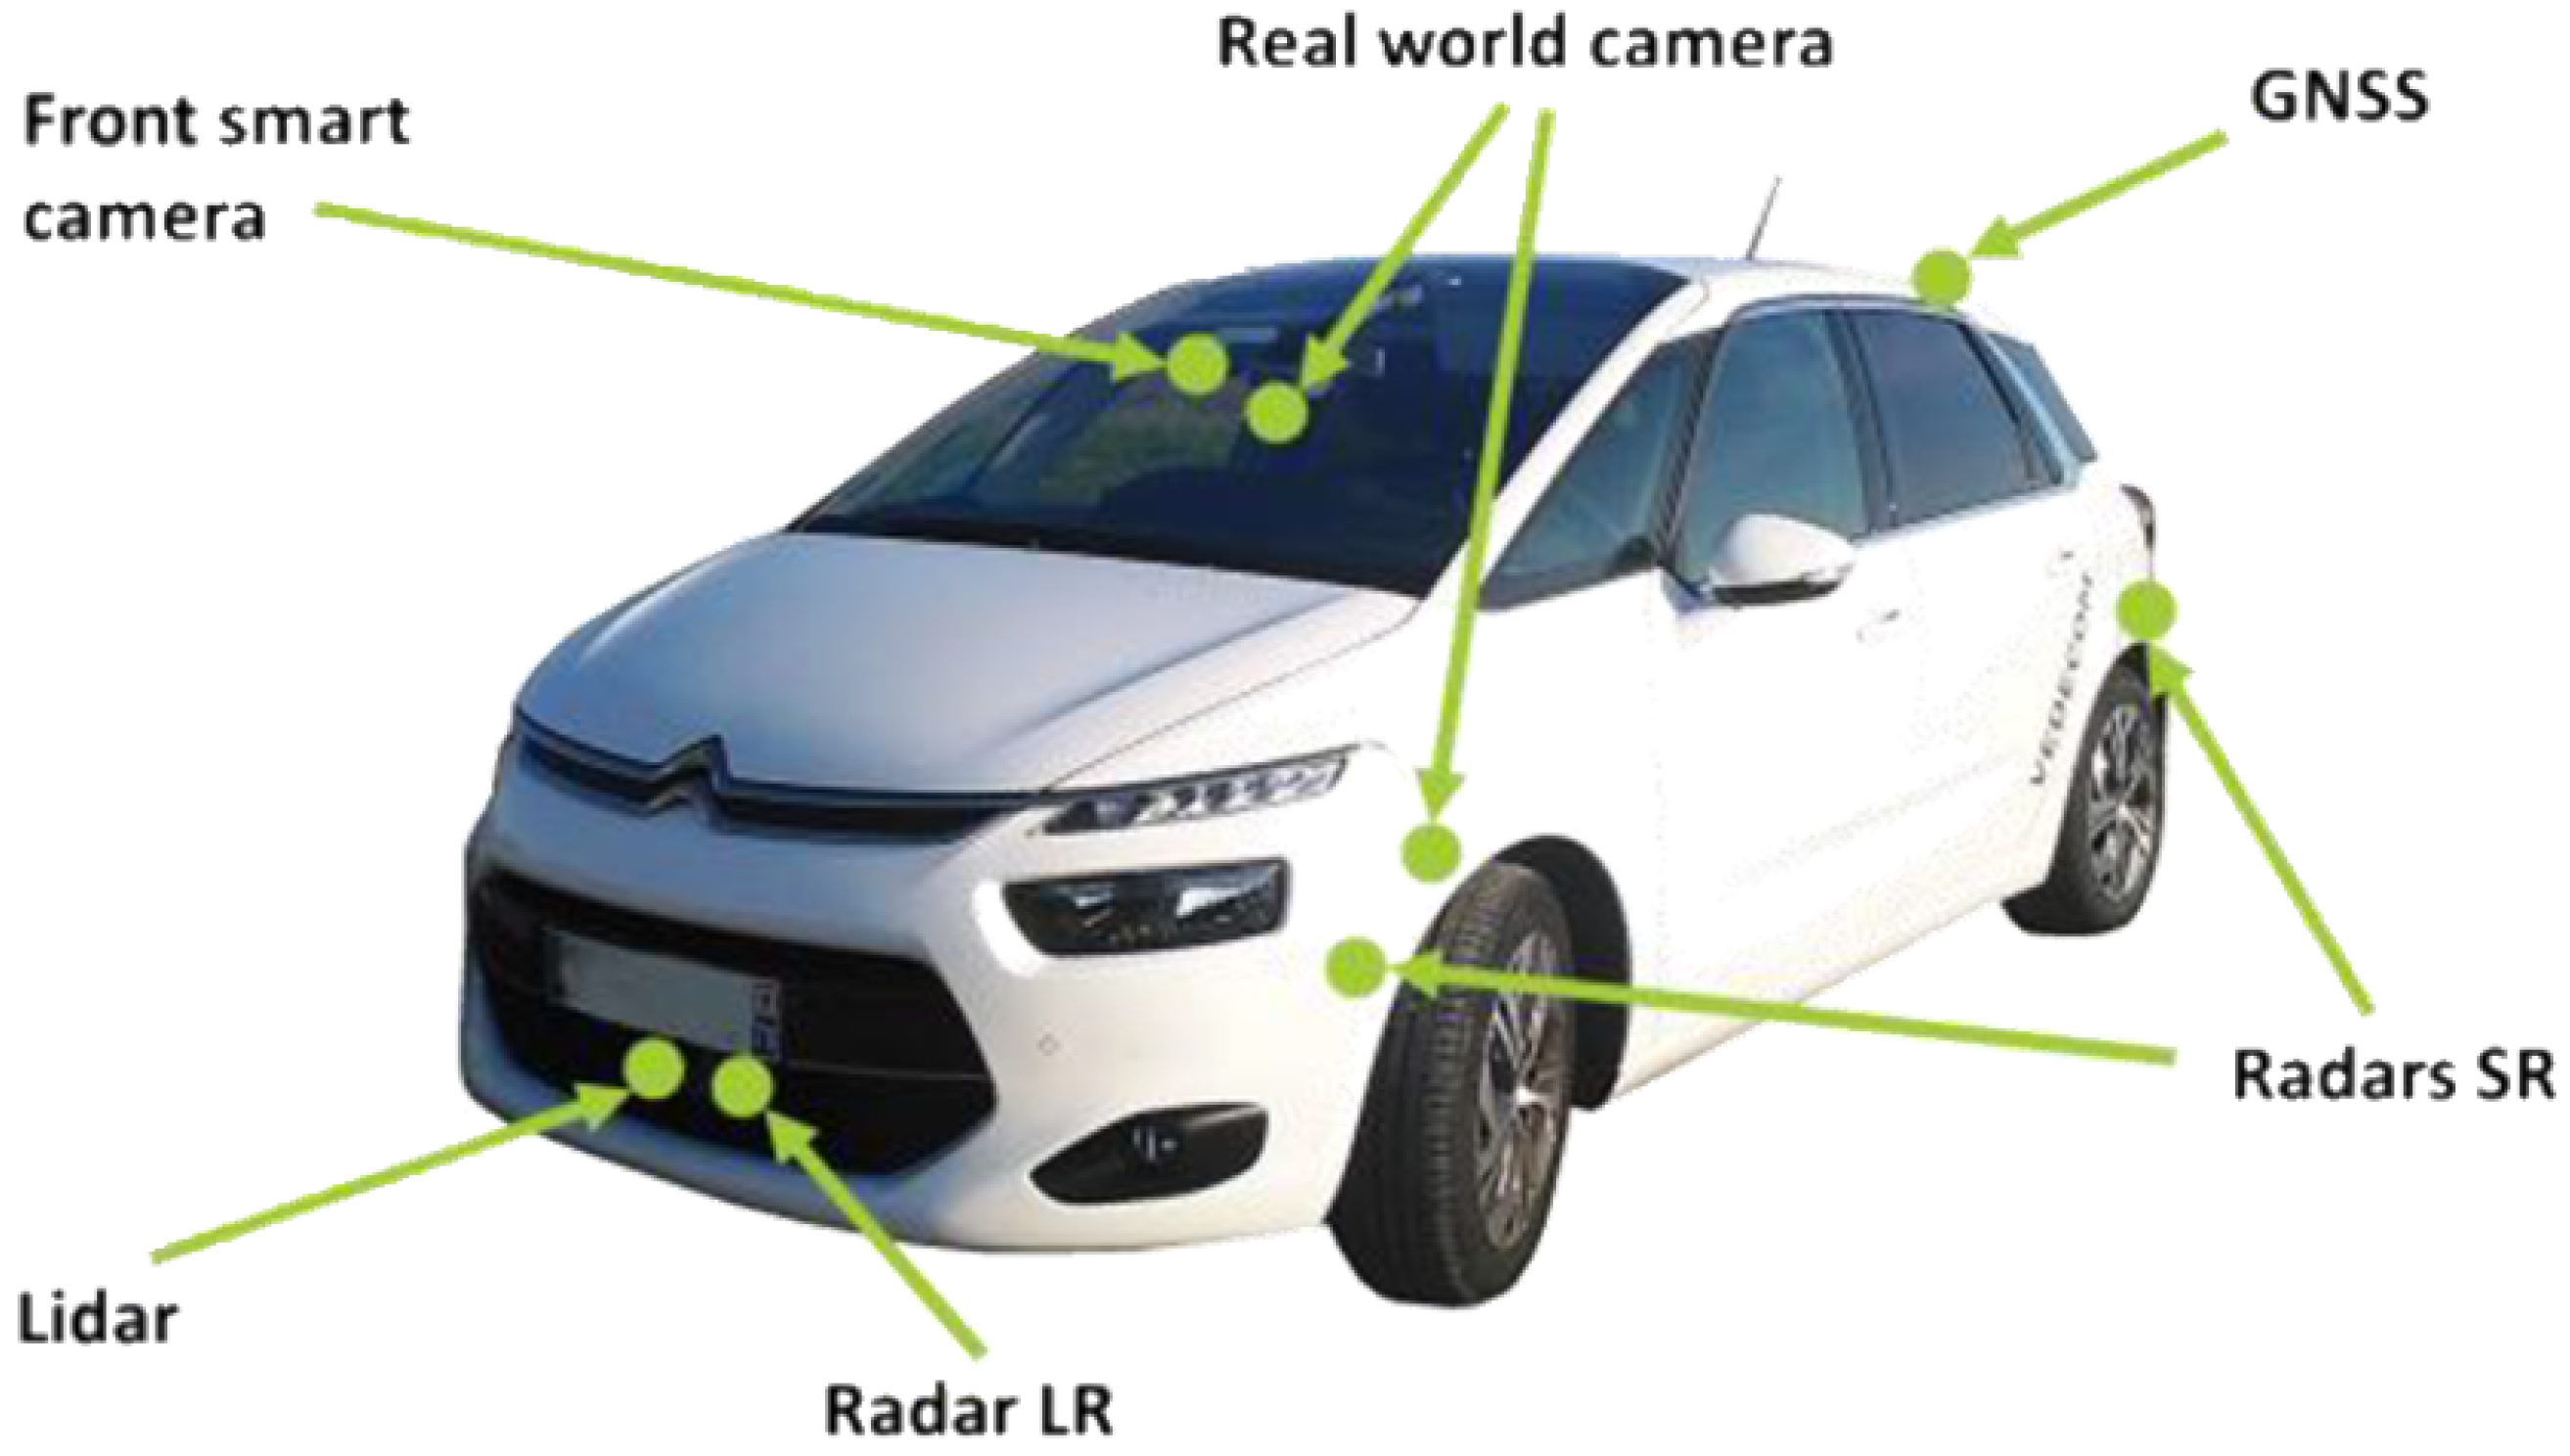
- Three technologies of exteroceptive sensors (lidar, camera, and radar).
- Global navigation satellite system (GNSS).
- Inner cameras for driver monitoring.
- Annotation tool for the driver.
- Real-time recording hardware.
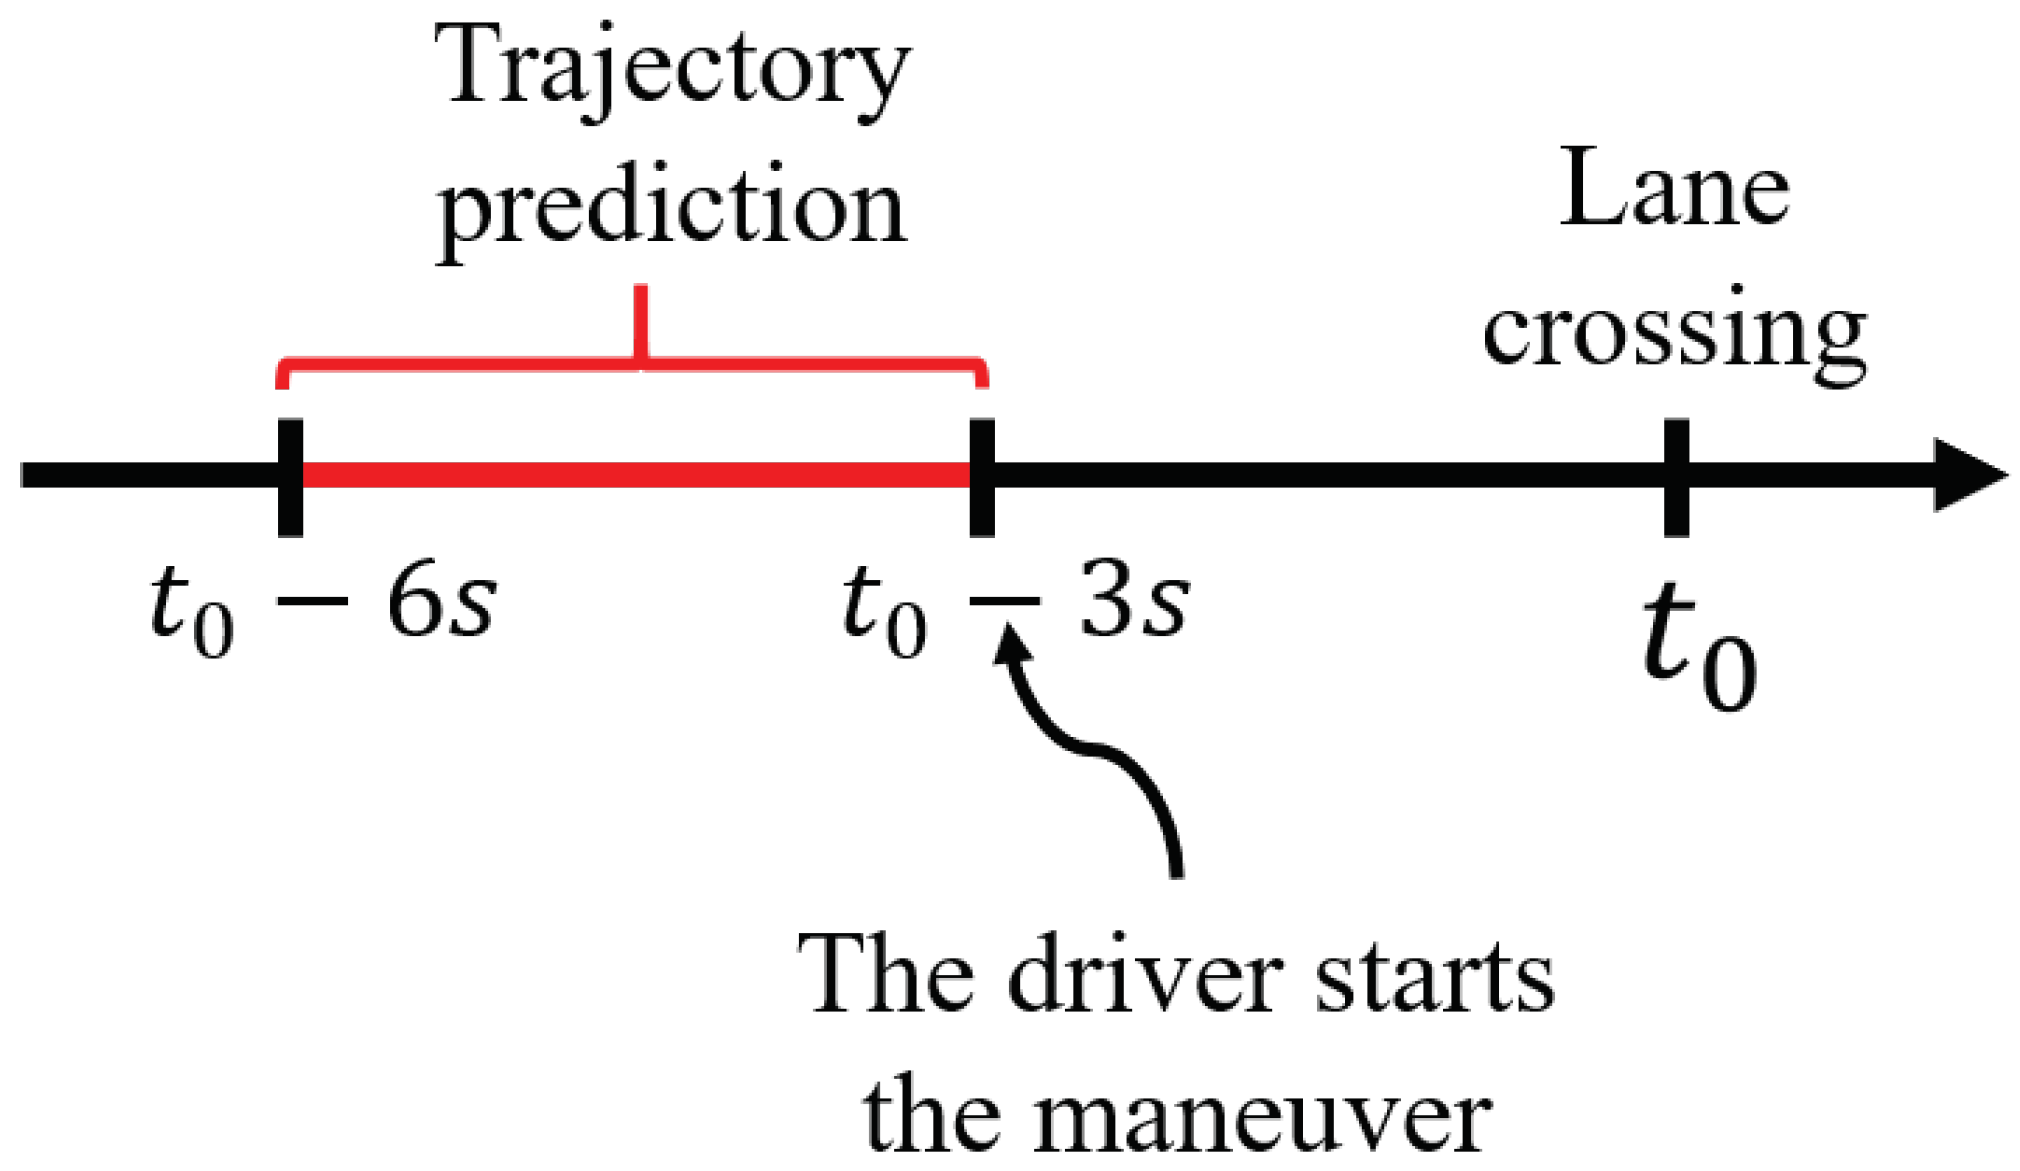
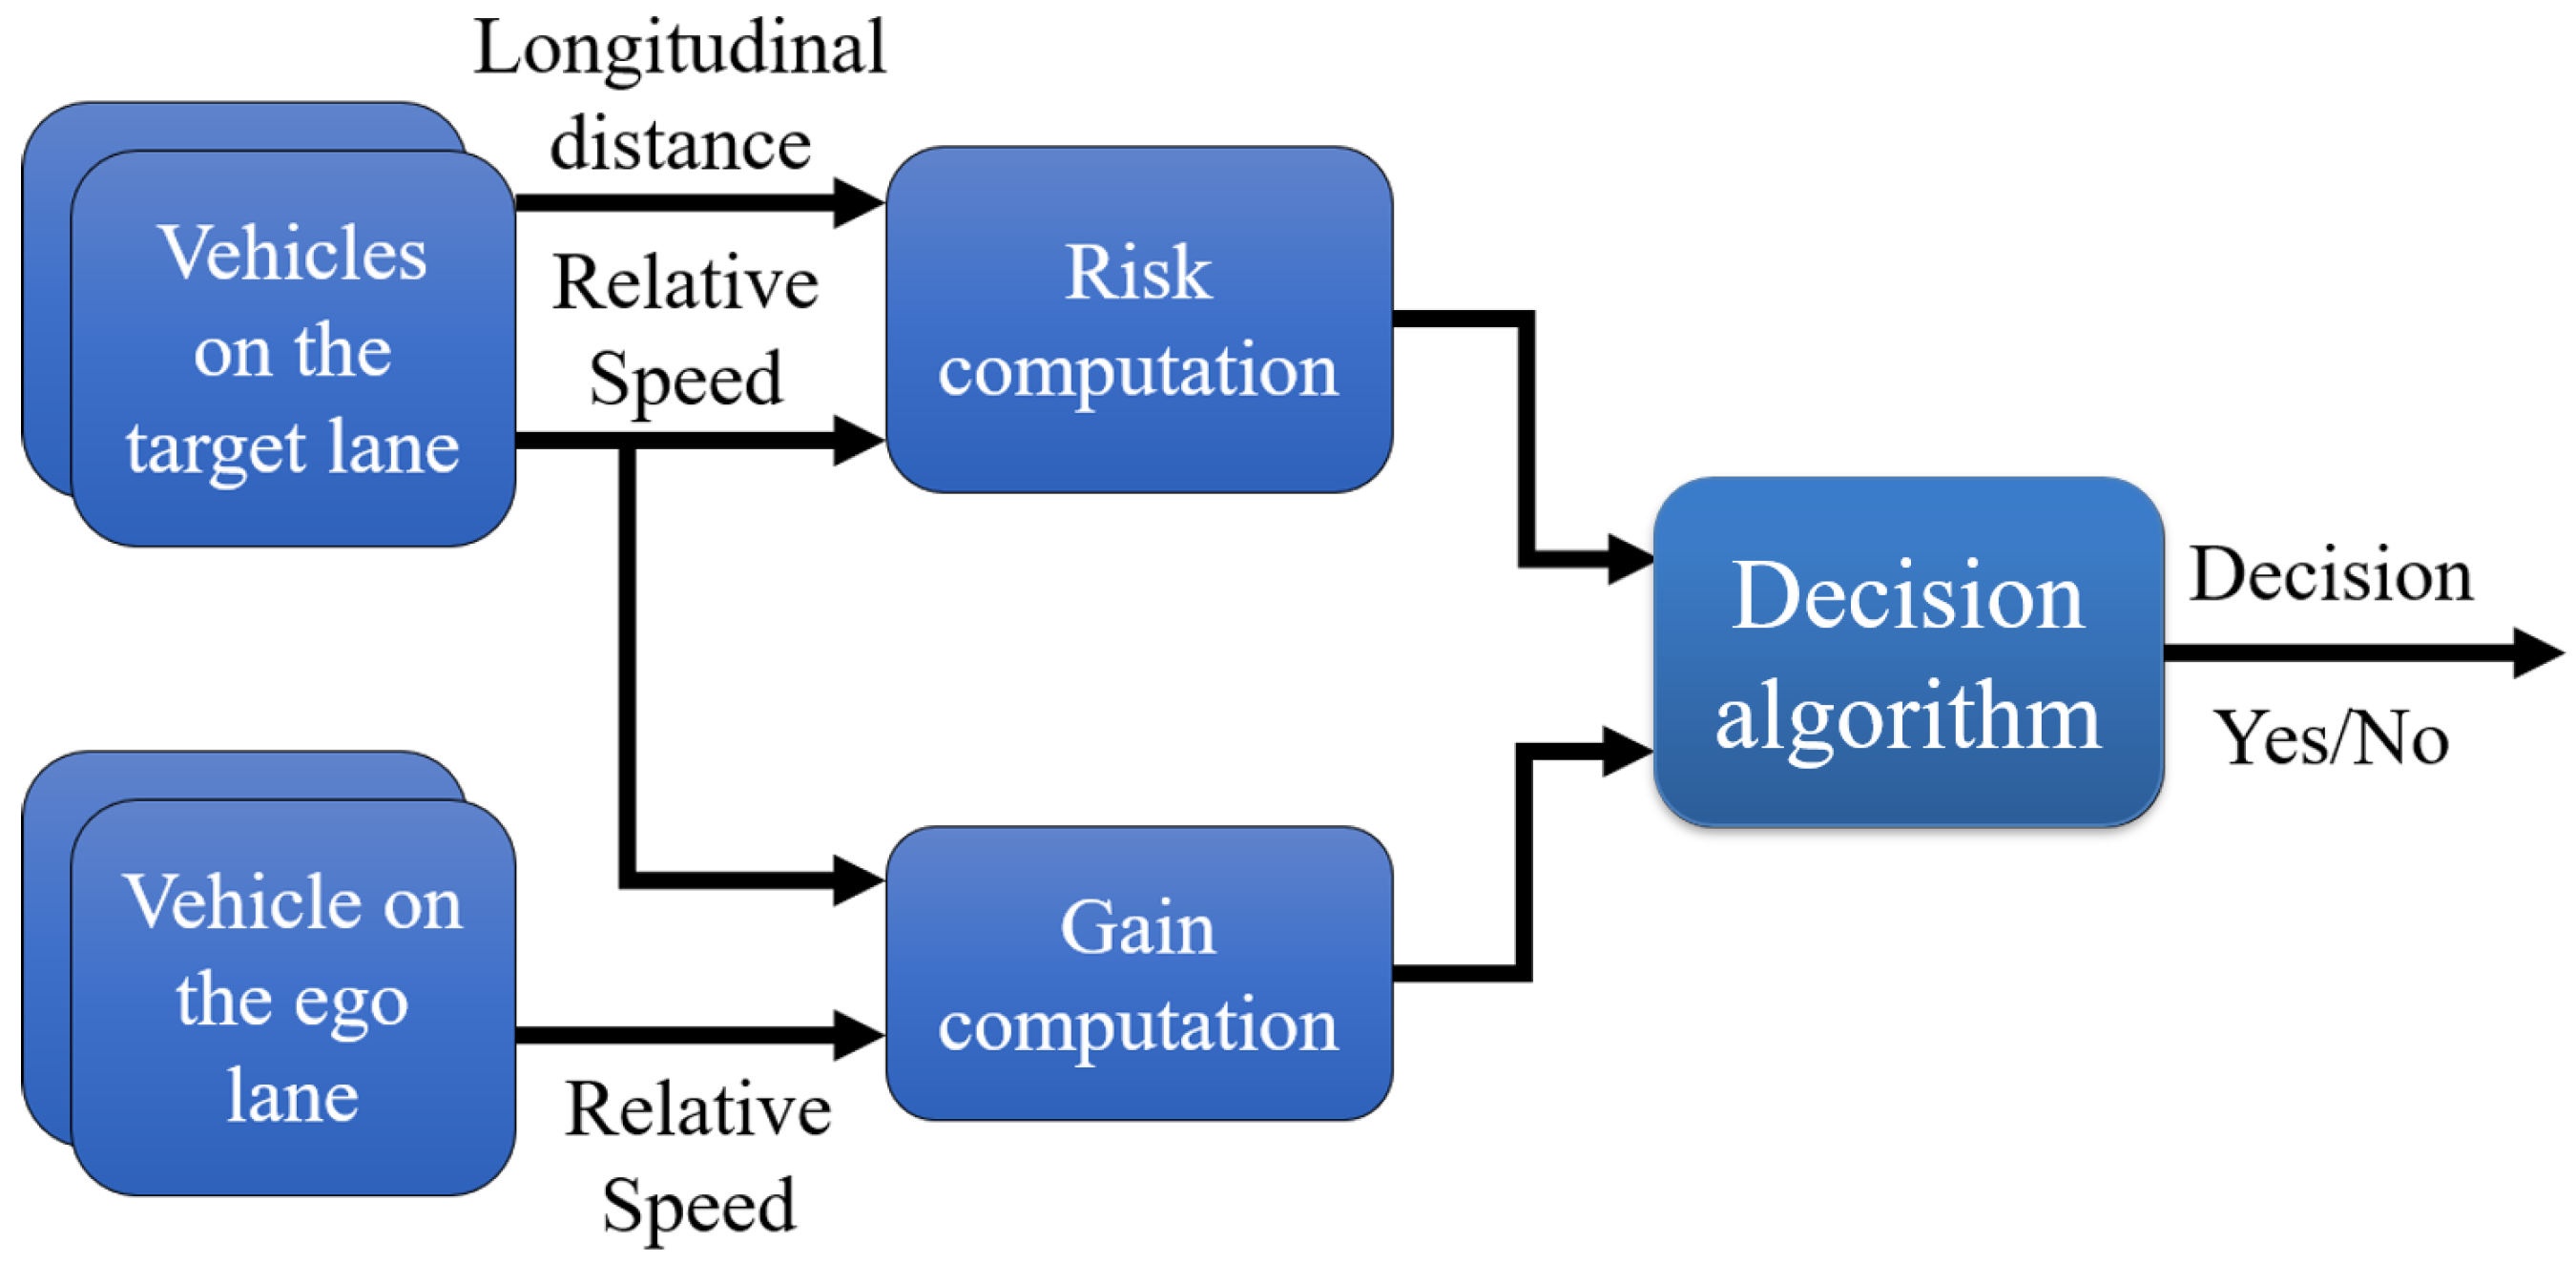
4. Decision Algorithms
4.1. Decision Tree
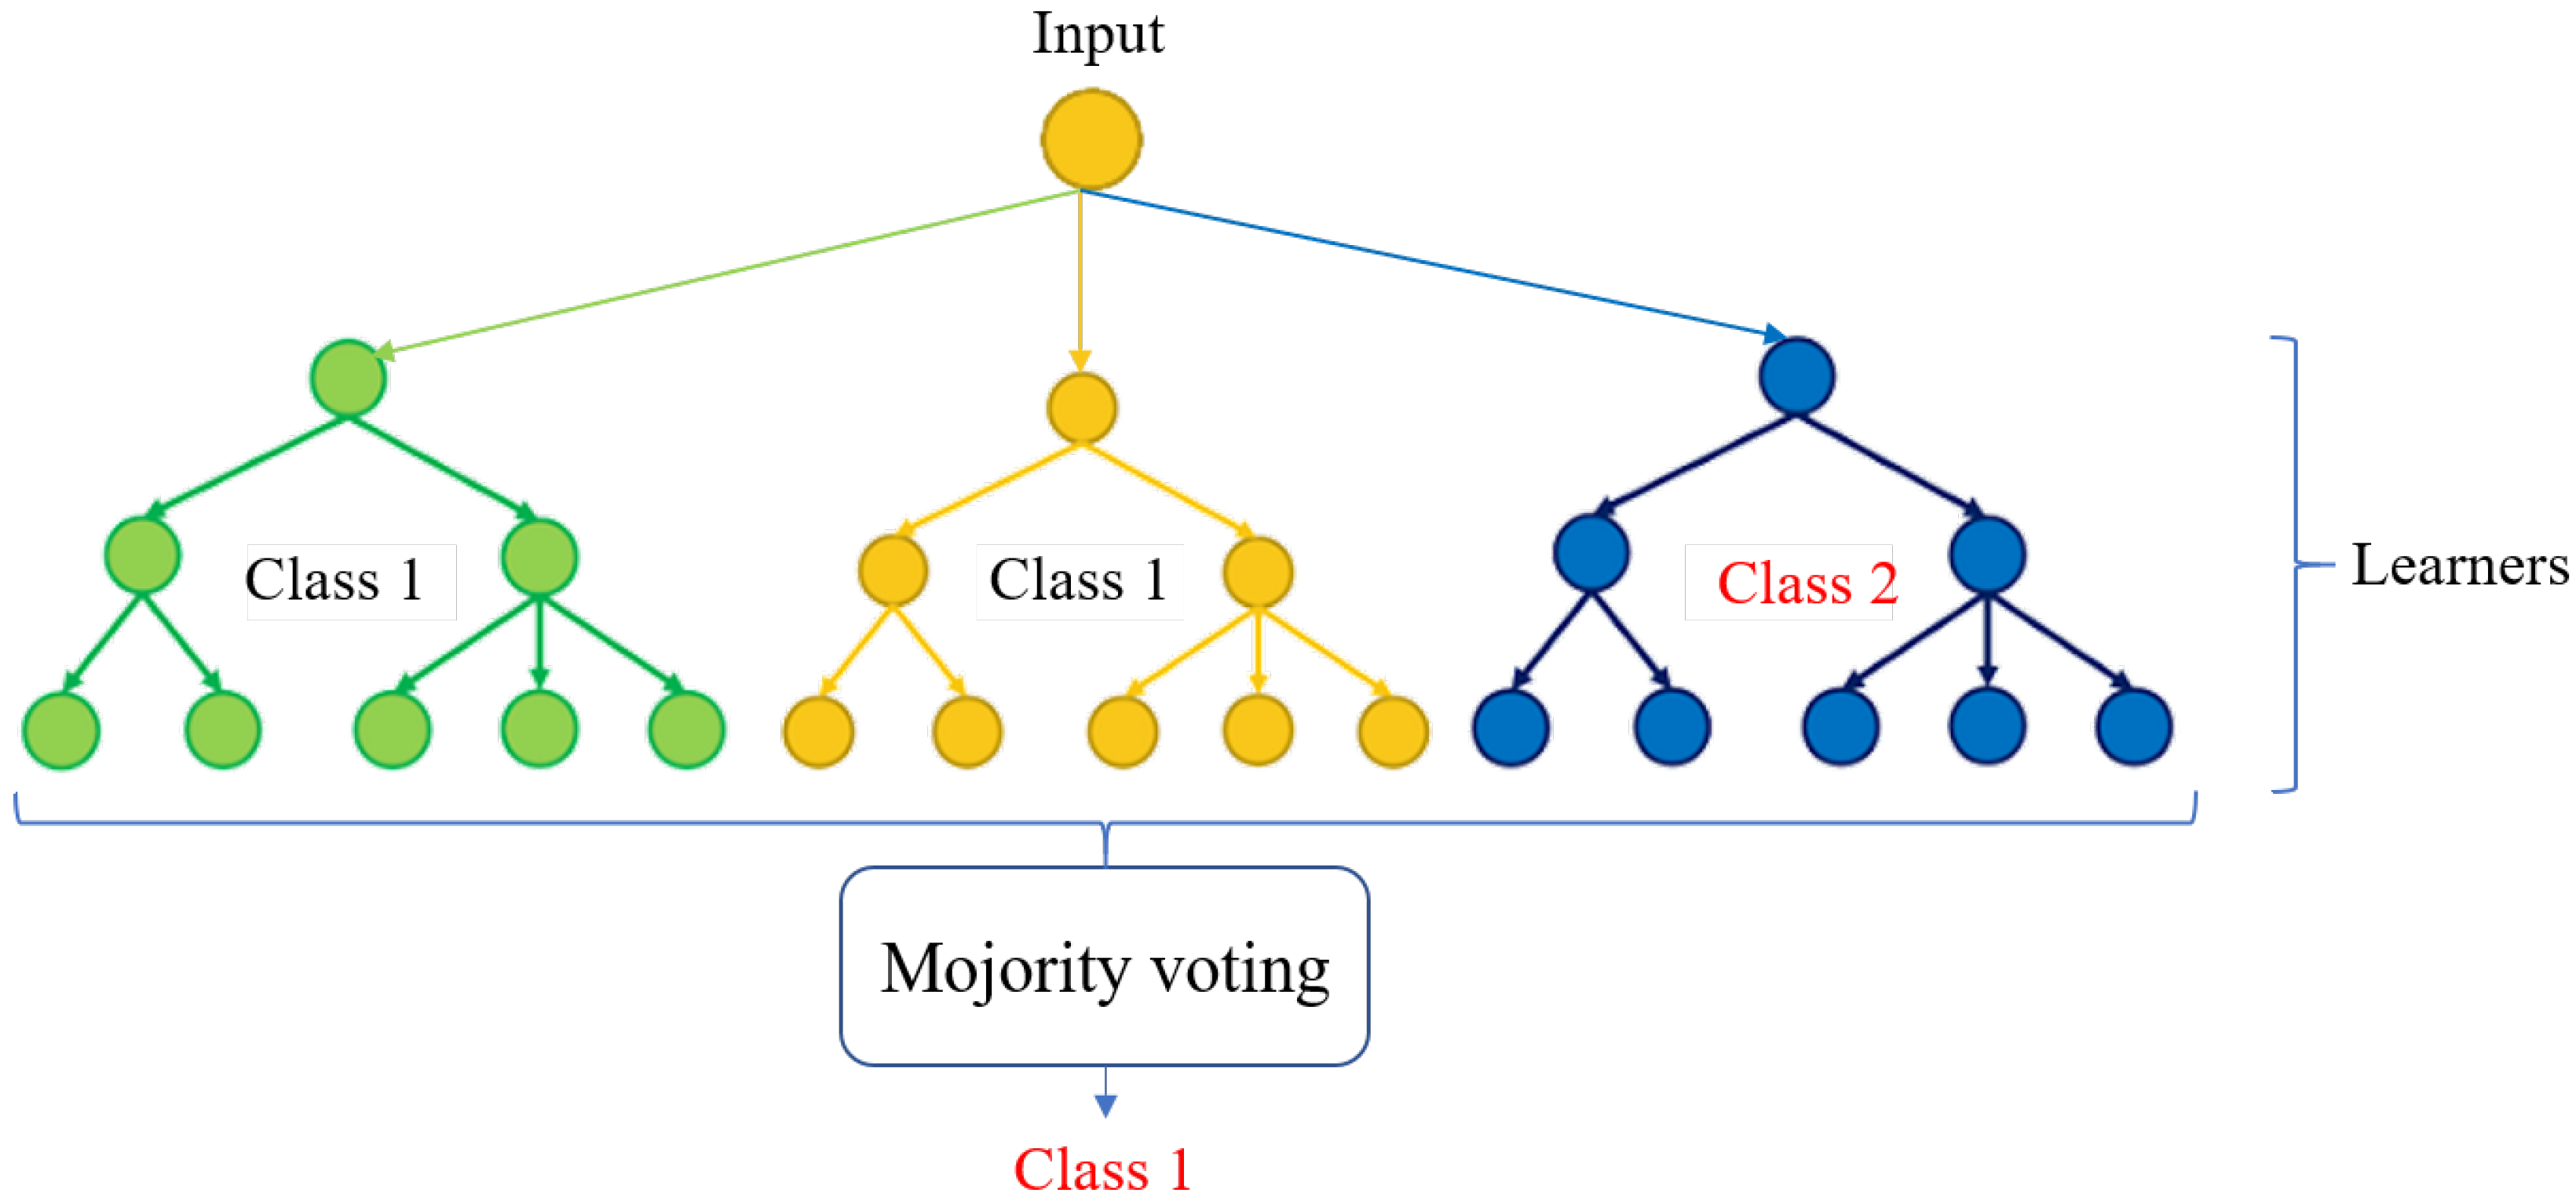
4.2. Random Forest
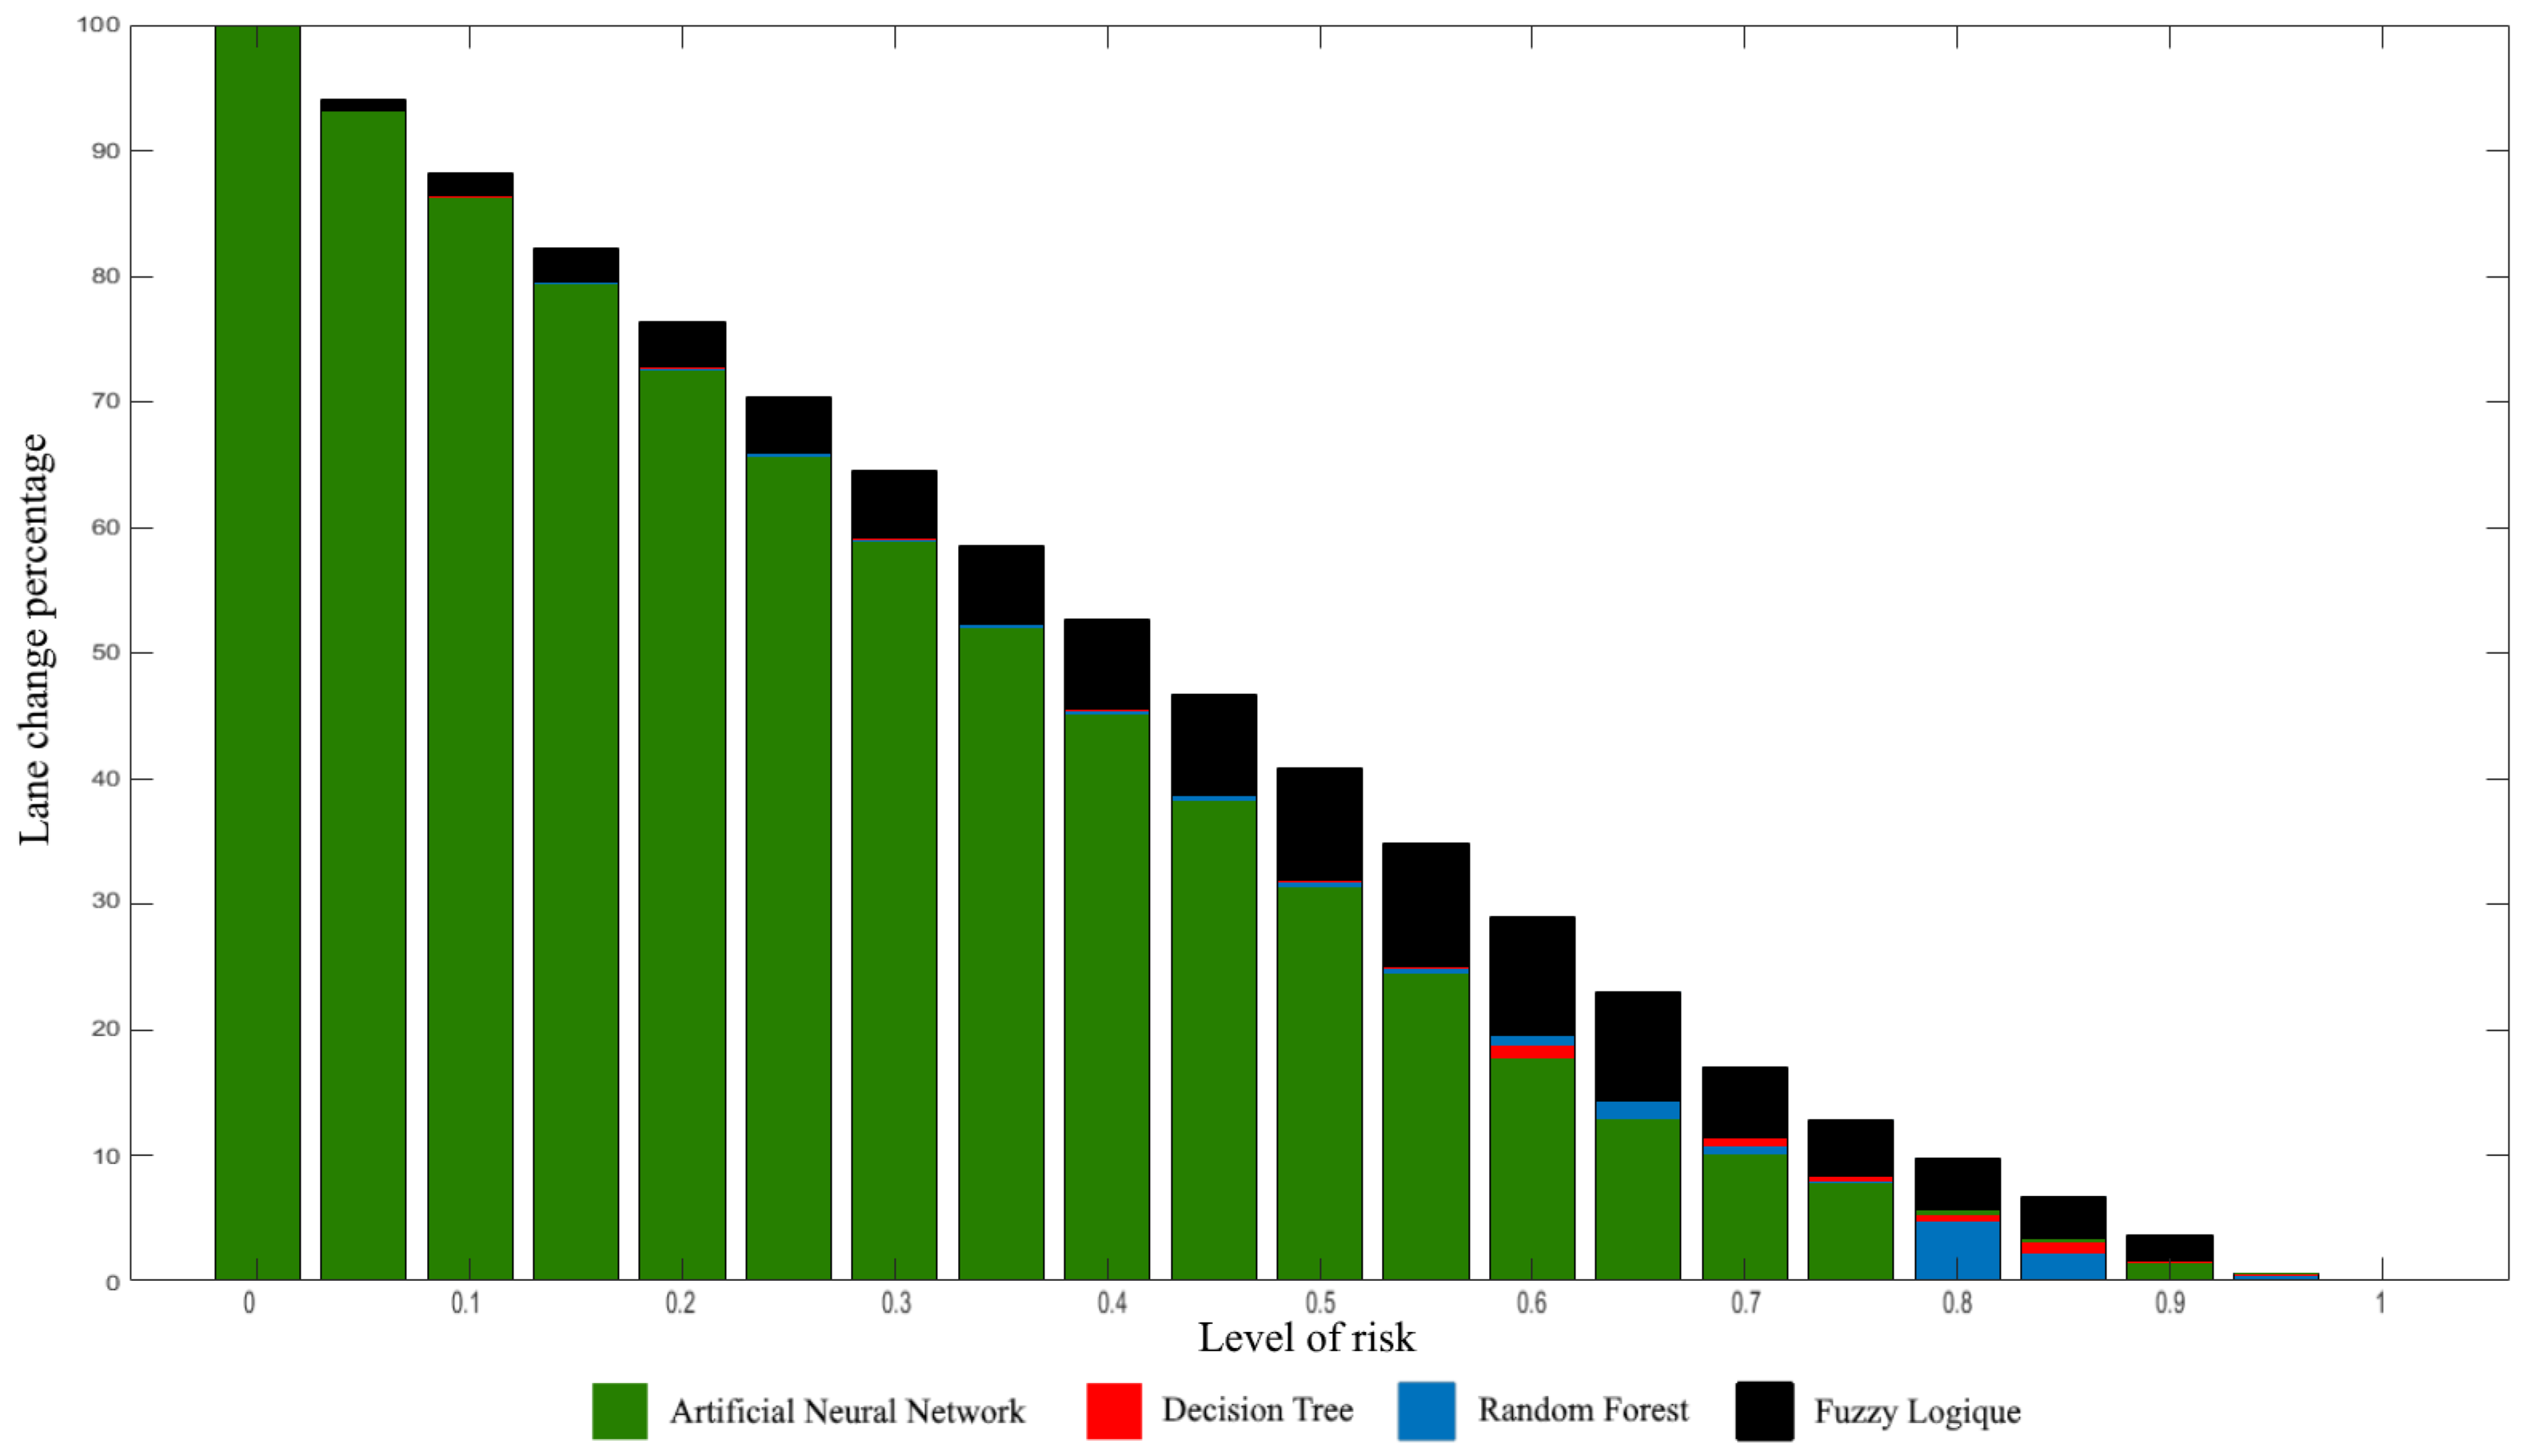
4.3. Artificial Neural Network
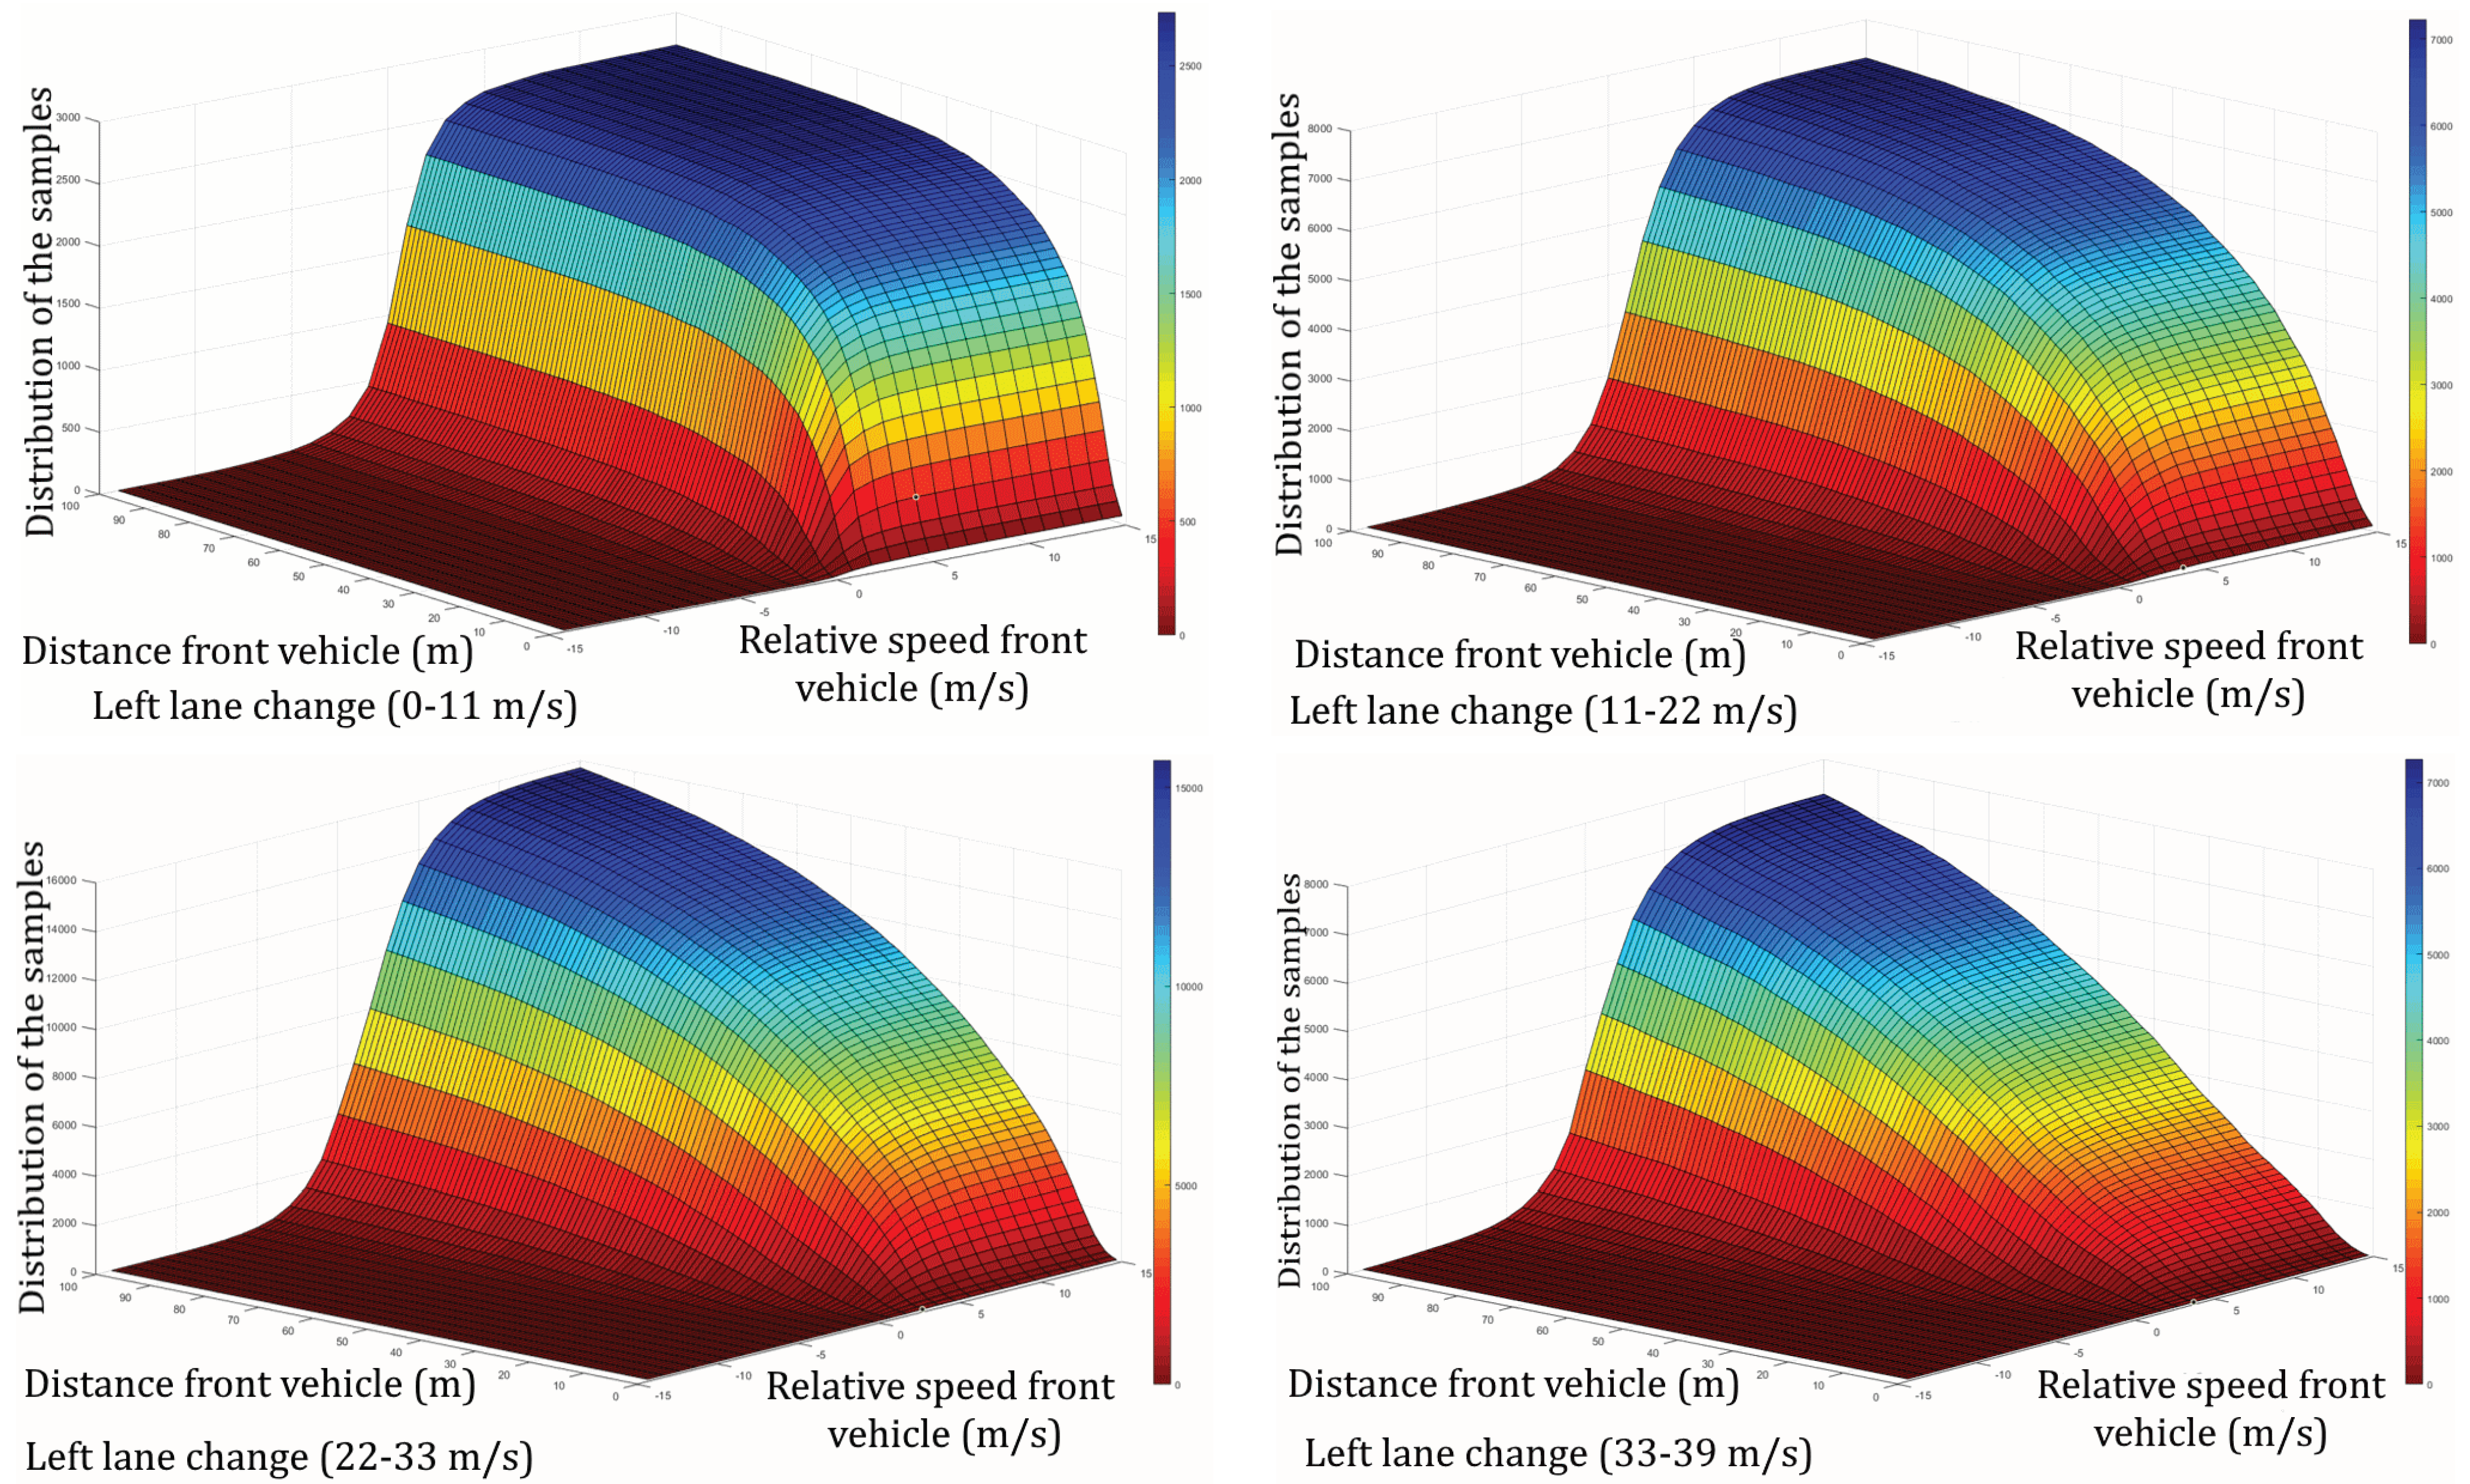
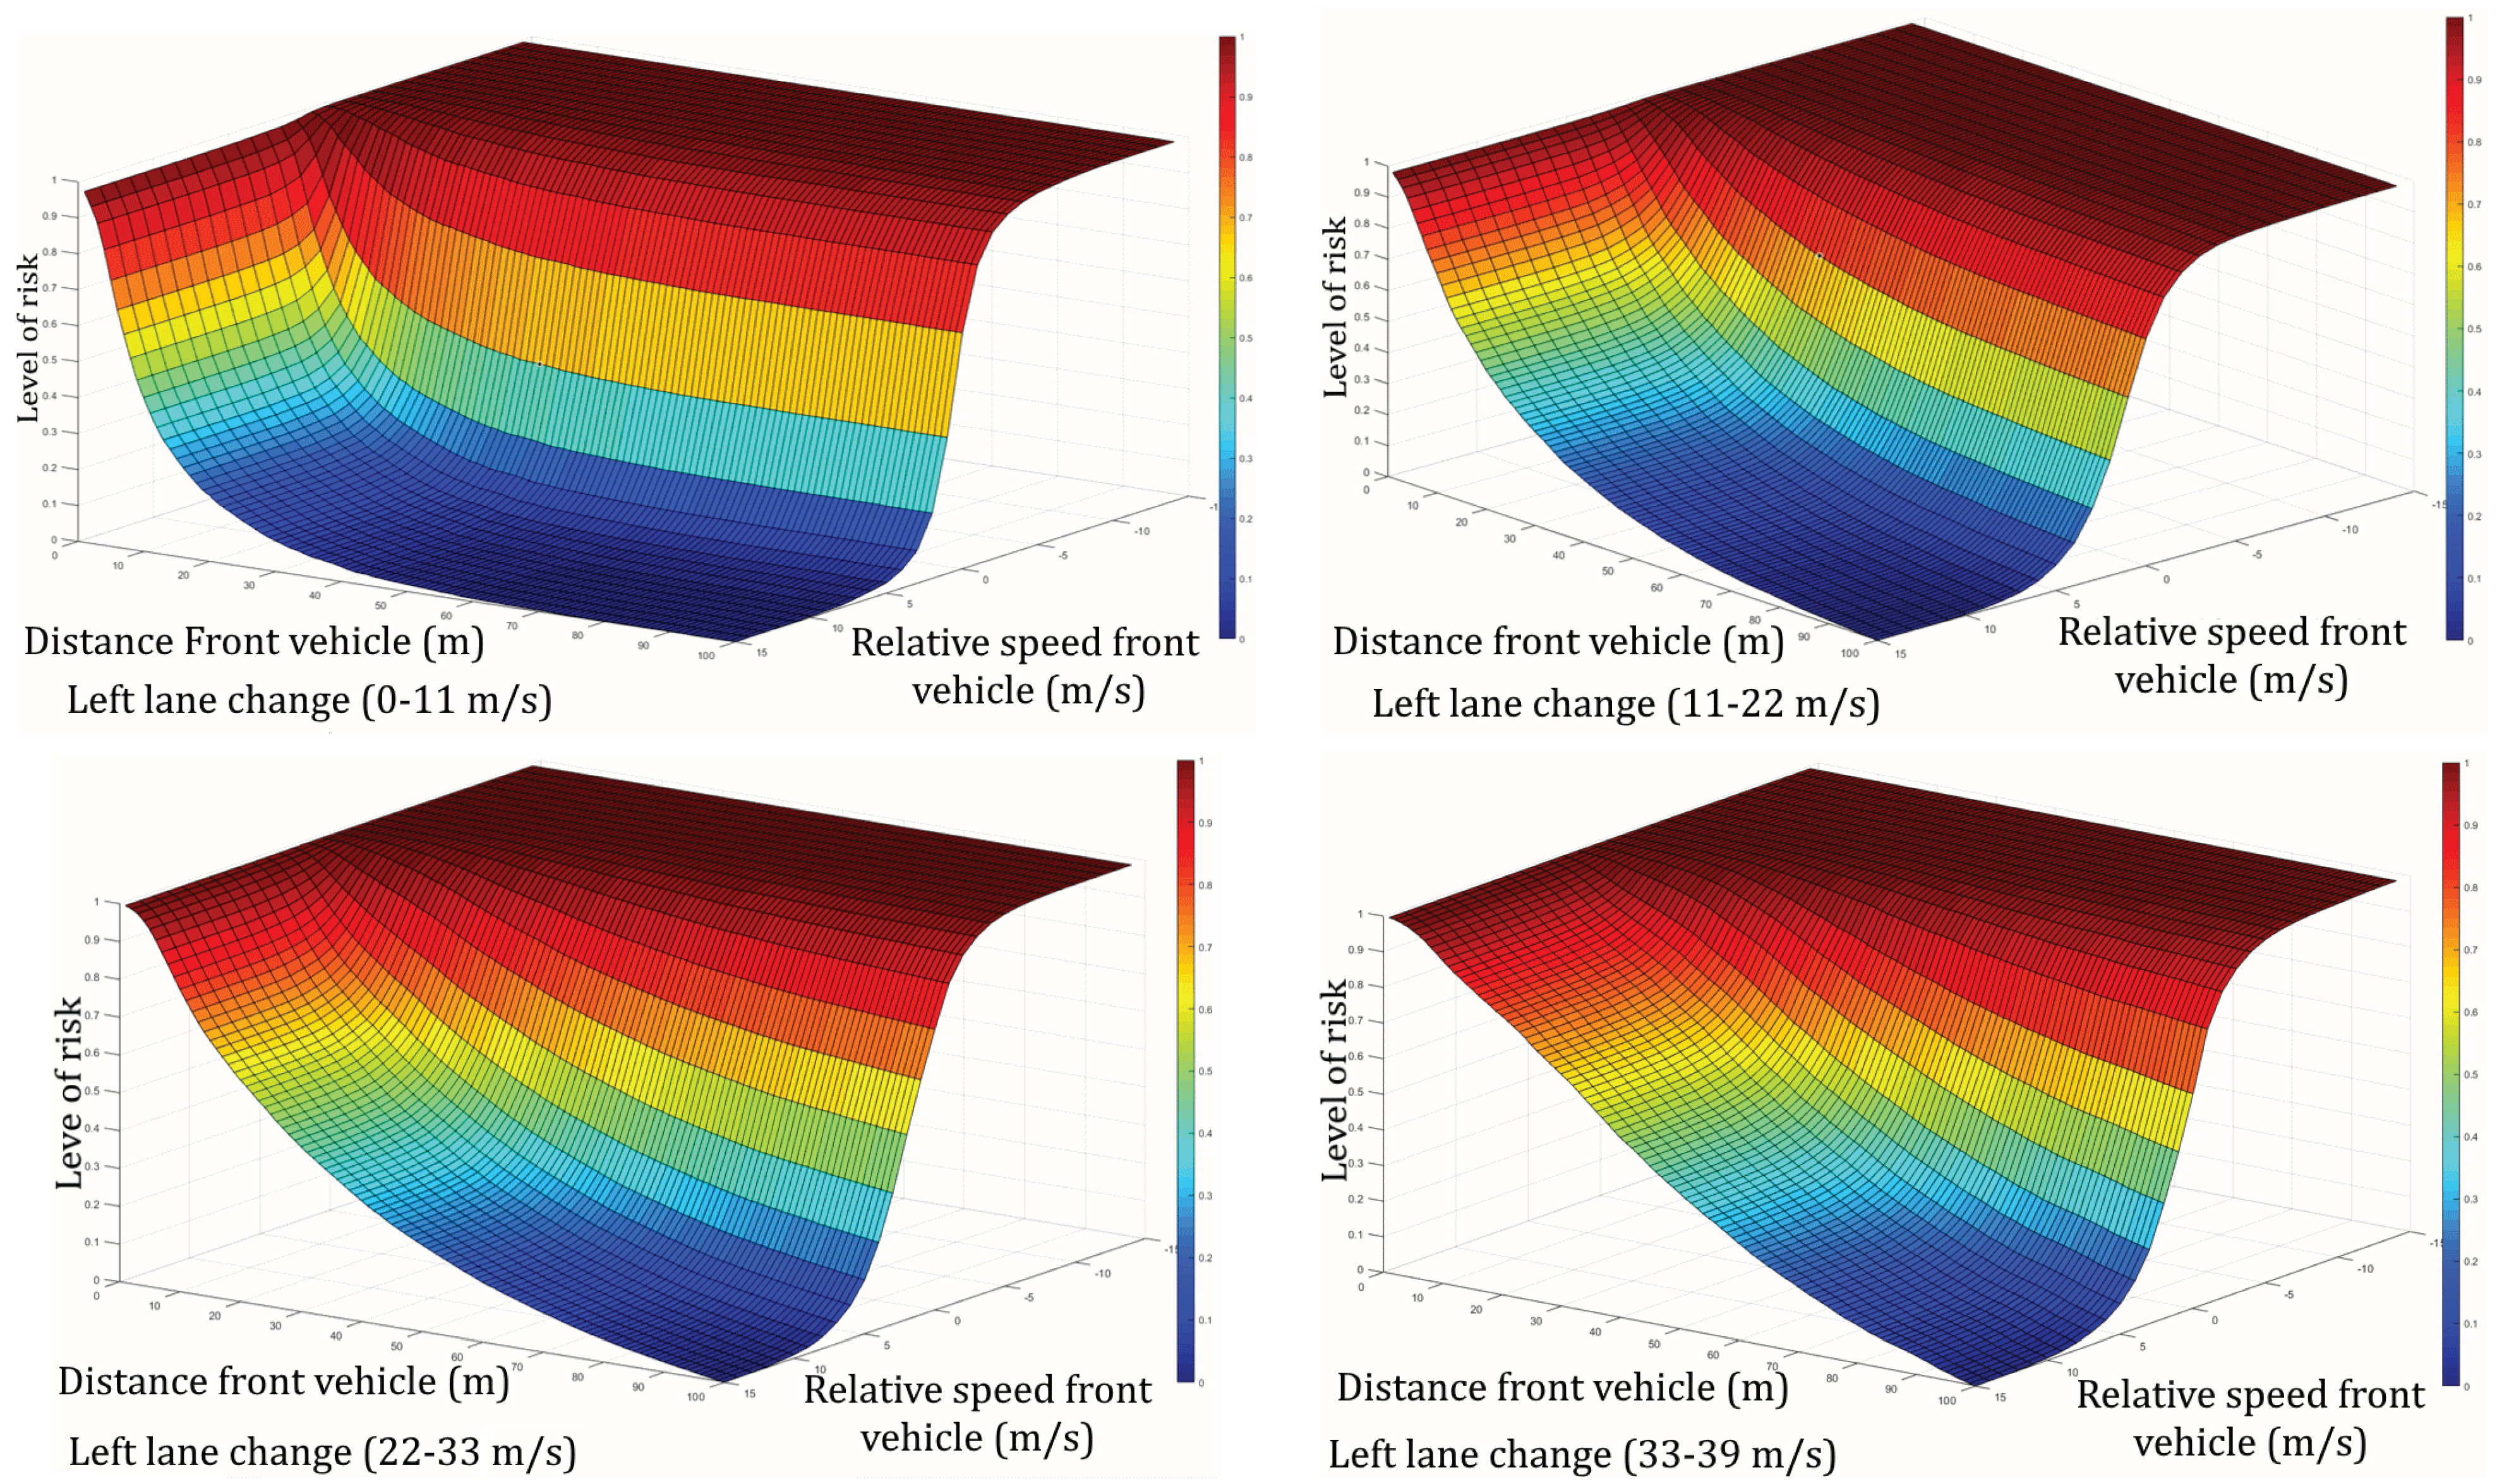
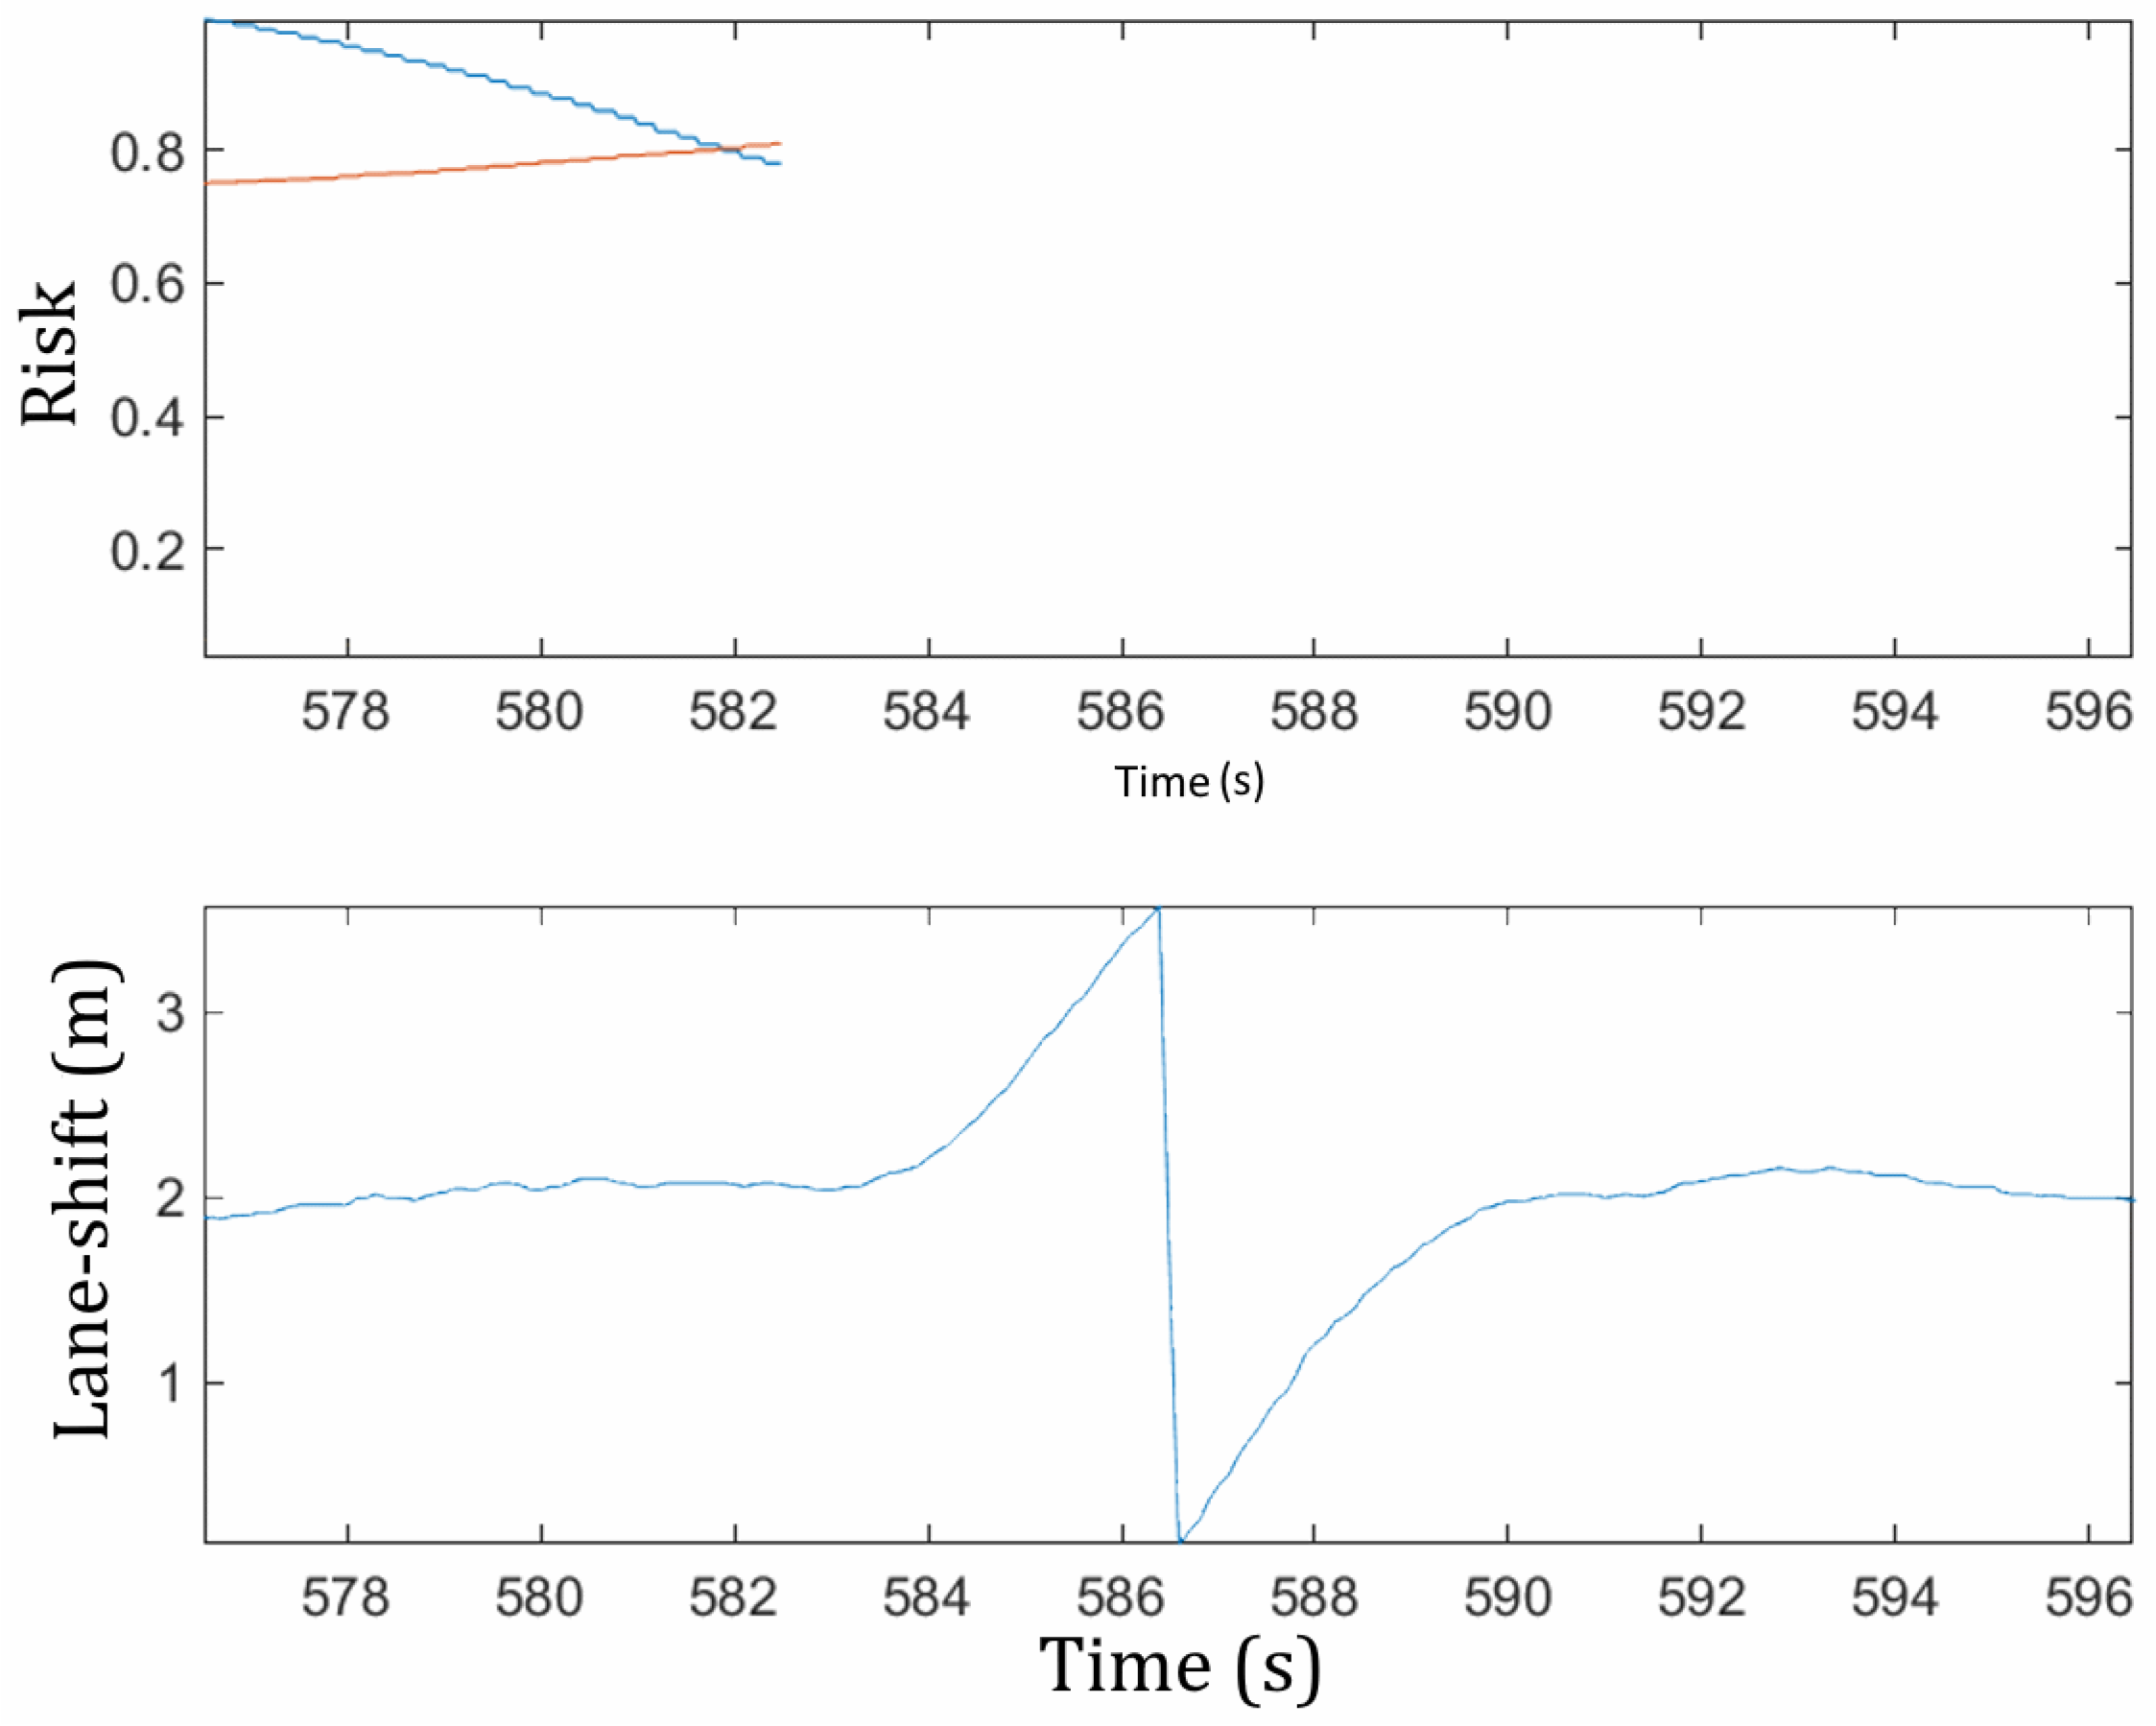
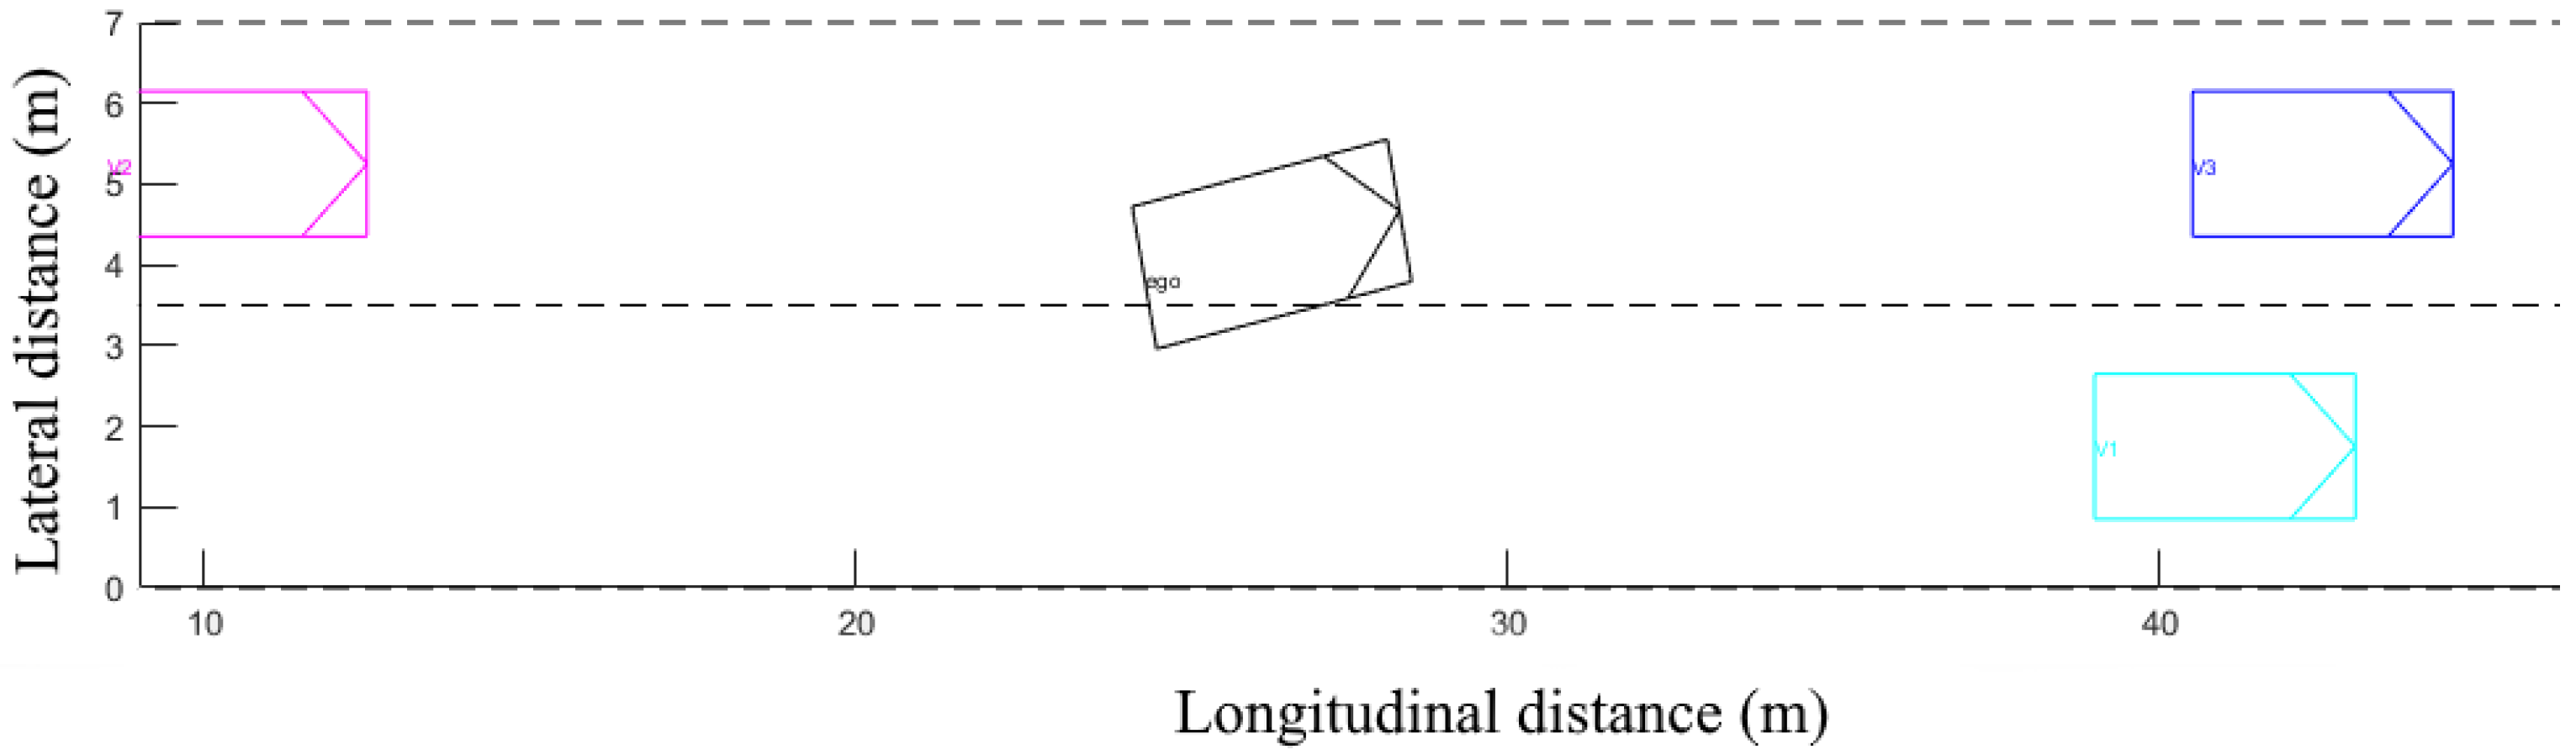
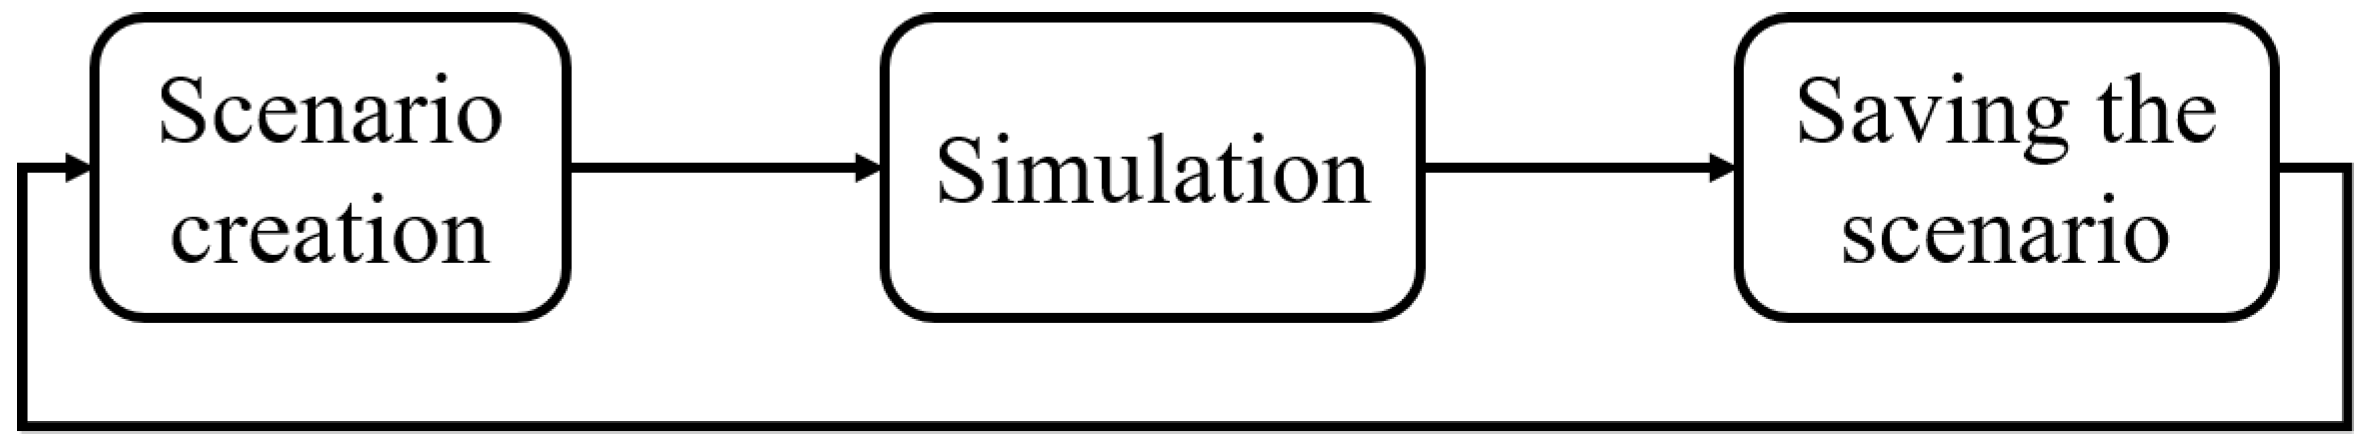
4.4. Driving Simulation
5. Discussion
6. Conclusions
Author Contributions
Funding
Conflicts of Interest
Abbreviations
| TIV | Inter-Vehicular Time |
| TTC | Time To Collision |
| TTR | Time To React |
| CORSIM | CORridor SIMulation |
| ARTEMIS | Analysis of Road Traffic and Evaluation by Micro-Simulation |
| MOBIL | Minimizing Overall Braking Induced by Lane change |
| LMRS | Lane change Model with Relaxation and Synchronization |
| MOOVE | Monitoring Outillé pour le Véhicule dans son Environnement (Tooled Monitoring for the Vehicle in its Environment) |
| SAE | Society of Automotive Engineers |
| ANN | Artificial Neural Network |
References
- J3016_201806; Taxonomy and Definitions for Terms Related to Driving Automation Systems for On-Road Motor Vehicles. SAE International: Warrendale, PA, USA, 2021.
- Abdeen, M.A.R.; Yasar, A.; Benaida, M.; Sheltami, T.; Zavantis, D.; El-Hansali, Y. Evaluating the Impacts of Autonomous Vehicles’ Market Penetration on a Complex Urban Freeway during Autonomous Vehicles’ Transition Period. Sustainability 2022, 14, 10094. [Google Scholar] [CrossRef]
- Papadoulis, A.; Quddus, M.; Imprialou, M. Evaluating the safety impact of connected and autonomous vehicles on motorways. Accid. Anal. Prev. 2019, 124, 12–22. [Google Scholar] [CrossRef] [PubMed]
- Salonen, A.O.; Haavisto, N. Towards Autonomous Transportation. Passengers’ Experiences, Perceptions and Feelings in a Driverless Shuttle Bus in Finland. Sustainability 2019, 11, 588. [Google Scholar] [CrossRef]
- Rasouli, A.; Tsotsos, J.K. Autonomous Vehicles That Interact With Pedestrians: A Survey of Theory and Practice. IEEE Trans. Intell. Transp. Syst. 2020, 21, 900–918. [Google Scholar] [CrossRef]
- Gipps, P.G. A behavioral car-following model for computer simulation. Transp. Res. Part B Methodol. 1981, 15, 105–111. [Google Scholar] [CrossRef]
- Zhang, L.; Cai, S.; Zhang, Y.; Zhang, M. Comparison of lane changing algorithms between NGSIM and CORSIM. In Proceedings of the 2010 IEEE 71st Vehicular Technology Conference (VTC), Taipei, Taiwan, 16–19 May 2010; IEEE: Piscataway, NJ, USA, 2010. [Google Scholar]
- Li, G.; Yang, Y.; Li, S.; Qu, X.; Lyu, N.; Li, S.E. Decision making of autonomous vehicles in lane change scenarios: Deep reinforcement learning approaches with risk awareness. Transp. Res. Part C Emerg. Technol. 2022, 134, 103452. [Google Scholar] [CrossRef]
- Deng, Q.; Söffker, D. Improved Driving Behaviors Prediction Based on Fuzzy Logic-Hidden Markov Model (FL-HMM). In Proceedings of the 2018 IEEE Intelligent Vehicles Symposium (IV), Changshu, China, 26–30 June 2018; pp. 2003–2008. [Google Scholar]
- Mechernene, A.; Judalet, V.; Chaibet, A.; Boukhnifer, M. Lane Change Decision Algorithm based on Risk Prediction and Fuzzy Logic Method. In Proceedings of the 2021 25th International Conference on System Theory, Control and Computing (ICSTCC); IEEE: Piscataway, NJ, USA, 2021. [Google Scholar]
- Guo, J.; Kurup, U.; Shah, M. Is it Safe to Drive? An Overview of Factors, Metrics, and Datasets for Driveability Assessment in Autonomous Driving. IEEE Trans. Intell. Transp. Syst. 2020, 21, 3135–3151. [Google Scholar] [CrossRef]
- Iberraken, D.; Adouane, L.; Denis, D. Reliable risk management for autonomous vehicles based on sequential bayesian decision networks and dynamic inter-vehicular assessment. In Proceedings of the 2019 IEEE Intelligent Vehicles Symposium (IV), Paris, France, 9–12 June 2019; IEEE: Piscataway, NJ, USA, 2019; pp. 2344–2351. [Google Scholar]
- Brannstrom, M.; Coelingh, E.; Sjoberg, J. Model-Based Threat Assessment for Avoiding Arbitrary Vehicle Collisions. IEEE Trans. Intell. Transport. Syst. 2010, 11, 658–669. [Google Scholar] [CrossRef]
- Tamke, A.; Dang, T.; Breuel, G. A flexible method for criticality assessment in driver assistance systems. In Proceedings of the 2011 IEEE Intelligent Vehicles Symposium (IV), Baden-Baden, Germany, 5–9 June 2011; pp. 697–702. [Google Scholar] [CrossRef]
- Hillenbrand, J.; Spieker, A.M.; Kroschel, K. A Multilevel Collision Mitigation Approach-Its Situation Assessment, Decision Making, and Performance Tradeoffs. IEEE Trans. Intell. Transport. Syst. 2006, 7, 528–540. [Google Scholar] [CrossRef]
- Laugier, C.; Paromtchik, I.E.; Perrollaz, M.; Yong, M.; Yoder, J.D.; Tay, C.; Mekhnacha, K.; Nègre, A. Probabilistic analysis of dynamic scenes and collision risks assessment to improve driving safety. IEEE Intell. Transp. Syst. Mag. 2011, 3, 4–19. [Google Scholar] [CrossRef]
- Rahman, M.; Chowdhury, M.; Xie, Y.; He, Y. Review of microscopic lane-changing models and future research opportunities. IEEE Trans. Intell. Transp. Syst. 2013, 14, 1942–1956. [Google Scholar] [CrossRef]
- Hidas, P. Modelling vehicle interactions in microscopic simulation of merging and weaving. Transp. Res. Part C Emerg. Technol. 2005, 13, 37–62. [Google Scholar] [CrossRef]
- He, S.; Zeng, J.; Zhang, B.; Sreenath, K. Rule-Based Safety-Critical Control Design using Control Barrier Functions with Application to Autonomous Lane Change. In Proceedings of the 2021 American Control Conference (ACC), New Orleans, LA, USA, 25–28 May 2021; pp. 178–185. [Google Scholar]
- Wang, J.; Zhang, Q.; Zhao, D.; Chen, Y. Lane Change Decision-making through Deep Reinforcement Learning with Rule-based Constraints. In Proceedings of the 2019 International Joint Conference on Neural Networks (IJCNN), Budapest, Hungary, 14–19 July 2019; pp. 1–6. [Google Scholar]
- Vechione, M.; Cheu, R.L. Comparative evaluation of adaptive fuzzy inference system and adaptive neuro-fuzzy inference system for mandatory lane changing decisions on freeways. J. Intell. Transp. Syst. 2021, 1–15. [Google Scholar] [CrossRef]
- Kesting, A.; Treiber, M.; Helbing, D. General lane-changing model MOBIL for car-following models. Transportation Research Record: J. Transp. Res. Board 2007, 1999, 86–94. [Google Scholar] [CrossRef]
- Schakel, W.J.; Knoop, V.L.; van Arem, B. Integrated lane change model with relaxation and synchronization. Transp. Res. Rec. J. Transp. Res. Board 2012, 2316, 47–57. [Google Scholar] [CrossRef]
- Latrech, C.; Chaibet, A.; Boukhnifer, M.; Glaser, S. Integrated longitudinal and lateral networked control system design for vehicle platooning. Sensors 2018, 18, 3085. [Google Scholar] [CrossRef] [PubMed]
- Chen, J.; Bhat, M.; Jiang, S.; Zhao, D. Advanced Driver Assistance Strategies for a Single-Vehicle Overtaking a Platoon on the Two-Lane Two-Way Road. IEEE Access 2020, 8, 77285–77297. [Google Scholar] [CrossRef]
- Bonic, L.; Galizia, A.D.; Bracquemond, A. Identification of Real-World Driving Scenarios for the Functional Safety of Autonomous Vehicles; EVS30 Symposium: Stuttgart, Germany, 2017; pp. 369–376. [Google Scholar]
- Mechernene, A.; Judalet, V.; Chaibet, A.; Boukhnifer, M. Risk analysis method for a lane change maneuvers on highways. In Proceedings of the 2020 International Conference on Control, Automation and Diagnosis (ICCAD), Paris, France, 7–9 October 2020; IEEE: Piscataway, NJ, USA, 2020; pp. 1–7. [Google Scholar]
- Benterki, A.; Boukhnifer, M.; Judalet, V.; Maaoui, C. Artificial intelligence for vehicle behavior anticipation: Hybrid approach based on maneuver classification and trajectory prediction. IEEE Access 2020, 8, 56992–57002. [Google Scholar] [CrossRef]
- Benterki, A.; Judalet, V.; Choubeila, M.; Boukhnifer, M. Long-Term Prediction of Vehicle Trajectory Using Recurrent Neural Networks. In Proceedings of the IECON 2019—45th Annual Conference of the IEEE Industrial Electronics Society, Lisbon, Portugal, 14–17 October 2019; pp. 3817–3822. [Google Scholar]
- Krajewski, R.; Bock, J.; Kloeker, L.; Eckstein, L. The highd dataset: A drone dataset of naturalistic vehicle trajectories on german highways for validation of highly automated driving systems. In Proceedings of the 21st International Conference on Intelligent Transportation Systems (ITSC), Maui, HI, USA, 4–7 November 2018; IEEE: Piscataway, NJ, USA, 2018. [Google Scholar]


| Decision Tree | |||
|---|---|---|---|
| Positive | Negative | ||
| Real Decision | Positive | 75.53% | 24.47% |
| Negative | 21.64% | 78.36% | |
| Random Forest | |||
|---|---|---|---|
| Positive | Negative | ||
| Real Decision | Positive | 87.3% | 12.7% |
| Negative | 20.7% | 79.3% | |
| ANN | |||
|---|---|---|---|
| Positive | Negative | ||
| Real Decision | Positive | 75.84% | 24.16% |
| Negative | 21.50% | 78.50% | |
| Positive | Negative | |
|---|---|---|
| Decision Tree | 37.06% | 62.93% |
| Random Forest | 36.07% | 63.93% |
| ANN | 36.58% | 63.42% |
| Fuzzy Logic | 33.11% | 66.89% |
Publisher’s Note: MDPI stays neutral with regard to jurisdictional claims in published maps and institutional affiliations. |
© 2022 by the authors. Licensee MDPI, Basel, Switzerland. This article is an open access article distributed under the terms and conditions of the Creative Commons Attribution (CC BY) license (https://creativecommons.org/licenses/by/4.0/).
Share and Cite
Mechernene, A.; Judalet, V.; Chaibet, A.; Boukhnifer, M. Detection and Risk Analysis with Lane-Changing Decision Algorithms for Autonomous Vehicles. Sensors 2022, 22, 8148. https://doi.org/10.3390/s22218148
Mechernene A, Judalet V, Chaibet A, Boukhnifer M. Detection and Risk Analysis with Lane-Changing Decision Algorithms for Autonomous Vehicles. Sensors. 2022; 22(21):8148. https://doi.org/10.3390/s22218148
Chicago/Turabian StyleMechernene, Amin, Vincent Judalet, Ahmed Chaibet, and Moussa Boukhnifer. 2022. "Detection and Risk Analysis with Lane-Changing Decision Algorithms for Autonomous Vehicles" Sensors 22, no. 21: 8148. https://doi.org/10.3390/s22218148
APA StyleMechernene, A., Judalet, V., Chaibet, A., & Boukhnifer, M. (2022). Detection and Risk Analysis with Lane-Changing Decision Algorithms for Autonomous Vehicles. Sensors, 22(21), 8148. https://doi.org/10.3390/s22218148