Abstract
Dental age is one of the most reliable methods for determining a patient’s age. The timing of teething, the period of tooth replacement, or the degree of tooth attrition is an important diagnostic factor in the assessment of an individual’s developmental age. It is used in orthodontics, pediatric dentistry, endocrinology, forensic medicine, and pathomorphology, but also in scenarios regarding international adoptions and illegal immigrants. The methods used to date are time-consuming and not very precise. For this reason, artificial intelligence methods are increasingly used to estimate the age of a patient. The present work is a continuation of the work of Zaborowicz et al. In the presented research, a set of 21 original indicators was used to create deep neural network models. The aim of this study was to verify the ability to generate a more accurate deep neural network model compared to models produced previously. The quality parameters of the produced models were as follows. The MAE error of the produced models, depending on the learning set used, was between 2.34 and 4.61 months, while the RMSE error was between 5.58 and 7.49 months. The correlation coefficient R2 ranged from 0.92 to 0.96.
1. Introduction
Dental age is one of the most reliable methods for determining the maturity of an organism [1]. It is extremely useful in areas such as orthodontics, pediatric dentistry, endocrinology, anthropology, or forensic medicine [2,3,4,5,6,7,8,9]. It allows us to determine whether the body is developing properly and when a pubertal growth spurt occurs. Moreover, the dental age assessment can be used to determine the age of individuals without identification documents or those suspected of having falsified documents, with memory loss, illegal immigrants, or international adoptions [10,11].
Age determination using pantomographic radiographs is an easy, widely available, and low-cost method. In children, the developmental stages of tooth buds, mineralization of crowns and roots, and the eruption stages of teeth can be assessed [12,13,14]. In the elderly, changes in the dentition are not very noticeable, thus age assessment is much more difficult. However, it is possible to take advantage of the fact that, with age, odontoblasts deposit more and more secondary dentin, causing a reduction in pulp chamber volume. Methods that analyze the alveolar bone level have also been described [15,16,17].
The commonly used methods to determine dental age, such as Demirjian’s method, Schour and Massler’s method, Ubelaker’s method, Moorres’, Fanning and Hunt’s method, Noll’s method, or Gustafson and Koch’s method, are methods developed in the previous century [13,18,19,20,21,22]. The phenomenon of acceleration, or growth spurt, occurring in the population makes these methods inaccurate. Therefore, there are noticeable discrepancies between the chronological age and the age determined from the developed tables, atlases, and charts [23,24,25,26].
Determining the dental age based on tables and charts is also time-consuming and subjective. The doctor themselves must compare the degree of development of the buds of most teeth on the patient’s pantomographic image with the images presented in the studies.
Taking into account the limitations of the methods used to date and the individual variability of the human body, the search began for objective methods which do not require the involvement of a physician in the assessment of the patient’s age and which can cope with non-linear biological issues. Innovations in the field of computer science, including methods of artificial intelligence, are increasingly used in medicine. They support diagnosis and improve treatment efficiency [27,28,29,30,31,32,33,34,35,36,37,38,39,40,41,42,43,44,45].
In scientific databases such as Web of Science and Scopus, one can find many papers confirming the effectiveness and efficiency of artificial neural networks in dentistry, including the assessment of dental age.
The application of artificial neural networks in information and image processing in dentistry was presented by Kim et al. in 2021 [46]. They investigated the estimation of age groups by applying a conventional neural network (CNN) using X-ray images of first molars on pantomographic images. The data set consisted of images of maxillary and mandibular first molars on the right and left sides. In total, 1586 pantomographic images were used in the study. The conventional neural network produced was shown to focus on anatomical parameters such as the dental pulp chamber, alveolar bone level, and interdental space. The efficiency of the networks generated in this way was very high, ranging between 87.04 and 88.33%. It was also shown that there were slight differences depending on the location of the first molar.
The team of Farhadian et al. [47] presented another example of the use of artificial intelligence in the assessment of dental age. The study used 300 scans taken with cone beam computed tomography (CBCT) of individuals between 14 and 60 years. Researchers assessed the ratio between the dental pulp and the tooth. Additionally, a neural network model was compared with a linear regression model. The results presented show that the neural network model has a lower root mean square error (RMSE) of 4.40 years and mean absolute error (MAE) of 4.12 years, compared to the linear regression model, which had an RMSE of 10.26 years and an MAE of 8.17 years.
In contrast, the 2021 paper by Banjšak et al. [48] used deep convolutional neural networks to estimate the age group. The learning set consisted of 4035 pantomographic images. The developed neural network was used to estimate the age of 89 archaeological skull remains. The accuracy of the developed network is 73%.
Deep convolutional neural networks were also presented in the works of Milošević et al. [49] and Kahaki et al. [50]. They evaluated the accuracy of dental age estimation from X-rays. Milošević’s team created a learning set consisting of 4035 pantomographic radiographs and 76,416 dental radiographs of individuals aged 19–90 years. The median error was 2.95 years for panoramic images and 4.68 years for single tooth images. Kahaki’s team, on the other hand, evaluated the effectiveness of estimating a patient’s age using artificial intelligence using 456 pantomographic images of children between the ages of 1 and 17. They created 12 neural networks representing the age groups: 1–4, 5–7, 8–10, 11–13, 14–17, and 1–17 by male and female gender. The networks for the age group 14–17 for each gender have the highest test quality of over 90%. For the other age groups, the test quality was more than 80%.
One of the most recent papers on metric age assessment of children and adolescents on pantomographic radiographs is by Zabrowicz et al. [51]. They developed a set of 21 tooth and bone indicators and investigated whether it is possible to create a neural model to support the assessment of metric age. In this study, three models were generated: one for men and women, a separate one for women, and a separate one for men. The created artificial neural network model containing cases of men and women allows us to determine the metric age with a quality for the test set of 0.997394 and an error for the test set of 0.036526. On the contrary, the model containing cases of women only had a quality for the test set of 0.963090 and an error for the test set of 0.033634, while the test quality of the model determining the metric age of men was 0.999342 and the error for the test set was 0.039840.
Artificial neural network is an information processing system whose structure and operating principle resemble the information processing system in a human neuron. It is on biological inspiration that artificial neuron schemes and structure are based.
Currently, neural modeling is a method widely used by scientists and in industry. Neural networks are a computer tool that can solve complex problems without prior mathematical formalization.
Neural modelling is very popular method in the biological and medical community [52]. It can be used in many diagnostic aspects [53,54,55,56,57,58,59,60,61,62,63]. Increasingly, deep learning methods are being used to solve scientific problems. One simulator of deep neural networks is the H2O program [64,65,66]. The H2O software can be obtained for free from the H2O.ai website and used in accordance with the license. The project itself is Open Source. The application can be used via a web browser, e.g., on a local computer where H2O simulator is running. In this study, H2O simulator and Deep Learning method were used to generate new neural networks determining the metric age of children from 4 to 15 years old. The aim of this study is to check the possibility of creating accurate (as low as possible MAE and RMSE error, high R2 coefficient) models, which would allow to quickly and effectively determine the metric age of the examined patients on the basis of the provided data.
The present work is a continuation of the work of Zaborowicz et al. In the presented research, a set of 21 original indicators was used to create deep neural network models. The aim of this study was to verify the ability to generate a more accurate deep neural network model compared to models produced previously.
Ethical Statements: The Bioethics Committee of the Medical University of Poznań considered that the research carried out does not have the characteristics of a medical experiment and therefore agreed to carry out the relevant work.
2. Materials and Methods
2.1. Research Material and Methodology
The source of the analyzed data was the database of patients (children and adolescents aged from 48 to 144 months) of the University Centre of Dentistry and Specialist Medicine in Poznań, Poland. The research material consisted of 619 digital pantomographic images (296 photos of girls and 323 photos of boys). All analyzed cases were verified, and photographs which presented abnormalities or developmental disorders were excluded. Additionally, it should be added that experiments were not performed on children. The Bioethics Committee of the Medical University of Poznań considered that the research carried out does not have the characteristics of a medical experiment and therefore agreed to carry out the relevant work.
The following research methodology was used in this study:
- Acquisition of research material-pantomographic images of children and adolescents aged 4 to 15 (from 48 to 144 months);
- Verification and exclusion of abnormal cases and preparation of a database of selected digital pantomographic images;
- Determination of patients’ age at the moment of picture taking, expressed in months;
- Determination of a set of tooth and bone parameters;
- Collection of tooth and bone parameters using ImageJ software;
- Definition of a set of indicators, i.e., values of proportions of measured tooth and bone parameters;
- Preparation of a learning set for neural modelling;
- Neural modelling in H2O.ai;
- Verification of the produced models;
- Comparison of models with models produced in STATISTICA 7.1 simulator.
2.2. Methodology for Obtaining Empirical Data—New Tooth and Bone Indicators
In the conducted research, an original and authored set of 21 indicators was used, i.e., distinctive tooth and bone parameters, which were developed in the form of mathematical proportions X01–X21 by Zaborowicz [51] (Figure 1).
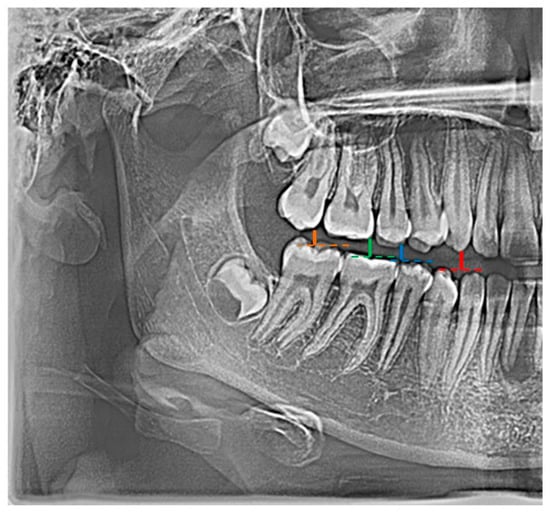
Figure 1.
Example graphical representation of indicators: X01 (color: red |C13C43|; blue |C15C45|), X02 (color: red |C13C43|; green |C16C46|), and X03 (color: red |C13C43|; orange |C17C47|).
2.3. Research Methods
The pantomographic photos used in the research were taken with the Duerr Dental-VistaPano S Ceph camera which was equipped with an X-ray head with 0.5 mm focus and a digital sensor, Cls-CMOS matrix in DICOM 3.0 format supported by DBSWIN [67]. The measurements of tooth and bone parameters were performed in Open Source software ImageJ 1.52a [68]. Additionally, MS Excel 2007 spreadsheet was used to aggregate and structure the data obtained in the process of image processing and analysis, which also enables saving the data in *.csv format [69].
The process of generating a neural model was carried out using H2O.ai. software (version 3.24.0.5) with Deep Learning methods, which allows us to create, validate, and predict artificial neural network models. In this software, it is also possible to perform a sensitivity analysis of variables of the developed models [64,65,66]. Deep learning is a class of machine learning methods for hierarchical (deep) models with nonlinear layers [70]. The idea of deep learning is to pretrain the network, and in the next step to train the network in a supervised manner—this method can combine supervised and unsupervised learning. In order to carry out the learning process properly, a large dataset is usually required; however, this is not necessary due to the deep neural network’s performance, which has the ability to redundancy. In brief, it can be said that the network “breaks” data into smaller parts and, on the basis of these smallest elements, aims to generalize the processed information.
3. Results
Three deep neural network models were generated during the study: one for the learning set of women and men, and one each for the learning set of women and the learning set of men. During the modeling process, all 21 new indicators and the gender indicator were used [51]. After each model was generated, predictions were made for each entire learning set. The learning set of women and men contained 619 samples; the learning set of women contained 296 samples; and the learning set of men contained 323 samples. A sensitivity analysis of the variables was also conducted for each of the models that were generated.
The models were characterized by the following parameters: MSE (Mean Squared Error) Equation (1); RMSE (Root Mean Squared Error) Equation (2); R2 (R Squared); MAE (Mean Absolute Error) Equation (3); MAPE (Mean Absolute Percentage Error) Equation (4); and RMSPE (Root Mean Squared Percentage Error) Equation (5).
3.1. Model to Determine Metric Age for Men and Women
The parameters representing the quality of the generated models for the learning set of male and female are presented in Table 1.

Table 1.
Parameters of the generated model—age assessment for men and women.
This means that the mean MAE prediction error was 4.61 months. Additionally, MAPE and RMSPE parameters were calculated, respectively, as 4.10% and 6.36%.
The network learning process is in Figure 2. The sensitivity analysis is shown in Table 2 and Figure 3.
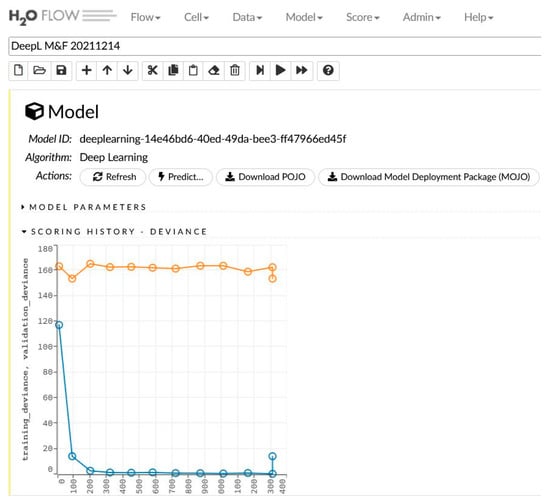
Figure 2.
The generated model for women and men and the learning process.
Table 2.
Parameters of the generated model—age assessment for men and women.
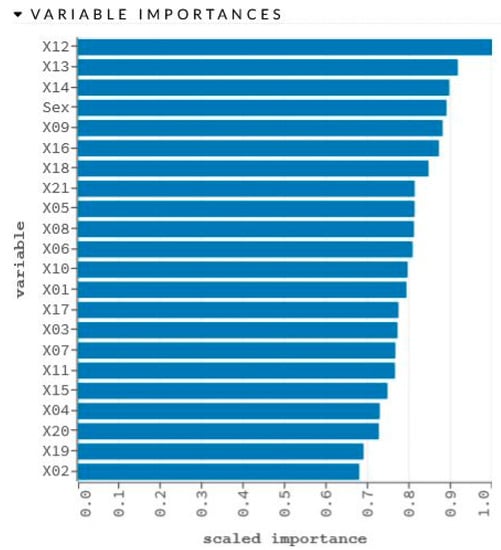
Figure 3.
Graphical representation of sensitivity analysis of variables.
3.2. Model to Determine Metric Age for Women
The parameters representing the quality of the generated models for the learning set of male and female are presented in Table 3.
Table 3.
Parameters of the generated model—age assessment for women.
This means that the mean MAE prediction error was 3.85 months. Additionally, MAPE and RMSPE parameters were calculated, were, respectively: 3.48% and 6.86%.
The network learning process is in Figure 4. The sensitivity analysis is shown in Table 4 and Figure 5.
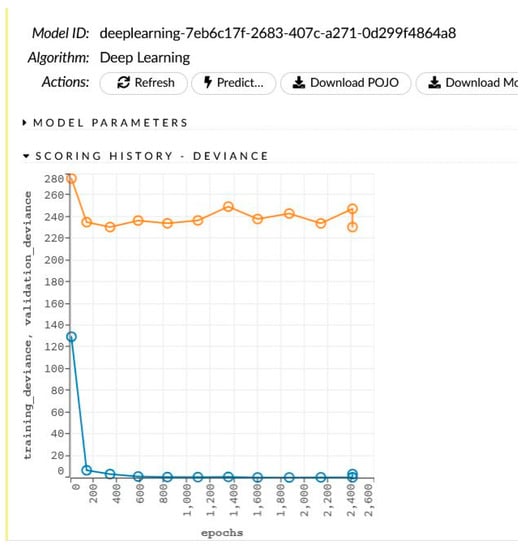
Figure 4.
The generated model for women and the learning process.
Table 4.
Parameters of the generated model—age assessment for women.
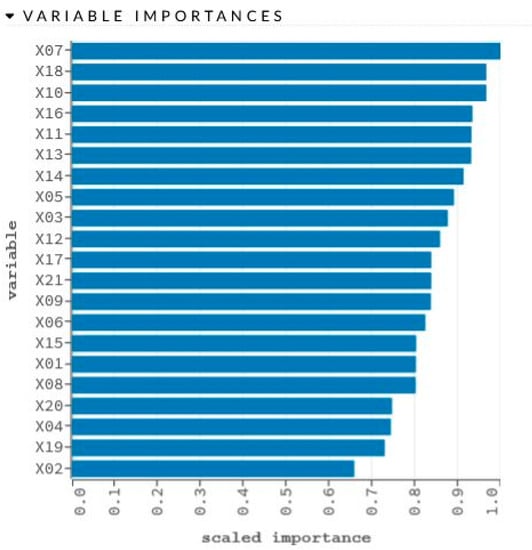
Figure 5.
Graphical representation of sensitivity analysis of variables.
3.3. Model to Determine Metric Age for Men
The parameters representing the quality of the generated models for the learning set of male and female are presented in Table 5.
Table 5.
Parameters of the generated model—age assessment for men.
This means that the mean MAE prediction error was 2.34 months. Additionally, MAPE and RMSPE parameters were calculated, were, respectively: 2.04% and 4.83%.
The network learning process is in Figure 6. The sensitivity analysis is shown in Table 6 and Figure 7.
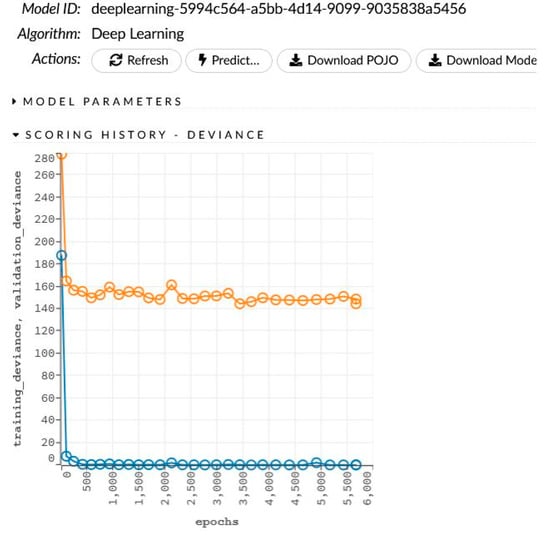
Figure 6.
The generated model for women and the learning process.
Table 6.
Parameters of the generated model—age assessment for men.
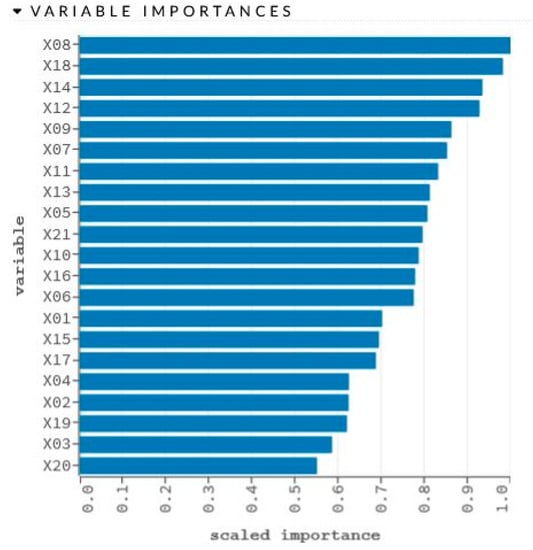
Figure 7.
Graphical representation of sensitivity analysis of variables.
4. Discussion
The results obtained with the generated deep neural network models indicate the possibility of using this type of machine learning in solving such scientific problems. The network determining the metric age of boys had the lowest prediction errors. MSE error was 31.13, RMSE 5.58, and MAE 2.34. The MAE error means that, in this case, the metric age estimate for boys has an error of 2.34 months. The network assessing boys’ age also had the highest R2 coefficient. A detailed summary of the parameters is shown in Table 7.
Table 7.
Parameters of the generated models—prediction of age assessment.
It should be noted that the first stage of the study produced RBF (Radial Basis Function) networks and did not use all of the developed indicators. Both the first study and the current analysis show that the neural model generated from the learning set determining the tooth and bone parameters of men has a higher accuracy. There is greater inaccuracy in the model determining the metric age of women (Table 8).
Table 8.
Comparison of sensitivity analysis of variables from the first phase of the study and the current study.
All prepared, original indicators were used to generate the models. None of the indicators had less than 0.5 significance. It should be noted that variable X02, X04, and X15 had a large variation compared to other indicators (Table 9). In the future, it is recommended to omit these variables from the network learning process. A summary and characterization of the indicators can be found in Table 10.
Table 9.
Parameters of the generated models—prediction of age assessment.
Table 10.
Summary of the significance of variables for each learning set and generated model.
The models presented in the study are characterized by high accuracy. Compared with the work of Kim and co-authors [46], the quality of the model determining the age of men and women was 9 percentage points higher. The R2 coefficient of the produced model was 0.93; Kim’s model had a quality level of accuracy of 0.84. On the other hand, the difference between the accuracy of the model produced by Farhadian et al. [47] is much higher. The MAE error presented in this team’s study was 4.12 years, while the RMSE error was 4.4 years. The error of the models produced in this work varies depending on the learning set within: MAE from 2.34 to 4.61 months, and RMSE error from 5.58 to 7.45 months. However, it is important to note the difference in the age range of the study subjects, which may have translated into network quality. In Farhadian’s study, the range was between 14 and 60 years of age, whereas in the research presented here, the range was between 4 and 15 years. In turn, Banjšak et al. [48] used convolutional networks to estimate the age of found skulls. This team’s model works with an accuracy of 73%. It should be noted that this team could not know the precise metrical age. Very high accuracy of the produced models was presented in their works by Milošević et al. [49] and Kahaki et al. [50]. However, despite the high values of the indicators defining the networks, the error was measured in years rather than individual months.
Compared to the work of our team [51], it can be seen that the quality of deep neural models is comparable, with an indication for deep learning methods. Table 11 shows the network quality and RMPSE error for each learning set.
Table 11.
Comparison of the quality of the models from the first phase of the study and the current ones.
The neural model developed in this study is applicable to assess the metric age of only children and adolescents in the age range of 4–15 years. Pantomographic radiographs of patients without systemic diseases and with normal development of the dental buds were used for the study. All images of persons with root canal treatment or extensive fillings in their teeth were also excluded. This is a strong advantage from the point of view of network creation and function. However, from the point of view of diagnostics, the collection should take into account a whole range of cases including anomalies. In addition, the number of teaching cases should increase. The strengths of the paper are the fairly large scope of the dataset and the well-defined cases. The plus side of the research conducted is the use of proprietary indicators that allowed for the development of a new method and the use of neuronal modeling methods. Additionally, note that the artificial neural network simulator used is publicly available under an open license. On the other hand, the disadvantage of works comparing the effect of different technologies is the divergence of quality indicators—different simulators have different measures, and special attention should be given to this.
5. Conclusions
The conducted research indicates that neural modeling methods are an appropriate tool for determining the metric age based on the developed proprietary tooth and bone indices. The indicated issue of metric age assessment belongs to the area of medical, biological, and natural sciences and is a highly nonlinear problem. The MAE error of the produced models, depending on the learning set used, is between 2.34 and 4.61 months, while the RMSE error is between 5.58 and 7.49 months. The correlation coefficient R2 ranges from 0.92 to 0.96. The produced deep neural models have higher quality already in the first iteration of learning the network using all the developed metrics. It is recommended to prepare deep neural networks based on the set of indicators used in the first stage of the research.
Author Contributions
Conceptualization, K.Z., M.Z. and B.B.; methodology, K.Z., M.Z. and T.G.; validation, K.Z., B.B., M.Z. and T.G.; formal analysis, M.Z. and T.G.; investigation, K.Z.; resources, K.Z.; data curation, M.Z.; writing—original draft preparation, M.Z. and K.Z., writing—review and editing, M.Z., K.Z. and T.G.; visualization, M.Z. and K.Z.; supervision, M.Z., B.B. and T.G.; project administration, K.Z. All authors have read and agreed to the published version of the manuscript.
Funding
This research received no external funding.
Institutional Review Board Statement
The Bioethics Committee of the Medical University of Poznań considered that the research carried out does not have the characteristics of a medical experiment and therefore agreed to carry out the relevant work.
Informed Consent Statement
Not applicable.
Data Availability Statement
The study was not publicly funded. Data are not open-ended.
Conflicts of Interest
The authors declare no conflict of interest.
Abbreviations
| A43 | apex of the root of the tooth 43 |
| A45 | apex of the root of the tooth 45 |
| A46 | apex of the distal root of the tooth 46 |
| A47 | apex of the distal root of the tooth 47 |
| C13 | top of the crown of the tooth 13 |
| C15 | top of the cheek nodule of the tooth 15 |
| C16 | top of the distal cheek nodule of the tooth 16 |
| C17 | top of the distal cheek nodule of the tooth 17 |
| C43 | top of the crown of the tooth 43 |
| C45 | top of the cheek nodule of the tooth 45 |
| C46 | top of the distal cheek nodule of the tooth 46 |
| C47 | top of the distal cheek nodule of the tooth 47 |
| CeD43 | distal cervical point of the tooth 43 |
| CeD45 | distal cervical point of the tooth 45 |
| CeD46 | distal cervical point of the tooth 46 |
| CeD47 | distal cervical point of the tooth 47 |
| CeM43 | mesial cervical point of the tooth 43 |
| CeM45 | mesial cervical point of the tooth 45 |
| CeM46 | mesial cervical point of the tooth 46 |
| CeM47 | mesial cervical point of the tooth 47 |
| CM16 | top of the mesial cheek nodule of the tooth 16 |
| CM17 | top of the mesial cheek nodule of the tooth 17 |
| CM46 | top of the mesial cheek nodule of the tooth 46 |
| CM47 | top of the mesial cheek nodule of the tooth 47 |
| M43 | a point on the lower edge of the mandible in the projection of a straight line through points C43 and A43 |
| M45 | a point on the lower edge of the mandible in the projection of a straight line through points C45 and A45 |
| M46 | point on the lower edge of the mandible in the projection of a straight line through points C46 and A46 |
| M47 | a point on the lower edge of the mandible in the projection of a straight line through points C47 and A47 |
| P43 | upper point of the pulp chamber of the tooth 43 |
| P45 | upper point of the pulp chamber of the tooth 45 |
| P46 | top of distal corner of the pulp chamber of the tooth 46 |
| P47 | top of distal corner of the pulp chamber of the tooth 47 |
| PCeD43 | distal point of the pulp chamber of the tooth 43 in the cervical area |
| PCeD45 | distal point of the pulp chamber of the tooth 45 in the cervical area |
| PCeD46 | distal point of the pulp chamber of the tooth 46 in the cervical area |
| PCeD47 | distal point of the pulp chamber of the tooth 47 in the cervical area |
| PCeM43 | mesial point of the pulp chamber of the tooth 43 in the cervical area |
| PCeM45 | mesial point of the pulp chamber of the tooth 45 in the cervical area |
| PCeM46 | mesial point of the pulp chamber of the tooth 46 in the cervical area |
| PCeM47 | mesial point of the pulp chamber of the tooth 47 in the cervical area |
| X01 | ratio between section |C13C43| and section |C15C45| |
| X02 | ratio between section |C13C43| and section |C16C46| |
| X03 | ratio between section |C13C43| and section |C17C47| |
| X04 | ratio between section |C15C45| and section |C16C46| |
| X05 | ratio between section |C15C45| and section |C17C47| |
| X06 | ratio between section |C16C46| and section |C17C47| |
| X07 | ratio between section |C43A43| and section |P43A43| |
| X08 | ratio between section |C45A45| and section |P45A45| |
| X09 | ratio between section |C46A46| and section |P46A46| |
| X10 | ratio between section |C47A47| and section |P47A47| |
| X11 | ratio between section |CeM43CeD43| and section |PCeM43PCeD43| |
| X12 | ratio between section |CeM45CeD45| and section |PCeM45PCeD45| |
| X13 | ratio between section |CeM46CeD46| and section |PCeM46PCeD46| |
| X14 | ratio between section |CeM47CeD47| and section |PCeM47PCeD47| |
| X15 | ratio between section |C43M43| and section |A43M43| |
| X16 | ratio between section |C45M45| and section |A45M45| |
| X17 | ratio between section |C46M46| and section |A46M46| |
| X18 | ratio between section |C47M47| and section |A47M47| |
| X19 | ratio between section |A43M43| and section |A45M45| |
| X20 | ratio between section |A43M43| and section |A46M46| |
| X21 | ratio between section |A45M45| and section |A46M46| |
References
- Sobieska, E.; Fester, A.; Nieborak, M.; Zadurska, M. Metody oceny wieku zębowego u pacjentów w wieku rozwojowym–przegląd piśmiennictwa. Forum Ortod. 2015, 11, 36–48. [Google Scholar]
- Kopczyńska-Sikorska, J. Atlas Radiologiczny Rozwoju Kośćca Dłoni i Nadgarstka; Państwowy Zakład Wydawnictw Lekarskich: Warszawa, Poland, 1969. [Google Scholar]
- Domańska, R.; Gatkowska, I.; Perkowski, K.; Marczyńska-Stolarek, M.; Zadurska, M. Wiek zębowy, wiek kostny, wiek chronologiczny–przegląd piśmiennictwa. Forum Ortod. 2016, 12, 15–28. [Google Scholar]
- Rasool, G.; Bashir, U.; Kundi, I.U. Comparative evaluation between cervical vertebrae and hand-wrist maturation for assessment of skeletal maturity orthodontic patients. Pak. Oral Dent. J. 2010, 30, 85–95. [Google Scholar]
- Patches, R.; Signorelli, L.; Peltomäki, T.; Schätzle, M. Is the use of the cervical vertebrae maturation method justified to determine skeletal age? A comparison of radiation dose of two strategies for skeletal age estimation. Eur. J. Orthod. 2013, 35, 604–609. [Google Scholar]
- Łysiak-Seichter, M. Ocena dojrzałości szkieletowej w ortodoncji–przegląd piśmiennictwa. Forum Ortod. 2007, 3, 6–14. [Google Scholar]
- Maber, M.; Liversidge, H.M.; Hector, M.P. Accuracy of age estimation of radiographic methods using developing teeth. Forensic Sci. Int. 2006, 159, 68–73. [Google Scholar] [CrossRef] [PubMed]
- Lamendin, H.; Baccino, E.; Humbert, J.F.; Tavernier, J.C.; Nossintchouk, R.M.; Zerilli, A. A simple technique for age estimation in adult corpses: The two criteria dental method. J. Forensic Sci. 1992, 37, 1373–1379. [Google Scholar] [CrossRef]
- Lorkiewicz-Muszyńska, D.; Przystańska, A.; Kulczyk, T.; Hyrchała, A.; Bartecki, B.; Kociemba, W.; Glapiński, M.; Łabęcka, M.; Świderski, P. Application of X-rays to dental age estimation in medico-legal practice. Arch. Forensic Med. Criminol. 2015, 65, 1–16. [Google Scholar] [CrossRef] [PubMed]
- Schmeling, A.; Reisinger, W.; Geserick, G.; Olze, A. Age estimation of unaccompanied minors. Part I. General considerations. Forensic Sci. Int. 2006, 15 (Suppl. 1), 61–64. [Google Scholar] [CrossRef]
- Ubelaker, D.H.; Parra, R.C. Application of three dental methods of adult age estimation from intact single rooted teeth to a Peruvian sample. J. Forensic Sci. 2008, 53, 608–611. [Google Scholar] [CrossRef]
- Rozylo-Kalinowska, I.; Kolasa-Raczka, A.; Kalinowski, P. Relationship between dental age according to Demirjian and cervical vertebrae maturity in Polish children. Eur. J. Orthod. 2011, 33, 75–83. [Google Scholar] [CrossRef] [PubMed]
- Moorrees, C.F.; Fanning, E.A.; Hunt, E.E., Jr. Age variation of formation stages for ten permanent teeth. J. Dent. Res. 1963, 42, 1490–1502. [Google Scholar] [CrossRef]
- Cameriere, R.; Pacifici, A.; Pacifici, L.; Polimeni, A.; Federici, F.; Cingolani, M.; Ferrante, L. Age estimation in children by measurement of open apices in teeth with Bayesian calibration approach. Forensic Sci. Int. 2016, 258, 50–54. [Google Scholar] [CrossRef] [PubMed]
- Sarajlić, N.; Topić, B.; Brkić, H.; Alajbeg, I.Z. Aging quantification on alveolar bone loss. Coll. Antropol. 2009, 33, 1165–1170. [Google Scholar] [PubMed]
- Ruquet, M.; Saliba-Serre, B.; Tardivo, D.; Foti, B. Estimation of age using alveolar bone loss: Forensic and anthropological applications. J. Forensic Sci. 2015, 60, 1305–1309. [Google Scholar] [CrossRef]
- Koh, K.K.; Tan, J.S.; Nambiar, P.; Ibrahim, N.; Mutalik, S.; Khan Asif, M. Age estimation from structural changes of teeth and buccal alveolar bone level. J. Forensic Leg. Med. 2017, 48, 15–21. [Google Scholar] [CrossRef]
- Demirjian, A. A new system of dental age assessment. Hum. Biol. 1973, 45, 211–227. [Google Scholar]
- Demirjian, A.; Goldstein, H. New systems for dental maturity based on seven and four teeth. Ann. Hum. Biol. 1976, 3, 411–421. [Google Scholar] [CrossRef]
- Mughal, A.M.; Hassan, N.; Ahmed, A. Bone age assessment methods: A critical review. Pak. J. Med. Sci. 2014, 30, 211–215. [Google Scholar] [CrossRef]
- AlQahtani, S.J.; Hector, M.P.; Liversidge, H.M. Accuracy of dental age estimation charts: Schour and Massler, Ubelaker and the London Atlas. Am. J. Phys. Anthropol. 2014, 154, 70–78. [Google Scholar] [CrossRef]
- Panchbhai, A.S. Dental radiographic indicators, a key to age estimation. Dentomaxillofac Radiol. 2010, 40, 199–212. [Google Scholar] [CrossRef] [PubMed]
- Traczyk, W.Z. Fizjologia Człowieka w Zarysie; Państwowy Zakład Wydawnictw Lekarskich: Warszawa, Poland, 2016. [Google Scholar]
- Hagg, U.; Matsson, L. Dental maturity as an indicator of chronological age. The accuracy and precision of three methods. Eur. J. Orthod. 1985, 7, 25–34. [Google Scholar] [CrossRef]
- Bagherian, A.; Sadeghi, M. Assessment of dental maturity of children aged 3.5 to 13.5 years using the Demirjian method in an Iranian population. Int. J. Oral Sci. 2011, 53, 37–42. [Google Scholar] [CrossRef] [PubMed]
- Lewis, A.B. Comparison between dental and skeletal ages. Angle Orthod. 1990, 61, 87–92. [Google Scholar]
- Górny, A.; Tkacz, M. Komputerowe wspomaganie badań medycznych. Balneol. Pol. 2005, 1–2, 65–67. [Google Scholar]
- Amato, F.; López, A.; Peña-Méndez, E.M.; Vaňhara, P.; Hampl, A.; Havel, J. Artificial neural networks in medical diagnosis. J. Appl. Biomed. 2013, 11, 47–58. [Google Scholar] [CrossRef]
- Hamet, P.; Tremblay, J. Artificial Intelligence in Medicine. Metabolism 2017, 69, 36–40. [Google Scholar] [CrossRef]
- Baxt, W.G. Application of artificial neural networks to clinical medicine. Lancet 1995, 346, 1135–1138. [Google Scholar] [CrossRef]
- Litwińska, M. Zastosowanie sztucznych sieci neuronowych w analizie sygnałów elektrokardiograficznych. Acta Bio-Optica et Informatica Medica. Inżynieria Biomed. 2014, 20, 80–94. [Google Scholar]
- Smyczyńska, U.; Smyczyńska, J.; Lewiński, A.; Tadeusiewicz, R. Możliwości wykorzystania sztucznych sieci neuronowych w modelowaniu zaburzeń endokrynologicznych i procesów wzrostowych. Endokrynol. Ped. 2015, 14, 55–66. [Google Scholar]
- Ozkan, I.A.; Koklu, M.; Sert, I.U. Diagnosis of urinary tract infection based on artificial intelligence methods. Comput. Methods Programs Biomed. 2018, 166, 51–59. [Google Scholar] [CrossRef] [PubMed]
- Romanowski, J. Zaczyna się od krawędziowania. O technologii rozpoznawania obrazu. Justgeek. It 2018. Available online: https://geek.justjoin.it/zaczyna-sie-krawedziowania-o-technologii-rozpoznawania-obrazu (accessed on 5 September 2021).
- Bottaci, L.; Drew, P.J.; Hartley, J.E.; Hadfield, M.B.; Farouk, R.; Lee, P.W.; Macintyre, I.M.; Duthie, G.S.; Monson, J.R. Artificial neural networks applied to outcome prediction for colorectal cancer patients in separate institutions. Lancet 1997, 350, 469–472. [Google Scholar] [CrossRef]
- Ahmed, F.E. Artificial neural networks for diagnosis and survival prediction in colon cancer. Mol. Cancer 2005, 4, 1–12. [Google Scholar] [CrossRef]
- Bartosch-Härlid, A.; Andersson, B.; Aho, U.; Nilsson, J.; Andersson, R. Artificial neural networks in pancreatic disease. Br. J. Surg. 2008, 95, 817–826. [Google Scholar] [CrossRef] [PubMed]
- Barwad, A.; Dey, P.; Susheilia, S. Artificial Neural Network in Diagnosis of Metastatic Carcinoma in Effusion Cytology. Cytom. B Clin. Cytom. 2012, 82B, 107–111. [Google Scholar] [CrossRef]
- Astion, M.L.; Wilding, P. Application of neural networks to the interpretation of laboratory data in cancer diagnosis. Clin. Chem. 1992, 38, 34–38. [Google Scholar] [CrossRef]
- Papiór, P.; Łysiak-Drwal, K.; Dominiak, M. Zastosowanie sieci neuronowych w stomatologii. Mag. Stomatol. 2012, 5, 36–41. [Google Scholar]
- Seok-Ki, J.; Tae-Woo, K. New approach for the diagnosis of extractions with neural network machine learning. Am. J. Orthod. Dentofac. Orthop. 2016, 149, 127–133. [Google Scholar]
- Raith, S.; Vogel, E.P.; Anees, N.; Keul, C.; Güth, J.F.; Edelhoff, D.; Fischer, H. Artificial Neural Networks as a powerful numerical tool to classify specific features of a tooth based on 3D scan data. Comput. Biol. Med. 2017, 80, 65–76. [Google Scholar] [CrossRef]
- Niño-Sandoval, T.C.; Guevara Pérez, S.V.; González, F.A.; Jaque, R.A.; Infante-Contreras, C. Use of automated learning techniques for predicting mandibular morphology in skeletal class I, II and III. Forensic Sci. Int. 2017, 281, 187.e1–187.e7. [Google Scholar] [CrossRef] [PubMed]
- Lee, J.H.; Kim, D.H.; Jeong, S.N.; Choi, S.H. Detection and diagnosis of dental caries using a deep learning-based convolutional neural network algorithm. J. Dent. 2018, 77, 106–111. [Google Scholar] [CrossRef] [PubMed]
- Bunyarita, S.S.; Jayaramanc, J.; Naidud, M.K.; Ying, R.P.Y.; Danaee, M.; Nambiar, P. Modified method of dental age estimation of Malay juveniles. Leg. Med. 2017, 28, 45–53. [Google Scholar] [CrossRef]
- Kim, S.; Lee, Y.H.; Noh, Y.K.; Park, F.C.; Auh, Q.S. Age-group determination of living individuals using first molar images based on artificial intelligence. Sci Rep. 2021, 11, 1073. [Google Scholar] [CrossRef]
- Farhadian, M.; Salemi, F.; Saati, S.; Nafisi, N. Dental age estimation using the pulp-to-tooth ratio in canines by neural networks. Imaging Sci. Dent. 2019, 49, 19–26. [Google Scholar] [CrossRef]
- Banjšak, L.; Milošević, D.; Subašić, M. Implementation of artificial intelligence in chronological age estimation from orthopantomographic X-ray images of archaeological skull remains. Bull. Int. Assoc. Paleodont. 2021, 14, 2. [Google Scholar]
- Milošević, D.; Vodanović, M.; Galić, I.; Subašić, M. Automated estimation of chronological age from panoramic dental X-ray images using deep learning. Expert Syst. Appl. 2022, 189, 116038. [Google Scholar] [CrossRef]
- Kahaki, S.M.M.; Nordin, M.J.; Ahmad, N.S.; Arzoky, M.; Waidah, I. Deep convolutional neural network designed for age assessment based on orthopantomography data. Neural Comput. Appl. 2020, 32, 9357–9368. [Google Scholar] [CrossRef]
- Zaborowicz, K.; Biedziak, B.; Olszewska, A.; Zaborowicz, M. Tooth and Bone Parameters in the Assessment of the Chronological Age of Children and Adolescents Using Neural Modelling Methods. Sensors 2021, 21, 6008. [Google Scholar] [CrossRef] [PubMed]
- Wang, S.; Summers, R.M. Machine learning and radiology. Med. Image Anal. 2012, 16, 933–951. [Google Scholar] [CrossRef]
- Keserci, B.; Yoshida, H. Computerized detection of pulmonary nodules in chest radiographs based on morphological features and wavelet snake model. Med. Image Anal. 2002, 6, 431–447. [Google Scholar] [CrossRef]
- Dennis, B.; Muthukrishnan, S. AGFS: Adaptive Genetic Fuzzy System for medical data classification. Appl. Soft Comput. 2014, 25, 242–252. [Google Scholar] [CrossRef]
- Manescu, P.; Lee, Y.J.; Camp, C.; Cicerone, M.; Brady, M.; Bajcsy, P. Accurate and interpretable classification of microspectroscopy pixels using artificial neural networks. Med. Image Anal. 2017, 37, 37–45. [Google Scholar] [CrossRef][Green Version]
- Avuçlu, E.; Başçiftçi, F. New approaches to determine age and gender in image processing techniques using multilayer perceptron neural network. Appl. Soft Comput. 2018, 70, 157–168. [Google Scholar] [CrossRef]
- Owais, M.; Arsalan, M.; Choi, J.; Mahmood, T.; Park, K.R. Artificial Intelligence-Based Classification of Multiple Gastrointestinal Diseases Using Endoscopy Videos for Clinical Diagnosis. J. Clin. Med. 2019, 8, 986. [Google Scholar] [CrossRef]
- Gonciarz, W.; Lechowicz, Ł.; Urbaniak, M.; Kaca, W.; Chmiela, M. Attenuated Total Reflectance Fourier Transform Infrared Spectroscopy (FTIR) and Artificial Neural Networks Applied to Investigate Quantitative Changes of Selected Soluble Biomarkers, Correlated with H. pylori Infection in Children and Presumable Consequent Delayed Growth. J. Clin. Med. 2020, 9, 3852. [Google Scholar]
- Zhou, X.; Li, X.; Hu, K.; Zhang, Y.; Chen, Z.; Gao, X. ERV-Net: An efficient 3D residual neural network for brain tumor segmentation. Expert Syst. Appl. 2021, 170, 114566. [Google Scholar] [CrossRef]
- Naz, M.; Shah, J.H.; Khan, M.A.; Sharif, M.; Raza, M.; Damaševičius, R. From ECG signals to images: A transformation based approach for deep learning. PeerJ Comput. Sci. 2021, 7, e386. [Google Scholar] [CrossRef]
- Lu, D.; Popuri, K.; Ding, G.W.; Balachandar, R.; Beg, M.F. Multiscale deep neural network based analysis of FDG-PET images for the early diagnosis of Alzheimer’s disease. Med. Image Anal. 2018, 46, 26–34. [Google Scholar] [CrossRef] [PubMed]
- Odusami, M.; Maskeliūnas, R.; Damaševičius, R.; Krilavičius, T. Analysis of Features of Alzheimer’s Disease: Detection of Early Stage from Functional Brain Changes in Magnetic Resonance Images Using a Finetuned ResNet18 Network. Diagnostics 2021, 11, 1071. [Google Scholar] [CrossRef]
- Priya, S.J.; Rani, A.J.; Subathra, M.S.P.; Mohammed, M.A.; Damaševičius, R.; Ubendran, N. Local Pattern Transformation Based Feature Extraction for Recognition of Parkinson’s Disease Based on Gait Signals. Diagnostics 2021, 11, 1395. [Google Scholar] [CrossRef] [PubMed]
- Python Interface for H2O, Python module version 3.10.0.8; H2O.ai: Mountain View, CA, USA, 2016; Available online: https://github.com/h2oai/h2o-3 (accessed on 5 September 2021).
- R Interface for H2O, R package version 3.10.0.8; H2O.ai: Mountain View, CA, USA, 2016; Available online: https://github.com/h2oai/h2o-3 (accessed on 5 September 2021).
- Arora, A.; Candel, A.; Lanford, J.; LeDell, E.; Parmar, V. H2O, H2O Version 3.10.0.8; Deep Learning with H2O; H2O.ai: Mountain View, CA, USA, 2016; Available online: http://docs.h2o.ai/h2o/latest-stable/h2o-docs/booklets/DeepLearningBooklet.pdf (accessed on 5 September 2021).
- Dürr Dental. Available online: www.duerrdental.com (accessed on 5 September 2021).
- ImageJ. Available online: www.imagej.nih.gov (accessed on 5 September 2021).
- Microsoft. Available online: www.microsoft.com (accessed on 5 September 2021).
- Hinton, G.E.; Osindero, S.; Teh, Y.W. A fast learning algorithm for deep belief nets. Neural Comput. 2006, 18, 1527–1554. [Google Scholar] [CrossRef] [PubMed]
Publisher’s Note: MDPI stays neutral with regard to jurisdictional claims in published maps and institutional affiliations. |
© 2022 by the authors. Licensee MDPI, Basel, Switzerland. This article is an open access article distributed under the terms and conditions of the Creative Commons Attribution (CC BY) license (https://creativecommons.org/licenses/by/4.0/).