A Smart Colorimetric Platform for Detection of Methanol, Ethanol and Formic Acid

 ,
, 


Abstract
:1. Introduction
2. Experiments and Methods
2.1. Materials and Instruments
2.2. Methods
2.2.1. Dye Preparation and Analysis
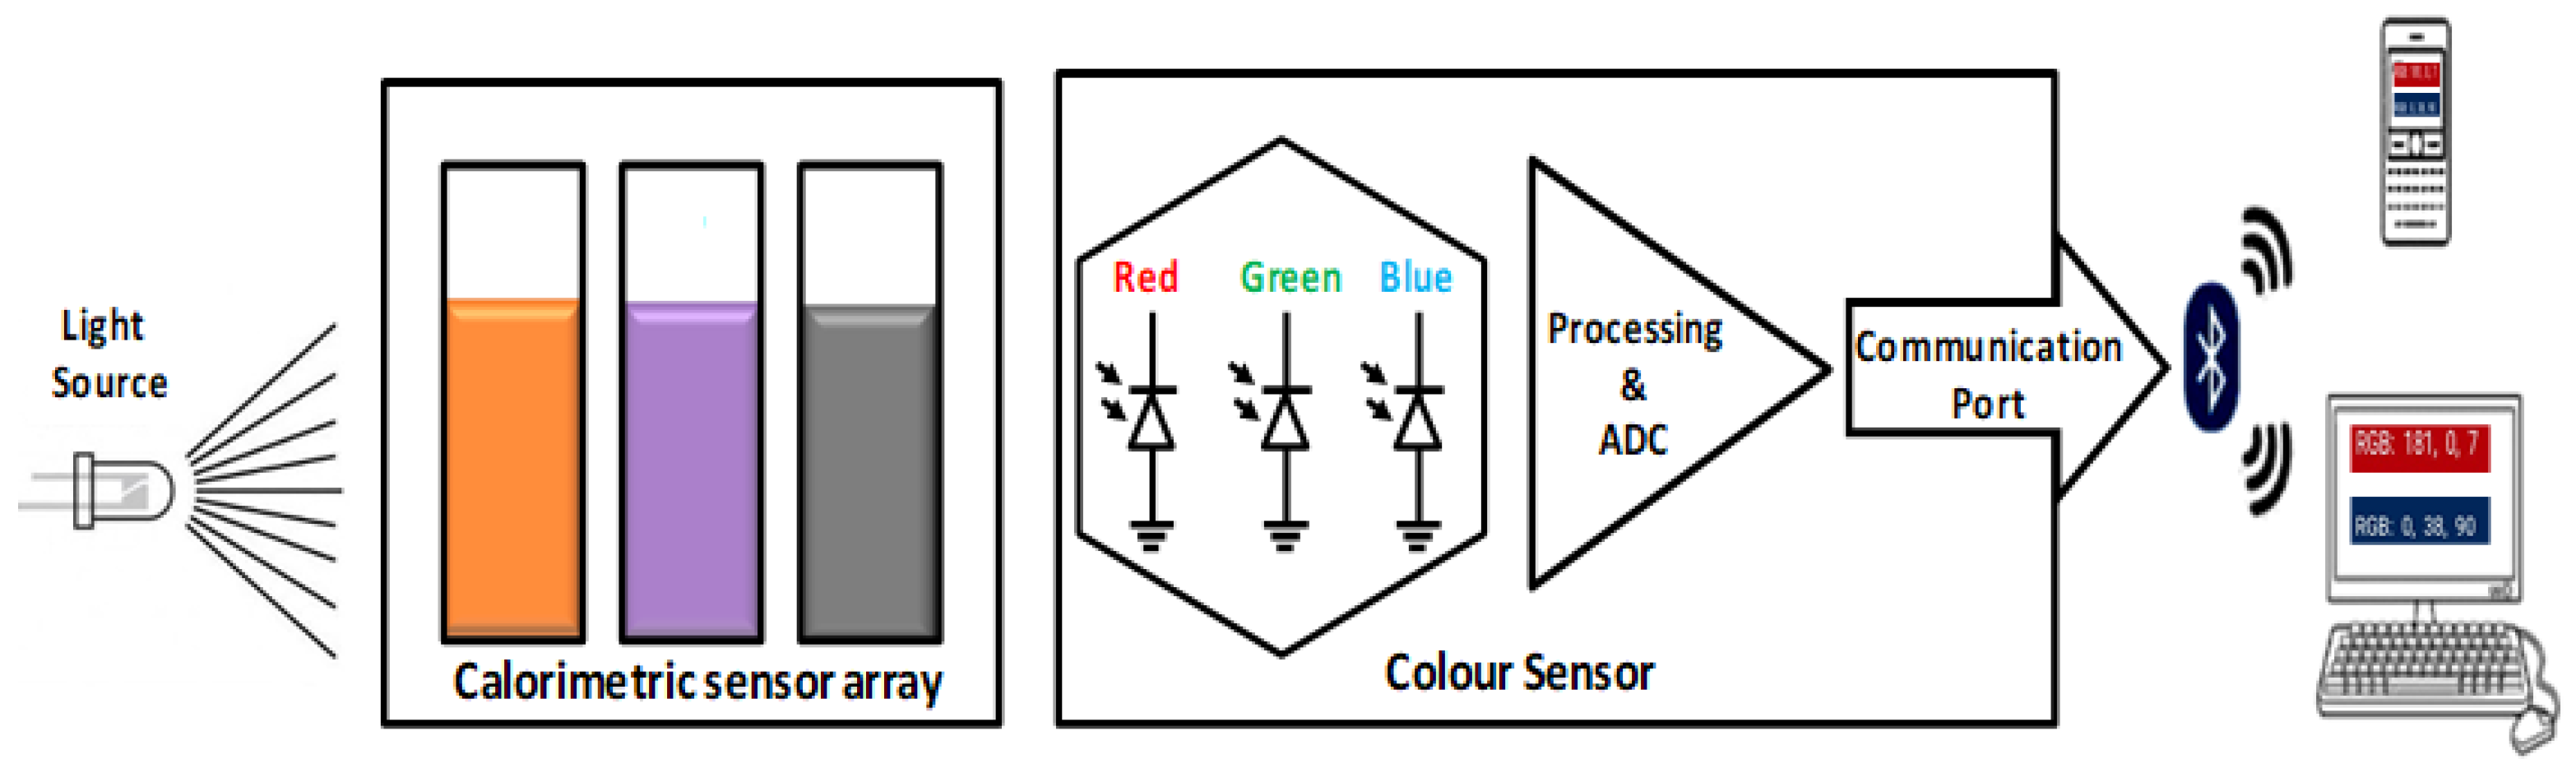
2.2.2. Fabrication of Sensor Prototype
2.2.3. Characterization, Electrochemical Analysis, and Quantification
3. Results and Discussion
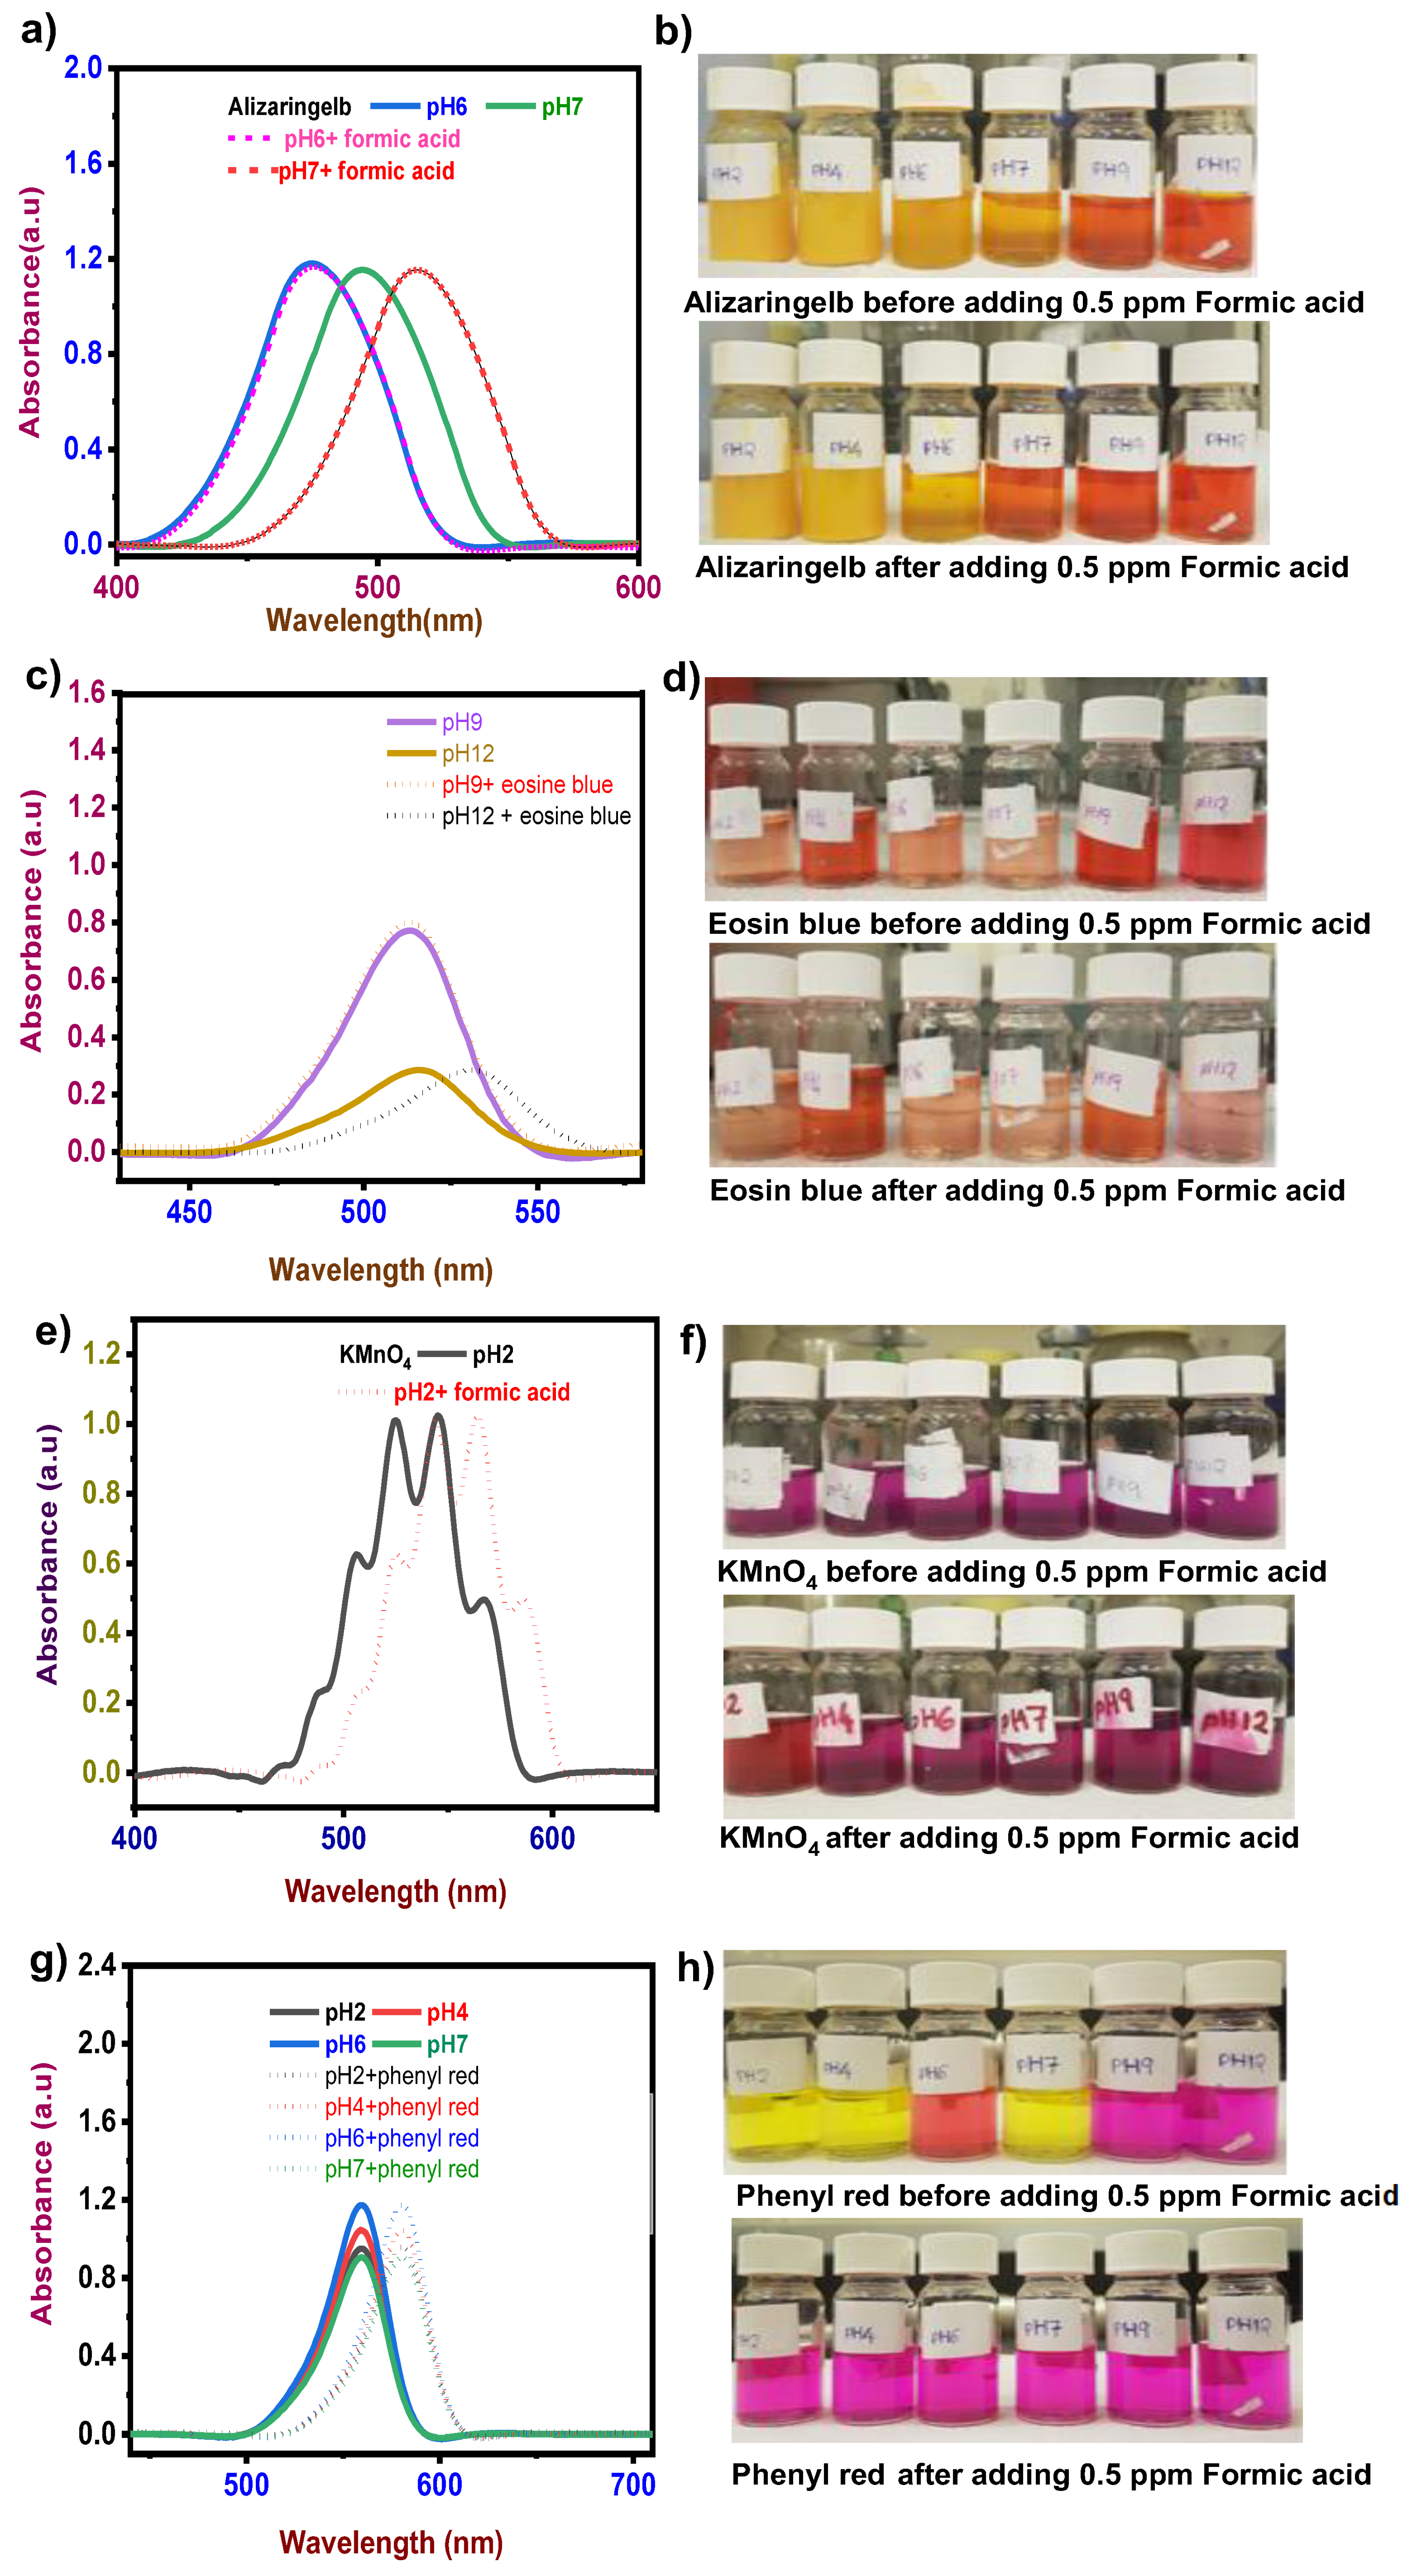
3.1. Detection of Formic Acid
3.1.1. Response Time and pH Effect
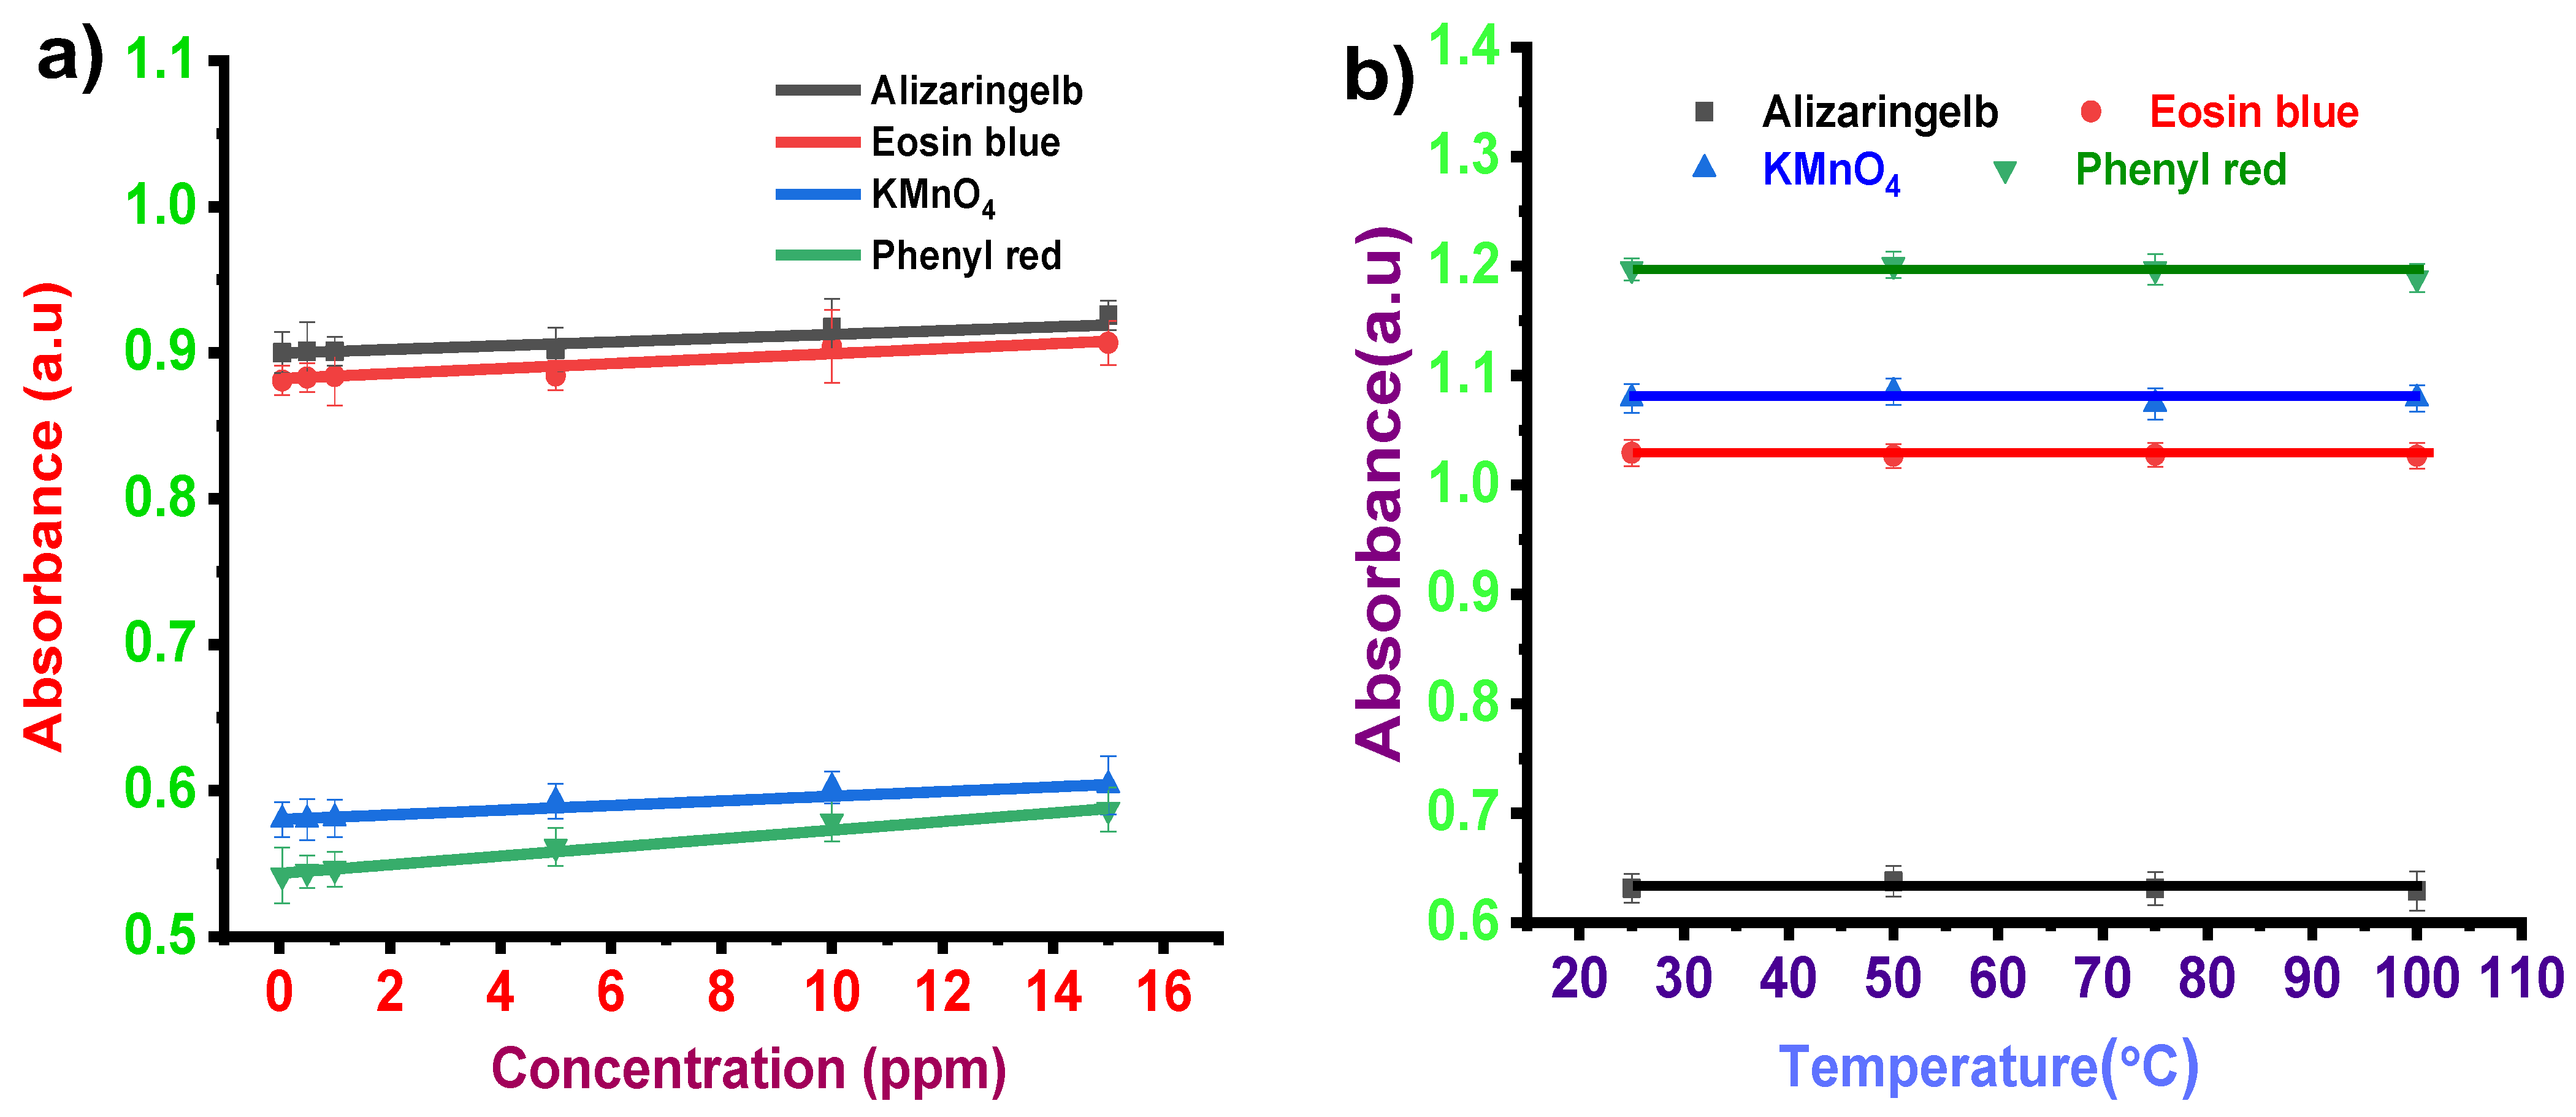
3.1.2. Concentration Effect
3.1.3. Temperature Effect
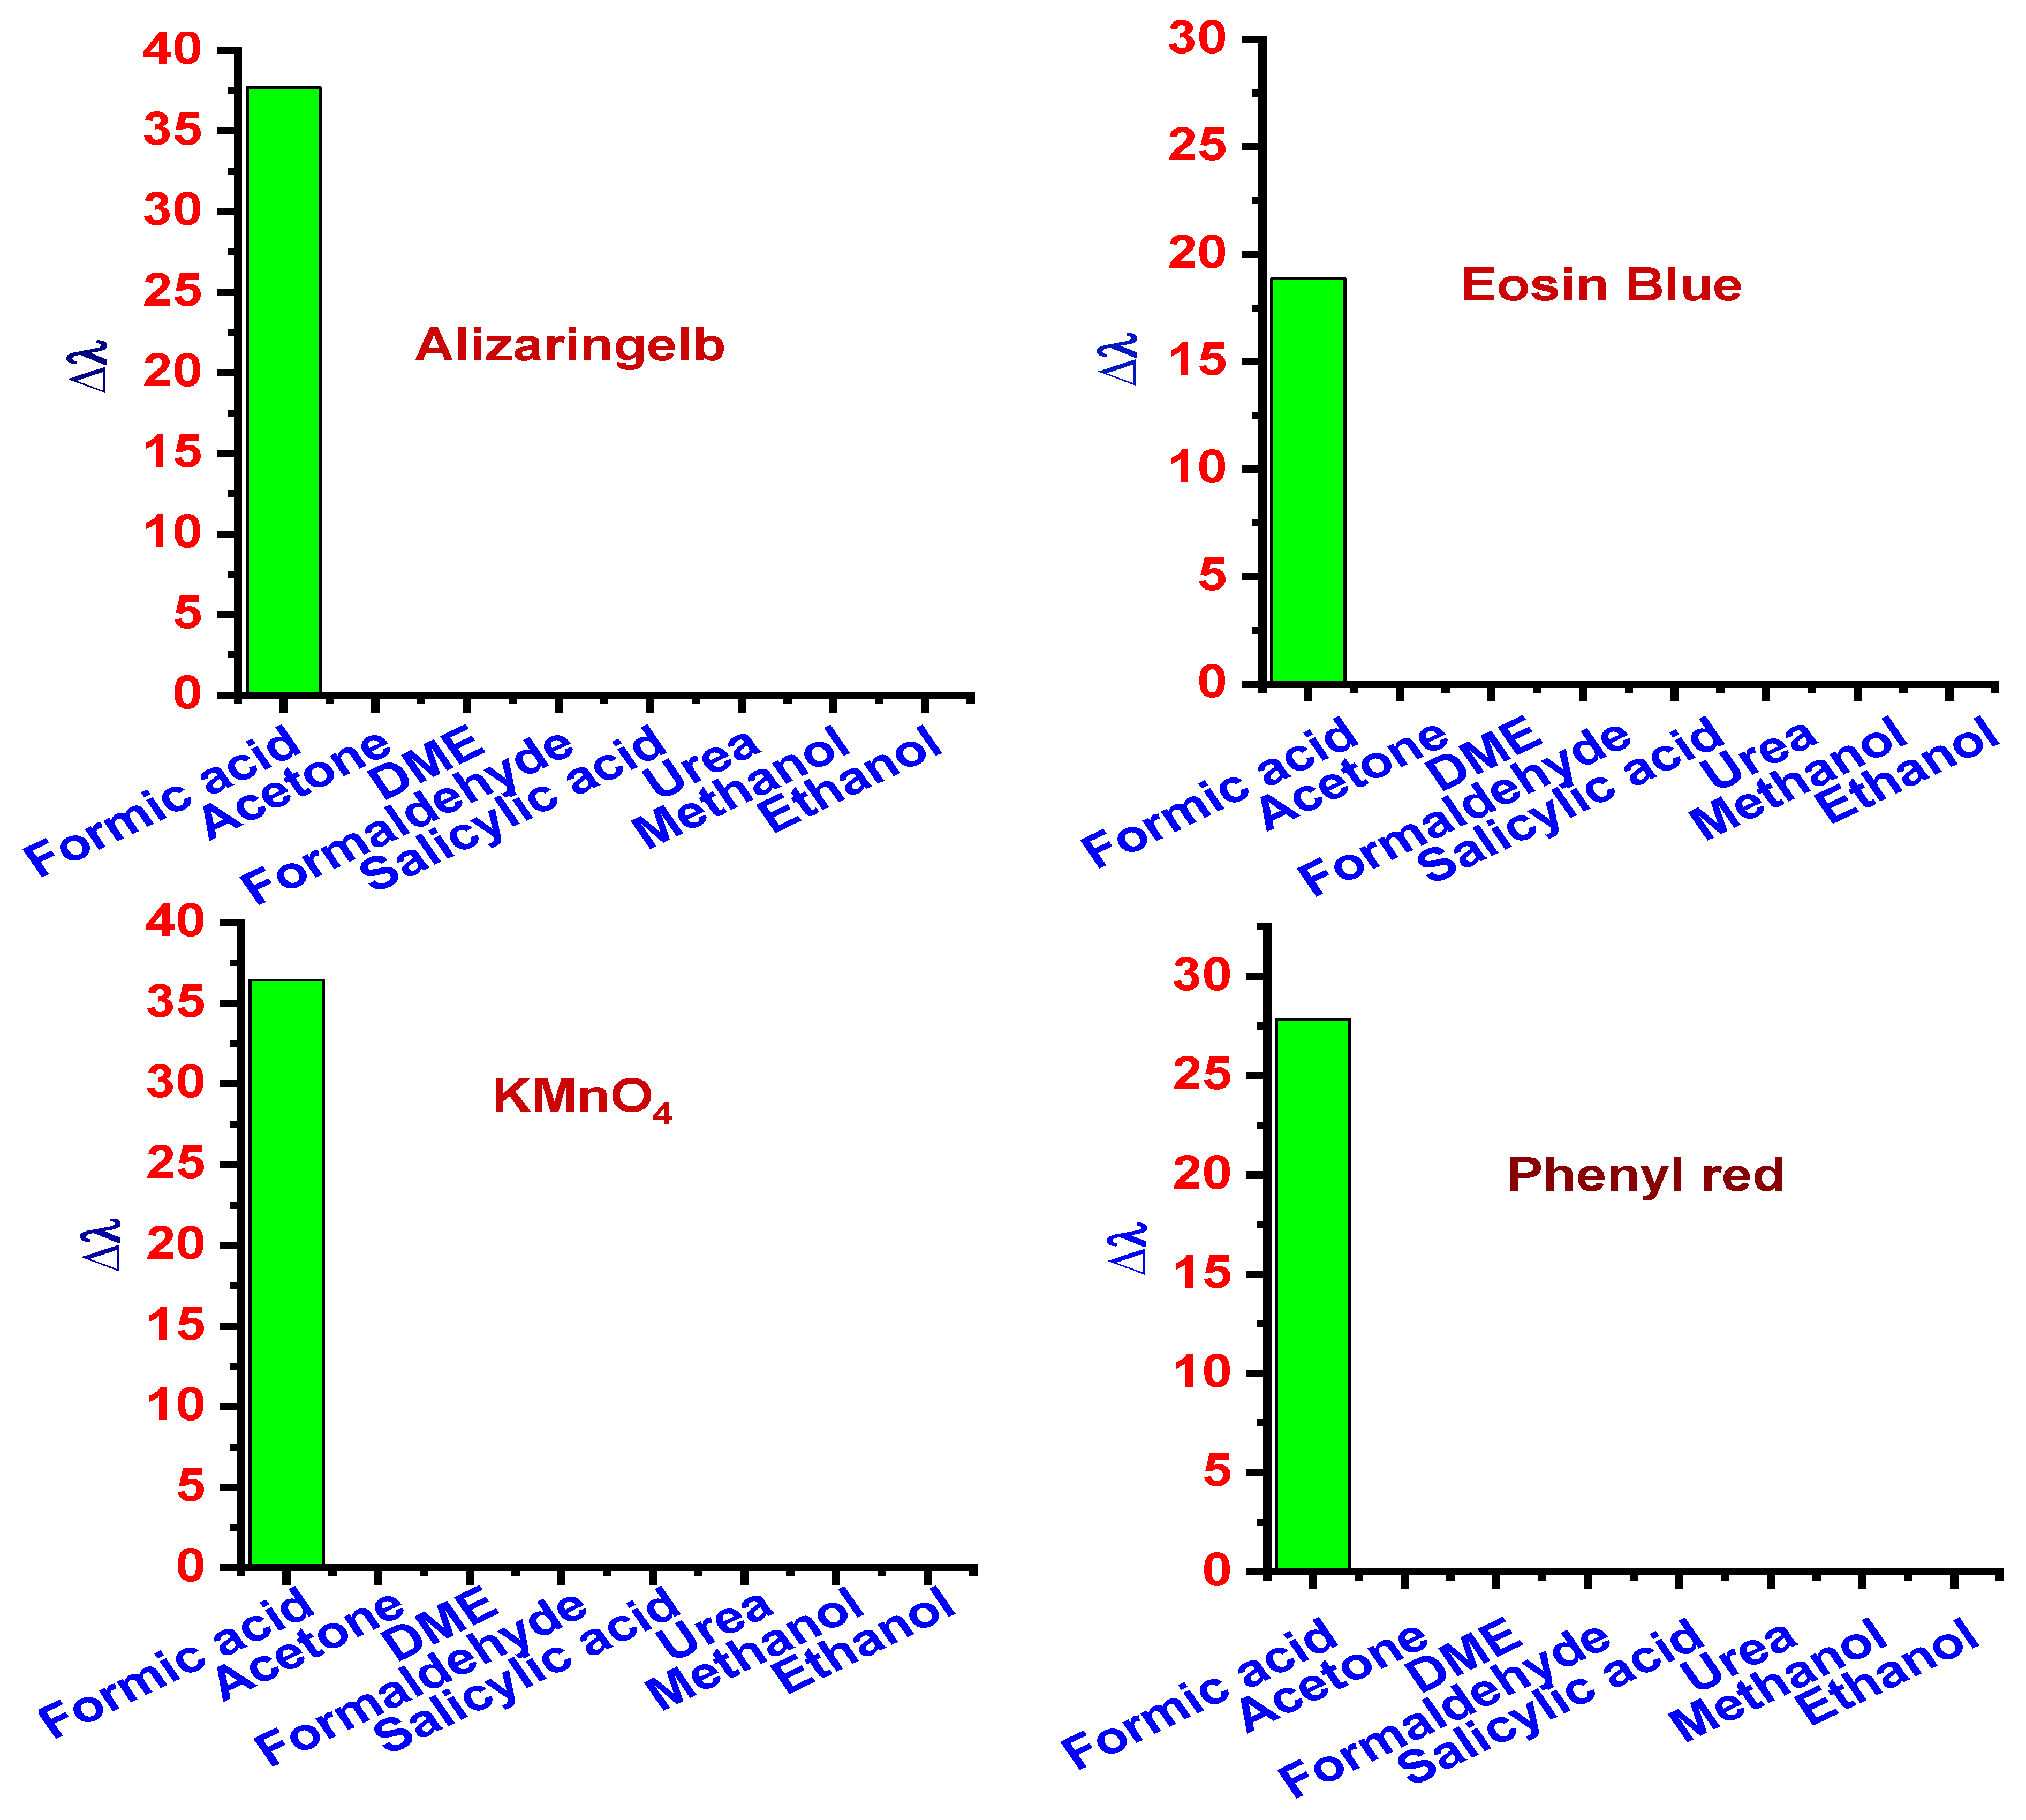
3.1.4. Selectivity
3.2. Detection of Methanol
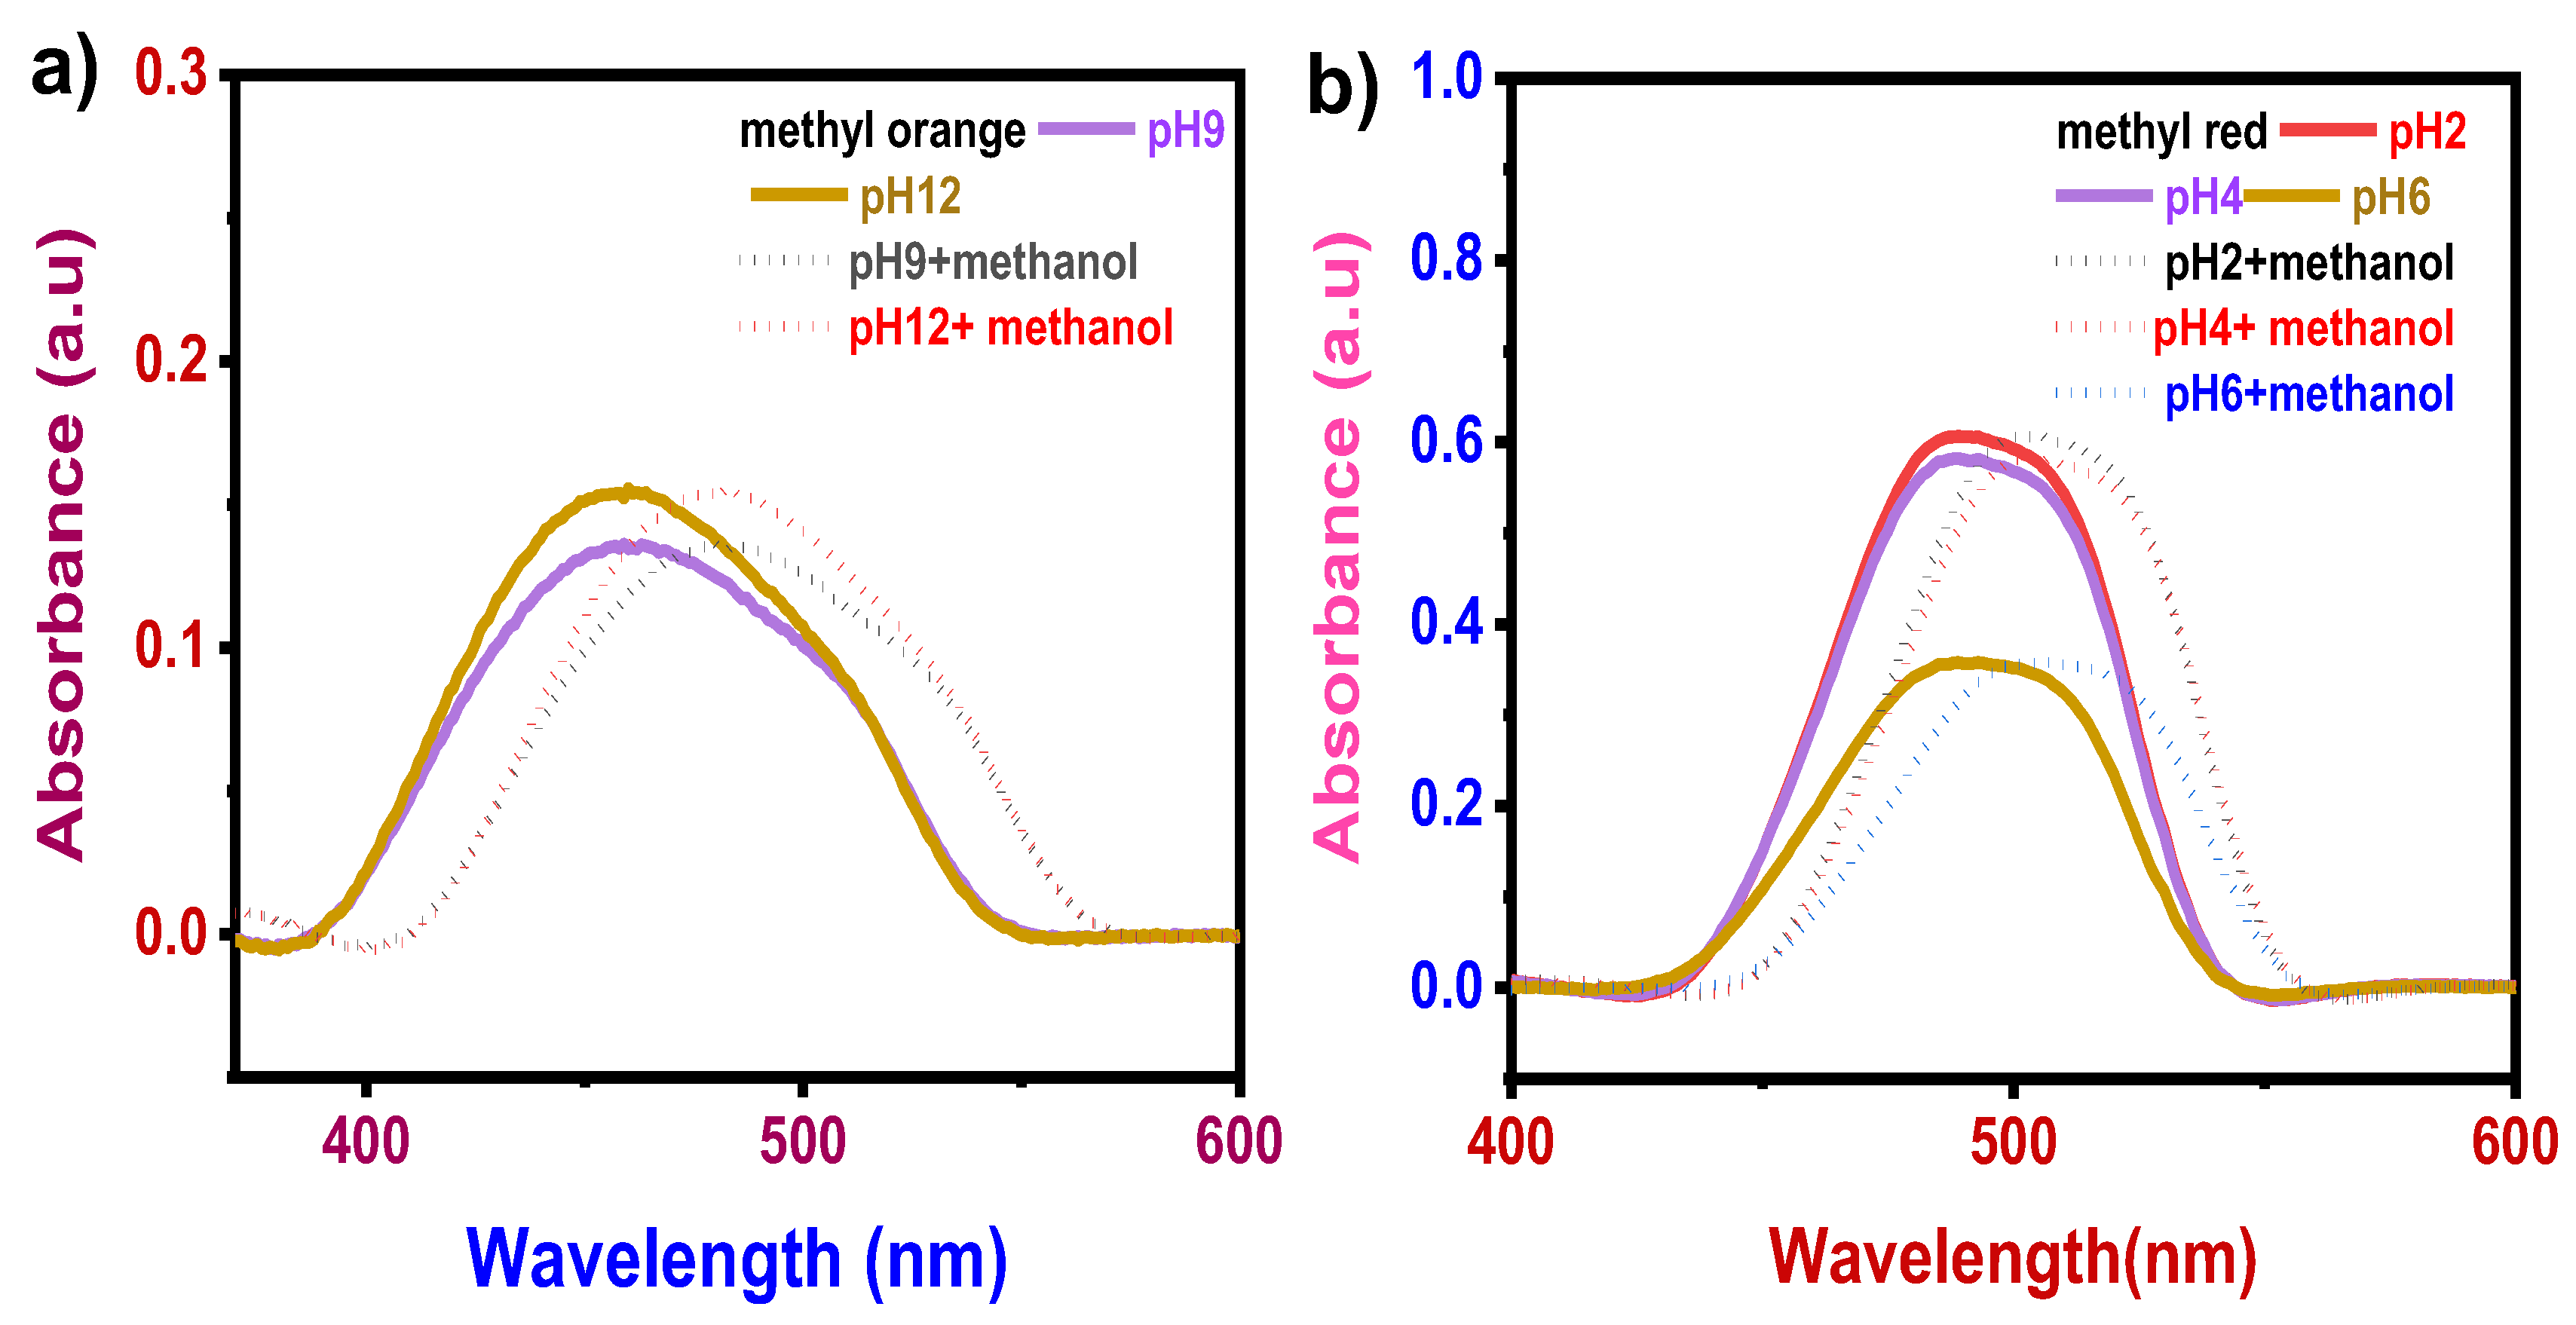
3.2.1. pH Effect
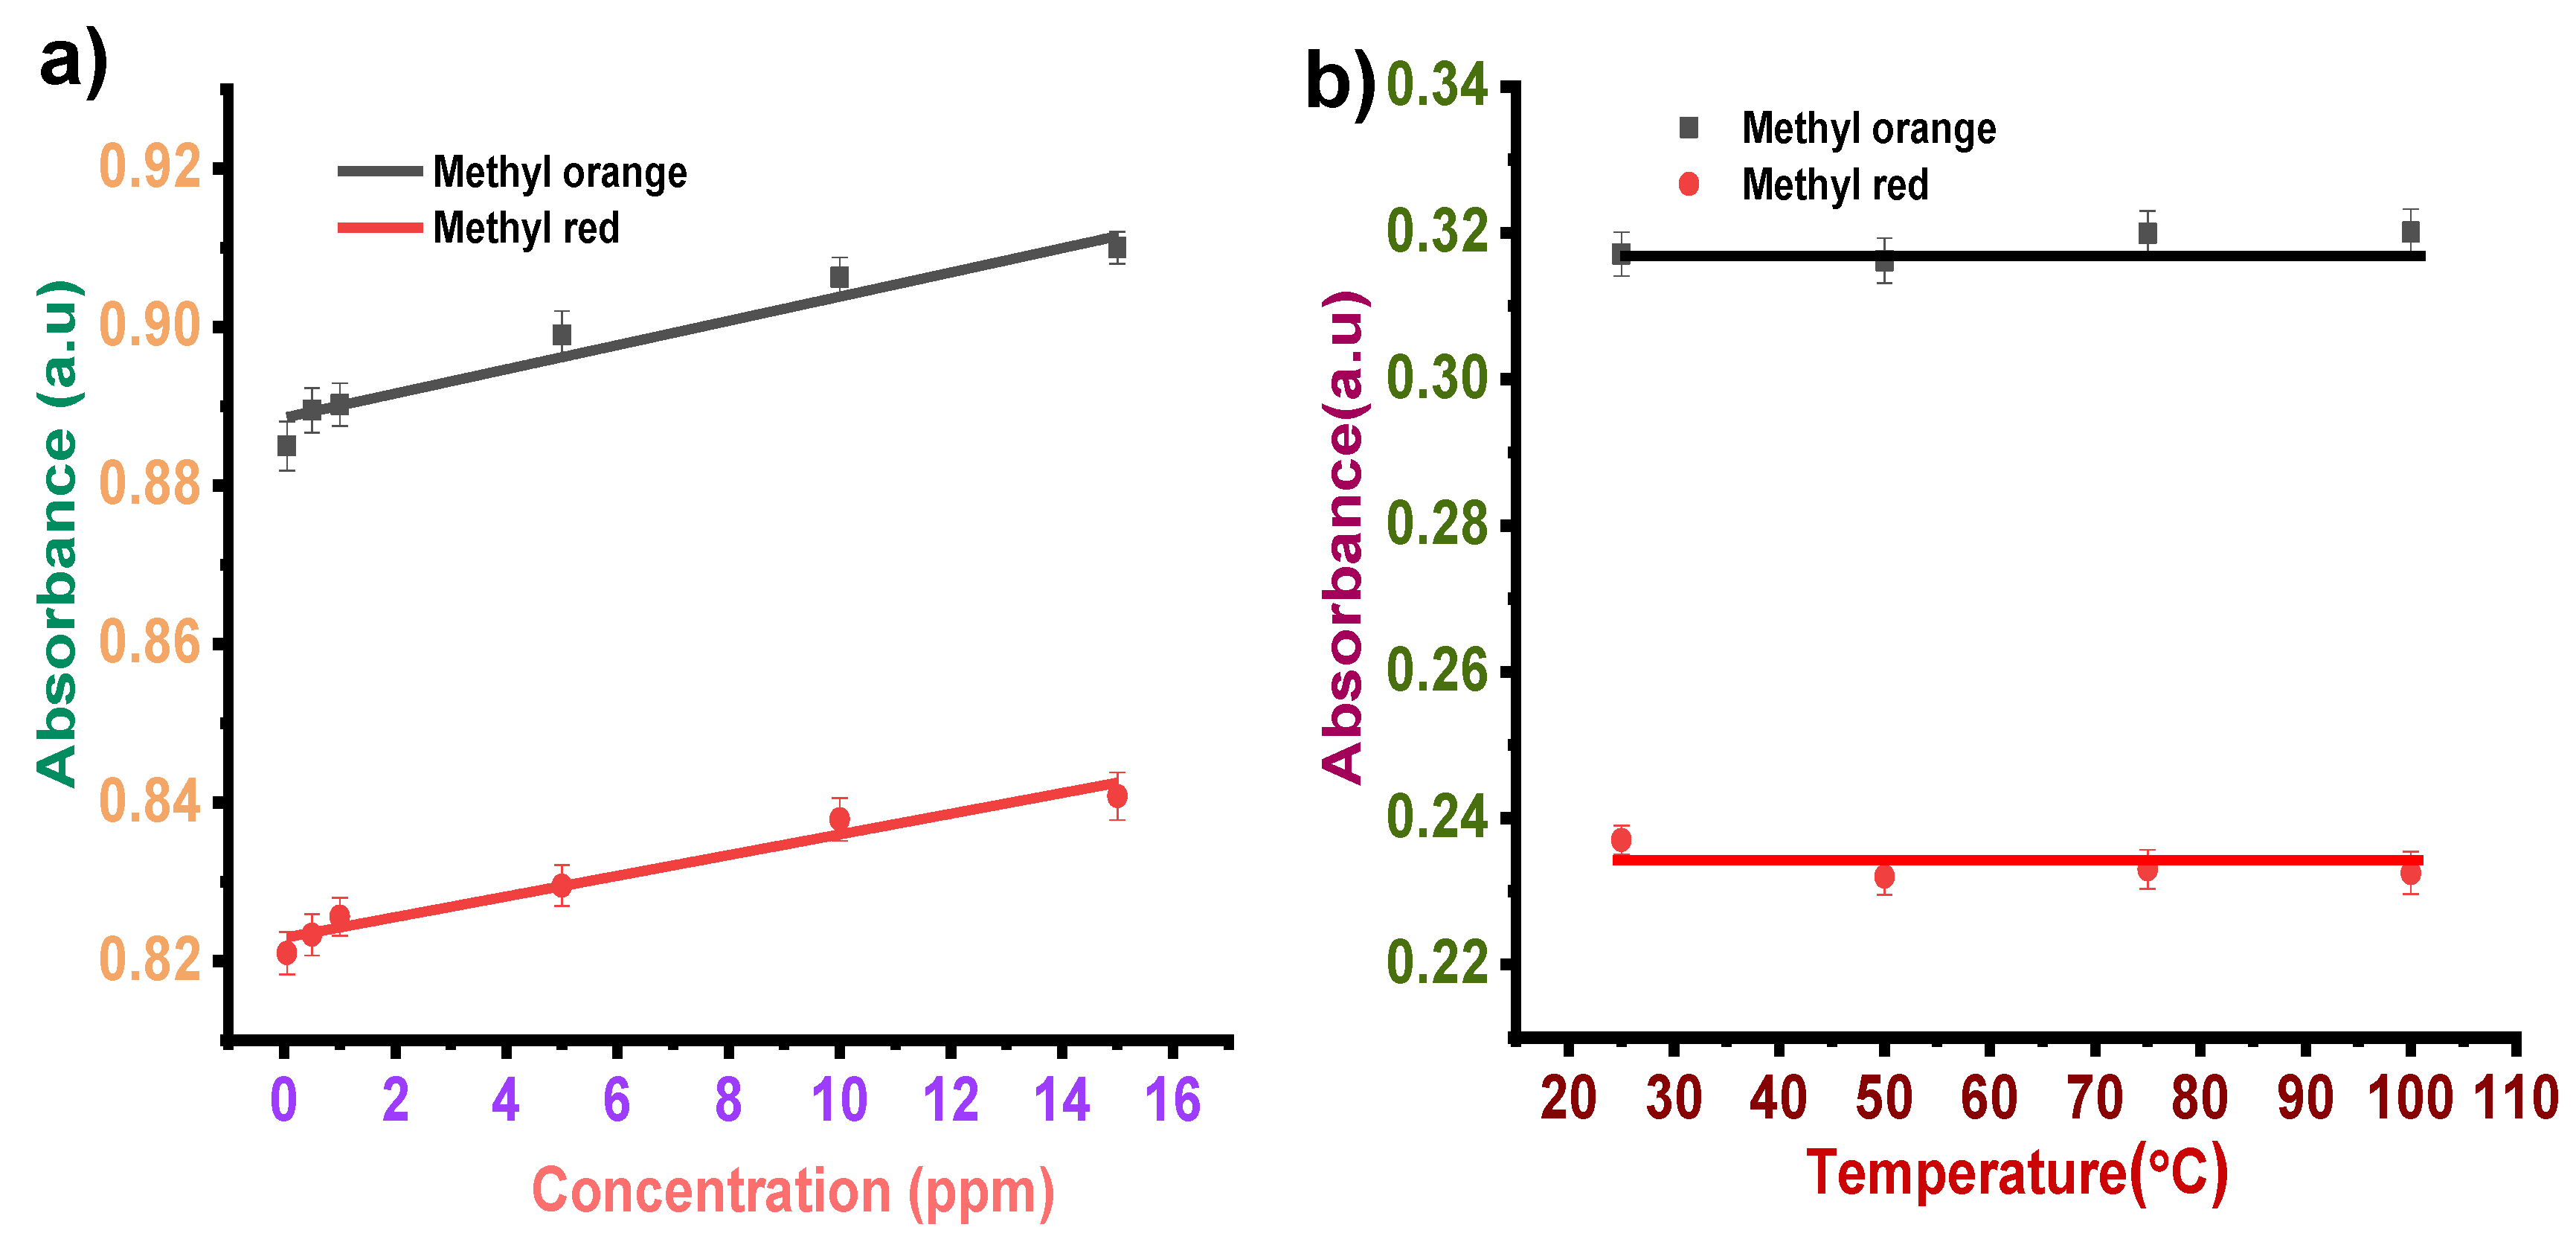
3.2.2. Concentration Effect
3.2.3. Temperature Effect
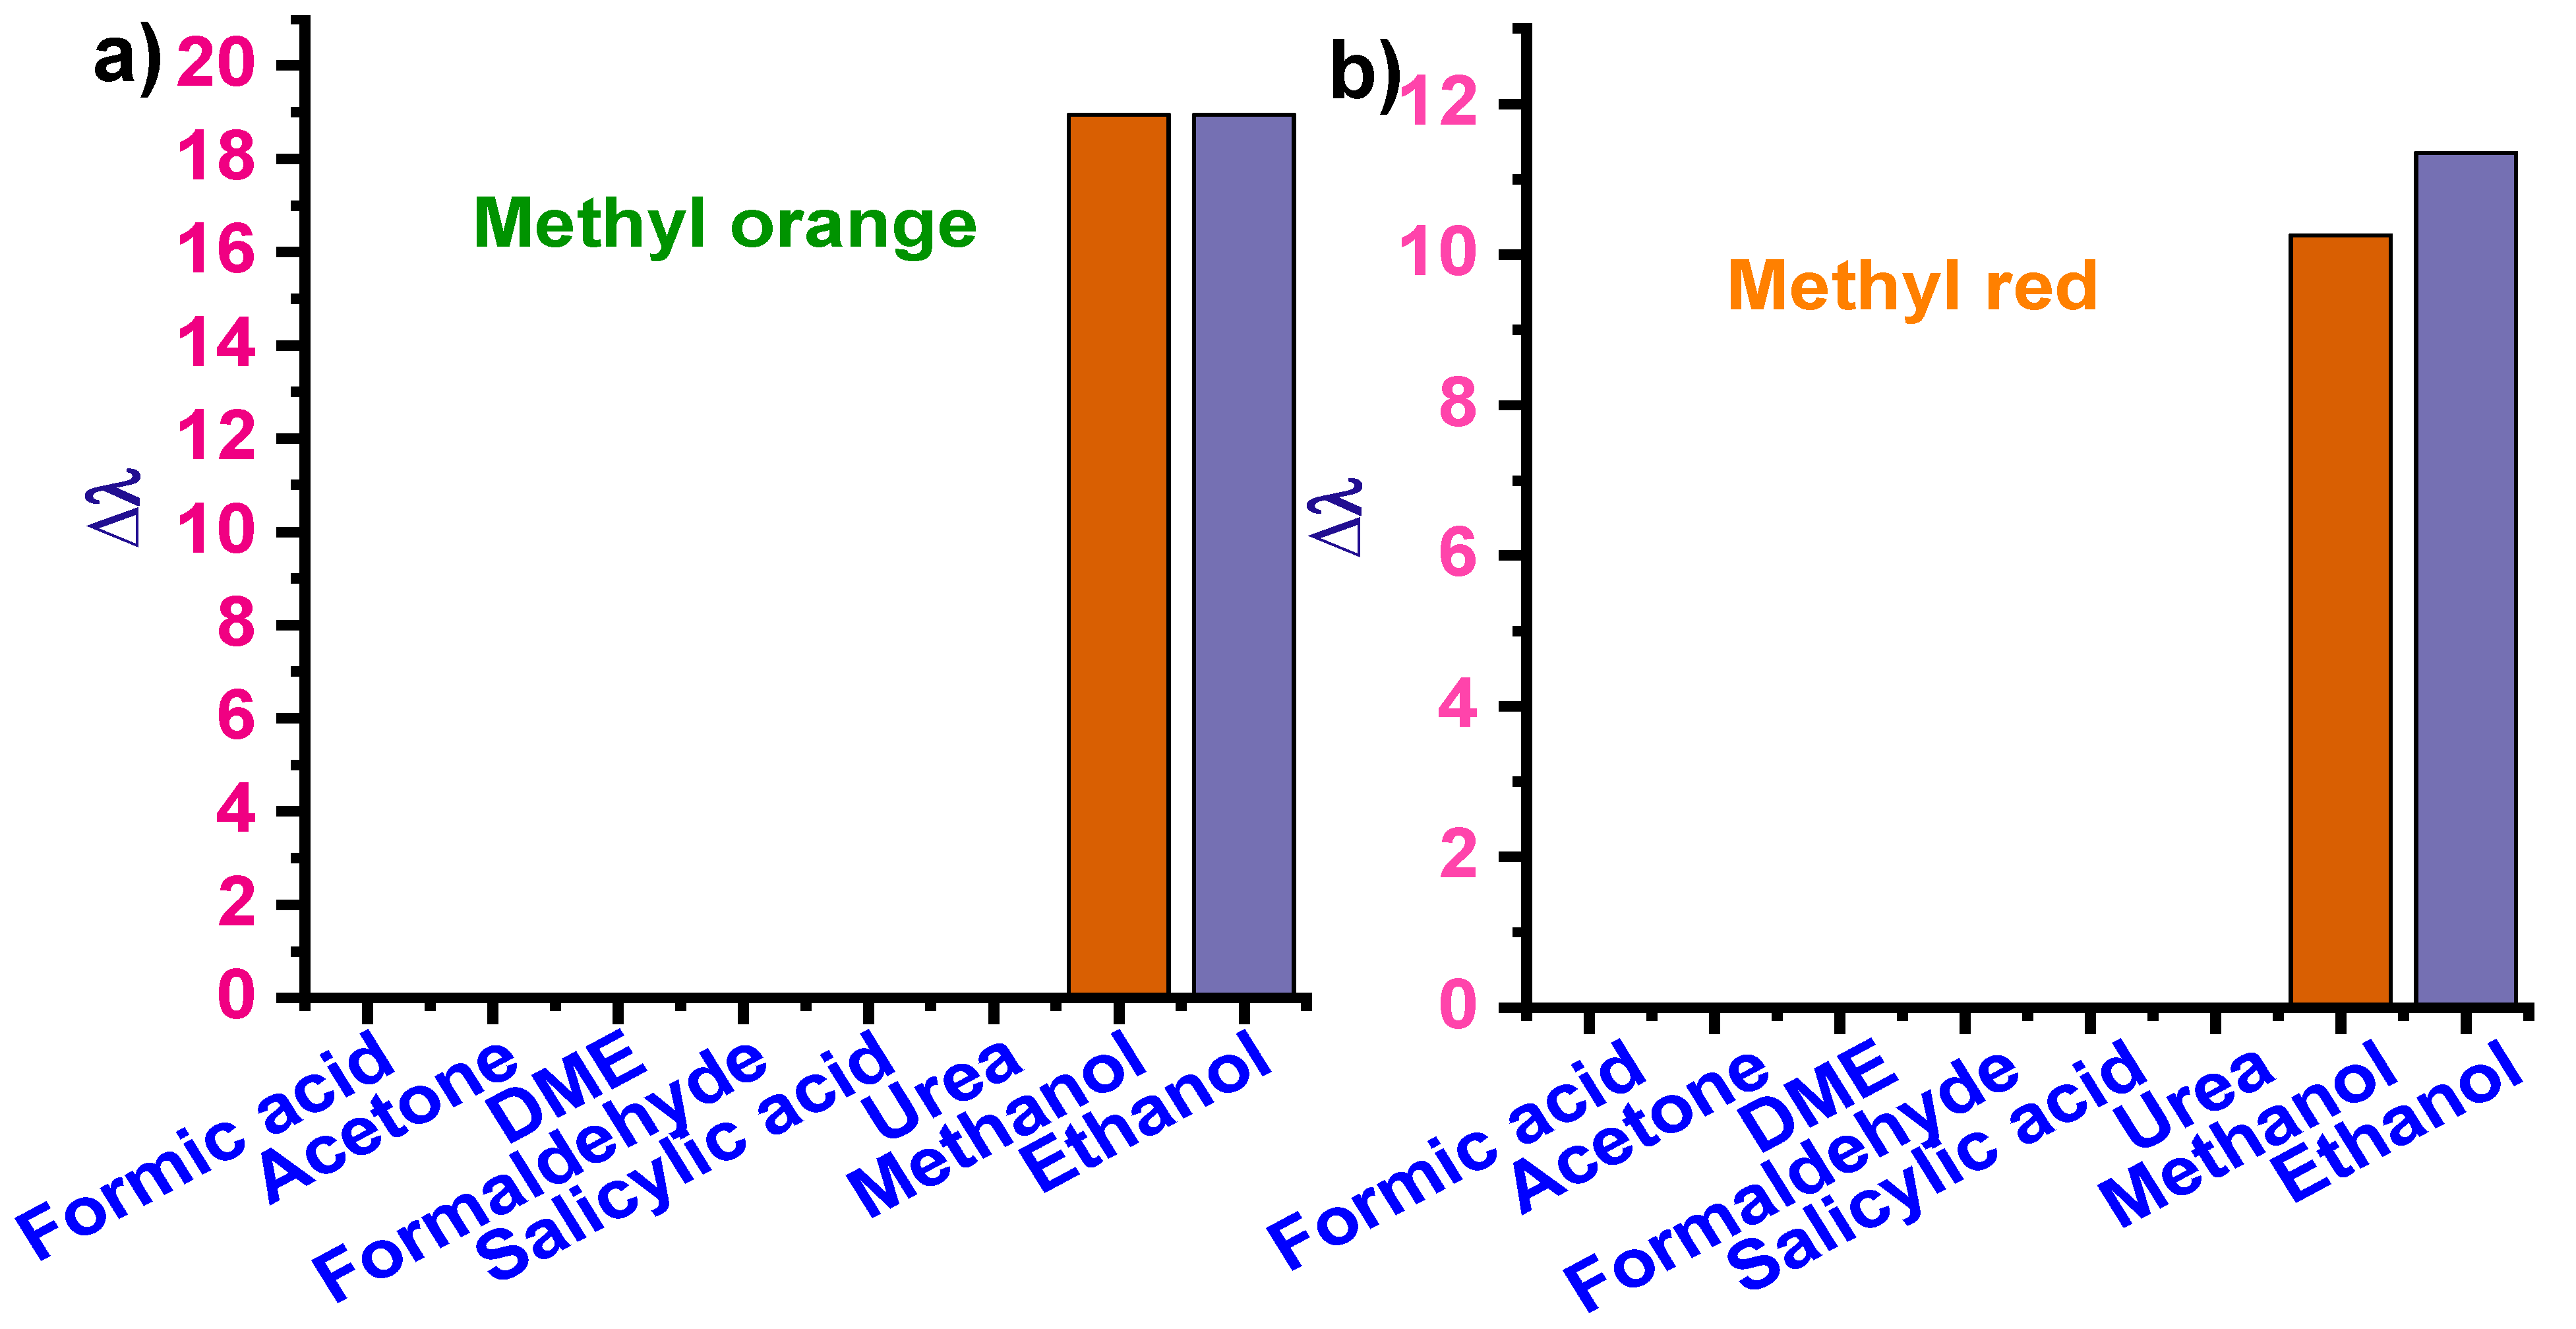
3.2.4. Selectivity Analysis
3.3. Detection of Ethanol
3.3.1. pH Effect
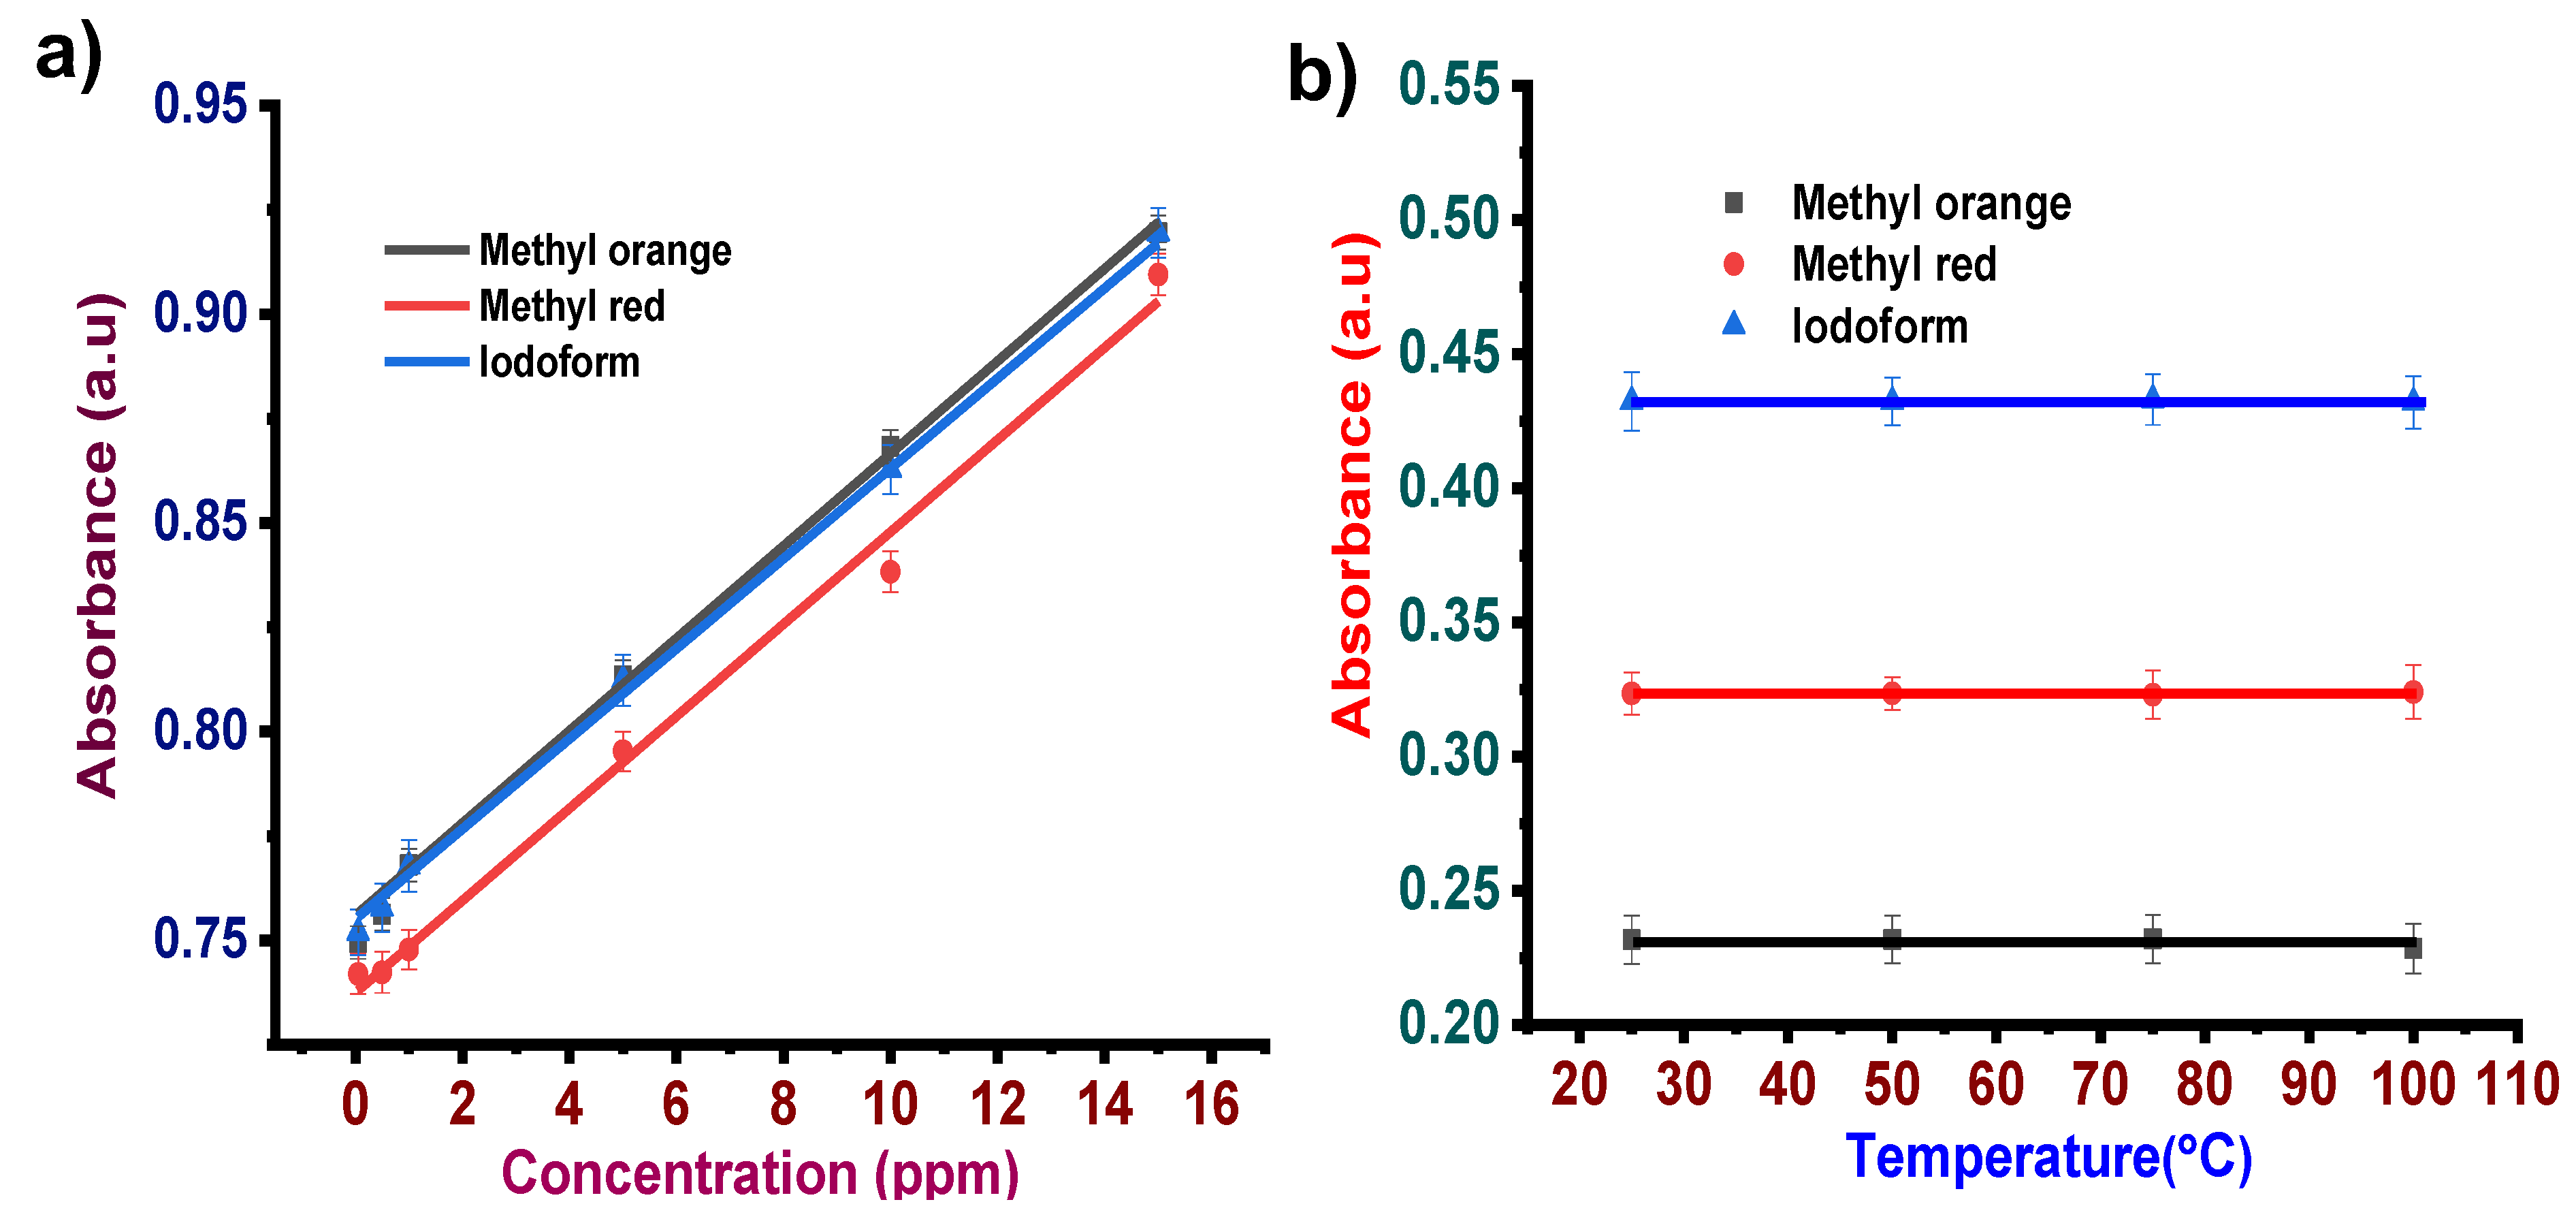
3.3.2. Concentration Effect
3.3.3. Temperature Effect
3.3.4. Selectivity Analysis
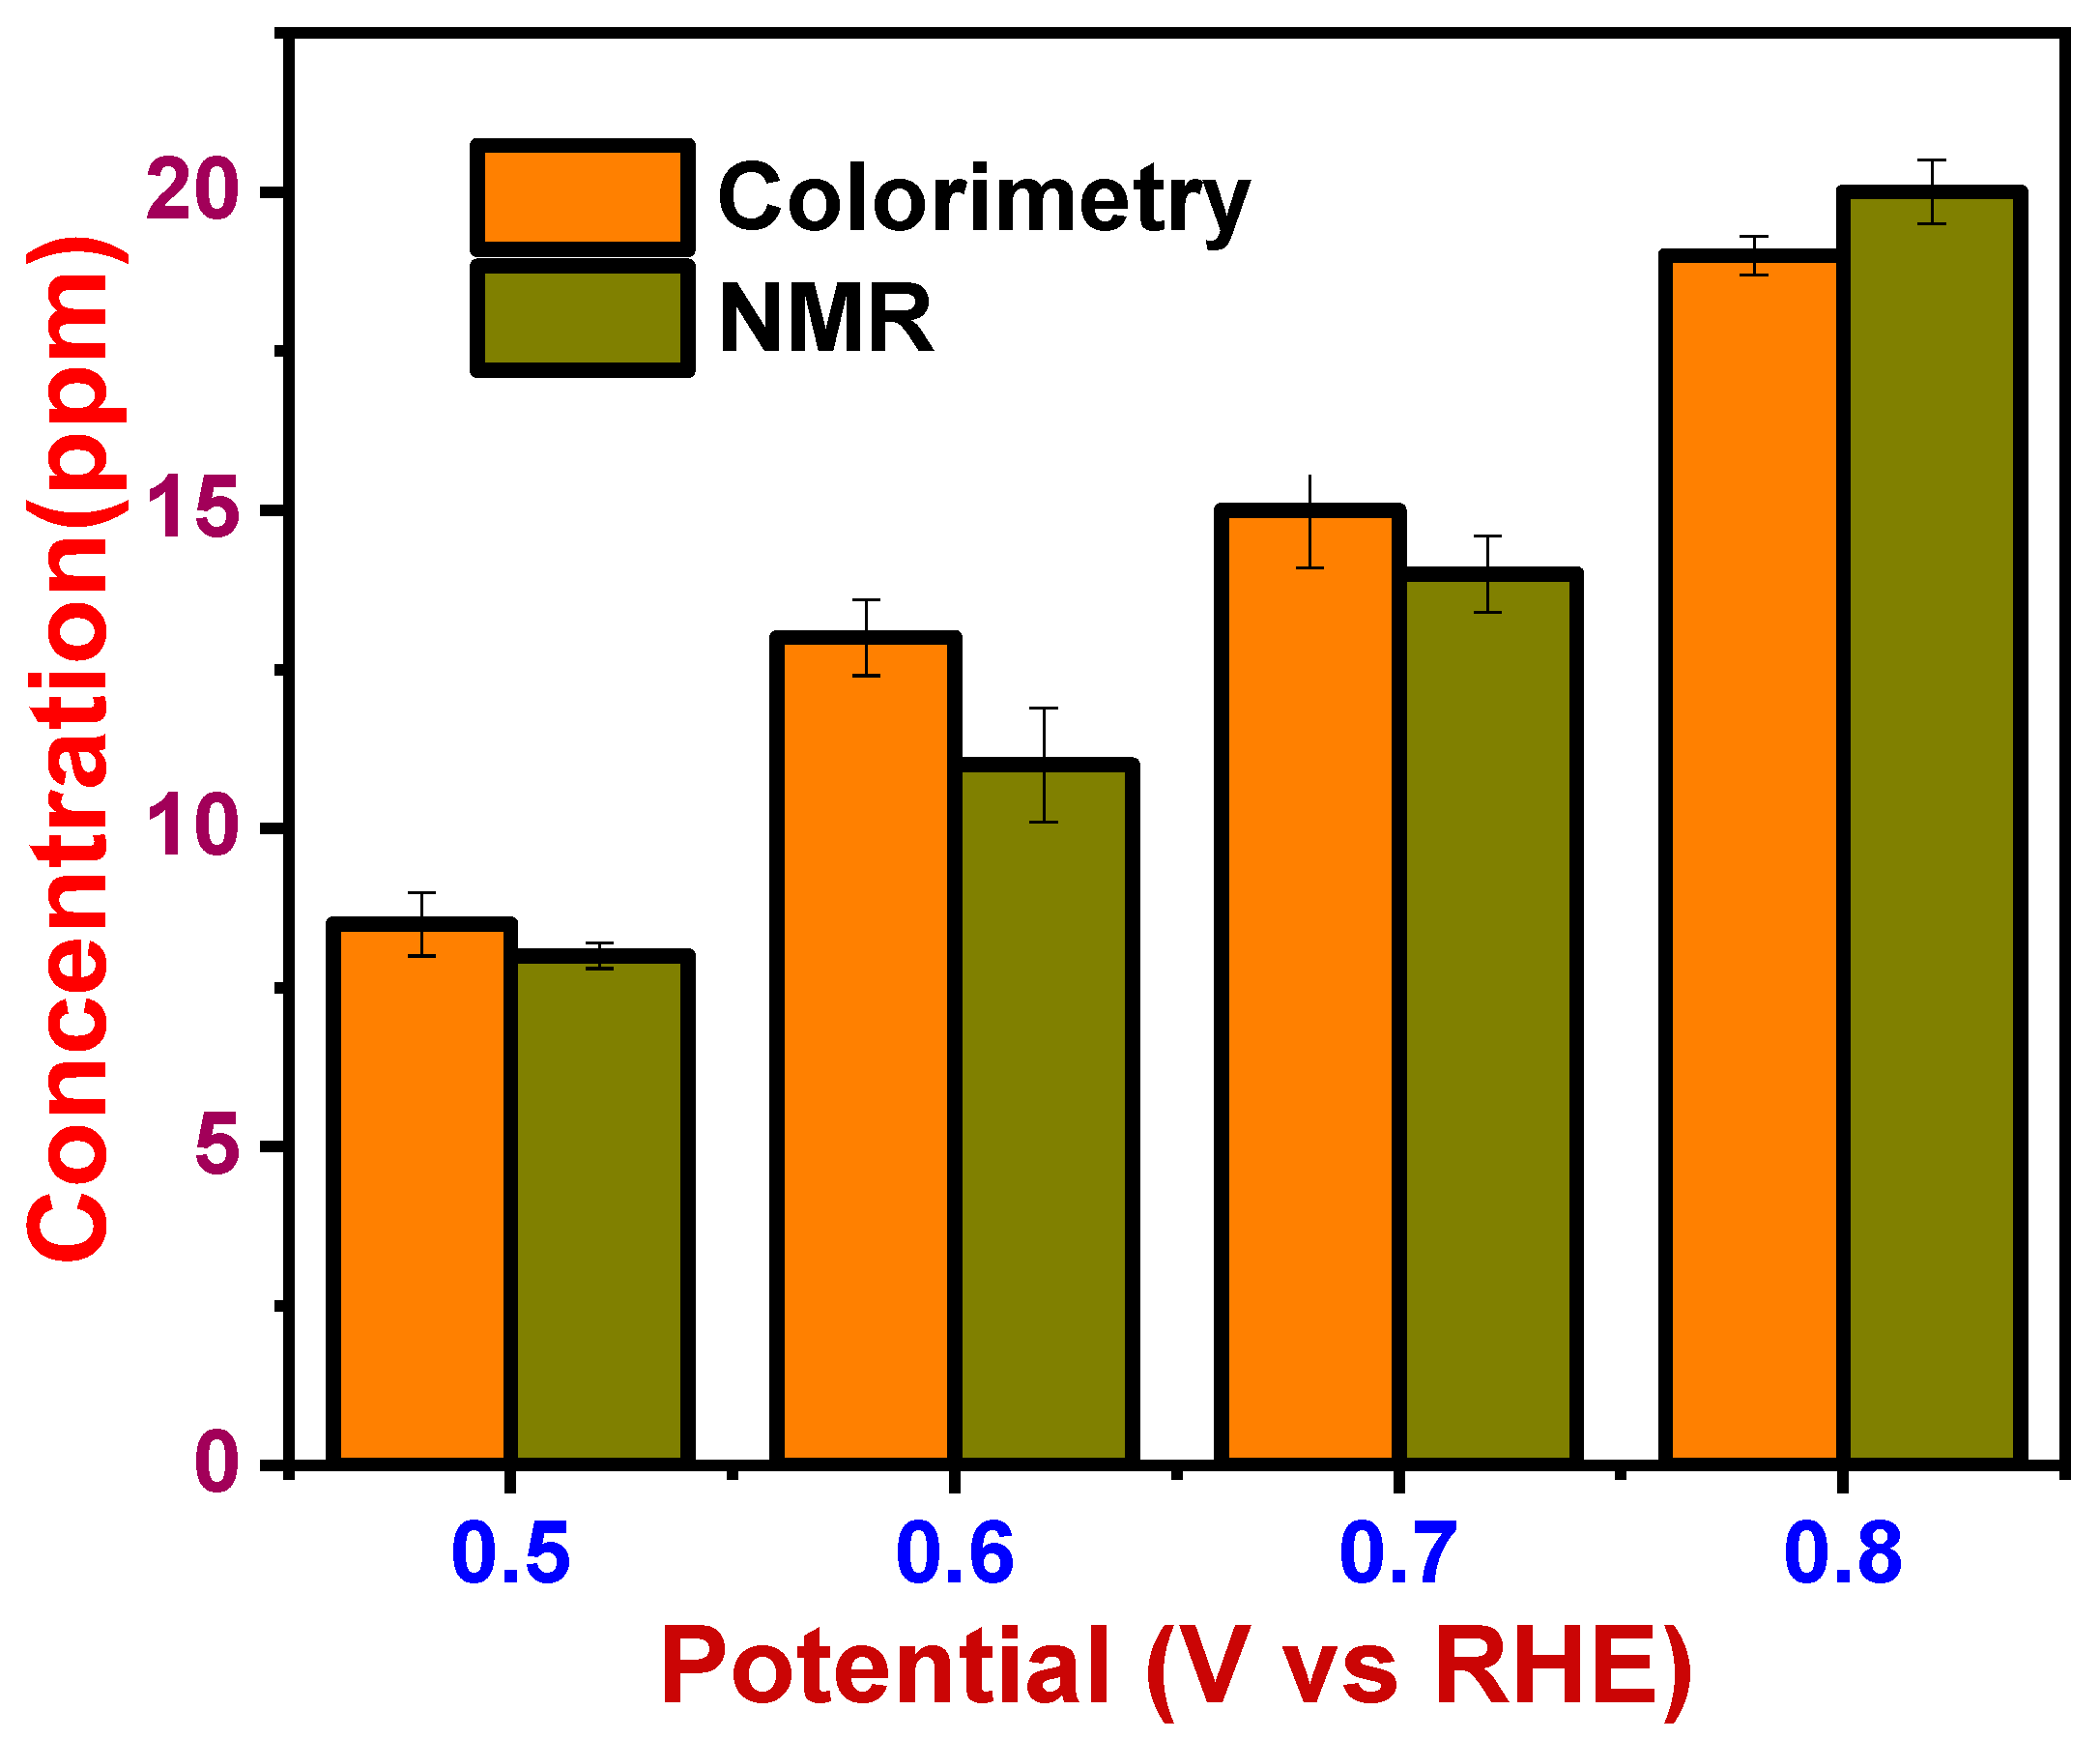
3.4. Evaluation of the Proposed Colorimetric Method and Validation with NMR Technique
4. Conclusions
Author Contributions
Funding
Institutional Review Board Statement
Informed Consent Statement
Data Availability Statement
Acknowledgments
Conflicts of Interest
References
- Khalil, M.; Gunlazuardi, J.; Ivandini, T.A.; Umar, A. Photocatalytic Conversion of CO2 Using Earth-Abundant Catalysts: A Review on Mechanism and Catalytic Performance. Renew. Sustain. Energy Rev. 2019, 113, 109246. [Google Scholar] [CrossRef]
- Wei, Y.; Li, Y.; Wu, M.; Li, Y. The Decomposition of Total-Factor CO2 Emission Efficiency of 97 Contracting Countries in Paris Agreement. Energy Econ. 2019, 78, 365–378. [Google Scholar] [CrossRef]
- Detz, R.J.; van der Zwaan, B. Transitioning towards Negative CO2 Emissions. Energy Policy 2019, 133, 110938. [Google Scholar] [CrossRef]
- Kaya, Y.; Yamaguchi, M.; Geden, O. Towards Net Zero CO2 Emissions without Relying on Massive Carbon Dioxide Removal. Sustain. Sci. 2019, 14, 1739–1743. [Google Scholar] [CrossRef] [Green Version]
- Rispoli, A.L.; Verdone, N.; Vilardi, G. Green Fuel Production by Coupling Plastic Waste Oxy-Combustion and PtG Technologies: Economic, Energy, Exergy and CO2-Cycle Analysis. Fuel Process. Technol. 2021, 221, 106922. [Google Scholar] [CrossRef]
- Fernández-Torres, M.J.; Dednam, W.; Caballero, J.A. Economic and Environmental Assessment of Directly Converting CO2 into a Gasoline Fuel. Energy Convers. Manag. 2022, 252, 115115. [Google Scholar] [CrossRef]
- Yang, Q.; Zhang, J.; Chu, G.; Zhou, H.; Zhang, D. Optimal Design, Thermodynamic and Economic Analysis of Coal to Ethylene Glycol Processes Integrated with Various Methane Reforming Technologies for CO2 Reduction. Energy Convers. Manag. 2021, 244, 114538. [Google Scholar] [CrossRef]
- Rosli, S.-S.; Lim, J.-W.; Jumbri, K.; Lam, M.-K.; Uemura, Y.; Ho, C.-D.; Tan, W.-N.; Cheng, C.-K.; Kadir, W.-N.-A. Modeling to Enhance Attached Microalgal Biomass Growth onto Fluidized Beds Packed in Nutrients-Rich Wastewater Whilst Simultaneously Biofixing CO2 into Lipid for Biodiesel Production. Energy Convers. Manag. 2019, 185, 1–10. [Google Scholar] [CrossRef]
- Reddy, M.S.B.; Ponnamma, D.; Sadasivuni, K.K.; Kumar, B.; Abdullah, A.M. Carbon Dioxide Adsorption Based on Porous Materials. RSC Adv. 2021, 11, 12658–12681. [Google Scholar] [CrossRef]
- Kannan, K.; Sadasivuni, K.K.; Abdullah, A.M.; Kumar, B. Current Trends in MXene-Based Nanomaterials for Energy Storage and Conversion System: A Mini Review. Catalysts 2020, 10, 495. [Google Scholar] [CrossRef]
- Hepburn, C.; Adlen, E.; Beddington, J.; Carter, E.A.; Fuss, S.; Mac Dowell, N.; Minx, J.C.; Smith, P.; Williams, C.K. The Technological and Economic Prospects for CO2 Utilization and Removal. Nature 2019, 575, 87–97. [Google Scholar] [CrossRef] [PubMed] [Green Version]
- Bonura, G.; Todaro, S.; Frusteri, L.; Majchrzak-Kucęba, I.; Wawrzyńczak, D.; Pászti, Z.; Tálas, E.; Tompos, A.; Ferenc, L.; Solt, H.; et al. Inside the Reaction Mechanism of Direct CO2 Conversion to DME over Zeolite-Based Hybrid Catalysts. Appl. Catal. B Environ. 2021, 294, 120255. [Google Scholar] [CrossRef]
- Al-Juboori, O.; Sher, F.; Khalid, U.; Niazi, M.B.K.; Chen, G.Z. Electrochemical Production of Sustainable Hydrocarbon Fuels from CO2 Co-Electrolysis in Eutectic Molten Melts. ACS Sustain. Chem. Eng. 2020, 8, 12877–12890. [Google Scholar] [CrossRef]
- Zheng, Y.; Vasileff, A.; Zhou, X.; Jiao, Y.; Jaroniec, M.; Qiao, S.-Z. Understanding the Roadmap for Electrochemical Reduction of CO2 to Multi-Carbon Oxygenates and Hydrocarbons on Copper-Based Catalysts. J. Am. Chem. Soc. 2019, 141, 7646–7659. [Google Scholar] [CrossRef] [PubMed]
- Nitopi, S.; Bertheussen, E.; Scott, S.B.; Liu, X.; Engstfeld, A.K.; Horch, S.; Seger, B.; Stephens, I.E.L.; Chan, K.; Hahn, C.; et al. Progress and Perspectives of Electrochemical CO2 Reduction on Copper in Aqueous Electrolyte. Chem. Rev. 2019, 119, 7610–7672. [Google Scholar] [CrossRef] [Green Version]
- Zhang, F.; Co, A.C. Rapid Product Analysis for the Electroreduction of CO2 on Heterogeneous and Homogeneous Catalysts Using a Rotating Ring Detector. J. Electrochem. Soc. 2020, 167, 046517. [Google Scholar] [CrossRef]
- Kai, T.; Zhou, M.; Duan, Z.; Henkelman, G.A.; Bard, A.J. Detection of CO2•− in the Electrochemical Reduction of Carbon Dioxide in N,N-Dimethylformamide by Scanning Electrochemical Microscopy. J. Am. Chem. Soc. 2017, 139, 18552–18557. [Google Scholar] [CrossRef]
- Hao, M.; Zhang, R.; Jia, X.; Gao, X.; Gao, W.; Cheng, L.; Qin, Y. A Polymer Based Self-Powered Ethanol Gas Sensor to Eliminate the Interference of Ultraviolet Light. Sens. Actuators A Phys. 2021, 332, 113173. [Google Scholar] [CrossRef]
- Maldonado-Arriola, J.A.; Sánchez-Zeferino, R.; Álvarez-Ramos, M.E. Photoluminescent Properties of ZnO Nanorods Films Used to Detect Methanol Contamination in Tequila. Sens. Actuators A Phys. 2020, 312, 112142. [Google Scholar] [CrossRef]
- Ghorbani, H.; Nezami, A.; Sheikholeslami, B.; Hedjazi, A.; Ahmadimanesh, M. Simultaneous Measurement of Formic Acid, Methanol and Ethanol in Vitreous and Blood Samples of Postmortem by Headspace GC-FID. J. Occup. Med. Toxicol. 2018, 13, 1. [Google Scholar] [CrossRef] [Green Version]
- Liu, B.; Zhuang, J.; Wei, G. Recent Advances in the Design of Colorimetric Sensors for Environmental Monitoring. Environ. Sci. Nano 2020, 7, 2195–2213. [Google Scholar] [CrossRef]
- Ko, E.; Hur, W.; Son, S.E.; Seong, G.H.; Han, D.K. Au Nanoparticle-Hydrogel Nanozyme-Based Colorimetric Detection for on-Site Monitoring of Mercury in River Water. Microchim. Acta 2021, 188, 382. [Google Scholar] [CrossRef]
- Ying, N.; Wang, Y.; Song, X.; Yang, L.; Qin, B.; Wu, Y.; Fang, W. Lateral Flow Colorimetric Biosensor for Detection of Vibrio Parahaemolyticus Based on Hybridization Chain Reaction and Aptamer. Microchim. Acta 2021, 188, 381. [Google Scholar] [CrossRef]
- Singh, H.; Bamrah, A.; Bhardwaj, S.K.; Deep, A.; Khatri, M.; Brown, R.J.C.; Bhardwaj, N.; Kim, K.-H. Recent Advances in the Application of Noble Metal Nanoparticles in Colorimetric Sensors for Lead Ions. Environ. Sci. Nano 2021, 8, 863–889. [Google Scholar] [CrossRef]
- Maurya, M.R.; Onthath, H.; Morsy, H.; Riyaz, N.-U.-S.; Ibrahim, M.; Ahmed, A.E.; Abuznad, R.; Alruwaili, A.; Alsaedi, F.; Kasak, P.; et al. Colorimetry-Based Detection of Nitric Oxide from Exhaled Breath for Quantification of Oxidative Stress in Human Body. Healthcare 2021, 9, 1055. [Google Scholar] [CrossRef] [PubMed]
- Matsukawa, Y.; Umemura, K. Detection of Redox Properties of (6,5)-Enriched Single-Walled Carbon Nanotubes Using Potassium Permanganate (KMnO4). C 2020, 6, 30. [Google Scholar] [CrossRef]
- Bononi, F.C.; Chen, Z.; Rocca, D.; Andreussi, O.; Hullar, T.; Anastasio, C.; Donadio, D. Bathochromic Shift in the UV–Visible Absorption Spectra of Phenols at Ice Surfaces: Insights from First-Principles Calculations. J. Phys. Chem. A 2020, 124, 9288–9298. [Google Scholar] [CrossRef]
- Sun, L.; Rotaru, A.; Robeyns, K.; Garcia, Y. A Colorimetric Sensor for the Highly Selective, Ultra-Sensitive, and Rapid Detection of Volatile Organic Compounds and Hazardous Gases. Ind. Eng. Chem. Res. 2021, 60, 8788–8798. [Google Scholar] [CrossRef]
- Jacobsen, D.; Webb, R.; Collins, T.D.; McMartin, K.E. Methanol and Formate Kinetics in Late Diagnosed Methanol Intoxication. Med. Toxicol. Advers. Drug Exp. 1988, 3, 418–423. [Google Scholar] [CrossRef]
- Kerns, W.; Tomaszewski, C.; McMartin, K.; Ford, M.; Brent, J.; META Study Group. Methylpyrazole for Toxic Alcohols Formate Kinetics in Methanol Poisoning. J. Toxicol. Clin. Toxicol. 2002, 40, 137–143. [Google Scholar] [CrossRef]
- Treichel, J.L.; Henry, M.M.; Skumatz, C.M.B.; Eells, J.T.; Burke, J.M. Formate, the Toxic Metabolite of Methanol, in Cultured Ocular Cells. Neurotoxicology 2003, 24, 825–834. [Google Scholar] [CrossRef]
- Bursová, M.; Hložek, T.; Čabala, R. Simultaneous Determination of Methanol, Ethanol and Formic Acid in Serum and Urine by Headspace GC-FID. J. Anal. Toxicol. 2015, 39, 741–745. [Google Scholar] [CrossRef] [PubMed] [Green Version]
- Pham, Y.L.; Beauchamp, J. Breath Biomarkers in Diagnostic Applications. Molecules 2021, 26, 5514. [Google Scholar] [CrossRef] [PubMed]


| Sl. No | Dye Solution | Dye Structure | Detected pH and Color Change | Response Time |
|---|---|---|---|---|
| 1 | Eosin blue | 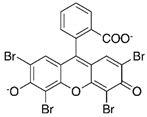 | pH 9 (red to orange), pH 12 (red to pink) | 10 min |
| 2 | Phenyl red | 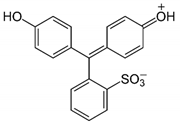 | pH 2, 4, 7 (yellow to magenta) pH 6 (red to magenta) | 2 s |
| 3 | Potassium permanganate | 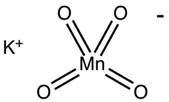 | pH 2 (violet to red) | 2 min |
| 4 | Alizaringelb GG | 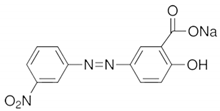 | pH 6 (yellow to light yellow) pH 7 (yellow to orange) | 3 s |
| Sl. No | Dye Solution | The Concentration of Formic Acid in ppm | |||||
|---|---|---|---|---|---|---|---|
| 0.05 | 0.5 | 1 | 5 | 10 | 15 | ||
| 1 | Eosin blue (pH 9) | - | 10 min | 8 min | 6 min 40 s | 2 min | Fraction of seconds |
| 2 | Phenyl red (pH 7) | - | 2 s | Fraction of seconds | Fraction of seconds | Fraction of seconds | Fraction of seconds |
| 3 | Potassium permanganate (pH 2) | - | 2 min | 1 min 43 s | 1 min | 7 s | Fraction of seconds |
| 4 | Alizaringelb GG (pH 7) | - | 3 s | Fraction of seconds | Fraction of seconds | Fraction of seconds | Fraction of seconds |
| Sl. No | F/E/M-Dye Mixture | RGB Values |
|---|---|---|
| 1 | A (Nil) B (Nil) C (Nil) | 265, 195, 10 |
| 2 | A (FX1) B (FX1) C (FX1) | 245, 107, 80 |
| 3 | A (Nil) B (Nil) D (Nil) | 255, 95, 25 |
| 4 | A (FX1) B (FX1) D (FX1) | 245, 107, 60 |
| 5 | G (Nil) H (Nil) I (Nil) | 235, 103, 110 |
| 6 | G (EX1) H (EX1) I (EX1) | 260, 210, 115 |
| 7 | G (Nil) H (Nil) | 235, 118, 85 |
| 8 | G (MX1) H (MX1) | 275, 215, 96 |
| Sl. No | F/E/M-Dye Mixture at Different Concentration | RGB Values |
|---|---|---|
| 1 | A (Nil) B (Nil) C (Nil) | 265, 195, 10 |
| 2 | A (FX2) B (FX2) C (FX2) | 235, 103, 40 |
| 3 | A (FX3) B (FX3) C (FX3) | 240, 116, 49 |
| 4 | A (FX4) B (FX4) C (FX4) | 246, 122, 55 |
| 5 | A (FX5) B (FX5) C (FX5) | 251, 134, 61 |
| 6 | A (FX6) B (FX6) C (FX6) | 253, 141, 66 |
| 7 | A (FX7) B (FX7) C (FX7) | 258, 147, 69 |
| Sl. No | Solution Mixture (0.05 ppm) | Dyes | RGB Values |
|---|---|---|---|
| 1 | FX1 + EX1 + MX1 | A-B-C | 245, 107, 80 |
| 2 | FX1 + EX1 + MX1 | A-B-D | 245, 107, 60 |
| 3 | FX1 + EX1 + MX1 | A-B-G | 245, 107, 275 |
| 4 | FX1 + EX1 + MX1 | A-B-H | 245, 107, 215 |
| 5 | FX1 + EX1 + MX1 | A-B-I | 245, 107, 115 |
Publisher’s Note: MDPI stays neutral with regard to jurisdictional claims in published maps and institutional affiliations. |
© 2022 by the authors. Licensee MDPI, Basel, Switzerland. This article is an open access article distributed under the terms and conditions of the Creative Commons Attribution (CC BY) license (https://creativecommons.org/licenses/by/4.0/).
Share and Cite
Sha, M.S.; Maurya, M.R.; Geetha, M.; Kumar, B.; Abdullah, A.M.; Sadasivuni, K.K. A Smart Colorimetric Platform for Detection of Methanol, Ethanol and Formic Acid. Sensors 2022, 22, 618. https://doi.org/10.3390/s22020618
Sha MS, Maurya MR, Geetha M, Kumar B, Abdullah AM, Sadasivuni KK. A Smart Colorimetric Platform for Detection of Methanol, Ethanol and Formic Acid. Sensors. 2022; 22(2):618. https://doi.org/10.3390/s22020618
Chicago/Turabian StyleSha, Mizaj Shabil, Muni Raj Maurya, Mithra Geetha, Bijandra Kumar, Aboubakr M. Abdullah, and Kishor Kumar Sadasivuni. 2022. "A Smart Colorimetric Platform for Detection of Methanol, Ethanol and Formic Acid" Sensors 22, no. 2: 618. https://doi.org/10.3390/s22020618
APA StyleSha, M. S., Maurya, M. R., Geetha, M., Kumar, B., Abdullah, A. M., & Sadasivuni, K. K. (2022). A Smart Colorimetric Platform for Detection of Methanol, Ethanol and Formic Acid. Sensors, 22(2), 618. https://doi.org/10.3390/s22020618