Skip to Content
SensorsSensors
  • Article
  • Open Access

30 September 2022

An Anomaly Detection Algorithm Based on Ensemble Learning for 5G Environment

,
,
,
and
Computer & Software School, Hangzhou Dianzi University, Hangzhou 310018, China
*
Author to whom correspondence should be addressed.
This article belongs to the Special Issue Frontiers in Mobile Multimedia Communications

Abstract

With the advent of the digital information age, new data services such as virtual reality, industrial Internet, and cloud computing have proliferated in recent years. As a result, it increases operator demand for 5G bearer networks by providing features such as high transmission capacity, ultra-long transmission distance, network slicing, and intelligent management and control. Software-defined networking, as a new network architecture, intends to increase network flexibility and agility and can better satisfy the demands of 5G networks for network slicing. Nevertheless, software-defined networking still faces the challenge of network intrusion. We propose an abnormal traffic detection method based on the stacking method and self-attention mechanism, which makes up for the shortcoming of the inability to track long-term dependencies between data samples in ensemble learning. Our method utilizes a self-attention mechanism and a convolutional network to automatically learn long-term associations between traffic samples and provide them to downstream tasks in sample embedding. In addition, we design a novel stacking ensemble method, which computes the sample embedding and the predicted values of the heterogeneous base learner through the fusion module to obtain the final outlier results. This paper conducts experiments on abnormal traffic datasets in the software-defined network environment, calculates precision, recall and F1-score, and compares and analyzes them with other algorithms. The experimental results show that the method designed in this paper achieves 0.9972, 0.9996, and 0.9984 in multiple indicators of precision, recall, and F1-score, respectively, which are better than the comparison methods.

1. Introduction

The advancement of communication technology has altered the face of human civilization as it enters the digital information era. The advancement of information technology will have an impact on the ease of living in human civilization. With the arrival of the 5G era, human society’s level of informatization will become even higher. In comparison to 4G, the 5G network’s application scenarios will span the sectors of mobile Internet, Internet of Vehicles, and the Industrial Internet. Simultaneously, operators have set greater standards for 5G networks, including huge transmission capacity, ultra-long transmission distance, network slicing, and intelligent management and control. Among them, the software-defined network (SDN) is a new type of network design idea that intends to increase network flexibility and agility and can better fulfill the network slicing demands of 5G networks. The central concept of software-defined networking is to decouple past network architecture into the control plane and the data plane and to previous abstract network functions into applications in the network operating system in the control plane [1]. From top to bottom, the software-defined network architecture is split into the application plane, control plane, infrastructure layer, and physical device layer [2,3], as illustrated in Figure 1. The system components of the application plane include application applications and network management systems. This applies to control plane service requests made via the northbound interface provided by the SDN regulator [4]. One or more SDN controllers comprise the control plane. In the software-defined network architecture, the SDN controller serves as a bridge between the application plane and the infrastructure layer. On the one hand, the SDN controller exposes diverse programmable services to upper-layer application software via the northbound interface, and network users can flexibly formulate network policies based on actual application scenarios; on the other hand, the SDN controller constructs and maintains a global network view via the southbound interface to control and manage network devices at the infrastructure layer, and inherits the control plane functions. The infrastructure layer is made up of data-forwarding devices such as switches and routers that were abstracted into network devices. The data flow is handled in accordance with the instructions given by the SDN controller, thereby improving network device management efficiency. The physical layer includes control equipment, including field instruments, sensors, and actuators and performs duties such as information interchange between the ICS controller and field equipment. SDN has gotten much attention from people from many areas of life.
Figure 1. SDN network architecture diagram.
However, software-defined networks are vulnerable to cyber-attacks in the same way that traditional networks are. As previously said, SDN introduces the SDN controller, which provides unified API services for the application plane and the infrastructure layer, allowing the network to be centralized, programmable, and open. These characteristics, such as permitting mismatched network packets to be submitted to the controller to request forwarding rules, raise security issues for SDN. A network assault is frequently exhibited as anomalous traffic. The term “abnormal traffic” refers to network traffic behavior that deviates from the expected typical pattern. Server overload induced by DOS assaults, worms’ privileged access, and server attacks will result in anomalous traffic [5]. SDN network security risks primarily target the control plane, with the majority of attacks targeting the network’s controller [6]. Malicious controllers, malware, and malicious switches can all put SDN controllers at risk. The controller’s security has a direct influence on SDN security since it is the centralized decision-making entity and processing hub of SDN.
When aberrant traffic is detected, abnormal traffic detection technology monitors network traffic transmission immediately, sends an alarm, or takes active reaction steps. The real-time monitoring of SDN traffic may maintain the security, confidentiality, and integrity of SDN network information while also promoting the development and implementation of SDN technology [5]. As a result, research on intrusion detection systems in the context of SDN offers tremendous theoretical and application value for creating and upgrading SDN technology.
Hinton, Geoffrey E. et al. [7] proposed the concept of deep learning in 2006. With the continuous improvement in computer computing power and the continuous development of algorithms, deep learning algorithms that require huge computing power have attracted great attention from researchers and enterprises. Traditional detection algorithms based on traffic feature statistics and machine learning perform better when small-scale datasets and feature quantities are small. However, it still relies on the manual judgment and induction of traffic characteristics. Deep learning algorithms can calculate optimal solutions from limited data and do not require expert knowledge to find unknown and new abnormal traffic types. With large-scale datasets and many features, it can also have better performance.
We propose an abnormal traffic detection method based on the stacking method and self-attention mechanism (TSMASAM) that combines the self-attention mechanism and ensemble learning to make up for the inability of ensemble learning to learn the associations between data. First, we propose a neural network composed of a self-attention mechanism and a deep convolutional network which aims to automatically learn the correlation between traffic samples, capture the feature space’s internal structure, and provide it downstream in the form of a sample embedding task. Secondly, we design a novel stacking integration method, which aims to detect and identify abnormal network traffic by integrating the sample embedding obtained above and the inspection results of the heterogeneous base learner. Finally, we design a new loss function, which fully and comprehensively considers the basic learner’s influence on the model’s overall performance by introducing the basic learner’s loss value and the regular term composed of it and preventing the model from falling into an overfitting state.
The main contributions of this paper are as follows:
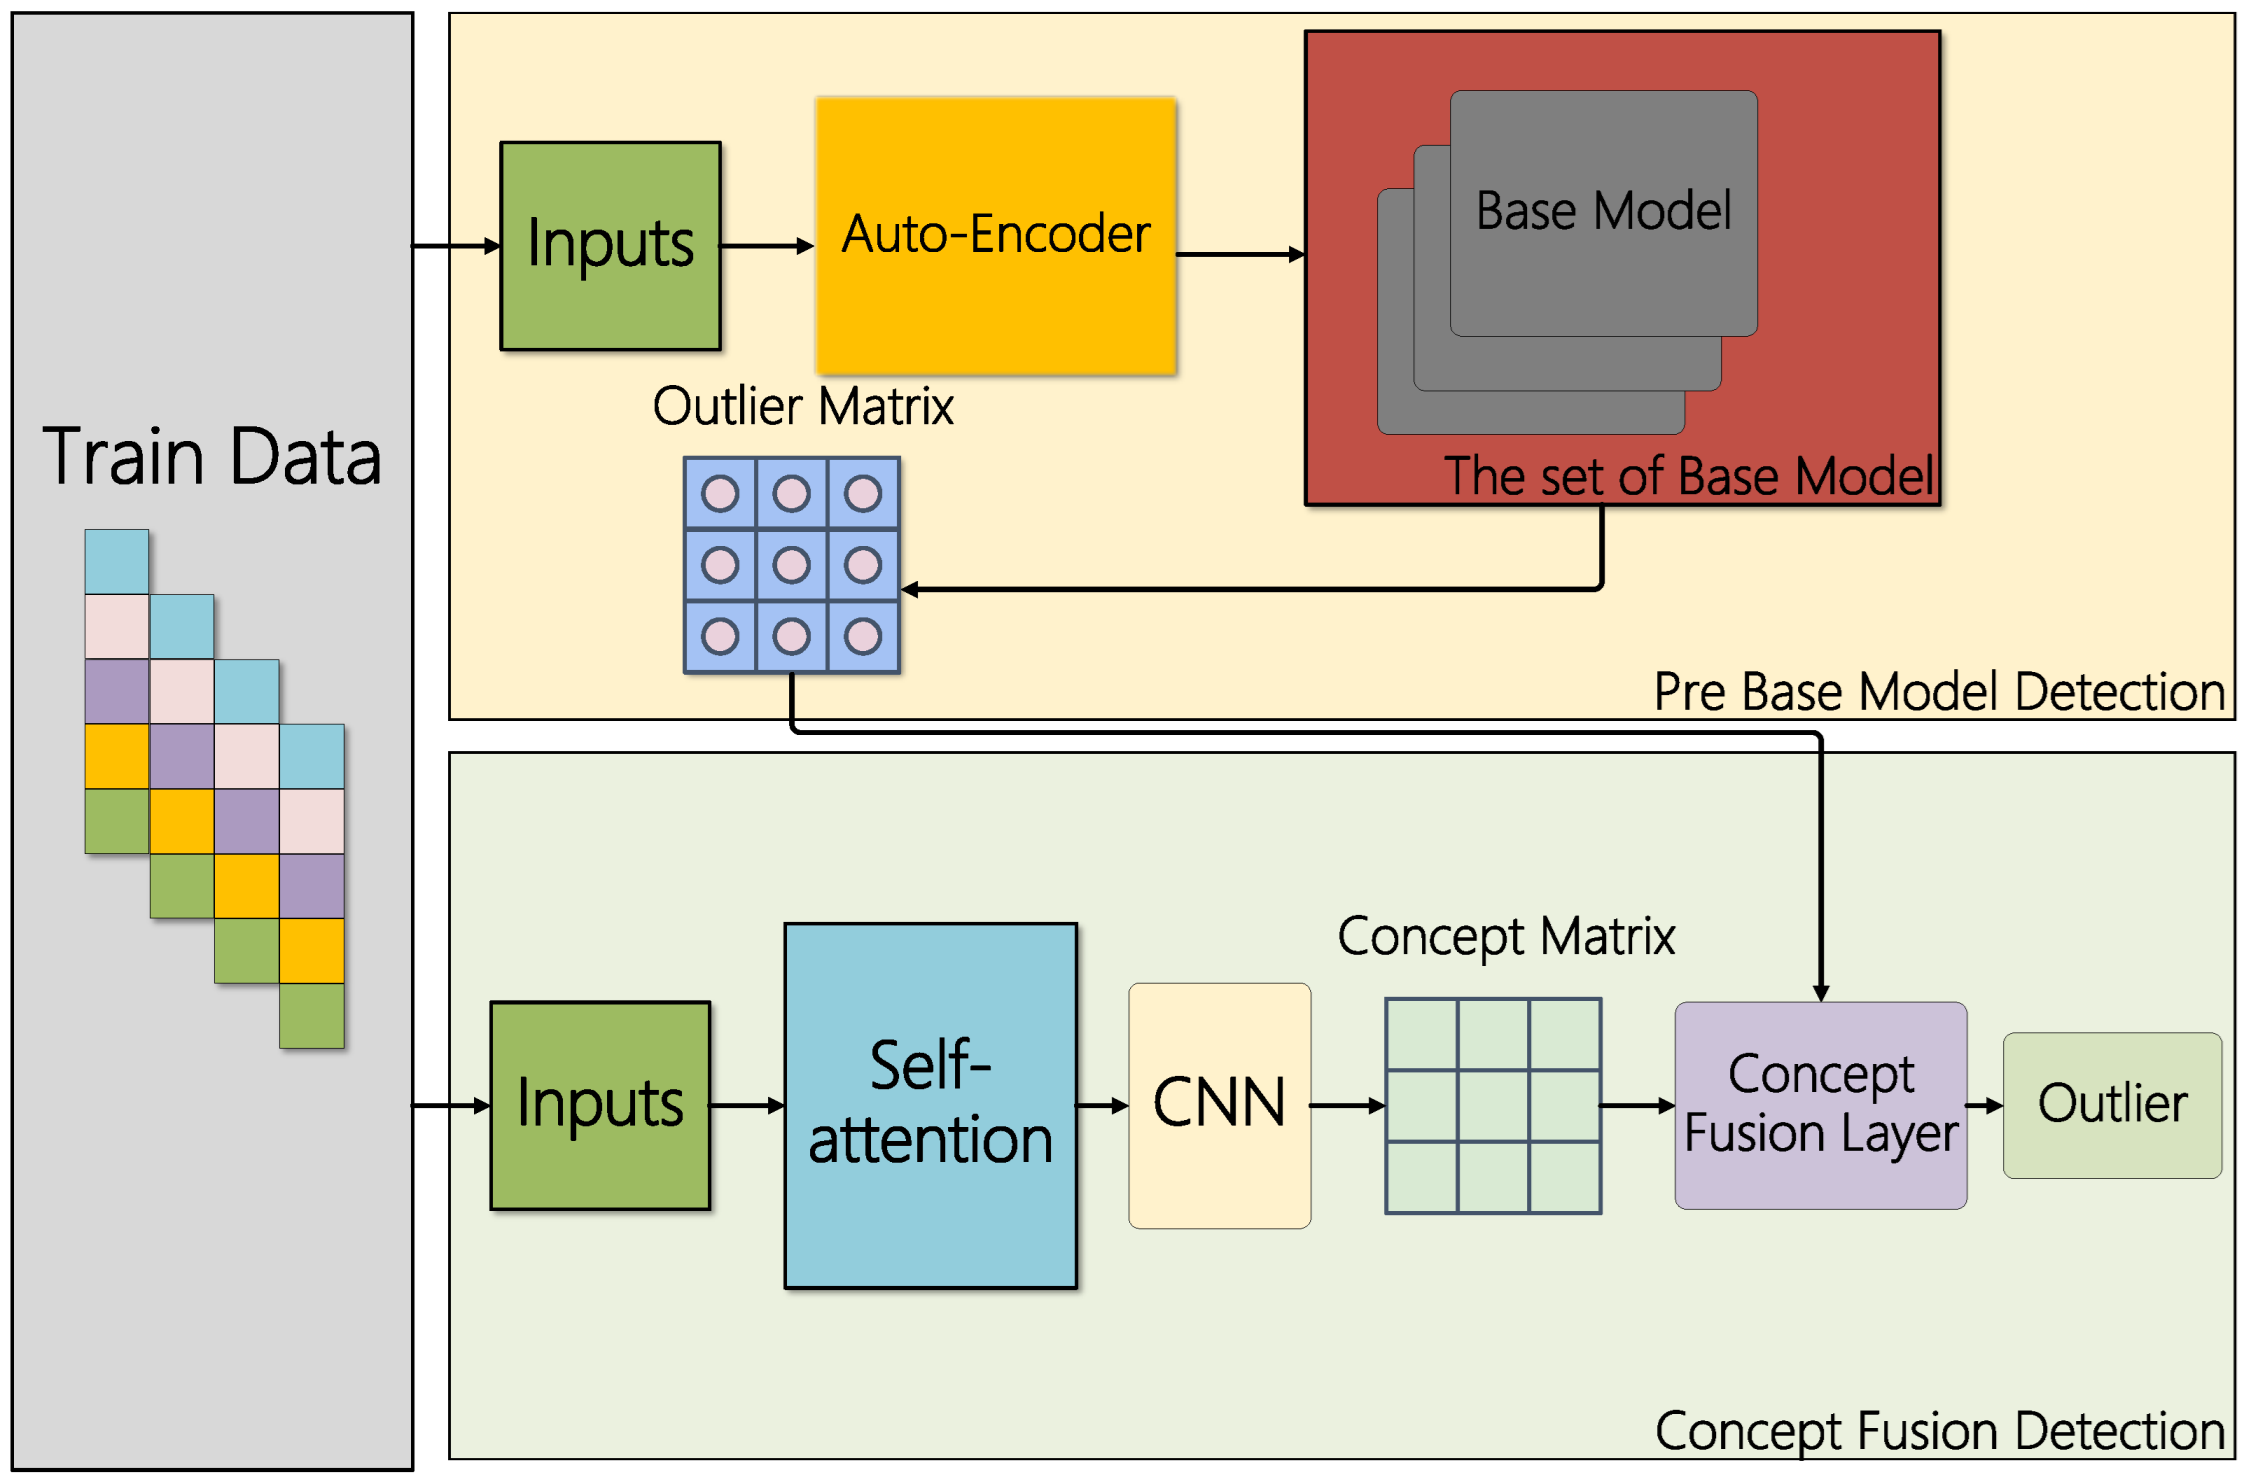
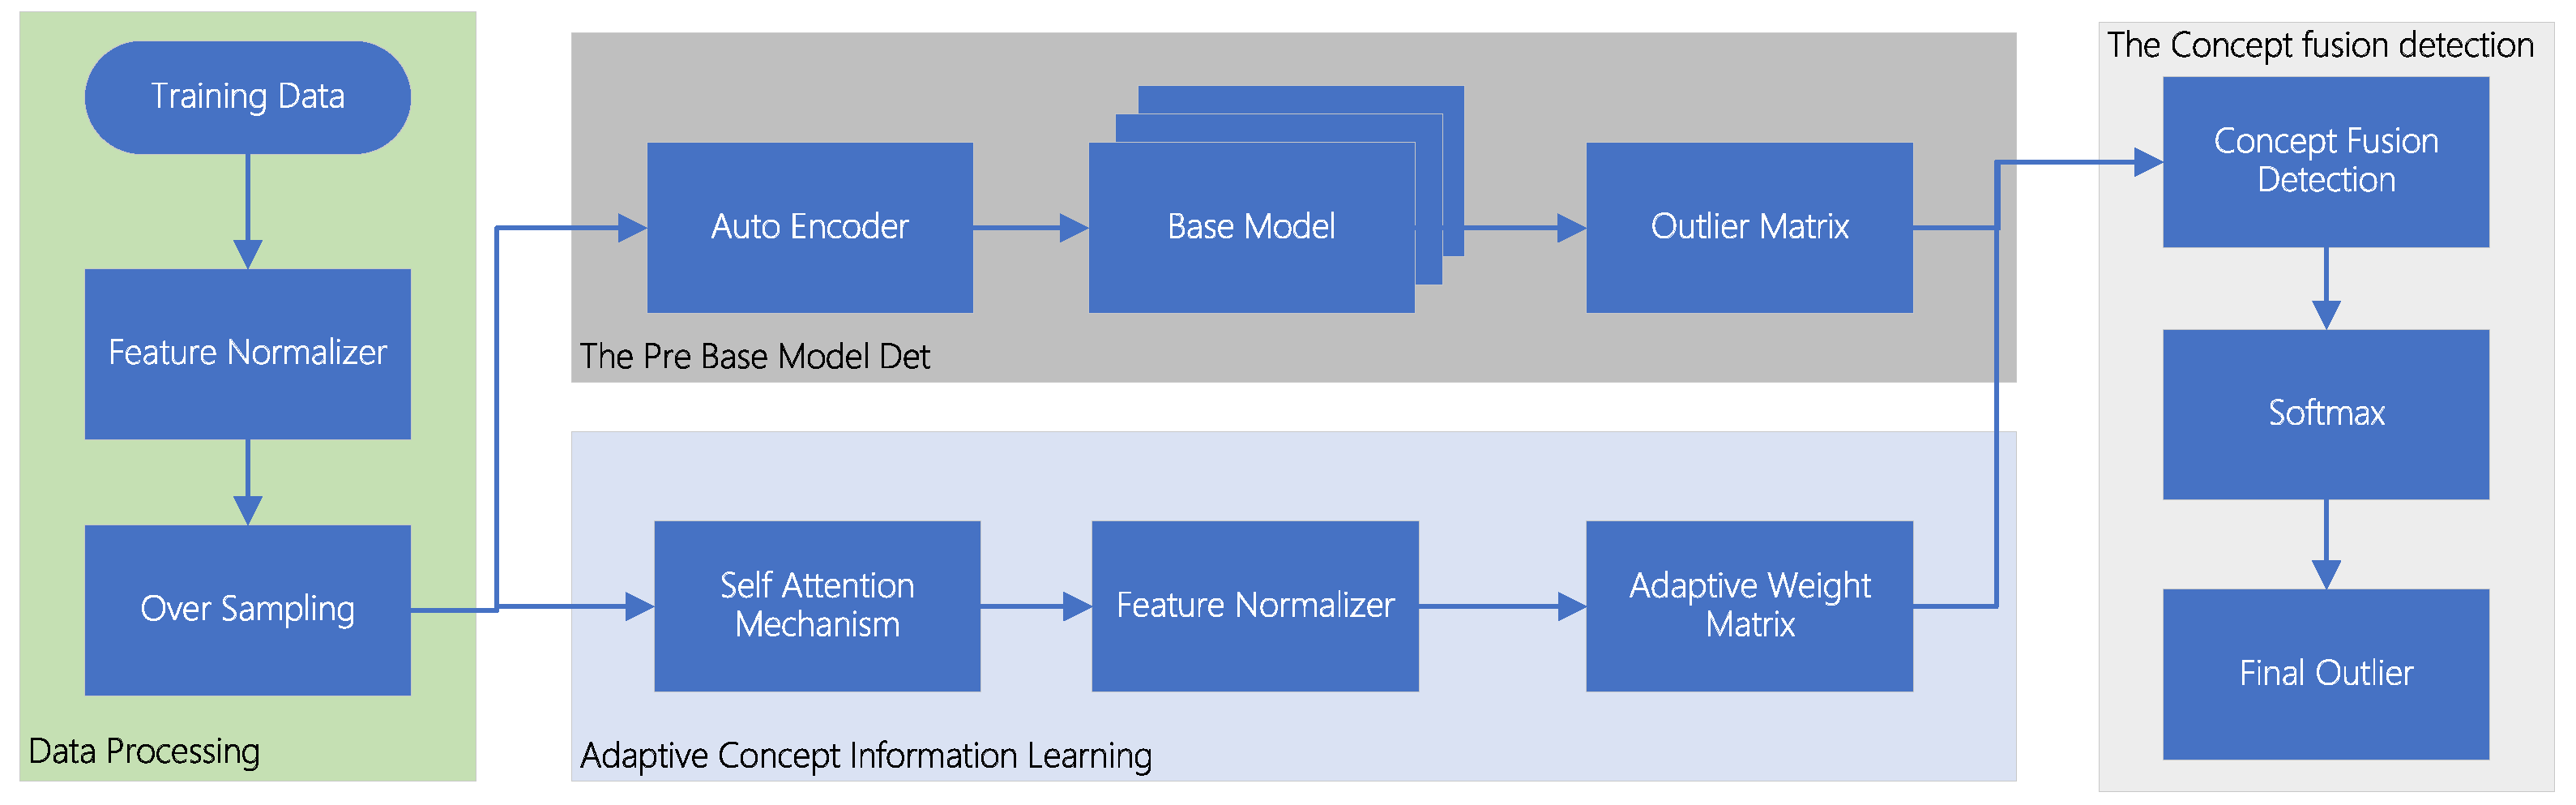
  • We propose a neural network composed of a self-attention mechanism and a deep convolutional network, which learns from samples and converts them into sample embeddings.
  • We propose a stacking ensemble learning method composed of the autoencoder and base learner, using the autoencoder to remove irrelevant information in the samples and the stacking method to integrate the detection results of sample embedding and the base learner.
  • We design a novel loss function to observe the operation of the model through the introduced regularization term and base learner loss value. We use a network traffic dataset under an SDN architecture to evaluate the model’s performance. The results show that the model has a better abnormal traffic detection effect than the comparison model.
The structure of this paper is as follows: Section 2 briefly describes the research status of related work; Section 3 introduces the experimental environment, model framework, and specific design of TSMASAM; Section 4 details the experiments and performance evaluation of TSMASAM proposed in this paper. In Section 5, we conclude the paper.

3. Materials and Methods

TSMASAM is a deep learning model based on ensemble learning and the self-attention mechanism. Combining the self-attention mechanism and ensemble learning makes up for the relationship between data that cannot be learned by ensemble learning. The module frame is shown in Figure 2. TSMASAM consists of two parts: sample association learning and integrated detection network. The dataset we adopted (InSDN dataset) was generated by simulating the environment under four virtual machines; the first virtual machine was Kali Linux, which represents the attacker server; the second virtual machine was Ubuntu 16.4, which was used as ONOS the controller; the third was the Ubuntu 16.4 machine as a Mininet and OVS switch; the fourth virtual machine was a Metasploitable 2-based Linux machine as an exploit service to demonstrate the exploit. The controller of SDN was implemented using the open source tool ONOS. This dataset contains anomalous traffic from inside and outside attackers targeting the controller. Our approach builds on this to detect traffic data passing through an SDN controller.
Figure 2. Adaptive ensemble learning model based on the self-attention mechanism.

3.1. Data Preprocessing

The experimental flow is shown in Figure 3. Before the data enter the model, the data are preprocessed. This paper first normalizes the data. If there is missing information in the dataset, the data row is deleted. Finally, this paper uses the hierarchical leave-out method to split the dataset into two parts: the training set and the test set. Due to the unbalanced nature of the data, this paper performs oversampling operations on the training set.
Figure 3. Flow chart of TSMASAM experiment.

3.2. Related Definitions

Definition 1.
The dataset is represented as X = x 1 , , x N R m × N , where each sample is represented as x i = x i 1 , , x i m R m , by m-dimensional feature composition.
Definition 2.
F = f X 1 , , f X k is expressed as the set of base learners with the number of base learners k.
Definition 3.
In the abnormal traffic detection model, input data X = x 1 , , x N is given. The model aimed to learn a function H(X) to classify samples. Finally, according to the classification result, determine whether the sample x i is abnormal:
y i ^ = 1 , i f H x i = 1 0 , i f H x i = 0
wherein y i ^ = 1 means that the function H(X) predicts that the data sample x i is abnormal, and y i ^ = 0 implies that the function H(X) predicts that the data point x i is normal.

3.3. Sample Associative Learning

To explore the correlation between multiple sample features, the model introduces a self-attention mechanism to automatically learn the correlation between samples, captures the feature space’s internal structure, and uses a convolutional network to construct a sample embedding to express the relationship between data samples. Given a set of input samples X = x 1 , , x N R m × N , the self-attention mechanism is used to learn the sample x i = x i 1 , , x i m R m relationship between traffic characteristics. Self-attention maps samples to three different feature spaces, resulting in three vectors (query vector q i R D k , key vector k i R D k , and value vector v i R D v ):
Q = W q X R D k × N
K = W k X R D k × N
V = W v X R D v × N
where W q R D k × D x , W k R D k × D x , W v R D v × D x are the parameter matrix of feature mapping, and the Q = q 1 , , q N , K = k 1 , , k N , V = v 1 , , v N matrix consists of the query vector, key vector and value vector, respectively. The purpose of setting Q, K, and V is to find the correlation coefficient with other features by calculation, calculate a weight for each feature, and then obtain a weighted result to judge the relationship between each feature and other features. At most, the detection efficiency of traffic is improved by learning the information in these attention values. The main work of self-attention is to calculate the dot product of the query Q and all K, scale it, derive the weight of the value V through the softmax function, and then multiply the value V and the weight to obtain the attention value:
(5) μ n = a t t ( ( K , V ) , q n ) (6) = j = 1 N a n j v j (7) = j = 1 N s o f t m a x ( s ( k j , q n ) ) v j (8) = j = 1 N e x p ( s ( k j , q n ) ) z e x p ( s ( k z , q n ) )
among them, j , n [ 1 , N ] is the position of the input vector and the output vector sequence; a n j represents the weight value of the nth output concerned with the jth input; q n represents the query vector of the nth input sample; k j represents the key of the jth input; v j represents the value of the jth input, which contains the input information. Therefore, the calculated attention value is equivalent to the attention value between the ith sample and the 1st, 2nd, and ith inputs, that is, the correlation between each input. After obtaining the calculated attention value μ i , map μ i to a new feature space to obtain the embedding vector e i R D s × k :
e i = s o f t m a x f ¯ μ i
where f μ i is the feature mapping function. After the above calculation, the embedding vector e i is finally obtained, and E = e 0 , , e N R D s × k × N is the sample embedding matrix composed of the embedding vectors. In this paper, the mapping function we choose is the convolutional neural network (CNN).

3.4. Ensemble Detection Network

3.4.1. Auto Encoder

We use an autoencoder to denoise the original to obtain representative feature information in the samples. After processing by the autoencoder, we obtain the reconstructed information vector X = x 1 , , x N R m × N :
h i = g θ 1 x i = σ W 1 × x i + b 1
x i ¯ = g θ 2 x i = σ W 2 × x i + h 2
where h i is the latent feature learned by the auto-encoder from the input information x i , and g θ 1 x i and g θ 2 x i are the encoder and decoder functions in the auto-encoder. The encoder function g θ 1 x i and the decoder function g θ 2 x i are composed of a multi-layer fully connected network for feature transformation. The purpose of the encoder is to perform feature transformation on the sample features, and the purpose of the decoder is to reconstruct the original data from the latent features h i obtained by the encoder to obtain the decoded data x i .

3.4.2. Stacking Ensemble Detection Network

The stacking ensemble detection network learns to train the base learner by reconstructing the data X . In this paper, CNN, LSTM, and LENET networks are used as the heterogeneous base learner of the network, and the classification judgment of traffic is made according to the reconstructed data X :
δ i = f X i R N
Δ = F X R D o × k × N
where f X i is the base learner, δ i is the outlier matrix obtained after the base learner f X i detection, and Δ = δ 0 , , δ k R D o × k × N is composed of outliers obtained by the base learner. The learner can be any supervised classifier. In theory, heterogeneous base learners can make more robust coarse-grained detection. Diversity and heterogeneity among base learners can provide different perspectives for classification.
In the second layer of the stacking ensemble detection network, we designed a fusion module to train the fusion module by using the long-term dependencies between samples captured by the self-attention mechanism and the prediction results of the base learner as a new dataset. Based on the embedded vector c i and the outlier matrix δ i , the stacking ensemble detection network performs a dot product operation on the embedded vector c i and the outlier matrix δ i through a fusion module then obtains the final detection result through a fully connected layer:
o i = s o f t m a x j = 0 k C F c i j , δ i j (14) = s o f t m a x j = 0 k c i j δ i j (15)
where C F c i j , δ i j is the embedding fusion function, and o i is the outlier vector obtained by the fusion function. We choose the dot product method to fuse the embedding vectors in our method. In theory, an excellent fusion method can effectively exploit the information in the embedding vector.
We design a new loss function to fully consider the sharing of each base model to the model as a whole. The loss function of our method is calculated based on the cross-entropy loss function:
L Y ^ , Y , Δ = W 0 × C E Y ^ , Y + t = 1 k W t × C E δ t , Y + l o g 1 + t = 1 k C E δ t , Y
where C E is the cross-entropy loss function, W t is the weight value with a sum of 1, Y is the label set, Y ^ is the outlier prediction made by the method in this paper, and Δ is the outlier prediction value set made by the base learner set. W 0 × C E Y ^ , Y is the cross entropy between the predicted value made by the method in this paper and the label set Y. W t × C E δ t , Y is the cross entropy between the predicted value of each base learner and the label set Y, which aims to fully consider the pre-detection results of the base learner during the training process. l o g 1 + t = 1 k C E δ t , Y is used as the regular term of the loss function to prevent the model from falling into an overfitting state. 1 + t = 1 k C E δ t , Y guarantees that the function value is always greater than 1. W t is used as a hyperparameter in the model training process to adjust the weight of the different items.

4. Experiment and Analysis

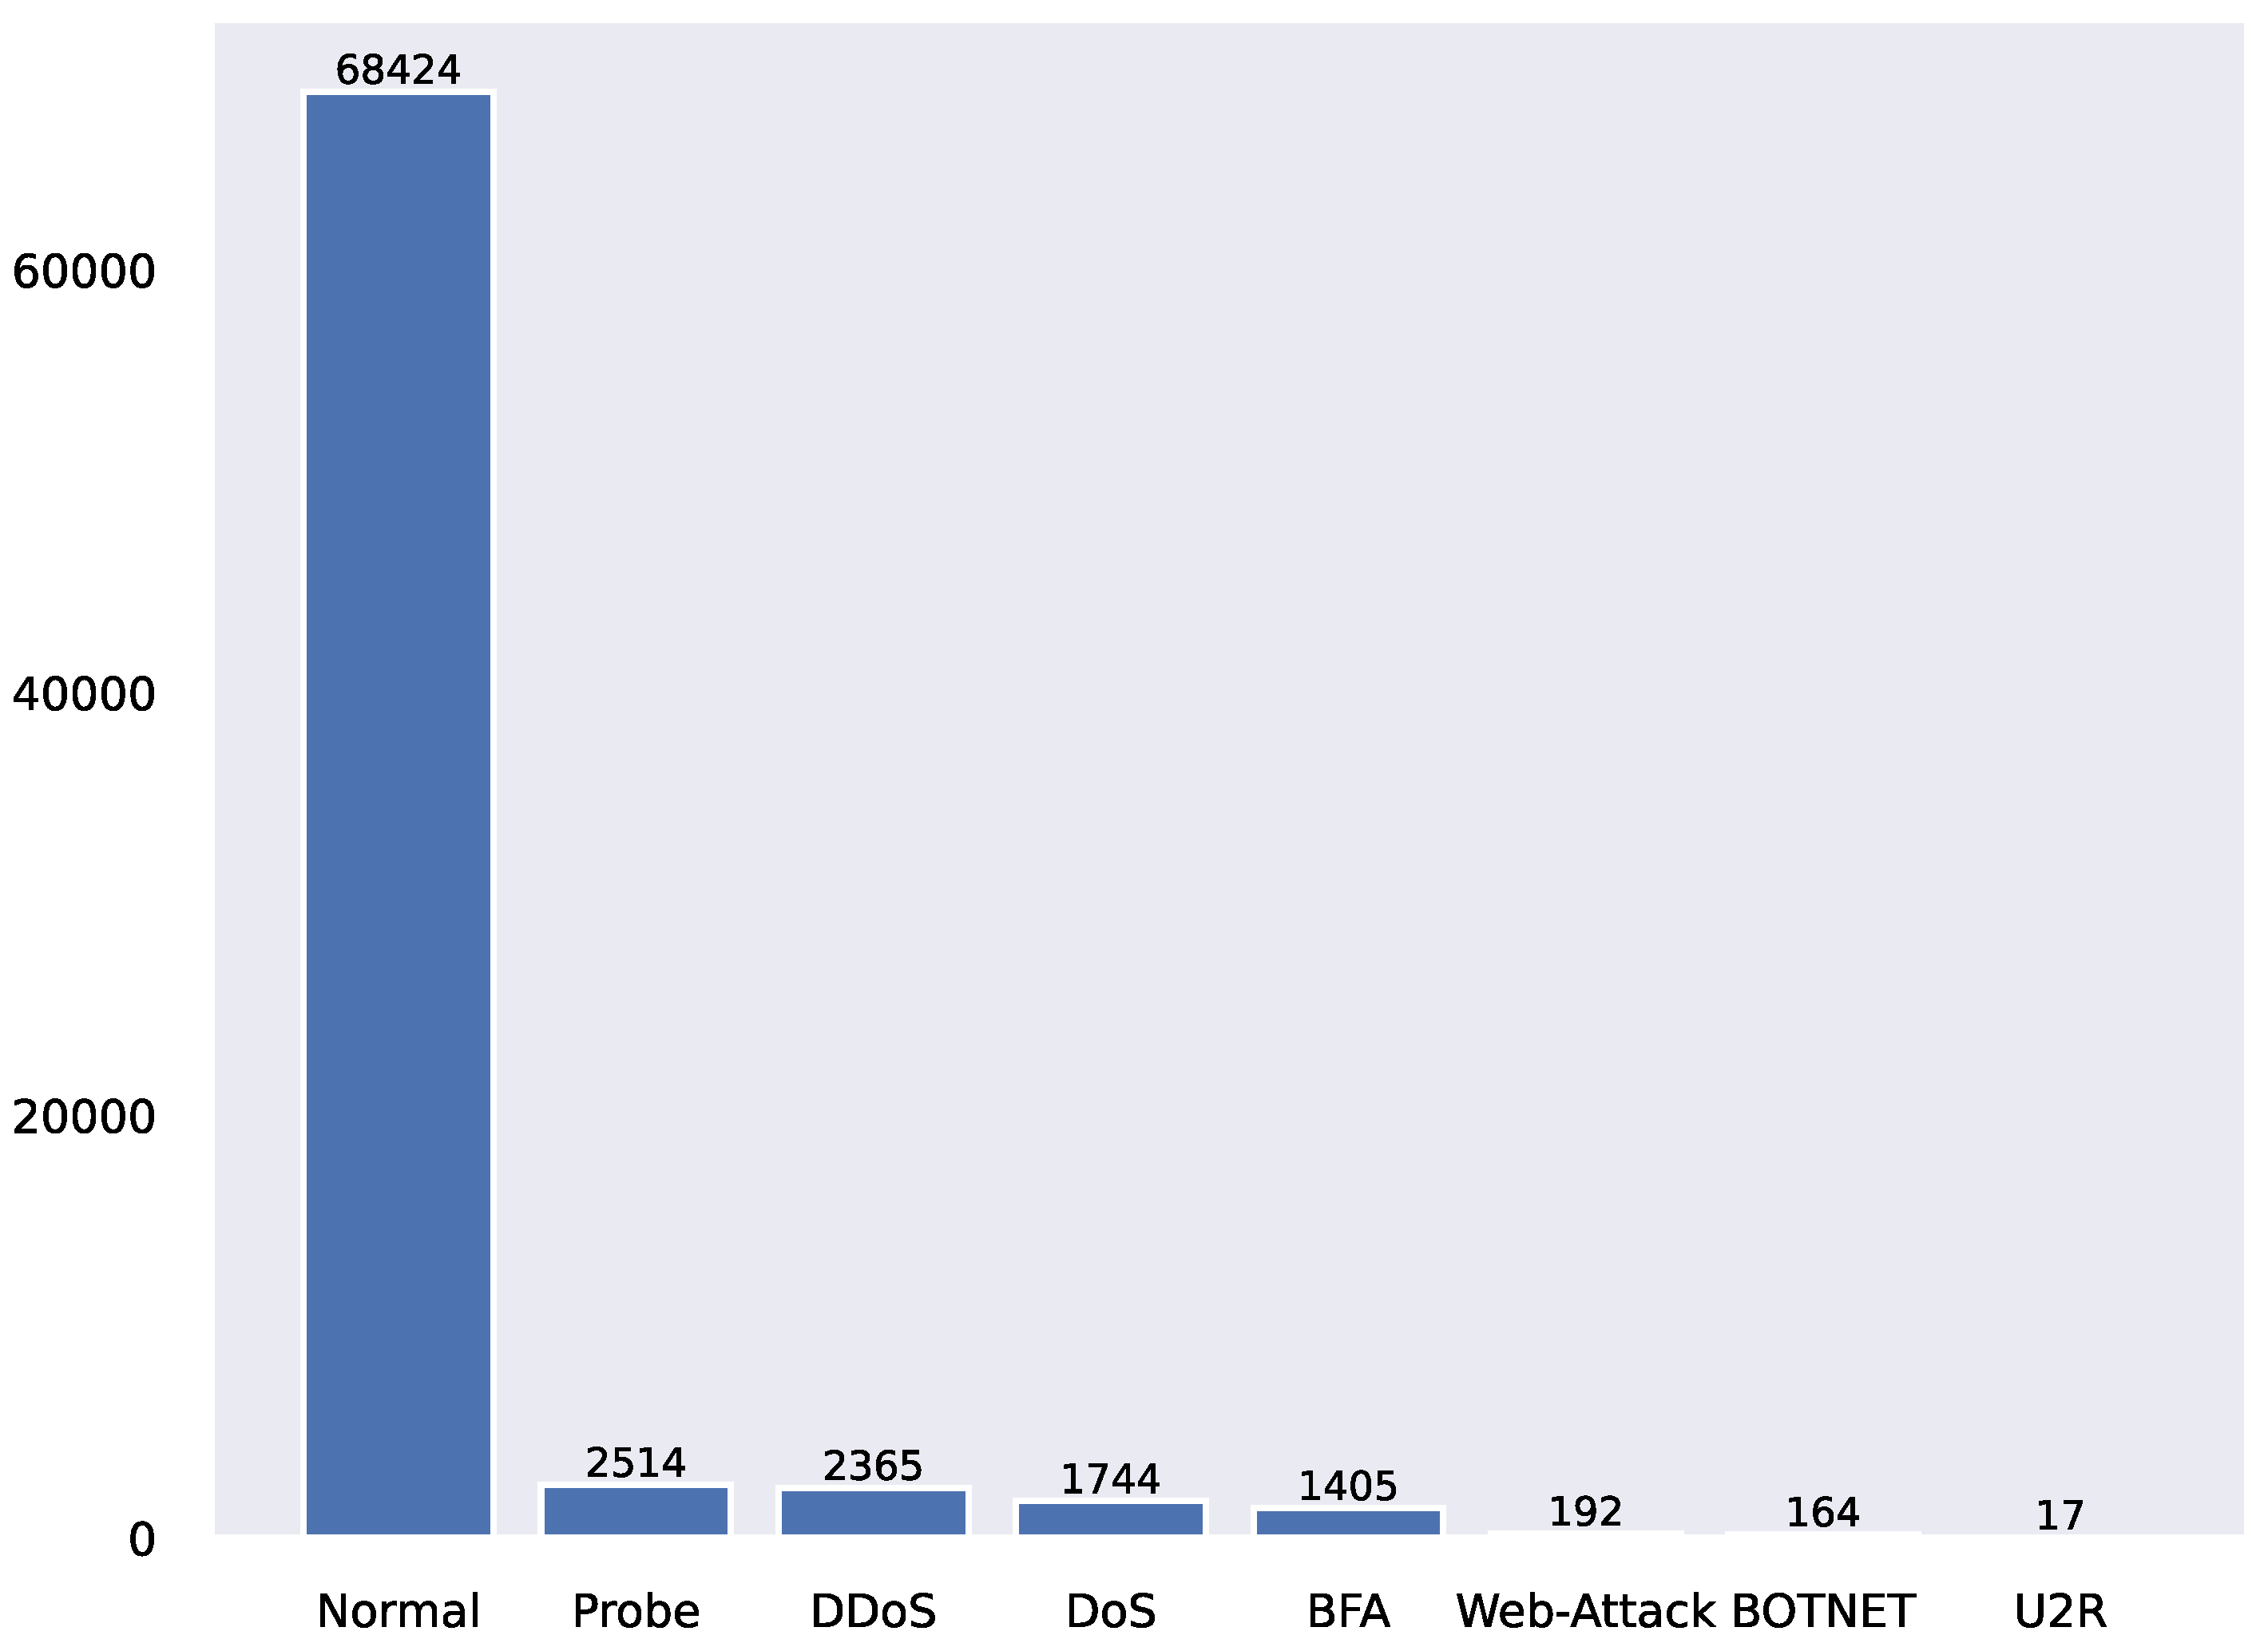
4.1. Experimental Environment and Datasets

The TSMASAM designed in this paper is implemented based on Python3, Pytorch1.2 and Numpy. The four CPU models are Intel(R), Xeon(R), CPU E5-2620 v2 @ and 2.10GHz, the graphics card model is Matrox G200eR2, and the PyTorch version is the 1.2.0 server environment. The InSDN dataset is generated from environment simulations under four virtual machines; the first virtual machine is Kali Linux, which represents the attacker server; the second virtual machine is Ubuntu 16.4, which acts as the ONOS controller; the third Ubuntu 16.4 machine, as a Mininet and OVS switch; the fourth virtual machine is a Metasploitable 2-based Linux machine that serves as an exploit service to demonstrate the exploit. The controller of SDN is implemented using the open source tool ONOS. This dataset contains anomalous traffic from inside and outside attackers targeting the controller.
This paper evaluates the performance of TSMASAM through two experiments. This paper applies the network traffic simulation dataset [31] under the SDN architecture. It is derived from the SDN virtual environment and is constructed by multiple virtual machines using the SDN network architecture. Since the abnormal flow in [31] is much more than normal, the research team randomly selects the flow data to simulate the sample imbalance phenomenon in the real environment. The processed dataset contains 76,825 network traffic, of which 8401 are abnormal, accounting for approximately 10.94% of the overall sample. The research team used the hierarchical set-out method to divide the dataset into the training set and test set, each of which contains a total of 84 traffic eigenvalues. This dataset includes seven network attack types (Probe, DDoS, DoS, BFA, Web-Attack, BOTNET, and U2R). The distribution of each network attack is shown in Figure 4. In this experiment, seven network attack types (Probe, DDoS, DoS, BFA, Web-Attack, BOTNET, and U2R) are regarded as abnormal, and the rest are regarded as normal traffic data.
Figure 4. Label distribution in the dataset.
To verify the generalization ability, not only the InSDN dataset [31] but also the KDD99 and UNSW-NB15 datasets are used in the experiments.

4.2. Evaluation Indicators

There are only two types of anomaly detection targets in this paper. The positive examples are normal data, and the negative ones are abnormal. The classification results of the experiments can be divided into the following four categories:
  • True positives (TP): TP represents the proportion of abnormal behavior correctly identified as abnormal behavior;
  • False positives (FP): FP represents the proportion of normal behavior incorrectly identified as abnormal behavior;
  • False negatives (FN): FN represents the proportion of abnormal behavior incorrectly identified as normal behavior;
  • True negatives (TN): TN represents the proportion of normal behavior correctly identified as normal behavior;
After classifying the results, this paper evaluates the algorithm’s performance by Precision, Recall, and F1-score.
(16) P r e c i s i o n = T P T P + F P ; (17) R e c a l l = T P T P + F N ; (18) F 1 - s c o r e = 2 × P r e c i s i o n × R e c a l l P r e c i s i o n + R e c a l l
among them, precision indicates the rate of correct identification of abnormal behavior and normal behavior. Recall describes how many real positive examples in the test set are selected by the binary classifier. The core idea of the F1-score is that, while improving precision and recall as much as possible, we also want the difference between the two to be as small as possible.

4.3. Performance Testing and Analysis

4.3.1. Performance Testing

The experimental results of detection performance are shown in Table 1 and Table 2, and the model loss curve is shown in Figure 5.
Table 1. Comparative experiment between TSMASAM and the machine learning-based anomaly detection algorithm.
Table 2. Comparative experiment between TSMASAM and the anomaly detection algorithm based on ensemble learning.
Figure 5. The loss curve of the TSMASAM model.
The abscissa represents the epoch number (a total of 200 epochs), and the ordinate represents the loss value of the model. It can be seen from the figure that the loss value of TSMASAM shows a small range of fluctuation in the early training period, and then quickly converges and maintains a low oven for a long time.
The experimental results are shown in Table 1 and Table 2. It can be seen from the table that TSMASAM has a precision of 99.72%, a recall of 99.96%, and an F1-score of 99.84%. (1) Comparing machine learning methods (COPOD, HBOS, IForest, VAE, ECOD, and LOF): on the [31] dataset, the machine learning method can achieve the highest accuracy of 82.19%; the machine learning algorithm can achieve the highest recall rate of 76.30%; the machine learning algorithm can achieve the highest F1 score of 77.92%. (2) Comparing the ensemble learning methods (XGBOD, LSCP, SUOD, and LODA): on the [31] dataset, the highest performance can reach 99.98%. The detection performance of the method proposed in this paper is better than most of the comparison algorithms but weaker than the XGBOD method.
The experimental results of detection performance are analyzed as follows: the traditional machine learning algorithm has limited ability and poor generalization ability, which makes the model’s learning of traffic characteristics too limited. The learning of datasets with long-term associations is not sufficient, so the performance is lower.
Due to the large randomness of traffic, it is difficult to learn suitable feature information. The detection method based on ensemble learning ensures the diversity of weak classifiers and fully considers each base model in decision making so that the results obtained are better than traditional ones. The machine learning method works well.
The method proposed in this paper learns the long-term dependencies between data samples through the self-attention mechanism and convolutional network and transfers them to the ensemble learning model in the form of sample embedding so that the ensemble learning model can more accurately model the process. Therefore, the detection mechanism proposed in this paper is more stable, and the detection effect is not weaker than other integrated learning methods.

4.3.2. Control Group Experiment

Table 3 shows the performance impact of the sample associative learning on TSMASAM. The precision, recall and F1-score of stacking are 0.8059, 0.8893, and 0.8390. The sample associative learning improves TSMASAM by an average of 15.37% on each index.
Table 3. The impact of the Sample Associative Learning on the model.
Table 4 shows the performance of the selected base learners (CNN, LSTM, and LENET) in the ensemble learning model on the [14] dataset. It can be seen from the table that LSTM and LENET have better performance in terms of recall rate, while CNN achieves 99.73% in precision, but the recall rate is 0.34% lower than that of LSTM and LENET. On the other hand, our method achieves an average improvement of 7.28% in F1-score over base learners (CNN, LSTM, and LENET).
Table 4. The performance of the base learner on the dataset.
Table 5 shows the performance of the proposed method on different datasets. Under the KDD99 dataset, our method achieves 99.78% precision, 99.81% recall, and 99.78% F1-score. On the UNSW-NB15 dataset, our method achieves 80.51% precision, 92.93% recall and 86.27% F1-score.
Table 5. TSMASAM performance on other datasets.
Table 6 shows the impact of different base learners on the detection results of our method. In addition, we also show the average computation time of TSMASAM for each traffic datum in the table. From it, we can see that our method achieves the best performance when the Kernel_size of CNN is 5, the number of hidden layers of LSTM is 3, and the number of hidden layers is 128.
Table 6. Ablation experiment.
The analysis of the control group experiment is as follows: introducing a self-attention mechanism in ensemble learning to capture long-term dependencies between data samples can improve the model’s detection performance. After adding the self-attention mechanism, the method in this paper improves the original detection index by 15.37% on average. In the experiments of base learners, our method integrates the detection capabilities of each base learner well. In experiments on different datasets, our method shows good generalization ability and performs well on KDD99 and UNSW-NB15. Since the method in this paper seeks to improve the detection performance, such as introducing a self-attention mechanism, the computational complexity is increased. Therefore, it is not suitable for application scenarios with high response speeds.

5. Conclusions

While SDN technology brings a certain degree of convenience to people, it also brings security risks due to its own design. In order to protect the security of supporting SDN technology, this paper proposes an intrusion detection algorithm, TSMASAM, based on ensemble learning. TSMASAM introduces a self-attention mechanism to capture the correlation between data features to improve the integration effect of the model; TSMASAM achieves the detection and identification of abnormal network traffic by integrating the sample embedding obtained above and the inspection results of the heterogeneous base learner. The purpose is to effectively improve the effect of an integrated detection of abnormal traffic in industrial scenarios using SDN technology.
The dataset used in this paper is generated by simulating the SDN network built in the virtual machine environment, and the traffic data of the controller is collected. Therefore, the model in this paper is mainly oriented to the abnormal traffic detection of the controller in the SDN network. The model proposed in this paper increases the training time and running time to a certain extent in order to consider the influence of the base learner on the model. In the real environment, the intrusion detection algorithm also pays attention to timeliness, so the next step is to study how to maintain the algorithm’s performance while shortening the running time.

Author Contributions

Conceptualization, L.L.; L.K. and J.Z.; methodology, L.L.; software, L.L.; validation, L.L., L.K. and X.Z.; formal analysis, L.L. and Y.R.; investigation, L.L.; resources, L.K.; data curation, L.K.; writing—original draft preparation, L.L.; writing—review and editing, L.K.; visualization, L.L.; supervision, L.K.; project administration, L.K.; funding acquisition, L.K. All authors have read and agreed to the published version of the manuscript.

Funding

This paper was supported by the Key Technology Research and Development Program of the Zhejiang Province under Grant No. 2022C01125, the National Natural Science Foundation of China under Grant No. 62072146.

Institutional Review Board Statement

Not applicable.

Data Availability Statement

Restrictions apply to the availability of these data. Data were obtained from UCD ASEADOS Lab and are available at https://aseados.ucd.ie/?p=177 with the permission of UCD ASEADOS.

Acknowledgments

This work was supported in part by the Key Technology Research and Development Program of the Zhejiang Province under Grant 2022C01125.

Conflicts of Interest

The authors declare no conflict of interest.

References

  1. McKeown, N.; Anderson, T.; Balakrishnan, H.; Parulkar, G.; Peterson, L.; Rexford, J.; Shenker, S.; Turner, J. OpenFlow: Enabling innovation in campus networks. ACM SIGCOMM Comput. Commun. Rev. 2008, 38, 69–74. [Google Scholar] [CrossRef]
  2. Ali, S.T.; Sivaraman, V.; Radford, A.; Jha, S. A Survey of Securing Networks Using Software Defined Networking. IEEE Trans. Reliab. 2015, 64, 1086–1097. [Google Scholar] [CrossRef]
  3. Rawat, D.B.; Reddy, S.R. Software defined networking architecture, security and energy efficiency: A survey. IEEE Commun. Surv. Tutor. 2016, 19, 325–346. [Google Scholar] [CrossRef]
  4. Bian, S.; Zhang, P.; Yan, Z. A survey on software-defined networking security. In Proceedings of the 9th EAI International Conference on Mobile Multimedia Communications, Xi’an, China, 18–20 June 2016; pp. 190–198. [Google Scholar]
  5. Xu, Y.H.; Sun, Z.X. Research Development of Abnormal Traffic Detection in Software Defined Networking. J. Softw. 2020, 31, 25. [Google Scholar]
  6. Scott-Hayward, S.; O’Callaghan, G.; Sezer, S. SDN security: A survey. In Proceedings of the 2013 IEEE SDN for Future Networks and Services (SDN4FNS), Trento, Italy, 11–13 November 2013. [Google Scholar] [CrossRef]
  7. Hinton, G.E.; Osindero, S.; Teh, Y.W. A fast learning algorithm for deep belief nets. Neural Comput. 2006, 18, 1527–1554. [Google Scholar] [CrossRef] [PubMed]
  8. Jackson, K.; DuBois, D.; Stallings, C. An expert system application for network intrusion detection. In Proceedings of the National Computer Security Conference, Washington, DC, USA, 1–4 October 1991. [Google Scholar]
  9. Javitz, H.S.; Valdes, A. The SRI IDES statistical anomaly detector. In Proceedings of the 1991 IEEE Computer Society Symposium on Research in Security and Privacy, Oakland, CA, USA, 20–22 May 1991. [Google Scholar] [CrossRef]
  10. Sekar, R.; Gupta, A.; Frullo, J.; Shanbhag, T.; Tiwari, A.; Yang, H.; Zhou, S. Specification-based anomaly detection: A new approach for detecting network intrusions. In Proceedings of the CCS02: ACM Conference on Computer and Communications Security, Washington, DC, USA, 18–22 November 2002. [Google Scholar]
  11. Bauer, D.S.; Koblentz, M.E. NIDX—An expert system for real-time network intrusion detection. In In Proceedings of the 1988 Computer Networking Symposium, Washington, DC, USA, 11–13 April 1988. [CrossRef]
  12. Sinclair, C.; Pierce, L.; Matzner, S. An application of machine learning to network intrusion detection. In Proceedings of the 15th Annual Computer Security Applications Conference (ACSAC’99), Phoenix, AZ, USA, 6–10 December 1999. [Google Scholar] [CrossRef]
  13. Goldstein, M.; Dengel, A. Histogram-based outlier score (hbos): A fast unsupervised anomaly detection algorithm. In Proceedings of the KI-2012: Poster and Demo Track, Saarbrücken, Germany, 24–27 September 2012. [Google Scholar]
  14. Wang, J.; Paschalidis, I.C. Statistical traffic anomaly detection in time-varying communication networks. IEEE Trans. Control Netw. Syst. 2015, 2, 100–111. [Google Scholar] [CrossRef]
  15. Thottan, M.; Ji, C. Anomaly detection in IP networks. IEEE Trans. Signal Process. 2003, 51, 2191–2204. [Google Scholar] [CrossRef]
  16. Buschkes, R.; Kesdogan, D.; Reichl, P. How to increase security in mobile networks by anomaly detection. In Proceedings of the 14th Annual Computer Security Applications Conference (Cat. No. 98EX217), Phoenix, AZ, USA, 7–11 December 1998. [Google Scholar] [CrossRef]
  17. Sarasamma, S.T.; Zhu, Q.A.; Huff, J. Hierarchical Kohonenen Net for anomaly detection in network security. IEEE Trans. Syst. Man Cybern. Part B Cybern. 2005, 35, 302–312. [Google Scholar] [CrossRef]
  18. Simmross-Wattenberg, F.; Asensio-Pérez, J.I.; Casaseca-De-La-Higuera, P.; Martín-Fernandez, M.; Dimitriadis, I.A.; Alberola-López, C. Anomaly detection in network traffic based on statistical inference and α-stable modeling. IEEE Trans. Dependable Secur. Comput. 2011, 8, 494–509. [Google Scholar] [CrossRef]
  19. Sui, S.; Li, L.; Manikopoulo, C.N. Flow-based Statistical Aggregation Schemes for Network Anomaly Detection. In Proceedings of the 2006 IEEE International Conference on Networking, Sensing and Control, Ft. Lauderdale, FL, USA, 23–25 April 2006. [Google Scholar] [CrossRef]
  20. Nevat, I.; Divakaran, D.M.; Nagarajan, S.G.; Zhang, P.; Su, L.; Ko, L.L.; Thing, V.L. Anomaly detection and attribution in networks with temporally correlated traffic. IEEE/ACM Trans. Netw. 2018, 26, 131–144. [Google Scholar] [CrossRef]
  21. Qu, D.; Vetter, B.M.; Wang, F.; Narayan, R.; Wu, S.F.; Jou, Y.F.; Gong, F.; Sargor, C. Statistical anomaly detection for link-state routing protocols. In Proceedings of the Sixth International Conference on Network Protocols (Cat. No. 98TB100256), Austin, TX, USA, 13–16 October 1998. [Google Scholar] [CrossRef]
  22. Soule, A.; Salamatian, K.; Taft, N. Combining filtering and statistical methods for anomaly detection. In Proceedings of the 5th ACM SIGCOMM Conference on Internet Measurement, Berkeley, CA, USA, 19–21 October 2005. [Google Scholar] [CrossRef]
  23. Li, Z.; Zhao, Y.; Botta, N.; Ionescu, C.; Hu, X. COPOD: Copula-based outlier detection. arXiv 2020, arXiv:2009.09463. [Google Scholar]
  24. Maimo, L.F.; Gomez, A.L.P.; Clemente, F.J.G.; Perez, M.G.; Perez, G.M. A Self-Adaptive Deep Learning-Based System for Anomaly Detection in 5G Networks. IEEE Access 2018, 6, 7700–7712. [Google Scholar] [CrossRef]
  25. Van, N.T.; Thinh, T.N.; Sach, L.T. An anomaly-based network intrusion detection system using Deep learning. In Proceedings of the 2017 International Conference on System Science and Engineering (ICSSE), Ho Chi Minh City, Vietnam, 21–23 July 2017. [Google Scholar] [CrossRef]
  26. Garg, S.; Kaur, K.; Kumar, N.; Kaddoum, G.; Zomaya, A.Y.; Ranjan, R. A hybrid deep learning-based model for anomaly detection in cloud datacenter networks. IEEE Trans. Netw. Serv. Manag. 2019, 16, 924–935. [Google Scholar] [CrossRef]
  27. Tang, T.A.; Mhamdi, L.; McLernon, D.; Zaidi, S.A.R.; Ghogho, M. Deep learning approach for Network Intrusion Detection in Software Defined Networking. In Proceedings of the 2016 International Conference on Wireless Networks and Mobile Communications (WINCOM), Fez, Morocco, 26–29 October 2016. [Google Scholar] [CrossRef]
  28. Garg, S.; Kaur, K.; Kumar, N.; Rodrigues, J.J. Hybrid deep-learning-based anomaly detection scheme for suspicious flow detection in SDN: A social multimedia perspective. IEEE Trans. Multimed. 2019, 21, 566–578. [Google Scholar] [CrossRef]
  29. Yang, L.; Song, Y.; Gao, S.; Xiao, B.; Hu, A. Griffin: An Ensemble of AutoEncoders for Anomaly Traffic Detection in SDN. In Proceedings of the GLOBECOM 2020—2020 IEEE Global Communications Conference, Taipei, Taiwan, 7–11 December 2020. [Google Scholar] [CrossRef]
  30. Ujjan, R.M.A.; Pervez, Z.; Dahal, K.; Bashir, A.K.; Mumtaz, R.; González, J. Towards sFlow and adaptive polling sampling for deep learning based DDoS detection in SDN. Future Gener. Comput. Syst. 2020, 111, 763–779. [Google Scholar] [CrossRef]
  31. Elsayed, M.S.; Le-Khac, N.A.; Jurcut, A.D. InSDN: A novel SDN intrusion dataset. IEEE Access 2020, 8, 165263–165284. [Google Scholar] [CrossRef]
Publisher’s Note: MDPI stays neutral with regard to jurisdictional claims in published maps and institutional affiliations.

Article Metrics

Citations

Article Access Statistics

Multiple requests from the same IP address are counted as one view.