Article

Automated Detection of Sleep Apnea-Hypopnea Events Based on 60 GHz Frequency-Modulated Continuous-Wave Radar Using Convolutional Recurrent Neural Networks: A Preliminary Report of a Prospective Cohort Study

1
Department of Radiology, Armed Forces Yangju Hospital, Yangju 11429, Korea
2
Department of Radiology, Seoul Metropolitan Government—Seoul National University Boramae Medical Center, Seoul National University College of Medicine, Seoul 07061, Korea
3
Department of Neurology, Seoul Metropolitan Government—Seoul National University Boramae Medical Center, Seoul National University College of Medicine, Seoul 07061, Korea
4
Department of Otorhinolaryngology-Head and Neck Surgery, Seoul Metropolitan Government—Seoul National University Boramae Medical Center, Seoul National University College of Medicine, Seoul 07061, Korea
5
AU Inc., Daejeon 34141, Korea
*
Authors to whom correspondence should be addressed.
Sensors 2022, 22(19), 7177; https://doi.org/10.3390/s22197177
Submission received: 19 August 2022 / Revised: 12 September 2022 / Accepted: 20 September 2022 / Published: 21 September 2022
(This article belongs to the Special Issue Sensors in Sleep Monitoring)

Abstract

:
Radar is a promising non-contact sensor for overnight polysomnography (PSG), the gold standard for diagnosing obstructive sleep apnea (OSA). This preliminary study aimed to demonstrate the feasibility of the automated detection of apnea-hypopnea events for OSA diagnosis based on 60 GHz frequency-modulated continuous-wave radar using convolutional recurrent neural networks. The dataset comprised 44 participants from an ongoing OSA cohort, recruited from July 2021 to April 2022, who underwent overnight PSG with a radar sensor. All PSG recordings, including sleep and wakefulness, were included in the dataset. Model development and evaluation were based on a five-fold cross-validation. The area under the receiver operating characteristic curve for the classification of 1-min segments ranged from 0.796 to 0.859. Depending on OSA severity, the sensitivities for apnea-hypopnea events were 49.0–67.6%, and the number of false-positive detections per participant was 23.4–52.8. The estimated apnea-hypopnea index showed strong correlations (Pearson correlation coefficient = 0.805–0.949) and good to excellent agreement (intraclass correlation coefficient = 0.776–0.929) with the ground truth. There was substantial agreement between the estimated and ground truth OSA severity (kappa statistics = 0.648–0.736). The results demonstrate the potential of radar as a standalone screening tool for OSA.

1. Introduction

Obstructive sleep apnea (OSA) is the most common type of sleep-disordered breathing, characterized by the recurrent cessation of breathing during sleep due to complete or partial obstruction of the upper airway [1]. Repetitive episodes of hypopnea and apnea can result in sleep disruption and the alteration of neural activity due to intermittent hypoxemia, hypercapnia, microarousals, and fragmented sleep [2]. OSA is associated with an elevated risk of hypertension, stroke, and type 2 diabetes mellitus [3]. In addition, cognitive dysfunction, cardiovascular and cerebrovascular diseases, and increased mortality are highly prevalent in OSA patients [4,5]. Polysomnography (PSG) is the gold standard for diagnosing OSA [6]. However, PSG requires a specialized facility with trained technicians and various sensors directly attached to the patient’s body, which causes inconvenience and possibly affects sleep behavior [7]. The “first-night effect,” which has been considered a result of sleeping in the unfamiliar circumstance of a sleep laboratory, is one of the limitations of PSG [8]. In addition, because PSG innately evaluates only one or a few nights, it is inadequate for long-term monitoring and screening [9]. In this context, there has been an increasing interest in developing sensors from various sources with less or no contact, such as cameras, ballistocardiography, sound, and radar [10,11,12].
A radar is a non-contact detection system that processes radio waves transmitted to and reflected by a target. In the medical field, radar sensors typically analyze the modulation effect caused by body movements and have thus been developed for monitoring vital signs and limb movements [13,14]. Respiratory effort, which is conventionally measured with thoracoabdominal belts in PSG, can be detected using radar by targeting chest wall movements [15,16,17]. Compared with other non-contact sensors, radars can detect respiratory efforts at longer distances of up to 30 m, even in the presence of non-metal materials between the radar and the subject, making them more applicable to sleep environments [17]. There are different types of radar according to the type of transmitted signal, such as impulse radio ultra-wideband (IR-UWB) radar and frequency-modulated continuous-wave (FMCW) radar [13]. The present study utilizes an FMCW radar.
Previous studies have investigated radar-measured respiratory signals for diagnosing OSA using various interpretation methods, including manual reading [18], amplitude thresholding [19,20], and classical machine learning with handcrafted features [21,22,23]. However, these methods often rely on explicit rules and prior domain knowledge, making them less robust to dynamic and noisy real-world data [24]. In this regard, deep learning, a subset of machine learning and artificial intelligence, which has shown great success in medical imaging [25] and biosignals [26], is a promising alternative. However, deep learning studies on radar-based OSA diagnosis are rare, especially regarding FMCW radar.
Therefore, this study aimed to demonstrate the feasibility of applying deep learning to FMCW radar data for detecting sleep apnea-hypopnea events as a preliminary study of an ongoing prospective OSA cohort using an in-development radar. The main differences of this study compared to previous deep learning methods for OSA diagnosis are as follows: (1) we used a detection model with dense predictions instead of classification models, (2) we conducted an event-oriented and patient-oriented performance evaluation as well as segment analysis, and (3) we included the entire PSG recording without excluding waking hours. In particular, our deep learning method was based on a convolutional recurrent neural network (CRNN), which was first proposed for scene text recognition [27] and has also been used for sound event detection [28].

2. Materials and Methods

2.1. Study Participants

This study included participants from an ongoing prospective cohort study approved by the Institutional Review Board of the Boramae Medical Center of Seoul National University (IRB No. 10-2021-16) and was performed in accordance with the principles of the Declaration of Helsinki. All the participants provided written informed consent.
Participants were recruited from adults with chief complaints of sleep-disordered breathing, referred to the Boramae Medical Center of Seoul National University. The symptoms of sleep-disordered breathing include snoring, shortness of breath, and witnessed apnea during sleep. Participants with major medical conditions in the pulmonary, cardiovascular, or cerebrovascular systems were excluded. All enrolled participants completed sleep questionnaires and overnight PSG, and clinical information, including detailed sleep history, medical history, and body mass index, was obtained.

2.2. Sleep Questionnaires and Polysomnography
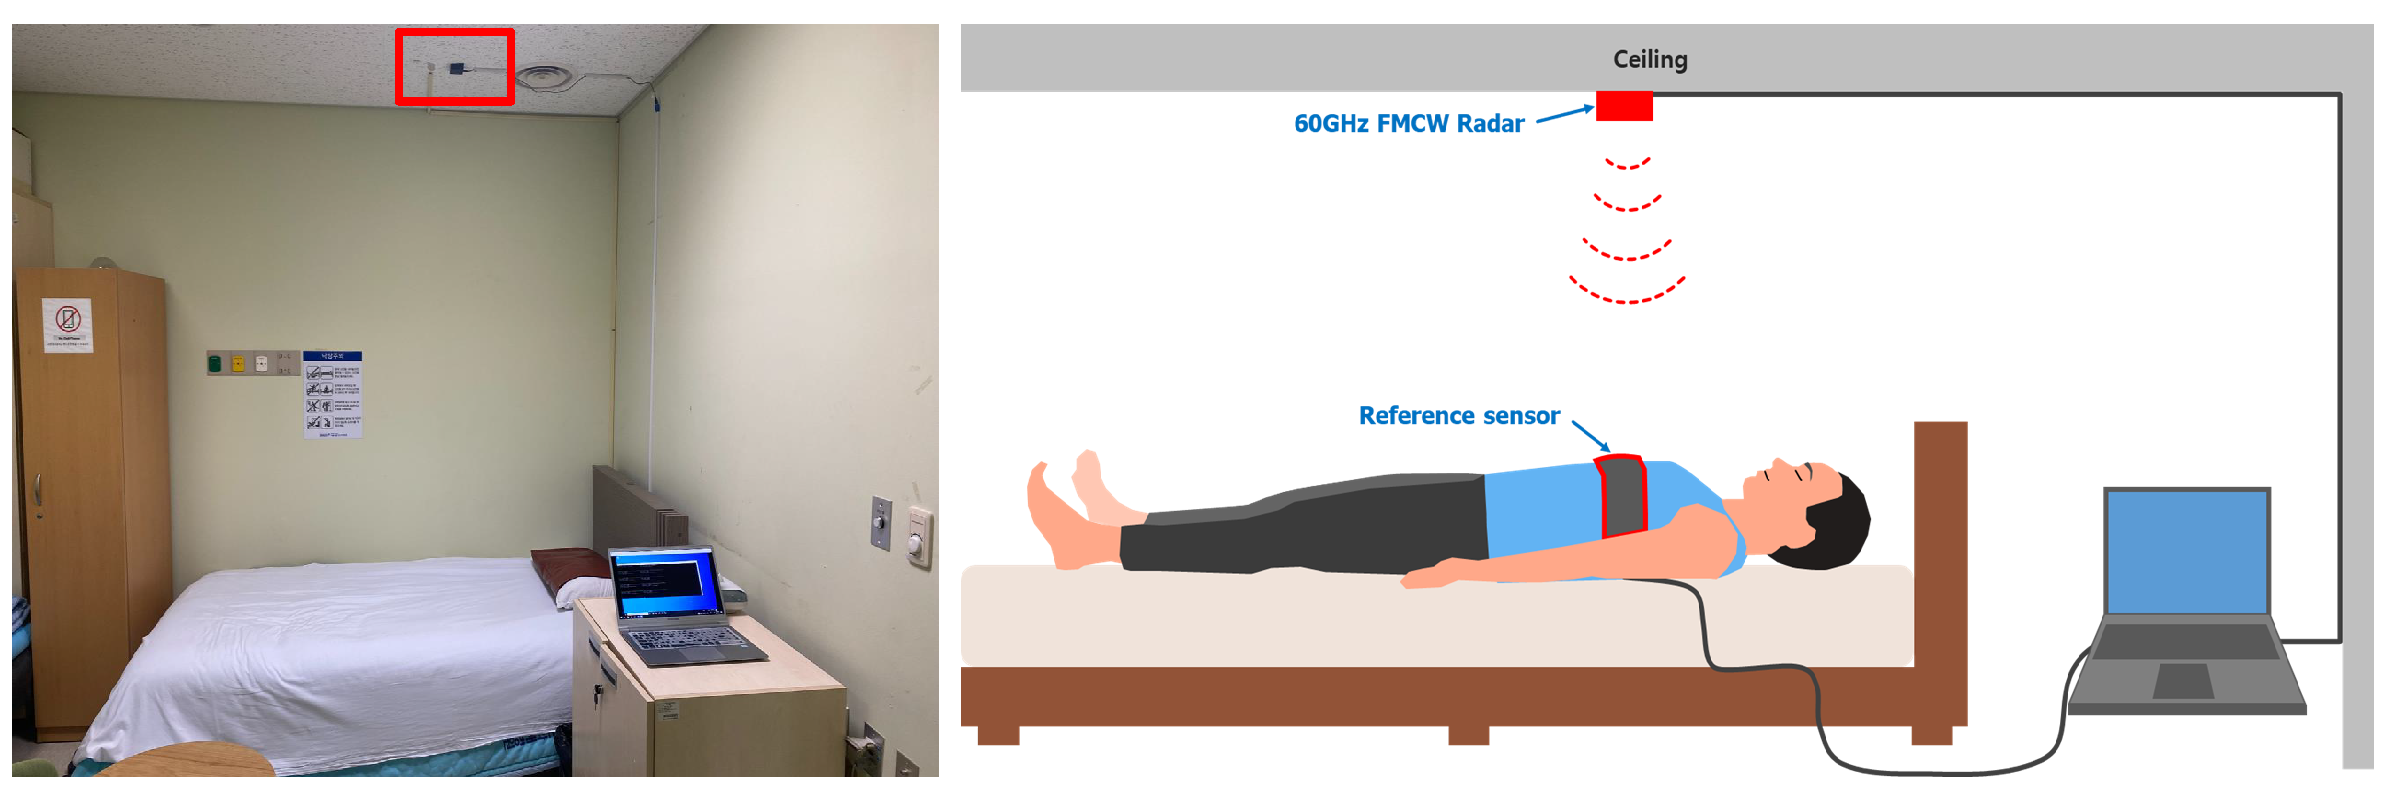
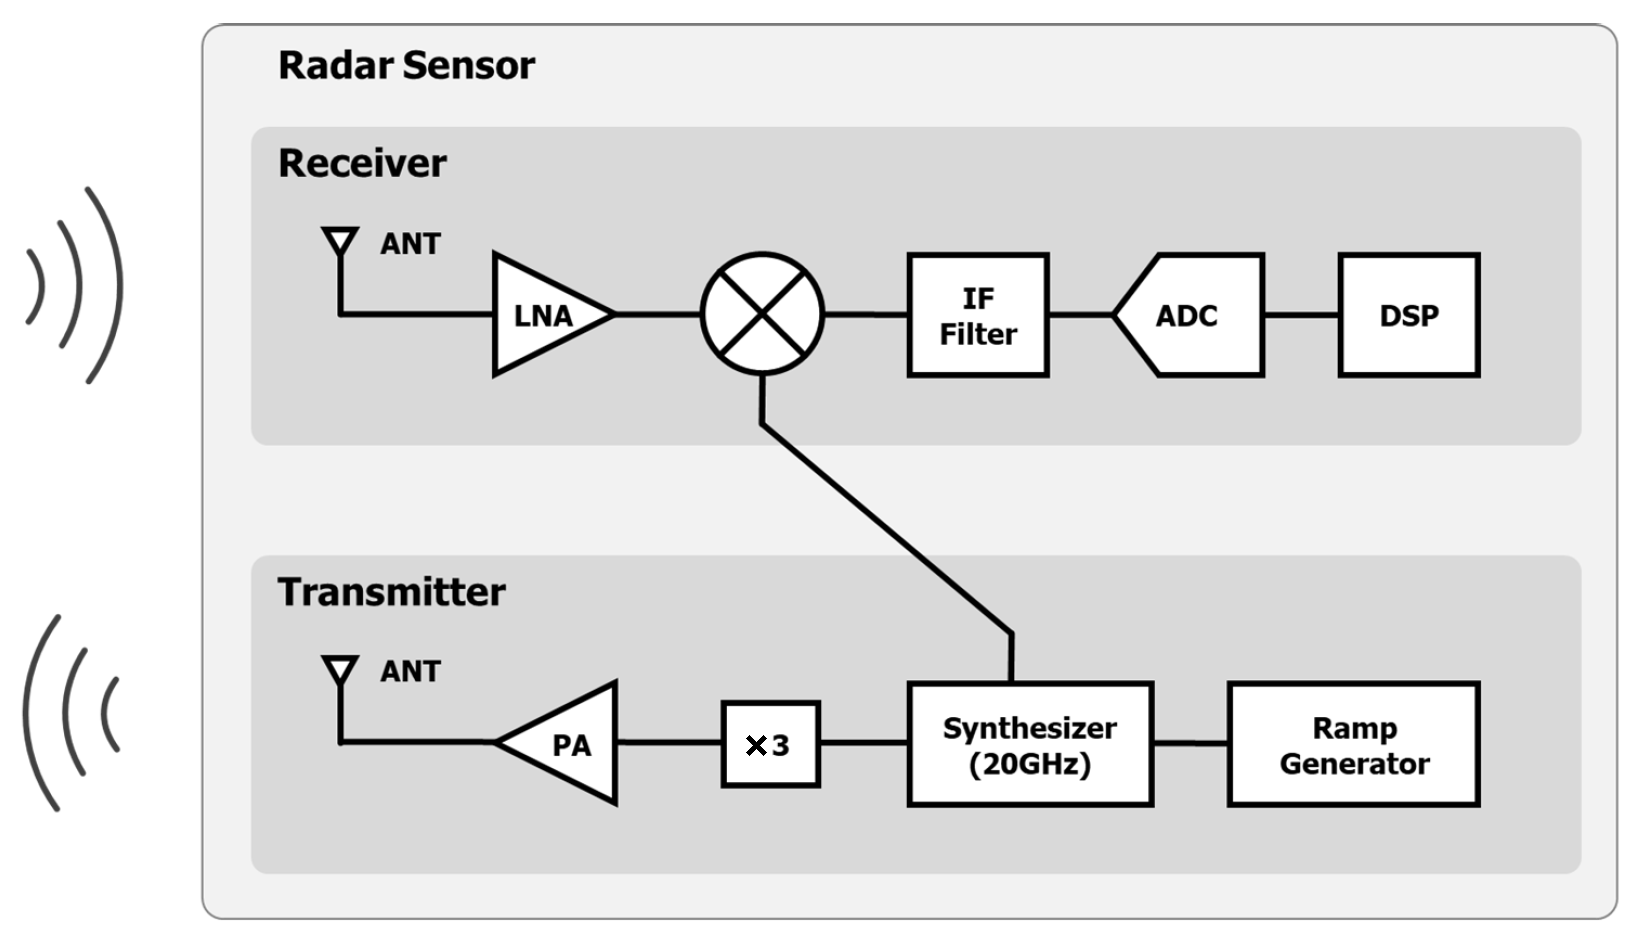
The participants were instructed not to drink alcohol or caffeinated beverages and to sleep and wake up at regular hours for a week before the study. Subjective daytime sleepiness was scored using the Epworth Sleepiness Scale [29] and the Stanford Sleepiness Scale [30]. Sleep quality and disturbances during the month prior to the study were evaluated using the Pittsburgh Sleep Quality Index [31]. The PSG recording was conducted with Twin-PSG software (Natus Neurology Incorporated, West Warwick, RI, USA) using a standard PSG routine with the addition of the radar sensor. The recordings of bioelectrical potentials included a 6-channel electroencephalogram, a 4-channel electrooculogram, an electromyogram, and an electrocardiogram. A thermistor, a nasal air pressure monitoring sensor, an oximeter, piezoelectric bands, and a body position sensor were also applied to the patients. PSG data, including sleep parameters and respiratory events, were scored according to the American Academy of Sleep Medicine (AASM) manual [32]. Apnea was defined as a ≥90% reduction in airflow lasting at least 10 s. Apnea was further classified as central or obstructive if inspiratory effort was absent or present, respectively, throughout the entire period of absent airflow. Hypopnea was defined as a ≥30% reduction in airflow lasting for at least 10 s and was associated with either a ≥3% oxygen desaturation or arousal. The apnea-hypopnea index (AHI) was defined as the number of apnea-hypopnea events divided by the total sleep time (hours) in the PSG scoring data. The severity of OSA was classified into four categories based on AHI: normal (AHI < 5), mild (5 ≤ AHI < 15), moderate (15 ≤ AHI < 30), and severe (AHI ≥ 30).

2.3. Radar Setup

A FMCW radar sensor (AU Inc., Daejeon, Korea) was placed 2 m from the patient’s chest on the ceiling of the sleep laboratory (Figure 1). The architecture of the radar sensor is illustrated in Figure 2. The general principles of radar signal acquisition are provided in the Supplementary Materials.
Figure 3 shows the overall flow of how the respiratory signals were extracted from the raw radar signals. First, the distance to the target was determined by applying a fast Fourier transform to the ADC samples. Then, to remove high-frequency noise, chirp-to-chirp variation signals at the target distance were filtered using a low-pass filter. Finally, the respiratory signals were demodulated from the filtered signals.
Most previous studies [33] used the phase demodulation method to extract respiration signals. The phase demodulation method suffers from the in-phase and quadrature (IQ) mismatch issues. The IQ mismatch changes the center coordinate of the trajectory, which is caused by respiration. In this study, we used the cumulative amplitude of a vector by subtracting two vectors in a complex domain for a unit of time, which corresponds to the time difference between chirps. Because our demodulation method considers the difference between the two vectors, the IQ mismatch effect can be suppressed [34]. Figure 4 shows the demodulation method. Respiratory signals in the complex domain are shown in Figure 4a. The respiratory signals were obtained by integrating the amplitudes of the vectors whose signs were determined by the direction. Figure 4b shows the demodulated respiratory signals.

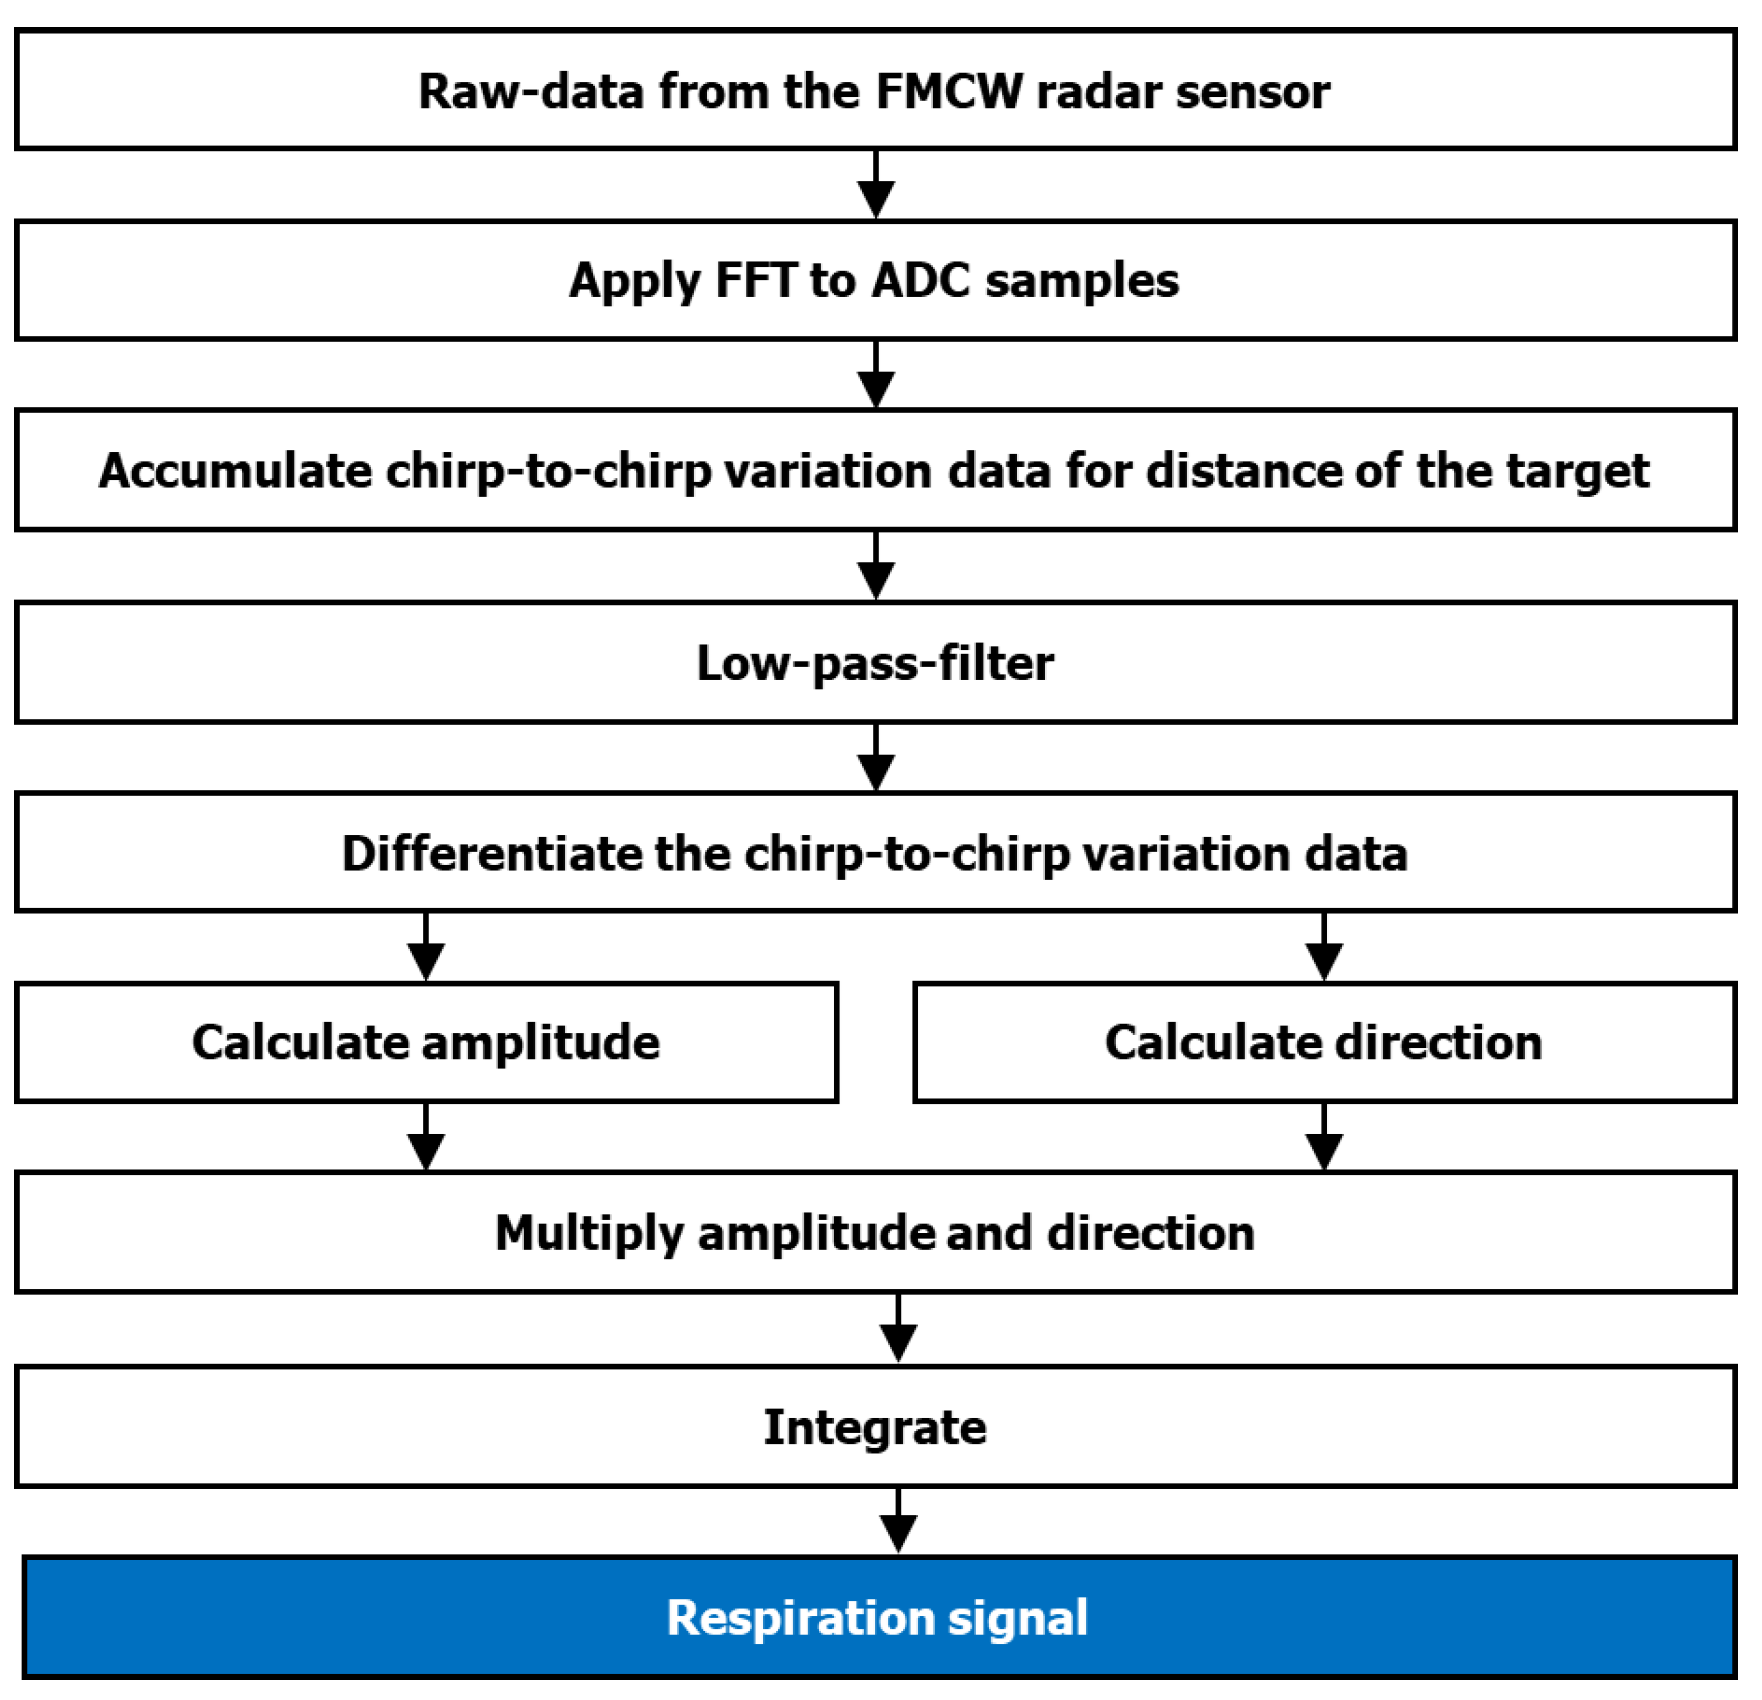
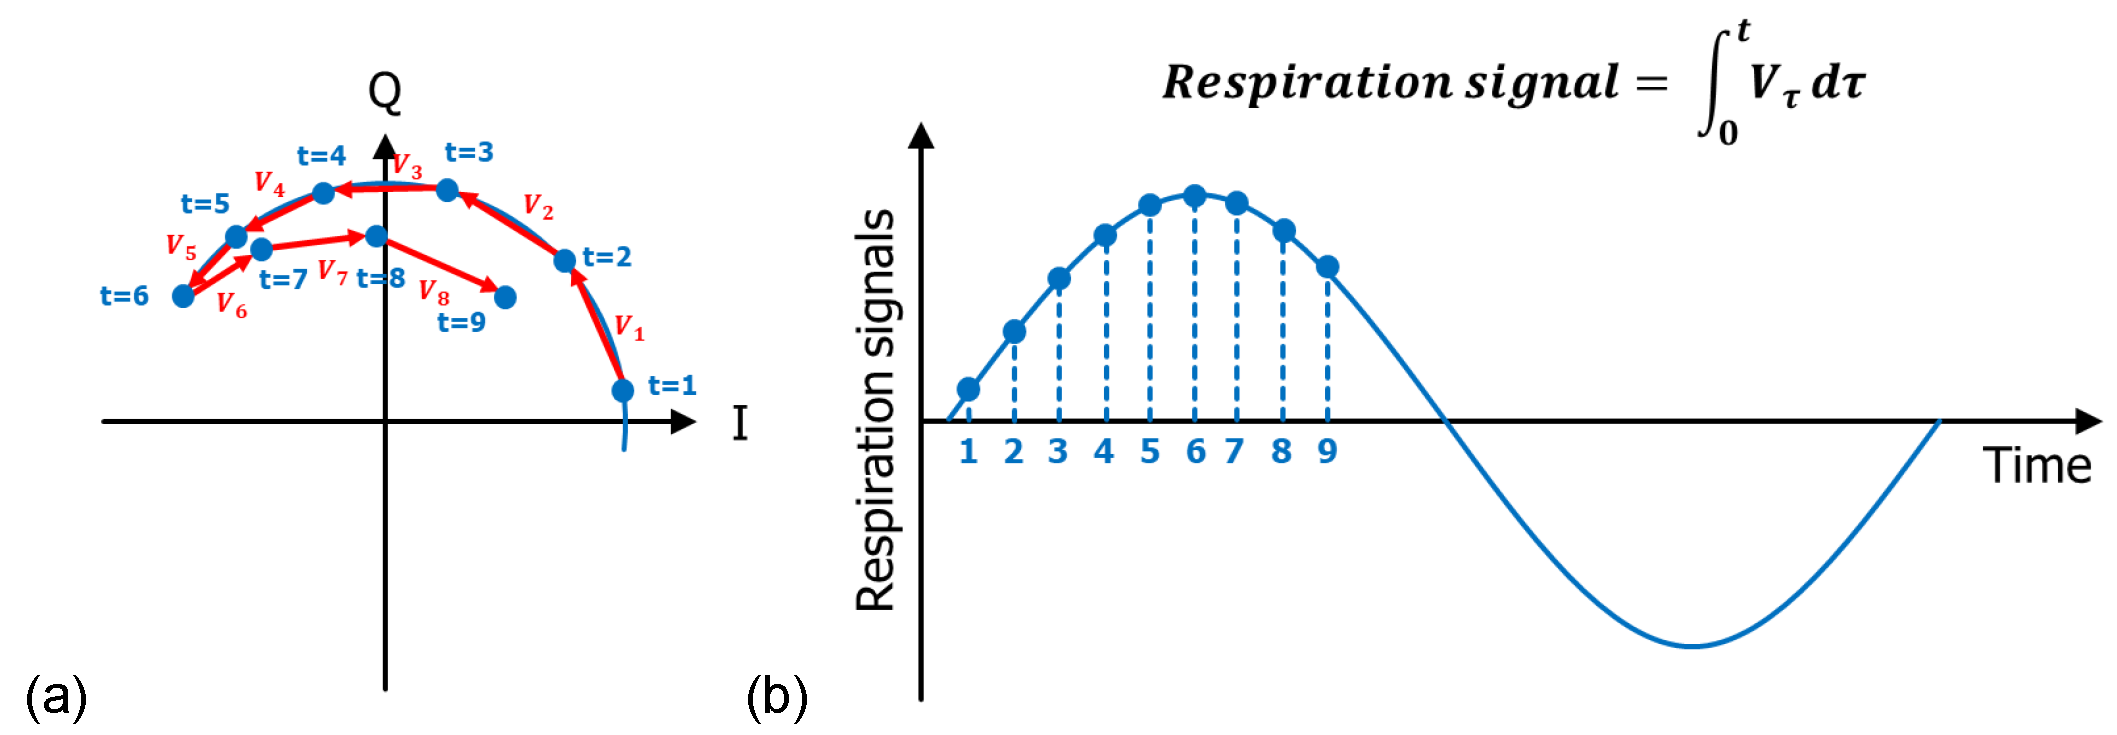
2.4. Data Preparation and Preprocessing

A full-night radar recording was obtained regardless of sleep stages to emulate a real-world application, as the radar alone cannot distinguish the sleep status. The respiratory signals acquired from the radar were preprocessed using minimal signal-processing methods. The respiratory signals were first downsampled from the original 1000/33 Hz sampling frequency to 8 Hz using Fourier transformation. Next, the radar data were segmented into 1-min segments with a stride of 30 s. A segment-wise z-score normalization was then performed based on the mean and standard deviation of the signal values. Event labels were annotated with 1-s temporal resolution according to the reference PSG. Each segment was considered abnormal if it was labeled apnea or hypopnea for at least 10 consecutive seconds.

2.5. Model Development

A five-fold cross-validation was performed for model development and evaluation. First, the study population was randomly split into five groups. In each fold, the signal segments obtained from patients in the four subgroups served as the training set, and those from the remaining patients served as the validation set. In addition, two types of models were prepared: binary and multiclass. The apnea-hypopnea events were considered as a single abnormal class for the binary model and separated for the multiclass model.
Inspired by SELDnet [28] for sound event localization and detection, a detection model with a CRNN architecture composed of convolutional neural networks (CNNs), recurrent neural networks (RNNs), and fully connected (FC) components was employed. The CNN component consisted of four convolutional blocks. Each block was implemented as a stack of two sets of 1-D convolution, batch normalization, and rectified linear unit (ReLU) layers, followed by a max-pooling layer and dropout layer. All convolutional layers had 64 filters with a kernel size of 3 and a stride of 1. The max-pooling layers had a stride length of 2 except for the last block, which had a stride length of 1. The RNN component was a bidirectional long short-term memory (LSTM) layer with 128 units. The FC component consisted of an FC layer with 128 filters, a ReLU layer, a dropout layer, and a final FC layer with the same number of filters as the number of classes. All the dropout layers in the CRNN had a dropout rate of 0.2.
The sum of cross-entropy and Dice loss was used as the training objective adopted from medical image segmentation tasks [35] and a batch size of 64. The Adam optimizer [36] with an initial learning rate of 0.001 was used, which was reduced by half if the validation loss did not improve for 10 epochs. The maximum number of training epochs was set to 100, and early stopping was applied if the validation loss did not improve for 25 epochs. The model development was implemented using Keras (version 2.8.0; https://keras.io/) with a Tensorflow (version 2.8.0; Google LLC, Mountain View, CA, USA) backend on a workstation with an NVIDIA GeForce RTX 3080 GPU (Nvidia, Santa Clara, CA, USA) and 31 GB RAM.

2.6. Performance Evaluation

The performance evaluation was based on gathering inference results from the validation sets from each fold in the cross validation. Following the clinical significance of AHI, all apnea-hypopnea events were considered as a single abnormal class, and model predictions for each time point were calculated as 1 p r o b a b i l i t y f o r c l a s s N o r m a l for both binary and multiclass models. Performance evaluation was conducted in three ways: per-segment classification, global event detection, and AHI estimation.
First, a receiver operating characteristic (ROC) curve was obtained for per-segment binary classification. Consistent with the ground truth labeling, the predicted probability of each 1-min segment was defined as the minimum threshold that yielded 10 consecutive seconds with above-threshold predictions. From the ROC curve, the area under the ROC curve (AUROC) was computed, along with 95% confidence intervals (CI) using the Delong method [37]. In addition, the optimal cut-off point yielding the maximum value of the Youden index [38] was obtained from the ROC curve. Based on the optimal cutoff point, the sensitivity, specificity, positive predictive value (PPV), negative predictive value (NPV), and accuracy were calculated.
In addition to the per-segment evaluation, the global event detection performance was assessed by computing the abnormal respiratory event detection sensitivity and false-positive detections per participant. The predictions from a patient’s full-night PSG were first aggregated as averages of prediction probabilities from two adjacent overlapping segments, because the segments were 1-min long with intervals of 30 s. Estimated abnormal respiratory events were defined as consecutive above-threshold predictions of at least 10 s and determined true-positive or false-positive at an intersection over union (IoU) threshold of 0.5 compared with the ground truth. The optimal cutoff point yielding the highest F1 measure, defined as the harmonic mean between precision and recall, was used to obtain the results [39]. Based on the optimal cut-off point, sensitivity, PPV, and false-positive detections per patient were calculated. In addition, since sleep status was not accounted for in the predictions, the estimated abnormal respiratory events were further categorized depending on whether they occurred during sleep or wakefulness. To this end, in-sleep estimated events were defined as events in which the patient was asleep for more than half of the event time.
Moreover, AHI was calculated as the number of estimated abnormal respiratory events divided by total sleep time and OSA severity and was estimated in line with the standard PSG scoring system [32]. Similarly, the corrected estimated AHI and OSA severity was calculated based on the number of in-sleep estimated abnormal respiratory events. The estimated AHIs were compared with ground truths using the Pearson correlation coefficient (r), intraclass correlation coefficient (ICC), and Bland–Altman analysis. The estimated OSA severities were compared with the ground truths using linear weighted kappa statistics ( κ ). The AHI estimation results were based on the same binarization thresholds used for event detection evaluation.

3. Results

3.1. Study Participants

Initially, 55 participants were enrolled in the study from July 2021 to April 2022. Among them, 11 were excluded from the study for the following reasons: withdrawal of consent (n = 9) and accidental failure to execute the radar data collection program (n = 2). Therefore, 44 participants underwent PSG integration using the FMCW radar sensor. Among them, there were nine normal participants, and the numbers of patients with mild, moderate, and severe OSA were 7, 15, and 13, respectively. The baseline demographic and sleep characteristics of the study population are presented in Table 1.

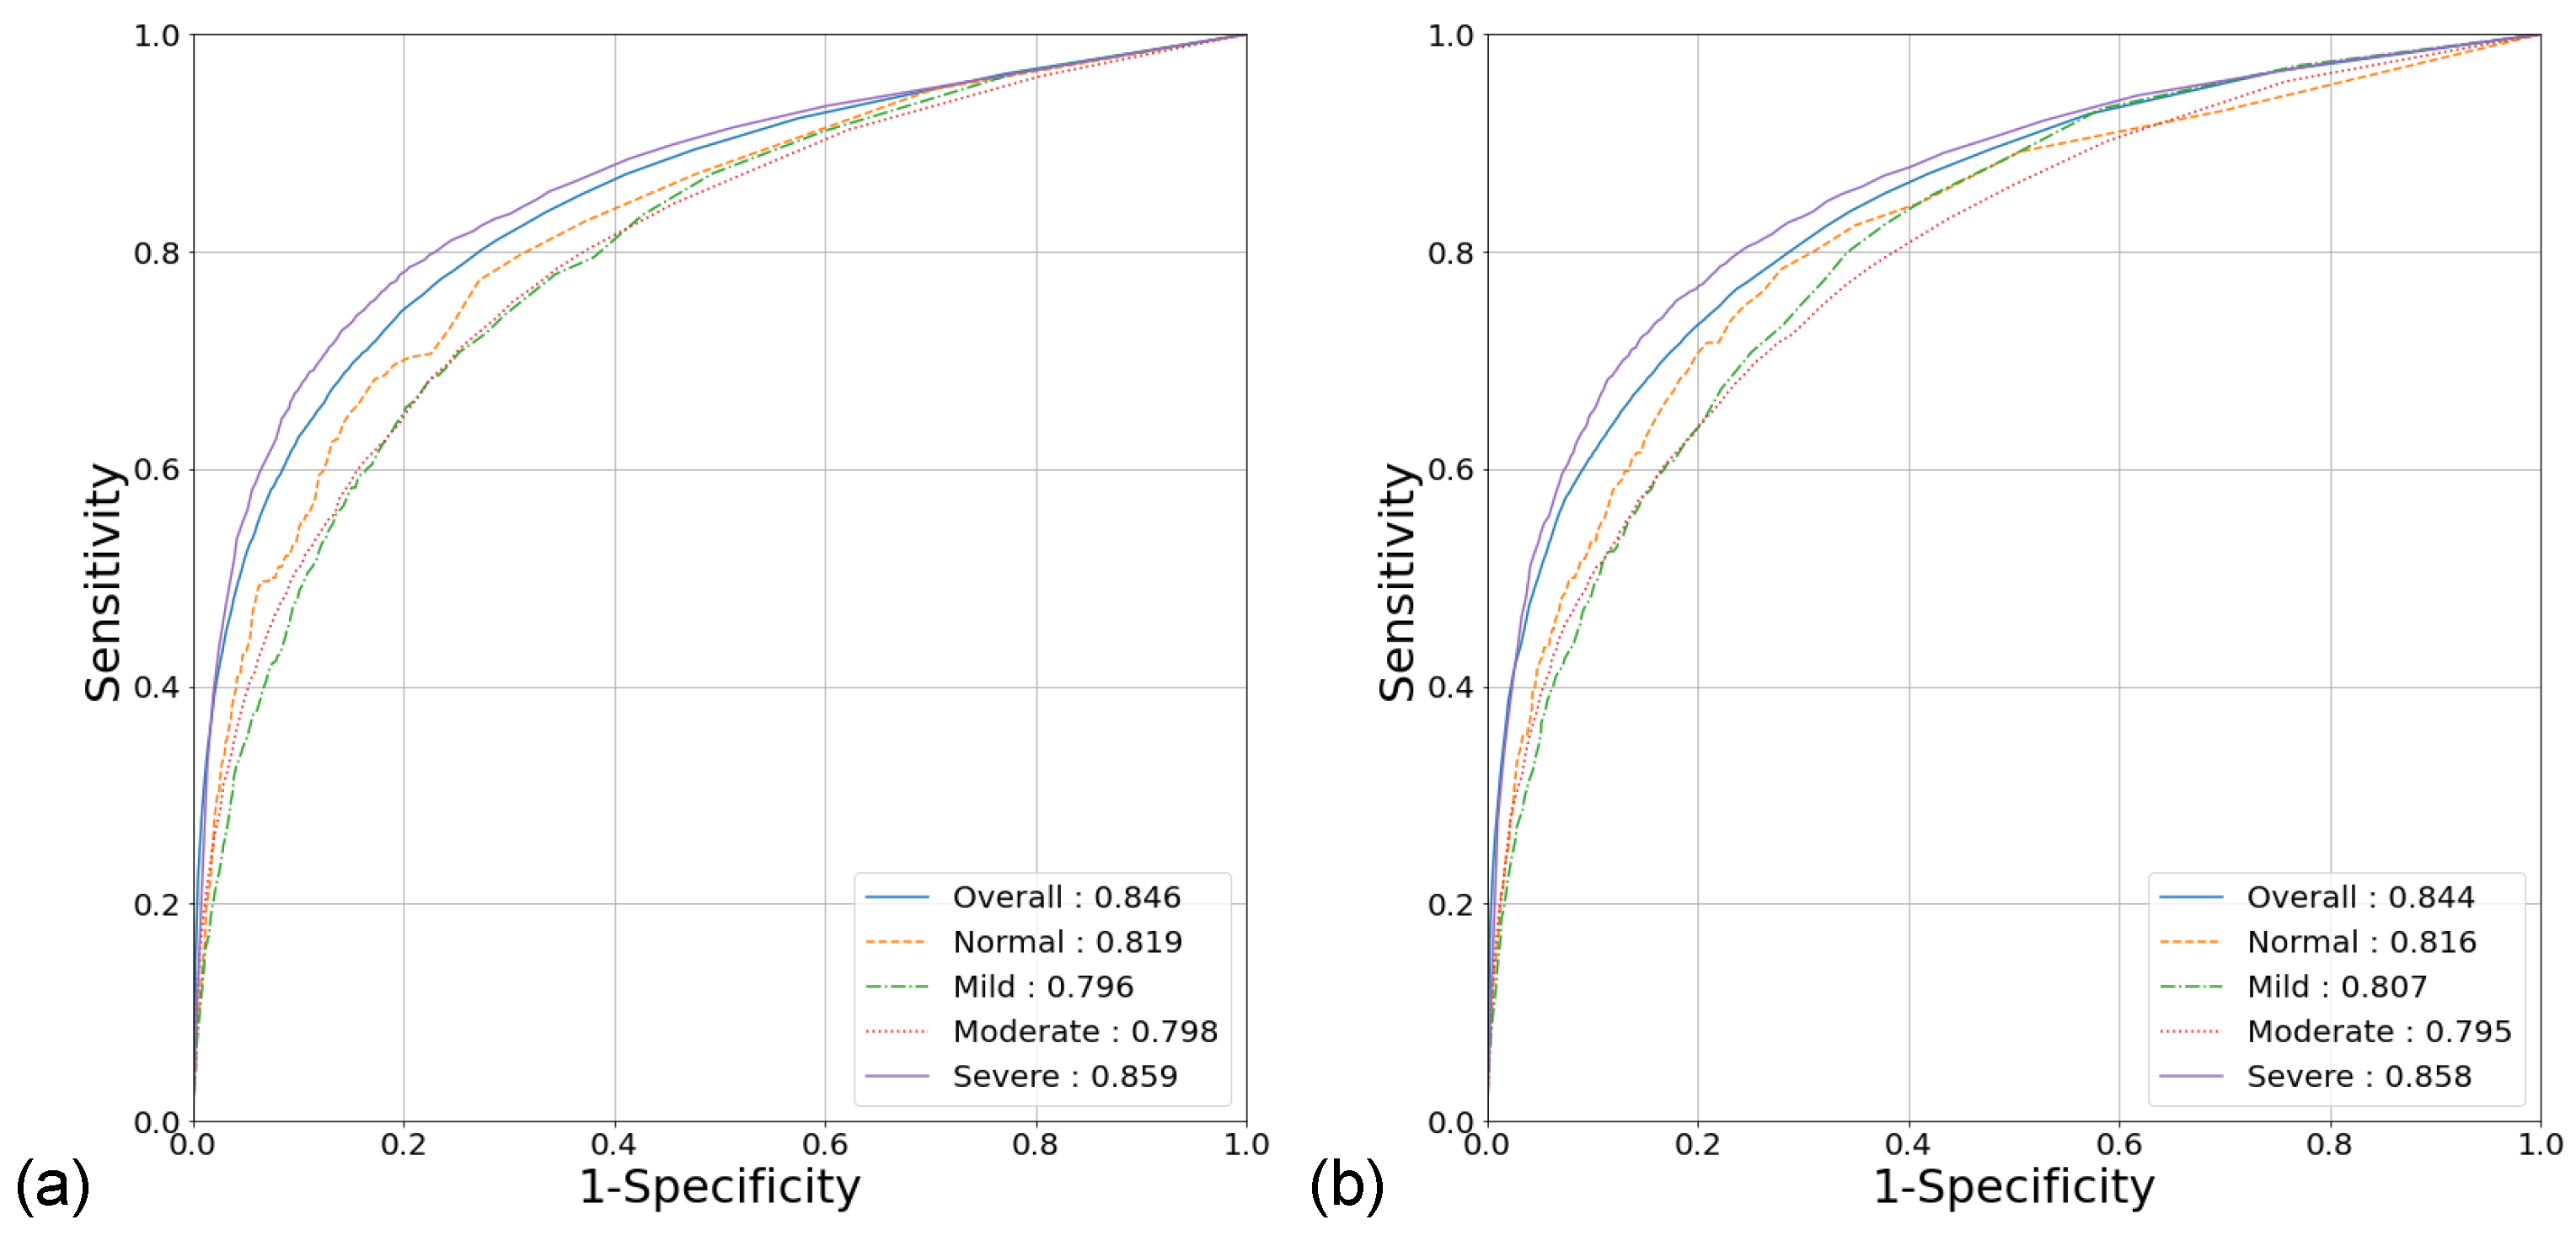
3.2. Per-Segment Classification Performance

The binary model showed an overall AUROC of 0.846 (95% CI [0.842, 0.851]) for per-segment classification, with a sensitivity of 74.4% (95% CI [73.6%, 75.3%]) and a specificity of 80.3% (95% CI [79.7%, 80.8%]). The multiclass model showed similar results, with an overall AUROC of 0.844 (95% CI [0.840, 0.849]), a sensitivity of 72.1% (95% CI [71.2%, 72.9%]), and a specificity of 81.3% (95% CI [80.8%, 81.8%]). Table 2 and Figure 5 show the detailed classification performance. In the OSA severity groups, the AUROC, sensitivity, and specificity ranged from 0.796 to 0.859, 62.5% to 80.9%, and 76.5% to 86.8%, respectively. The AUROC in patients with severe OSA was higher than that in the rest of the patients for both the binary (0.859 vs. 0.814, p < 0.001) and multiclass models (0.857 vs. 0.809, p < 0.001).

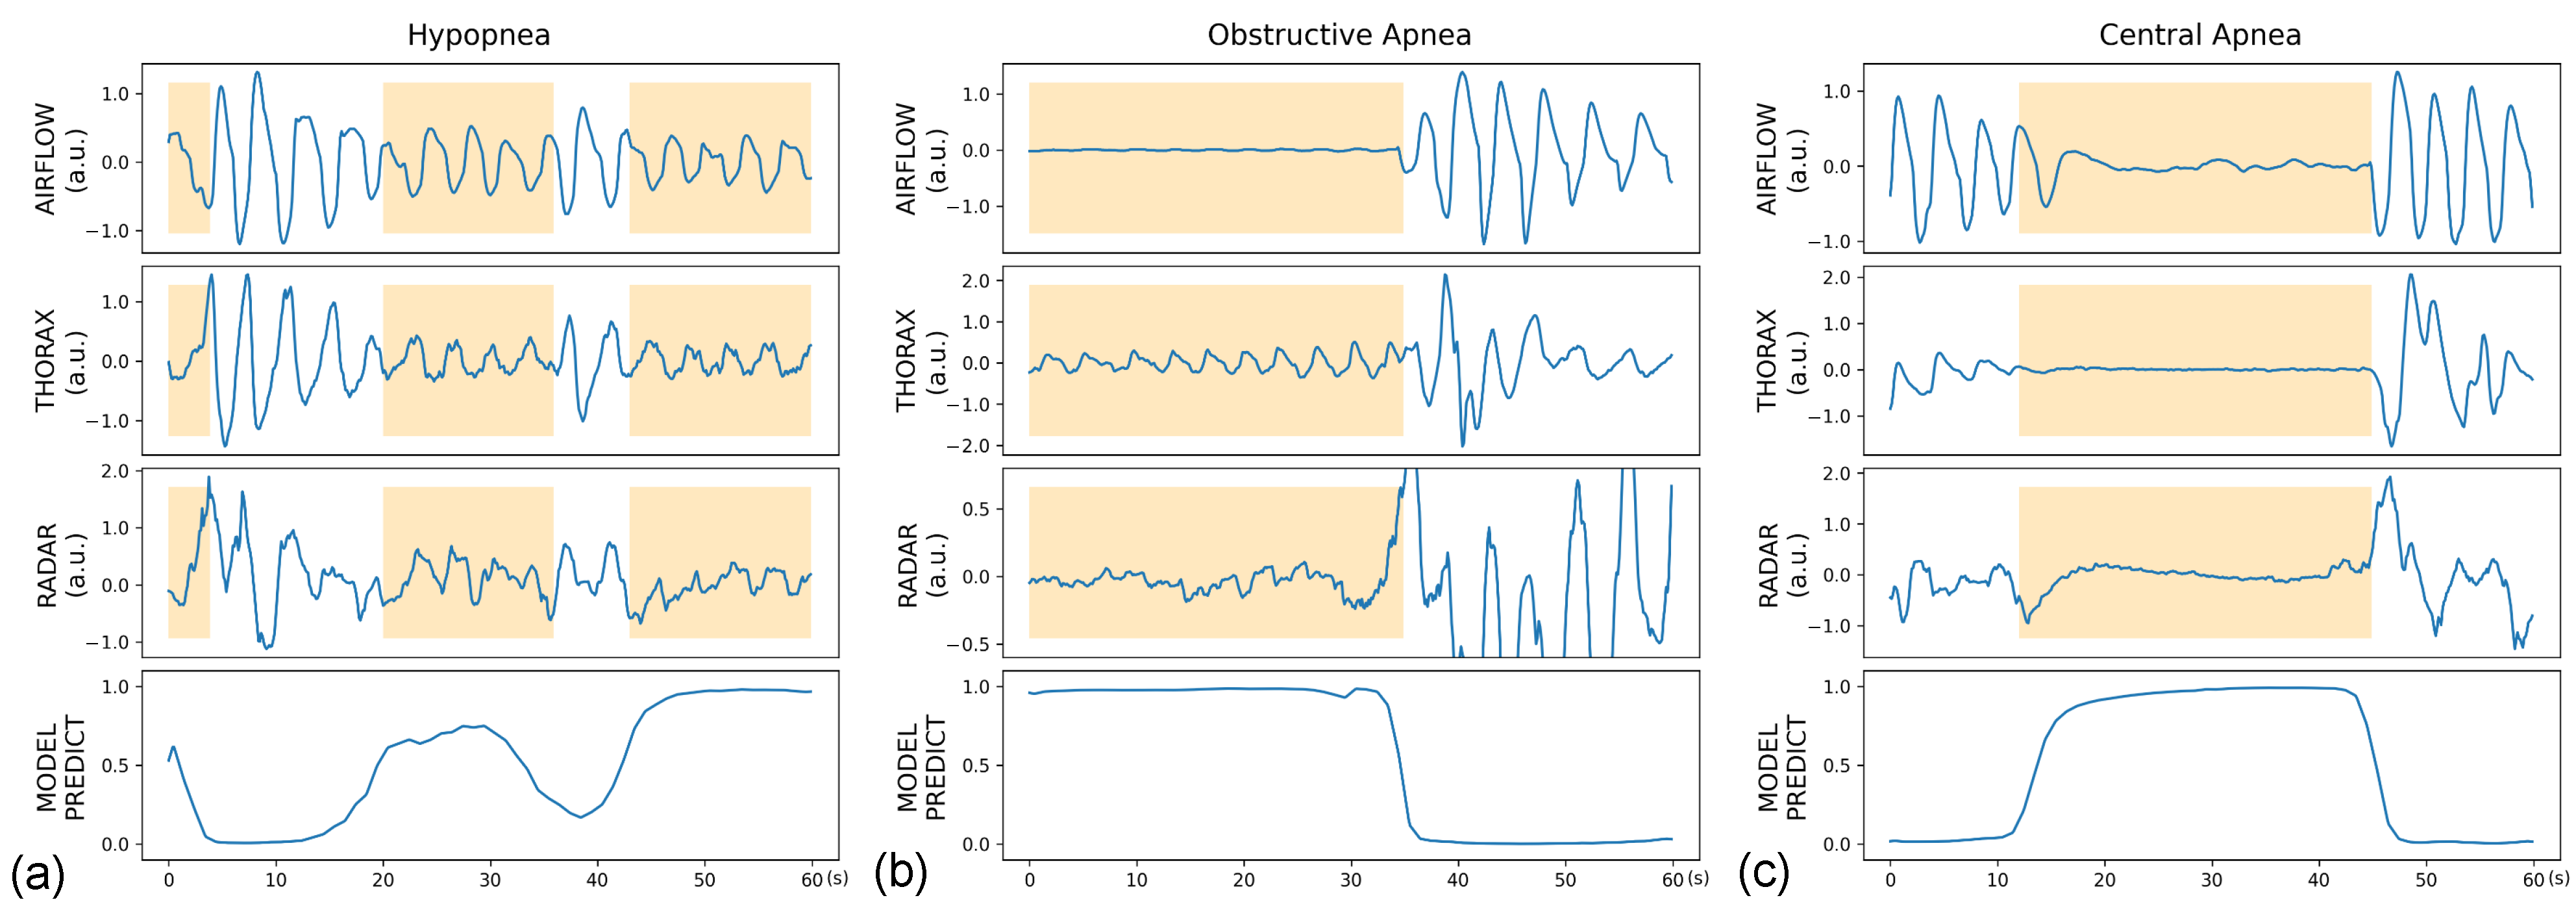
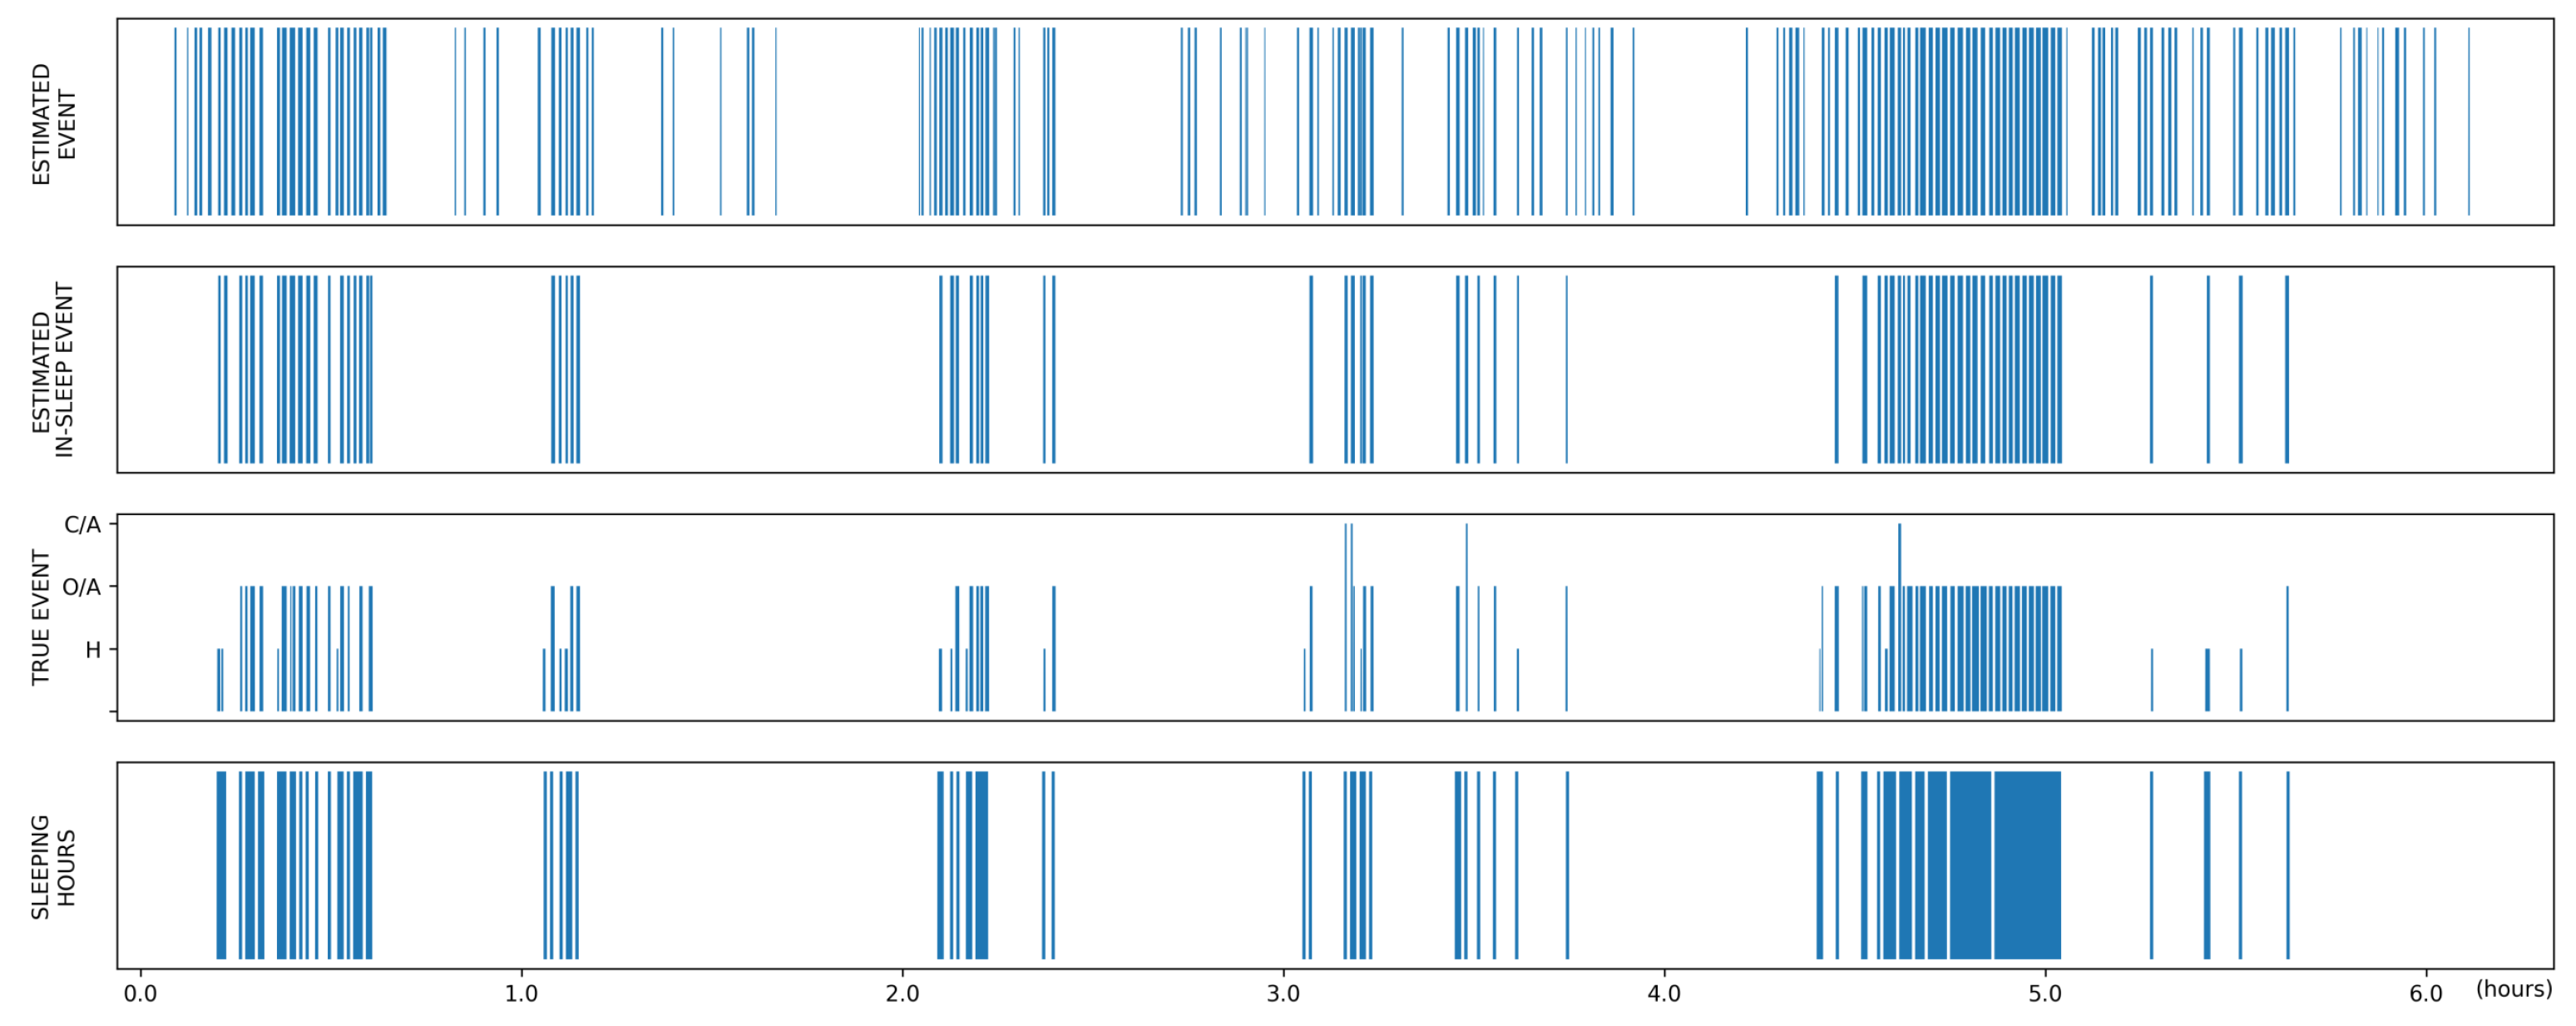
3.3. Global Event Detection Performance

The sensitivities of the binary and multiclass models were 63.3% (95% CI [62.1%, 64.5%]) and 62.2% (95% CI [61.0%, 63.4%]), respectively, for the overall study population, with a range of 49.0–67.6% across OSA severity. The number of false-positive detections per participant ranged from 23.4 to 52.8, and it was 17.2–31.0 when considering only estimated in-sleep events.
Moreover, per-class sensitivities in the overall study population ranged from 53.9% to 87.0%, with lower values for hypopnea than for apnea. The sensitivity for hypopnea across OSA severity was 47.6–58.1%, whereas the sensitivity for obstructive and central apnea showed a wide range of 0.0–100.0% due to the small number of apnea cases in non-OSA and mild OSA participants. In patients with moderate or severe OSA, the sensitivities for obstructive and central apnea were 86.1–92.0% and 78.9–88.0%, respectively. The detailed event detection performance is presented in Table 3. Figure 6 illustrates the representative cases of different respiratory events with the model predictions.

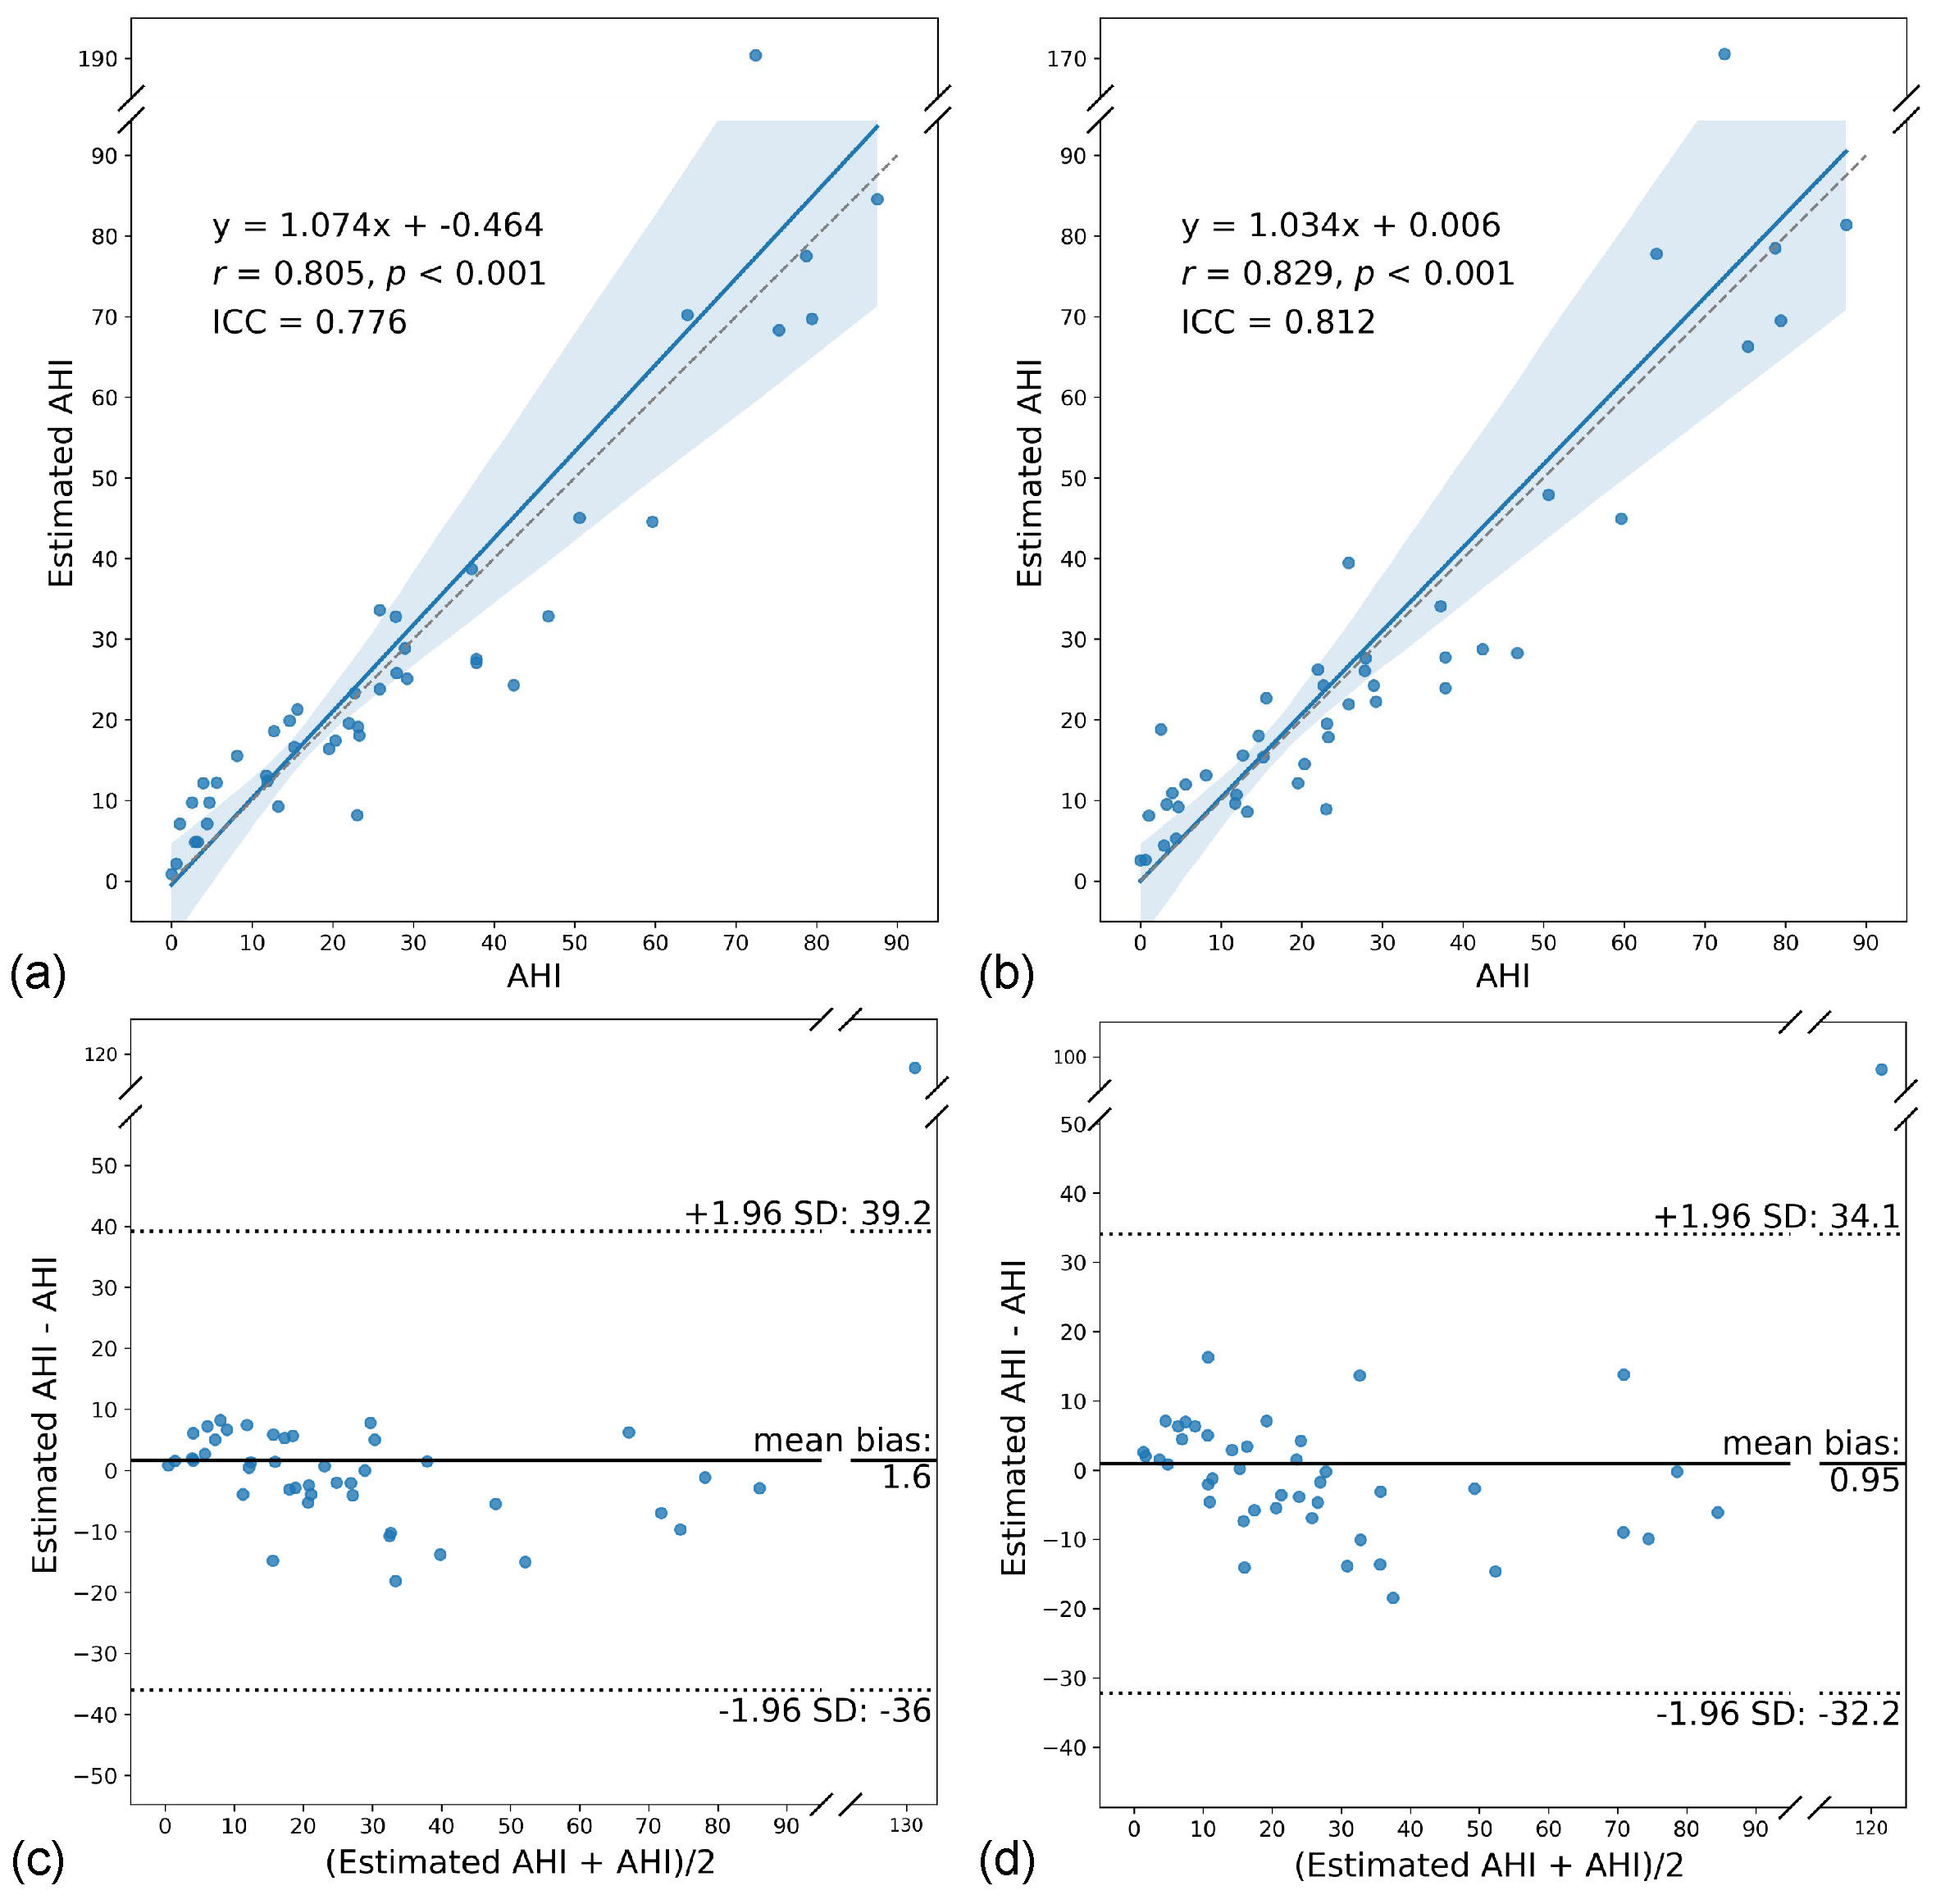
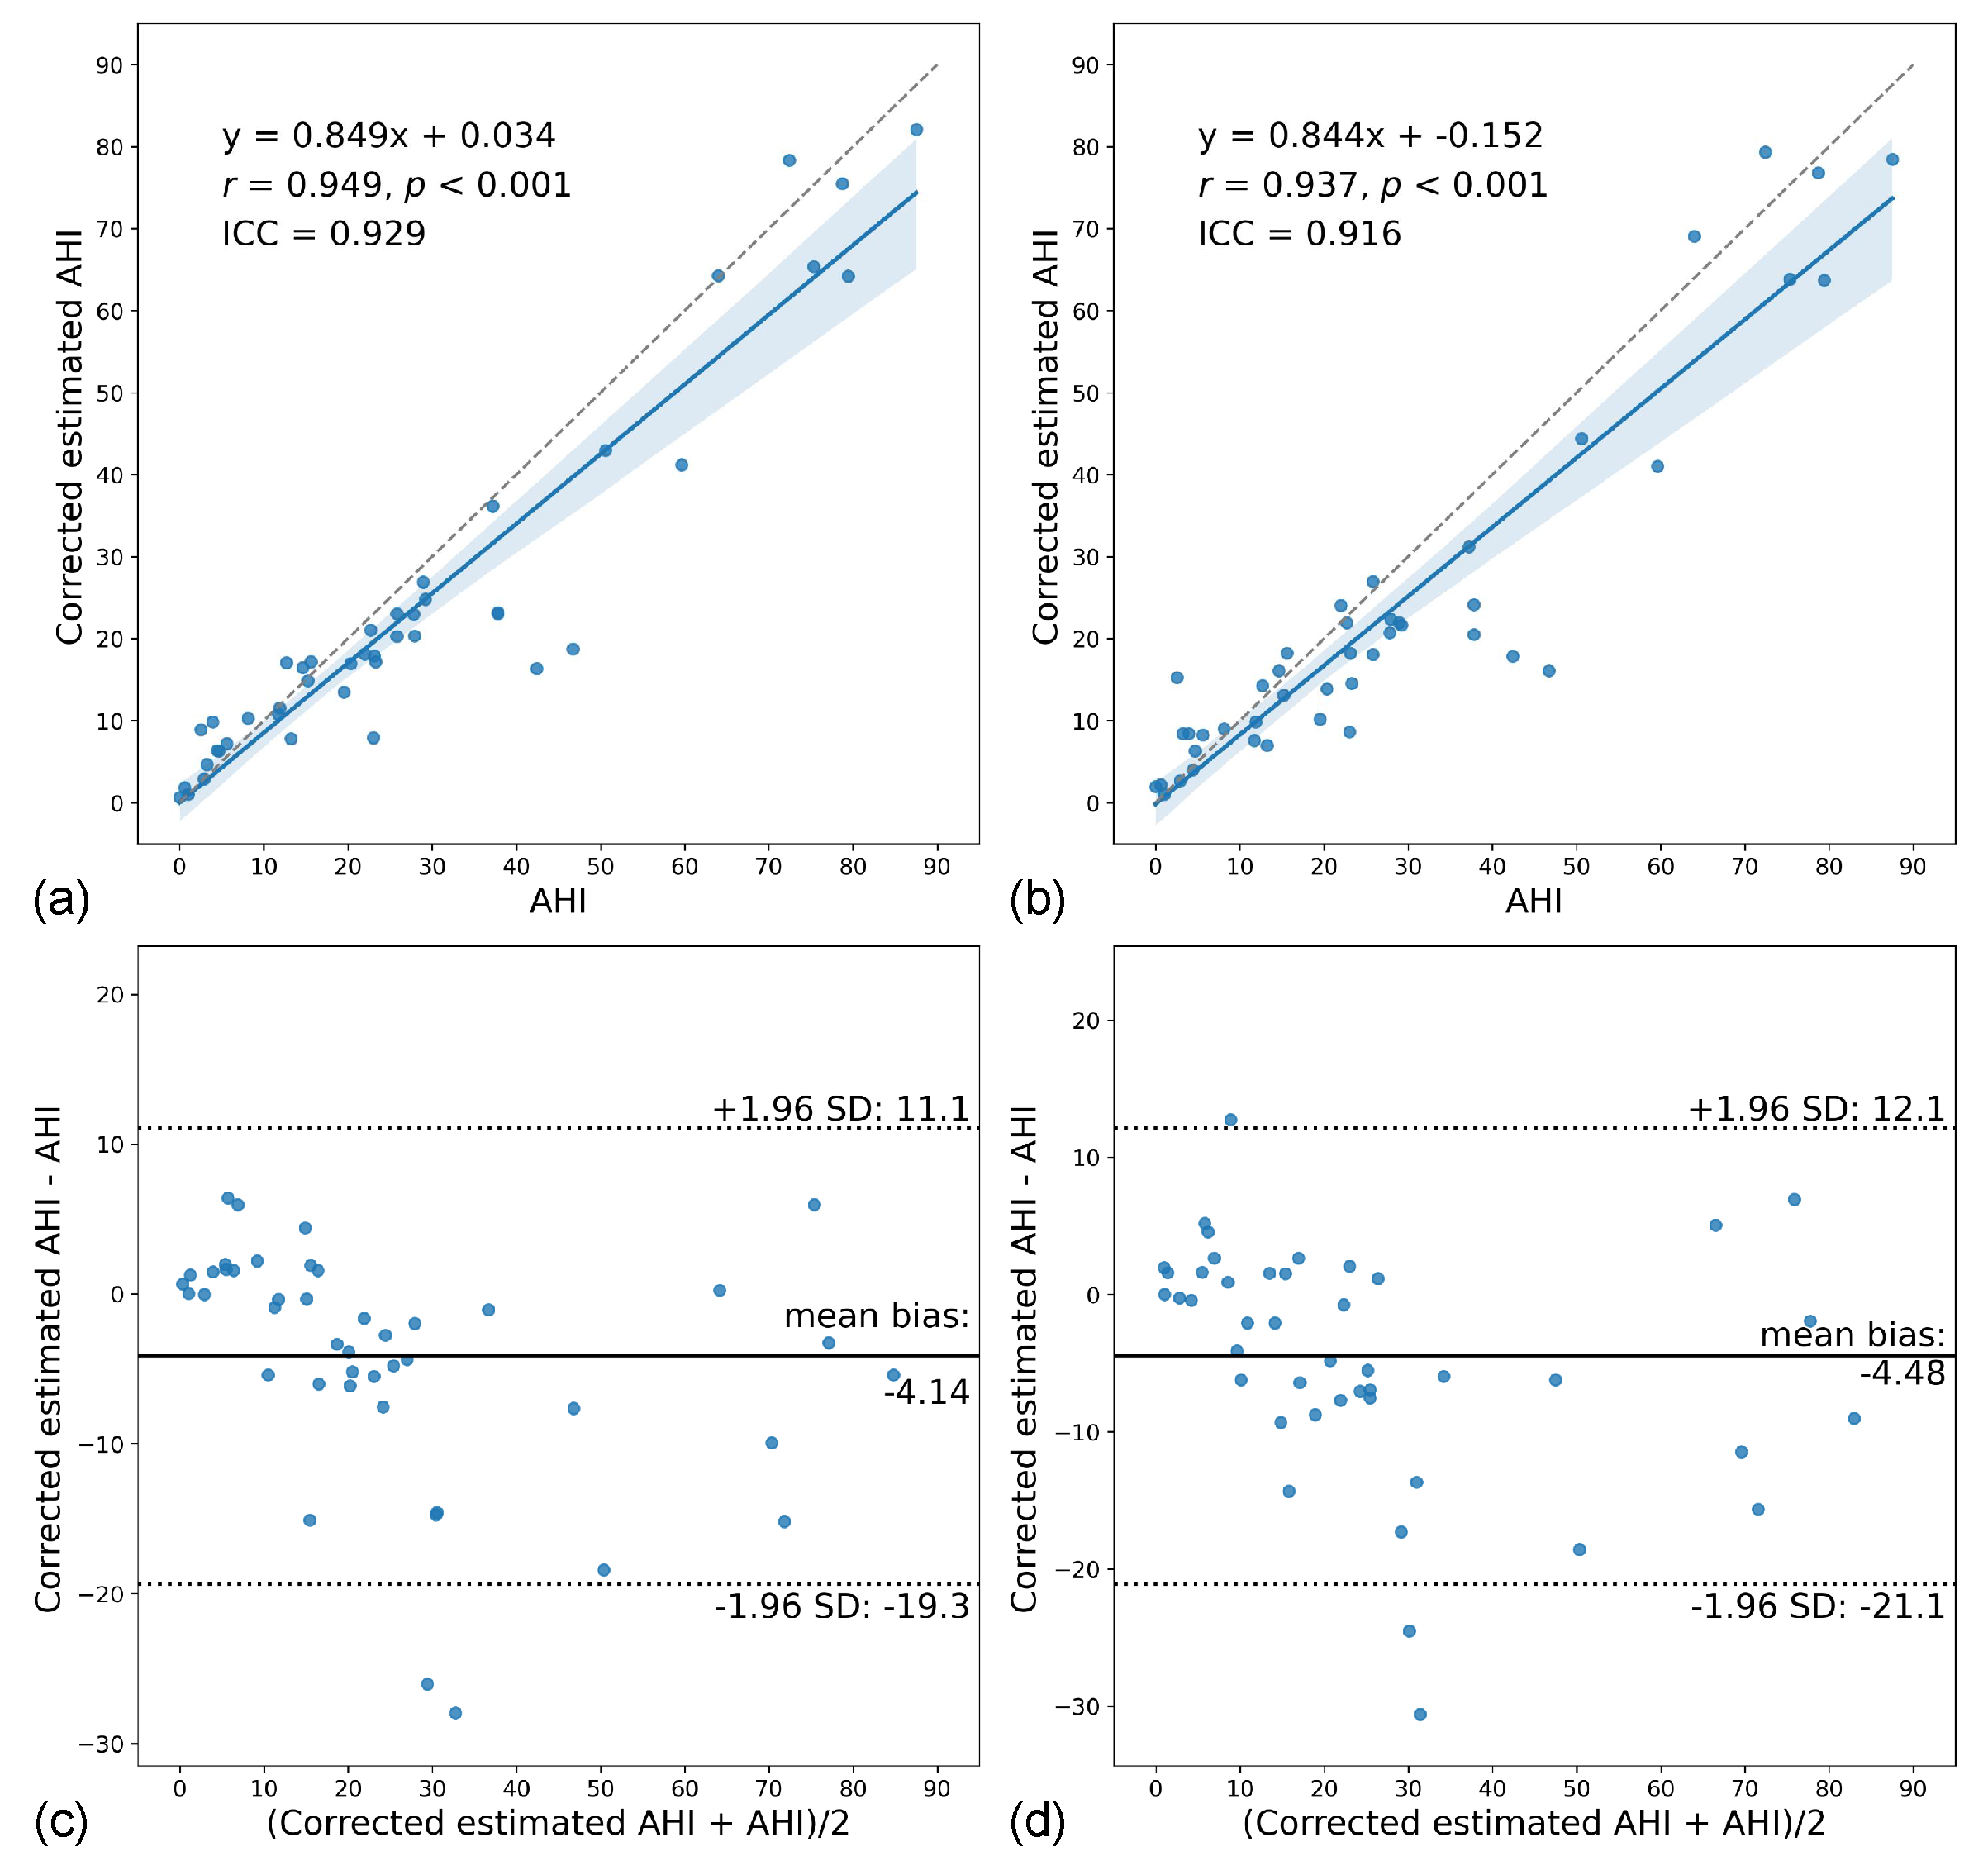
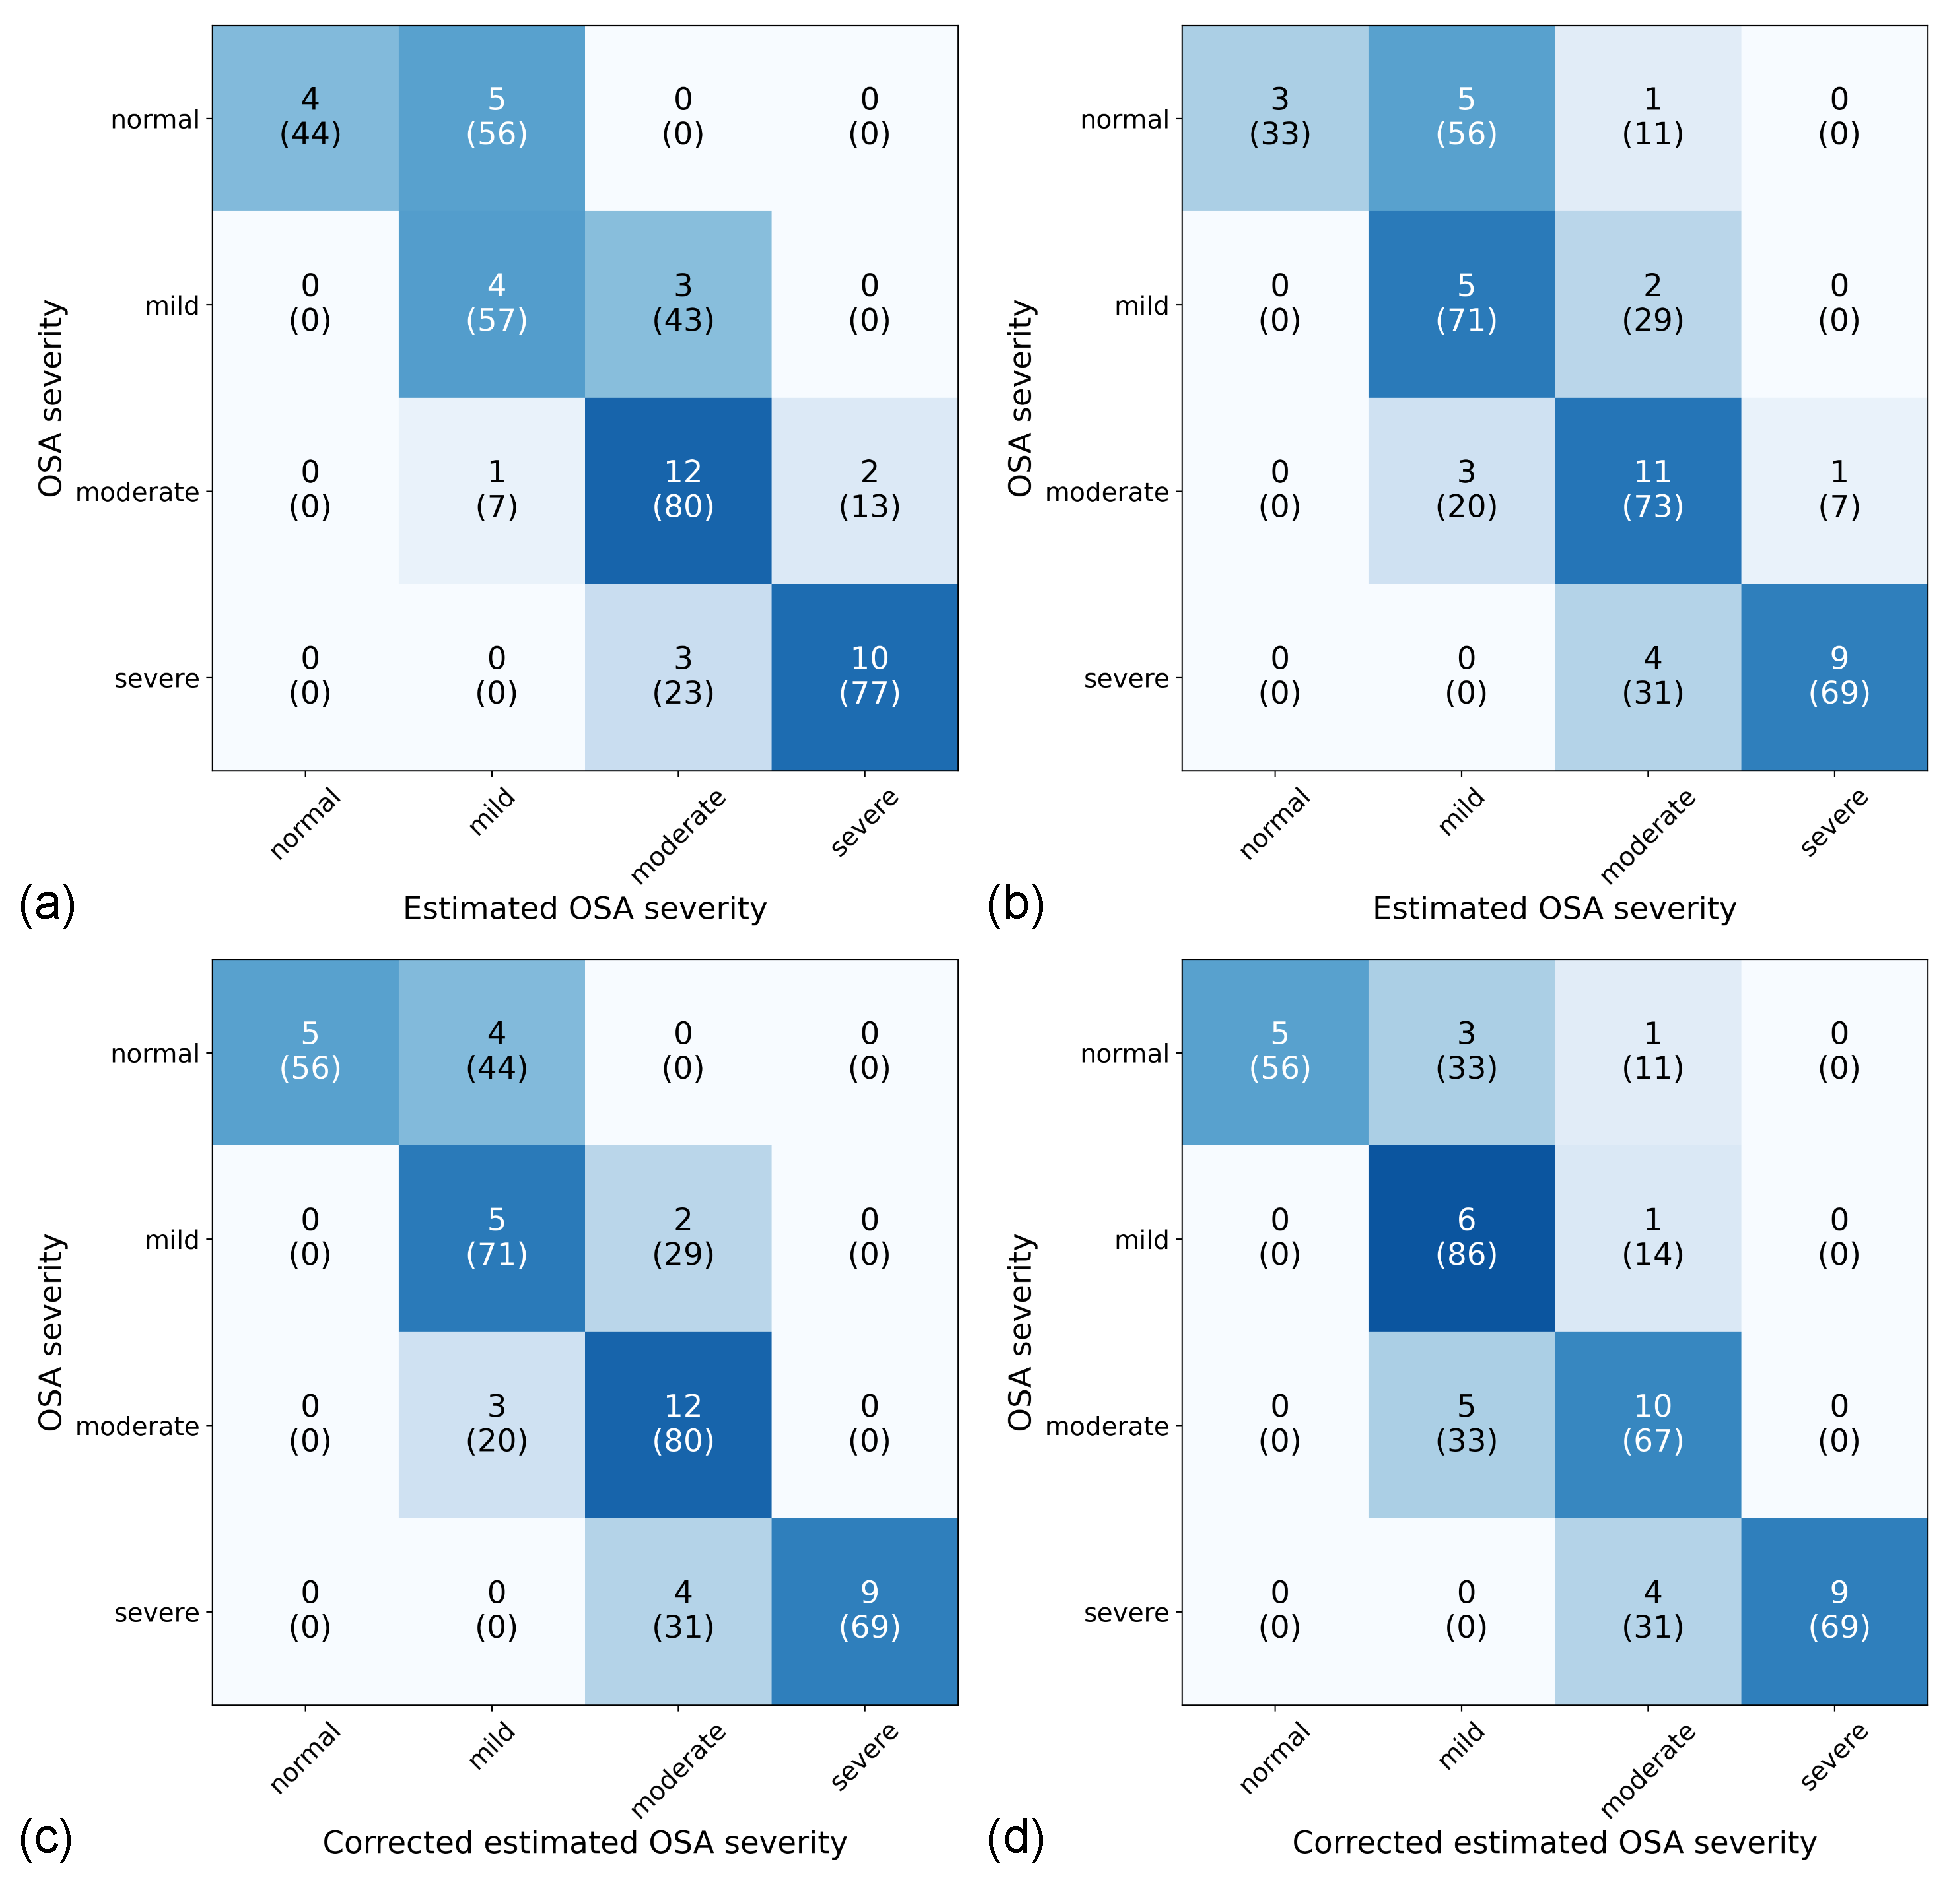
3.4. AHI Estimation Performance

The estimated AHI (Figure 7) and corrected estimated AHI (Figure 8) showed strong correlations (r = 0.805–0.949) and good to excellent agreement (ICC = 0.776–0.929) with the ground truth, with better results for the corrected. In the Bland–Altman analysis, the estimated AHI showed a mean bias of 1.60 (95% CI [−4.23, 7.43]) and 95% limits of agreement (LOA) of −36.0 to 39.2 for the binary model and a mean bias of 0.95 (95% CI [−4.19, 6.09]) and 95% LOA of −32.2 to 34.1 for the multiclass model. On the other hand, the corrected estimated AHI showed significantly lower values compared to the ground truth, with a mean bias of −4.14 (95% CI [−6.50, −4.23]) and 95% LOA of −19.3 to 11.1 for the binary model and a mean bias of −4.48 (95% CI [−7.06, −1.91]) and 95% LOA of −21.1 to 12.1 for the multiclass model.
The estimated OSA severities showed substantial agreement with the ground truth for both binary ( κ = 0.715) and multiclass ( κ = 0.648) models. The OSA severities estimated from the corrected estimated AHI showed a slightly higher substantial agreement with the ground truth for both the binary ( κ = 0.736) and multiclass ( κ = 0.699) models (Figure 9).

4. Discussion

With the increasing interest in non-contact sensors for PSG, radar constitutes a promising technology. The radar for sleep assessment primarily targets respiratory efforts, usually measured by thoracoabdominal belts in conventional PSG. However, there is scarce literature regarding the use of radars in OSA. Therefore, this preliminary study investigated the feasibility of the automated detection of apnea-hypopnea events for OSA diagnosis based on FMCW radar using deep learning.
The diagnostic performance was the highest for patients with severe OSA in terms of AUROC for per-segment classification and sensitivity for global event detection, consistent with previous studies using thoracoabdominal belts or radar [40,41,42,43]. This may be attributed to the higher proportion of apnea in patients with more severe OSA. While the sensitivities for hypopnea were not significantly different among the OSA severity groups, the proposed models showed higher sensitivities for apnea than hypopnea. In addition, our dataset included more patients with moderate or severe OSA than those without or with mild OSA. Therefore, because a much higher number of events were included in patients with more severe OSA, these events would have contributed more to the model training.
The proposed models showed limited sensitivities for hypopnea, unlike apnea, with a range of 47.6–58.1%, even though hypopnea was the major event (71.0%, 4427/6239). This is expected and concordant with previous studies [40,41,42,43], since hypopnea is an incomplete form of respiratory abnormality between normal respiration and the complete cessation of the upper airway (obstructive apnea). The diagnostic criteria for hypopnea include a more subtle change in airflow than apnea and require additional information on oxygen desaturation or arousal [32], which was not provided in the single-channel input of our study. Furthermore, lower sensitivities for hypopnea can be linked to more vulnerable interference with non-pathologic respiratory signals from changing body positions, limb movements, or sensor noise.
Most studies on OSA exclude data from waking hours, even when the sensor (e.g., thoracoabdominal belt) cannot directly determine the sleep status [40,41,42,43]. However, we included the entire PSG recording to simulate sleep monitoring environments where only radar was used and where it was incorporated with PSG. In the former, the estimated AHI showed strong correlations (r = 0.805–0.829) and good agreement with the ground truth (ICC = 0.776–0.812), and there was substantial agreement between the estimated and ground truth OSA severity ( κ = 0.648–0.715). These results demonstrated the potential of the standalone use of radar for OSA screening. When considering only in-sleep estimated events, there were improvements in the estimation of AHI (r = 0.937–0.949 and ICC = 0.916–0.929) and OSA severity ( κ = 0.699–0.736), primarily due to the reduction in false-positive detections during wakefulness. This is clearly shown in the case with poor sleep efficiency (Figure 10), which is an outlier in Figure 7.
We employed a detection model based on a CRNN architecture instead of the classification models used in most existing deep learning methods for OSA diagnosis [44]. The classification model has certain disadvantages. First, it uses weak labels compared to detection model. Previous works converted each segment of approximately 30 s to 1 min into a single class by thresholding the length of the in-segment event annotations [40,41]. However, the events manually annotated in PSG are strong labels, usually with a high temporal resolution of approximately 1 s, which can be exploited more by a detection model without losing information than a classification model. Second, a detection model provides more intuitive localization results for event detection than a classification model (Figure 6). The classification model requires postprocessing with a narrow sliding window to translate predictions into time-sequenced events (e.g., valid events if at least six consecutive segments are predicted to be abnormal) [43,45]. However, such postprocessing relies on a smoothing parameter that requires additional tuning after training the model.
We experimented with binary and multiclass models to investigate the potential benefits of multiclass labels in detecting abnormal events. However, they showed similar results, which may be attributed to several factors. First, there was a class imbalance in respiratory events. Hypopnea accounted for the majority of the events (71.0%, 4427/6239), followed by obstructive apnea (26.6%, 1660/6239), with central apnea being the fewest (2.4%, 152/6239). Second, because a multiclass task is more complicated than a binary task, multiclass labels may not necessarily help the model to learn to distinguish between abnormal and normal respiration. The multiclass model may learn the distributions of normal respiration in the early training phase at a level similar to that of the binary model, with the rest of the training focusing on distinguishing different classes of events.
This study had several limitations that should be addressed in future work. First, the number of study participants, especially those with less than moderate OSA, is insufficient. In addition, future studies should investigate more technical modifications of radar setups, such as signal processing or adding an under-the-mattress radar, and model development, including hyperparameter optimization and the comparison of different deep learning architectures. Specifically, advanced deep learning methods such as the Transformer [46] and deep domain adaptation [47] are potential alternatives. Moreover, regarding PSG, sleep stages (e.g., REM and non-REM), body position, and limb movements could be considered for model development and analysis. In particular, since sleep stages and body positions affect apnea-hypopnea frequency [48], future work could include the analysis of the effects of different sleep stages and body positions on diagnostic performances. In addition, a promising direction for future research is using an ensemble of the current model and models performing radar-based predictions of sleep stages and/or body movements.
In conclusion, we demonstrated that the automated detection of apnea-hypopnea events based on FMCW radar is feasible using a CRNN-based deep learning model. This preliminary study, which involved an OSA cohort still in recruitment and an in-development radar, showed the possibility of using the FMCW radar as a standalone screening tool for OSA. Integration with other non-contact sensors for sleep signals, such as oxygen desaturation sensors, is warranted to develop an improved non-contact OSA diagnosis.

Supplementary Materials

The following supporting information can be downloaded at: https://www.mdpi.com/article/10.3390/s22197177/s1. Figure S1: The signal processing flows in the FMCW radar to detect (a) distance and (b) velocity of the target.

Author Contributions

Conceptualization, D.H.K. and D.L.K.; methodology, J.W.C., J.H.L., D.H.K. and D.L.K.; software, J.W.C. and J.H.L.; formal analysis, J.W.C., J.H.L., D.H.K. and D.L.K.; investigation, J.W.C., J.H.L., D.H.K. and D.L.K.; resources, D.L.K., Y.P., H.N., S.-N.H., G.J., S.L. and B.K.; data curation, J.W.C., J.H.L., D.H.K., D.L.K., G.J., S.L. and B.K.; writing—original draft preparation, J.W.C., J.H.L., G.J., D.H.K. and D.L.K.; writing—review and editing, J.W.C., J.H.L., H.J.K., D.H.K. and D.L.K.; visualization, J.W.C. and J.H.L.; supervision, D.H.K. and D.L.K.; project administration, D.H.K. and D.L.K.; funding acquisition, D.H.K. and D.L.K. All authors have read and agreed to the published version of the manuscript.

Funding

This research was supported by the Korea Medical Device Development Fund grant funded by the Korea government (the Ministry of Science and ICT, the Ministry of Trade, Industry and Energy, the Ministry of Health and Welfare, and the Ministry of Food and Drug Safety) (Project Number: KMDF_PR_20200901_0119).

Institutional Review Board Statement

This study was conducted in accordance with the principles of the Declaration of Helsinki and approved by the Institutional Review Board of the Boramae Medical Center of Seoul National University (IRB No. 10-2021-16).

Informed Consent Statement

Written informed consent was obtained from all subjects involved in the study.

Data Availability Statement

Not applicable.

Conflicts of Interest

G.J., S.L., and B.K. are employees of AU Inc. Other authors declare no conflicts of interest. The funders had no role in the design of the study; in the collection, analyses, or interpretation of data; in the writing of the manuscript; or in the decision to publish the results.

References

  1. Olson, E.J.; Moore, W.R.; Morgenthaler, T.I.; Gay, P.C.; Staats, B.A. Obstructive sleep apnea-hypopnea syndrome. Mayo Clin. Proc. 2003, 78, 1545–1552. [Google Scholar] [CrossRef] [PubMed]
  2. Young, T.; Palta, M.; Dempsey, J.; Skatrud, J.; Weber, S.; Badr, S. The occurrence of sleep-disordered breathing among middle-aged adults. N. Engl. J. Med. 1993, 328, 1230–1235. [Google Scholar] [CrossRef] [PubMed]
  3. Koo, D.L.; Nam, H.; Thomas, R.J.; Yun, C.H. Sleep Disturbances as a Risk Factor for Stroke. J. Stroke Cerebrovasc. Dis. 2018, 20, 12–32. [Google Scholar] [CrossRef] [PubMed]
  4. Andrade, A.G.; Bubu, O.M.; Varga, A.W.; Osorio, R.S. The Relationship between Obstructive Sleep Apnea and Alzheimer’s Disease. J. Alzheimers. Dis. 2018, 64, S255–S270. [Google Scholar] [CrossRef]
  5. Somers, V.K.; White, D.P.; Amin, R.; Abraham, W.T.; Costa, F.; Culebras, A.; Daniels, S.; Floras, J.S.; Hunt, C.E.; Olson, L.J.; et al. Sleep apnea and cardiovascular disease: An American Heart Association/american College of Cardiology Foundation Scientific Statement from the American Heart Association Council for High Blood Pressure Research Professional Education Committee, Council on Clinical Cardiology, Stroke Council, and Council On Cardiovascular Nursing. In collaboration with the National Heart, Lung, and Blood Institute National Center on Sleep Disorders Research (National Institutes of Health). Circulation 2008, 118, 1080–1111. [Google Scholar] [CrossRef]
  6. Kapur, V.K.; Auckley, D.H.; Chowdhuri, S.; Kuhlmann, D.C.; Mehra, R.; Ramar, K.; Harrod, C.G. Clinical Practice Guideline for Diagnostic Testing for Adult Obstructive Sleep Apnea: An American Academy of Sleep Medicine Clinical Practice Guideline. J. Clin. Sleep Med. 2017, 13, 479–504. [Google Scholar] [CrossRef] [PubMed]
  7. Chung, K.Y.; Song, K.; Shin, K.; Sohn, J.; Cho, S.H.; Chang, J.H. Noncontact Sleep Study by Multi-Modal Sensor Fusion. Sensors 2017, 17, 1685. [Google Scholar] [CrossRef]
  8. Le Bon, O.; Staner, L.; Hoffmann, G.; Dramaix, M.; San Sebastian, I.; Murphy, J.R.; Kentos, M.; Pelc, I.; Linkowski, P. The first-night effect may last more than one night. J. Psychiatr. Res. 2001, 35, 165–172. [Google Scholar] [CrossRef]
  9. Newell, J.; Mairesse, O.; Verbanck, P.; Neu, D. Is a one-night stay in the lab really enough to conclude? First-night effect and night-to-night variability in polysomnographic recordings among different clinical population samples. Psychiatry Res. 2012, 200, 795–801. [Google Scholar] [CrossRef]
  10. Matar, G.; Lina, J.M.; Carrier, J.; Kaddoum, G. Unobtrusive sleep monitoring using cardiac, breathing and movements activities: An exhaustive review. IEEE Access 2018, 6, 45129–45152. [Google Scholar] [CrossRef]
  11. Addison, A.P.; Addison, P.S.; Smit, P.; Jacquel, D.; Borg, U.R. Noncontact Respiratory Monitoring Using Depth Sensing Cameras: A Review of Current Literature. Sensors 2021, 21, 1135. [Google Scholar] [CrossRef] [PubMed]
  12. Tran, V.P.; Al-Jumaily, A.A.; Islam, S.M.S. Doppler radar-based non-contact health monitoring for obstructive sleep apnea diagnosis: A comprehensive review. Big Data Cogn. Comput. 2019, 3, 3. [Google Scholar] [CrossRef]
  13. Kebe, M.; Gadhafi, R.; Mohammad, B.; Sanduleanu, M.; Saleh, H.; Al-Qutayri, M. Human Vital Signs Detection Methods and Potential Using Radars: A Review. Sensors 2020, 20, 1454. [Google Scholar] [CrossRef]
  14. Vasireddy, R.; Roth, C.; Mathis, J.; Goette, J.; Jacomet, M.; Vogt, A. K-band Doppler radar for contact-less overnight sleep marker assessment: A pilot validation study. J. Clin. Monit. Comput. 2018, 32, 729–740. [Google Scholar] [CrossRef]
  15. Lee, Y.S.; Pathirana, P.N.; Steinfort, C.L.; Caelli, T. Monitoring and Analysis of Respiratory Patterns Using Microwave Doppler Radar. IEEE J. Transl. Eng. Health Med. 2014, 2, 1800912. [Google Scholar] [CrossRef]
  16. Kang, S.; Lee, Y.; Lim, Y.H.; Park, H.K.; Cho, S.H.; Cho, S.H. Validation of noncontact cardiorespiratory monitoring using impulse-radio ultra-wideband radar against nocturnal polysomnography. Sleep Breath. 2020, 24, 841–848. [Google Scholar] [CrossRef] [PubMed]
  17. Al-Naji, A.; Gibson, K.; Lee, S.H.; Chahl, J. Monitoring of cardiorespiratory signal: Principles of remote measurements and review of methods. IEEE Access 2017, 5, 15776–15790. [Google Scholar] [CrossRef]
  18. Zhou, Y.; Shu, D.; Xu, H.; Qiu, Y.; Zhou, P.; Ruan, W.; Qin, G.; Jin, J.; Zhu, H.; Ying, K.; et al. Validation of novel automatic ultra-wideband radar for sleep apnea detection. J. Thorac. Dis. 2020, 12, 1286–1295. [Google Scholar] [CrossRef] [PubMed]
  19. Kagawa, M.; Tojima, H.; Matsui, T. Non-contact diagnostic system for sleep apnea-hypopnea syndrome based on amplitude and phase analysis of thoracic and abdominal Doppler radars. Med. Biol. Eng. Comput. 2016, 54, 789–798. [Google Scholar] [CrossRef]
  20. Kang, S.; Kim, D.K.; Lee, Y.; Lim, Y.H.; Park, H.K.; Cho, S.H.; Cho, S.H. Non-contact diagnosis of obstructive sleep apnea using impulse-radio ultra-wideband radar. Sci. Rep. 2020, 10, 5261. [Google Scholar] [CrossRef] [Green Version]
  21. Javaid, A.Q.; Noble, C.M.; Rosenberg, R.; Weitnauer, M.A. Towards sleep apnea screening with an under-the-mattress IR-UWB radar using machine learning. In Proceedings of the 2015 IEEE 14th International Conference on Machine Learning and Applications (ICMLA), Miami, FL, USA, 9–11 December 2015. [Google Scholar] [CrossRef]
  22. Koda, T.; Sakamoto, T.; Okumura, S.; Taki, H.; Hamada, S.; Chin, K. Radar-based automatic detection of sleep apnea using support vector machine. In Proceedings of the 2020 International Symposium on Antennas and Propagation (ISAP), Osaka, Japan, 25–28 January 2021. [Google Scholar] [CrossRef]
  23. Zhao, H.; Hong, H.; Miao, D.; Li, Y.; Zhang, H.; Zhang, Y.; Li, C.; Zhu, X. A Noncontact Breathing Disorder Recognition System Using 2.4-GHz Digital-IF Doppler Radar. IEEE J. Biomed. Health Inform. 2019, 23, 208–217. [Google Scholar] [CrossRef] [PubMed]
  24. Längkvist, M.; Karlsson, L.; Loutfi, A. A review of unsupervised feature learning and deep learning for time-series modeling. Pattern Recognit. Lett. 2014, 42, 11–24. [Google Scholar] [CrossRef]
  25. Litjens, G.; Kooi, T.; Bejnordi, B.E.; Setio, A.A.A.; Ciompi, F.; Ghafoorian, M.; van der Laak, J.A.W.M.; van Ginneken, B.; Sánchez, C.I. A survey on deep learning in medical image analysis. Med. Image Anal. 2017, 42, 60–88. [Google Scholar] [CrossRef] [PubMed]
  26. Ganapathy, N.; Swaminathan, R.; Deserno, T.M. Deep Learning on 1-D Biosignals: A Taxonomy-based Survey. Yearb. Med. Inform. 2018, 27, 98–109. [Google Scholar] [CrossRef] [PubMed]
  27. Shi, B.; Bai, X.; Yao, C. An end-to-end trainable neural network for image-based sequence recognition and its application to scene text recognition. IEEE Trans. Pattern Anal. Mach. Intell. 2016, 39, 2298–2304. [Google Scholar] [CrossRef] [PubMed]
  28. Adavanne, S.; Politis, A.; Nikunen, J.; Virtanen, T. Sound event localization and detection of overlapping sources using convolutional recurrent neural networks. IEEE J. Sel. Top. Signal Process. 2019, 13, 34–48. [Google Scholar] [CrossRef]
  29. Cho, Y.W.; Lee, J.H.; Son, H.K.; Lee, S.H.; Shin, C.; Johns, M.W. The reliability and validity of the Korean version of the Epworth sleepiness scale. Sleep Breath. 2011, 15, 377–384. [Google Scholar] [CrossRef]
  30. Hoddes, E.; Zarcone, V.; Smythe, H.; Phillips, R.; Dement, W.C. Quantification of sleepiness: A new approach. Psychophysiology 1973, 10, 431–436. [Google Scholar] [CrossRef]
  31. Buysse, D.J.; Reynolds, C.F.; Monk, T.H.; Berman, S.R.; Kupfer, D.J. The Pittsburgh sleep quality index: A new instrument for psychiatric practice and research. Psychiatry Res. 1989, 28, 193–213. [Google Scholar] [CrossRef]
  32. Berry, R.B.; Budhiraja, R.; Gottlieb, D.J.; Gozal, D.; Iber, C.; Kapur, V.K.; Marcus, C.L.; Mehra, R.; Parthasarathy, S.; Quan, S.F.; et al. Rules for scoring respiratory events in sleep: Update of the 2007 AASM Manual for the Scoring of Sleep and Associated Events. Deliberations of the Sleep Apnea Definitions Task Force of the American Academy of Sleep Medicine. J. Clin. Sleep Med. 2012, 8, 597–619. [Google Scholar] [CrossRef] [PubMed]
  33. Park, B.K.; Boric-Lubecke, O.; Lubecke, V.M. Arctangent demodulation with DC offset compensation in quadrature Doppler radar receiver systems. IEEE Trans. Microw. Theory Tech. 2007, 55, 1073–1079. [Google Scholar] [CrossRef]
  34. Noguchi, H.; Kubo, H.; Mori, T.; Sato, T.; Sanada, H. Signal phase estimation for measurement of respiration waveform using a microwave Doppler sensor. Conf. Proc. IEEE Eng. Med. Biol. Soc. 2013, 2013, 6740–6743. [Google Scholar] [CrossRef]
  35. Ma, J.; Chen, J.; Ng, M.; Huang, R.; Li, Y.; Li, C.; Yang, X.; Martel, A.L. Loss odyssey in medical image segmentation. Med. Image Anal. 2021, 71, 102035. [Google Scholar] [CrossRef] [PubMed]
  36. Kingma, D.P.; Ba, J. Adam: A method for stochastic optimization. arXiv 2014, arXiv:1412.6980. [Google Scholar]
  37. DeLong, E.R.; DeLong, D.M.; Clarke-Pearson, D.L. Comparing the areas under two or more correlated receiver operating characteristic curves: A nonparametric approach. Biometrics 1988, 44, 837–845. [Google Scholar] [CrossRef]
  38. Youden, W.J. Index for rating diagnostic tests. Cancer 1950, 3, 32–35. [Google Scholar] [CrossRef]
  39. Lipton, Z.C.; Elkan, C.; Naryanaswamy, B. Optimal Thresholding of Classifiers to Maximize F1 Measure. Mach. Learn. Knowl. Discov. Databases 2014, 8725, 225–239. [Google Scholar] [CrossRef]
  40. Haidar, R.; McCloskey, S.; Koprinska, I.; Jeffries, B. Convolutional neural networks on multiple respiratory channels to detect hypopnea and obstructive apnea events. In Proceedings of the 2018 International Joint Conference on Neural Networks (IJCNN), Rio de Janeiro, Brazil, 8–13 July 2018. [Google Scholar] [CrossRef]
  41. Van Steenkiste, T.; Groenendaal, W.; Deschrijver, D.; Dhaene, T. Automated Sleep Apnea Detection in Raw Respiratory Signals Using Long Short-Term Memory Neural Networks. IEEE J. Biomed. Health Inform. 2019, 23, 2354–2364. [Google Scholar] [CrossRef] [Green Version]
  42. Nassi, T.E.; Ganglberger, W.; Sun, H.; Bucklin, A.A.; Biswal, S.; van Putten, M.J.A.M.; Thomas, R.J.; Westover, M.B. Automated respiratory event detection using deep neural networks. arXiv 2021, arXiv:2101.04635. [Google Scholar]
  43. Kwon, H.B.; Son, D.; Lee, D.; Yoon, H.; Lee, M.H.; Lee, Y.J.; Choi, S.H.; Park, K.S. Hybrid CNN-LSTM network for real-time apnea-hypopnea event detection based on IR-UWB radar. IEEE Access 2022, 10, 17556–17564. [Google Scholar] [CrossRef]
  44. Mostafa, S.S.; Mendonça, F.; Ravelo-García, A.G.; Morgado-Dias, F. A Systematic Review of Detecting Sleep Apnea Using Deep Learning. Sensors 2019, 19, 4934. [Google Scholar] [CrossRef] [PubMed]
  45. Choi, S.H.; Yoon, H.; Kim, H.S.; Kim, H.B.; Kwon, H.B.; Oh, S.M.; Lee, Y.J.; Park, K.S. Real-time apnea-hypopnea event detection during sleep by convolutional neural networks. Comput. Biol. Med. 2018, 100, 123–131. [Google Scholar] [CrossRef] [PubMed]
  46. Vaswani, A.; Shazeer, N.; Parmar, N.; Uszkoreit, J.; Jones, L.; Gomez, A.N.; Kaiser, L.; Polosukhin, I. Attention is all you need. arXiv 2017, arXiv:1706.03762. [Google Scholar]
  47. Motiian, S.; Piccirilli, M.; Adjeroh, D.A.; Doretto, G. Unified deep supervised domain adaptation and generalization. arXiv 2017, arXiv:1709.10190. [Google Scholar]
  48. Eiseman, N.A.; Westover, M.B.; Ellenbogen, J.M.; Bianchi, M.T. The impact of body posture and sleep stages on sleep apnea severity in adults. J. Clin. Sleep Med. 2012, 8, 655–666. [Google Scholar] [CrossRef]
Figure 1. Photo and illustration of radar (red box) setup for respiratory signal monitoring.
Sensors 22 07177 g001
Figure 2. The architecture of the radar sensor: ANT = antenna, LNA = low-noise amplifier, PA = power amplifier, IF = intermediate frequency, ADC = analog-digital converter, and DSP = digital signal processor.
Sensors 22 07177 g002
Figure 3. A flowchart describing the extraction of respiratory signals from radar signals.
Sensors 22 07177 g003
Figure 4. The mechanism for demodulating respiratory signals from radar output signals: (a) respiratory signals in the complex domain and (b) demodulated respiratory signal.
Sensors 22 07177 g004
Figure 5. ROC analysis of per-segment classification for the (a) binary and (b) multiclass models.
Sensors 22 07177 g005
Figure 6. Representative cases of (a) hypopnea, (b) obstructive apnea, and (c) central apnea, presented along with predictions from the binary model. The ground truth events are annotated with orange boxes.
Sensors 22 07177 g006
Figure 7. Comparison of the estimated AHI with the ground truth for the binary (a,c) and multiclass models (b,d). (a,b) Scatter plots of estimated AHI versus AHI showing the linear regression line (blue line) with 95% confidence intervals (blue shadowed area). (c,d) Bland–Altman plots of estimated AHI and AHI.
Sensors 22 07177 g007
Figure 8. Comparison of the corrected estimated AHI with the ground truth for the binary (a,c) and multiclass models (b,d). (a,b) Scatter plots of corrected estimated AHI versus AHI showing the linear regression line (blue line) with 95% confidence intervals (blue shadowed area). (c,d) Bland–Altman plots of corrected estimated AHI and AHI.
Sensors 22 07177 g008
Figure 9. Confusion matrices for the estimation of OSA severity of the binary (a) and multiclass (b) models and the corrected estimated OSA severity of the binary (c) and multiclass (d) models. Data are presented as the number of participants with the row-normalized percentage in parentheses. The colors of the cells correspond to the row-normalized percentage.
Sensors 22 07177 g009
Figure 10. Prediction result of a whole PSG recording from an example case with poor sleep efficiency. The first row shows the estimated abnormal respiratory events. When considering sleep status (last row), false-positive detections at waking hours are reduced (second row), resulting in predictions more similar to the ground truth (third row). H = hypopnea, O/A = obstructive apnea, C/A = central apnea.
Sensors 22 07177 g010
Table 1. Demographic and polysomnographic data of the study population.
VariablesNormalMild OSAModerate OSASevere OSA
Subject characteristicsNumber (male/female)9 (2/7)7 (4/3)15 (10/5)13 (9/4)
Age46.4 ± 17.949.9 ± 18.057.9 ± 9.555.3 ± 17.5
Body mass index (kg/m2)24.6 ± 4.124.9 ± 1.925.2 ± 2.926.7 ± 17.5
Neck circumference (cm)36.7 ± 3.039.0 ± 3.638.6 ± 4.240.8 ± 3.1
ESS score4.8 ± 3.15.0 ± 3.39.0 ± 3.78.5 ± 3.8
SSS score2.2 ± 1.03.0 ± 0.82.0 ± 0.52.4 ± 0.8
PSQI score8.6 ± 3.211.0 ± 2.810.0 ± 3.59.7 ± 4.0
Polysomnographic dataTime in bed (min)362.6 ± 106.5412.0 ± 16.2396.0 ± 23.9400.1 ± 24.4
Total sleep time (min)294.4 ± 97.2311.0 ± 43.6314.8 ± 66.7266.5 ± 90.6
Sleep latency (min)18.2 ± 30.517 ± 12.716.4 ± 27.613.8 ± 14.8
Sleep efficiency (%)80.1 ± 8.775.7 ± 11.778.9 ± 13.766.3 ± 22.1
N1 (%)12.3 ± 7.214.0 ± 2.616.9 ± 8.033.4 ±13.5
N2 (%)52.3 ± 5.051.4 ± 5.751.3 ± 6.447.2 ± 9.6
N3 (%)20.0 ± 3.019.2 ± 2.116.7 ± 5.38.5 ± 8.4
REM (%)15.4 ± 9.615.4 ± 6.715.0 ± 6.210.9 ± 7.9
Apnea index (events/h)00.1 ± 0.22.8 ± 3.220.1 ± 20.6
Hypopnea index (events/h)2.5 ± 1.910.3 ± 2.620.3 ± 4.234.6 ± 11.0
AHI (events/h)2.6 ± 1.711.1 ± 3.123.3 ± 4.459.2 ± 18.2
RERA index (events/h)0.1 ± 0.3000
Arousal index (events/h)19.9 ± 10.720.8 ± 5.929.4 ± 10.453.9 ± 17.6
Lowest O2 saturation (%)89.0 ± 3.387.7 ± 2.683.6 ± 3.472.8 ± 11.2
Number of segmentsAbnormal29690639176016
Normal6298491180634485
Data are presented as the mean ± standard deviation. N1, N2, N3, and REM sleep stages. OSA, obstructive sleep apnea; ESS, Epworth Sleepiness Scale; SSS, Stanford Sleepiness Scale; PSQI, Pittsburgh Sleep Quality Index; AHI, apnea-hypopnea index; RERA, respiratory effort-related sleep arousal.
Table 2. Per-segment classification performance in the overall study population and OSA severity groups.
ModelMetricOverallNormalMildModerateSevere
BinaryAUROC0.846
[0.842, 0.851]
0.819
[0.793, 0.846]
0.796
[0.780, 0.812]
0.798
[0.789, 0.807]
0.859
[0.852, 0.866]
Sensitivity0.744 (8289/11135)
[0.736, 0.753]
0.625 (185/296)
[0.570, 0.680]
0.657 (595/906)
[0.626, 0.688]
0.674 (2641/3917)
[0.660, 0.689]
0.809 (4868/6016)
[0.799, 0.819]
Specificity0.803 (19065/23757)
[0.797, 0.808]
0.868 (5464/6298)
[0.859, 0.876]
0.767 (3916/4911)
[0.786, 0.809]
0.781 (6293/8063)
[0.771, 0.790]
0.756 (3392/4485)
[0.744, 0.769]
PPV0.639 (8289/12981)
[0.630, 0.648]
0.182 (185/1019)
[0.138, 0.226]
0.374 (595/1590)
[0.343, 0.406]
0.599 (2641/4411)
[0.583, 0.614]
0.817 (4868/5961)
[0.807, 0.826]
NPV0.870 (19065/21911)
[0.866, 0.874]
0.980 (5464/5575)
[0.977, 0.984]
0.926 (3916/4227)
[0.919, 0.934]
0.831 (6293/7569)
[0.823, 0.840]
0.747 (3392/4540)
[0.734, 0.760]
Accuracy0.784 (27354/34892)
[0.780, 0.788]
0.857 (5649/6594)
[0.848, 0.865]
0.776 (4511/5817)
[0.765, 0.786]
0.746 (8934/11980)
[0.738, 0.754]
0.787 (8260/10501)
[0.779, 0.794]
MulticlassAUROC0.844
[0.840, 0.849]
0.816
[0.788, 0.843]
0.807
[0.791, 0.822]
0.795
[0.787, 0.804]
0.858
[0.850, 0.865]
Sensitivity0.721 (8024/11135)
[0.712, 0.729]
0.628 (186/296)
[0.573, 0.683]
0.605 (548/906)
[0.573, 0.637]
0.638 (2498/3917)
[0.623, 0.653]
0.797 (4792/6016)
[0.786, 0.807]
Specificity0.813 (19305/23757)
[0.808, 0.818]
0.850 (5352/6298)
[0.841, 0.859]
0.829 (4070/4911)
[0.818, 0.839]
0.800 (6454/8063)
[0.792, 0.809]
0.765 (3429/4485)
[0.752, 0.777]
PPV0.643 (8024/12476)
[0.634, 0.652]
0.164 (186/1132)
[0.122, 0.207]
0.395 (548/1389)
[0.363, 0.426]
0.608 (2498/4107)
[0.593, 0.624]
0.819 (4792/5848)
[0.810, 0.829]
NPV0.861 (19305/22416)
[0.857, 0.866]
0.980 (5352/5462)
[0.976, 0.983]
0.919 (4070/4428)
[0.912, 0.927]
0.820 (6454/7873)
[0.811, 0.828]
0.737 (3429/4653)
[0.724, 0.750]
Accuracy0.783 (27329/34892)
[0.779, 0.788]
0.840 (5538/6594)
[0.831, 0.849]
0.794 (4618/5817)
[0.783, 0.804]
0.747 (8952/11980)
[0.739, 0.755]
0.783 (8221/10501)
[0.775, 0.791]
Data are presented as values (numerator/denominator, if applicable) [95% confidence intervals]. AUROC, area under the receiver operating characteristic curve; PPV, positive predictive value; NPV, negative predictive value.
Table 3. Global event detection performance in the overall study population and OSA severity groups.
ModelMetricGroupOverallNormalMildModerateSevere
BinarySensitivityOverall0.633 (3948/6239)
[0.621, 0.645]
0.583 (74/127)
[0.497, 0.668]
0.551 (252/457)
[0.506, 0.597]
0.573 (1123/1960)
[0.551, 0.595]
0.676 (2499/3695)
[0.661, 0.691]
H0.539 (2384/4427)
[0.524, 0.553]
0.581 (72/124)
[0.494, 0.668]
0.529 (220/416)
[0.481, 0.577]
0.523 (894/1710)
[0.499, 0.547]
0.550 (1198/2177)
[0.529, 0.571]
O/A0.870 (1444/1660)
[0.854, 0.886]
1.000 (2/2)
[1.000, 1.000]
1.000 (5/5)
[1.000, 1.000]
0.920 (207/225)
[0.885, 0.955]
0.861 (1230/1428)
[0.843, 0.879]
C/A0.790 (120/152
[0.725, 0.854]
0.000 (0/1)
[0.000, 0.000]
0.750 (27/36)
[0.609, 0.892]
0.880 (22/25)
[0.753, 1.000]
0.789 (71/90)
[0.705, 0.873]
PPV 0.695 (3948/5681)
[0.683, 0.707]
0.260 (74/285)
[0.209, 0.311]
0.475 (252/531)
[0.432, 0.517]
0.674 (1123/1666)
[0.652, 0.697]
0.781 (2499/3199)
[0.767, 0.796]
FP/patientOverall39.0
[30.5, 47.6]
23.4
[18.4, 28.5]
39.9
[35.4, 44.3]
36.1
[32.3, 40.0]
52.8
[39.1, 66.4]
In-sleep26.0
[18.6, 33.4]
17.2
[13.1, 21.4]
28.0
[23.7, 32.3]
25.9
[22.2, 29.5]
31.0
[18.7, 43.4]
MulticlassSensitivityOverall0.622 (3883/6239)
[0.610, 0.634]
0.543 (69/127)
[0.457, 0.630]
0.490 (224/457)
[0.444, 0.536]
0.557 (1092/1960)
[0.535, 0.579]
0.676 (2498/3695)
[0.661, 0.691]
H0.525 (2323/4427)
[0.510, 0.539]
0.540 (67/124)
[0.453, 0.628]
0.476 (198/416)
[0.428, 0.524]
0.508 (868/1710)
[0.484, 0.531]
0.547 (1190/2177)
[0.526, 0.568]
O/A0.869 (1443/1660)
[0.853, 0.886]
0.500 (1/2)
[0.000, 1.000]
1.000 (5/5)
[1.000, 1.000]
0.898 (202/225)
[0.858, 0.937]
0.865 (1235/1428)
[0.847, 0.883]
C/A0.770 (117/152)
[0.703, 0.837]
1.000 (1/1)
[1.000, 1.000]
0.583 (21/36)
[0.422, 0.744]
0.880 (22/25)
[0.753, 1.000]
0.811 (73/90)
[0.730, 0.892]
PPV 0.695 (3883/5585)
[0.683, 0.707]
0.199 (69/347)
[0.157, 0.241]
0.489 (224/458)
[0.443, 0.535]
0.673 (1092/1622)
[0.650, 0.696]
0.791 (2498/3158)
[0.777, 0.805]
FP/patientOverall38.5
[29.9, 47.0]
30.9
[23.7, 38.1]
33.4
[29.3, 37.5]
35.3
[30.3, 40.2]
50.1
[37.0, 63.2]
In-sleep25.3
[17.7, 32.8]
22.2
[16.2, 28.3]
24.1
[20.4, 27.9]
24.7
[20.0, 29.3]
28.7
[16.6, 40.8]
Data are presented as value (numerator/denominator, if applicable) [95% confidence intervals]. PPV, positive predictive value; FP, false-positive detection; H, hypopnea; O/A, obstructive apnea; C/A, central apnea.
Publisher’s Note: MDPI stays neutral with regard to jurisdictional claims in published maps and institutional affiliations.

