
Measuring Repositioning in Home Care for Pressure Injury Prevention and Management

Abstract
:1. Introduction
2. Materials and Methods
2.1. Participants
2.2. System Setup and Data Collection
2.3. Data Processing
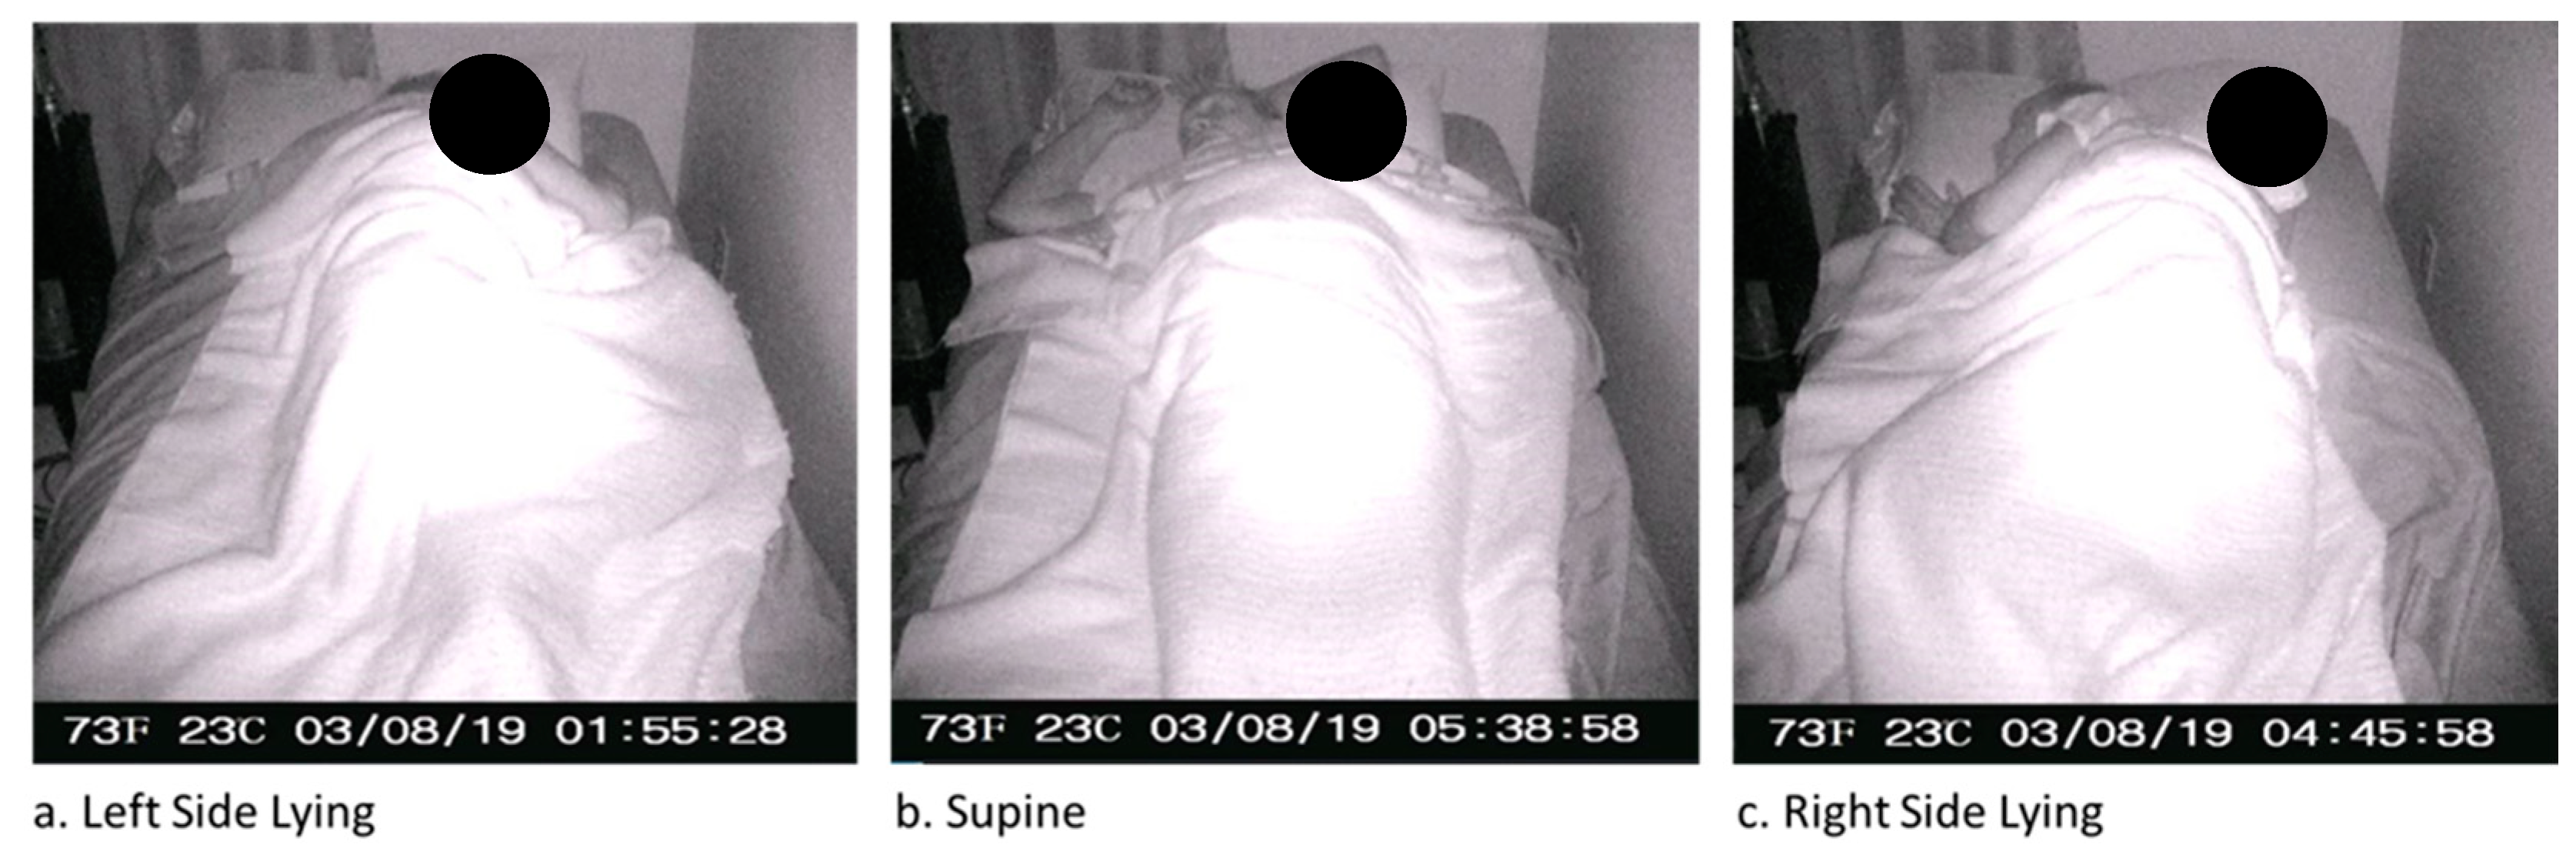
2.4. Ground Truth Participant Position Labels
2.5. Data Analyses
2.5.1. System Accuracy
2.5.2. Incremental Learning
2.5.3. Machine Learning Approach
2.6. Statistical Analyses
2.6.1. Machine Learning Classifiers
2.6.2. Inter-Rater Reliability
3. Results
3.1. Participants
3.2. Machine Learning Models
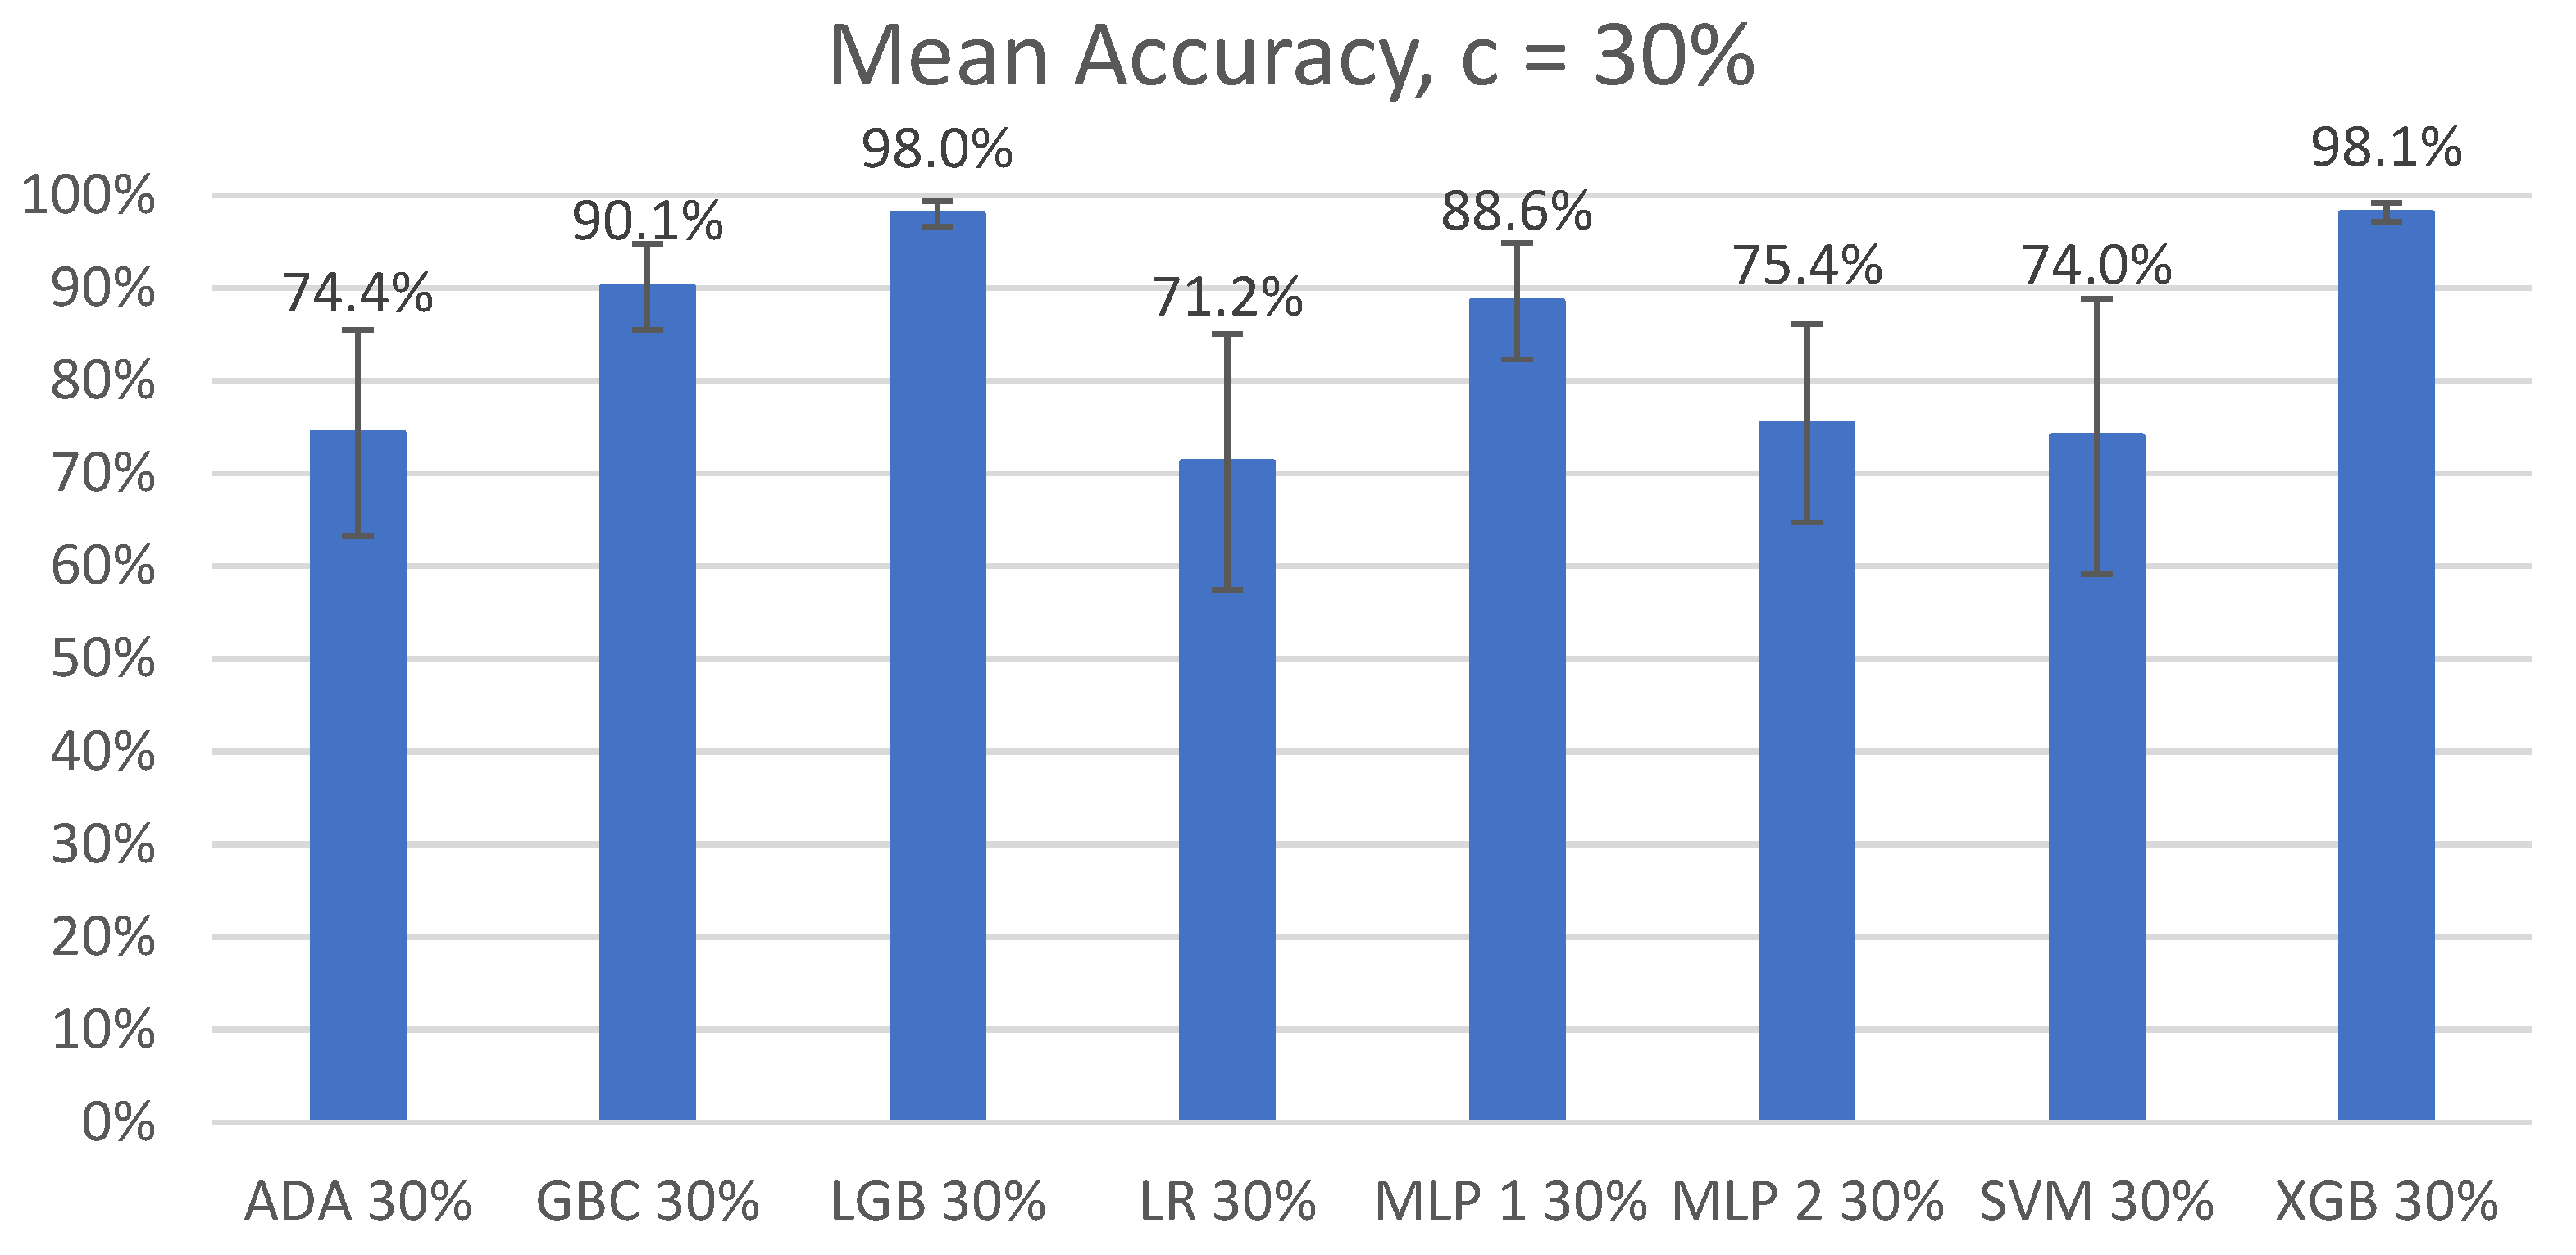
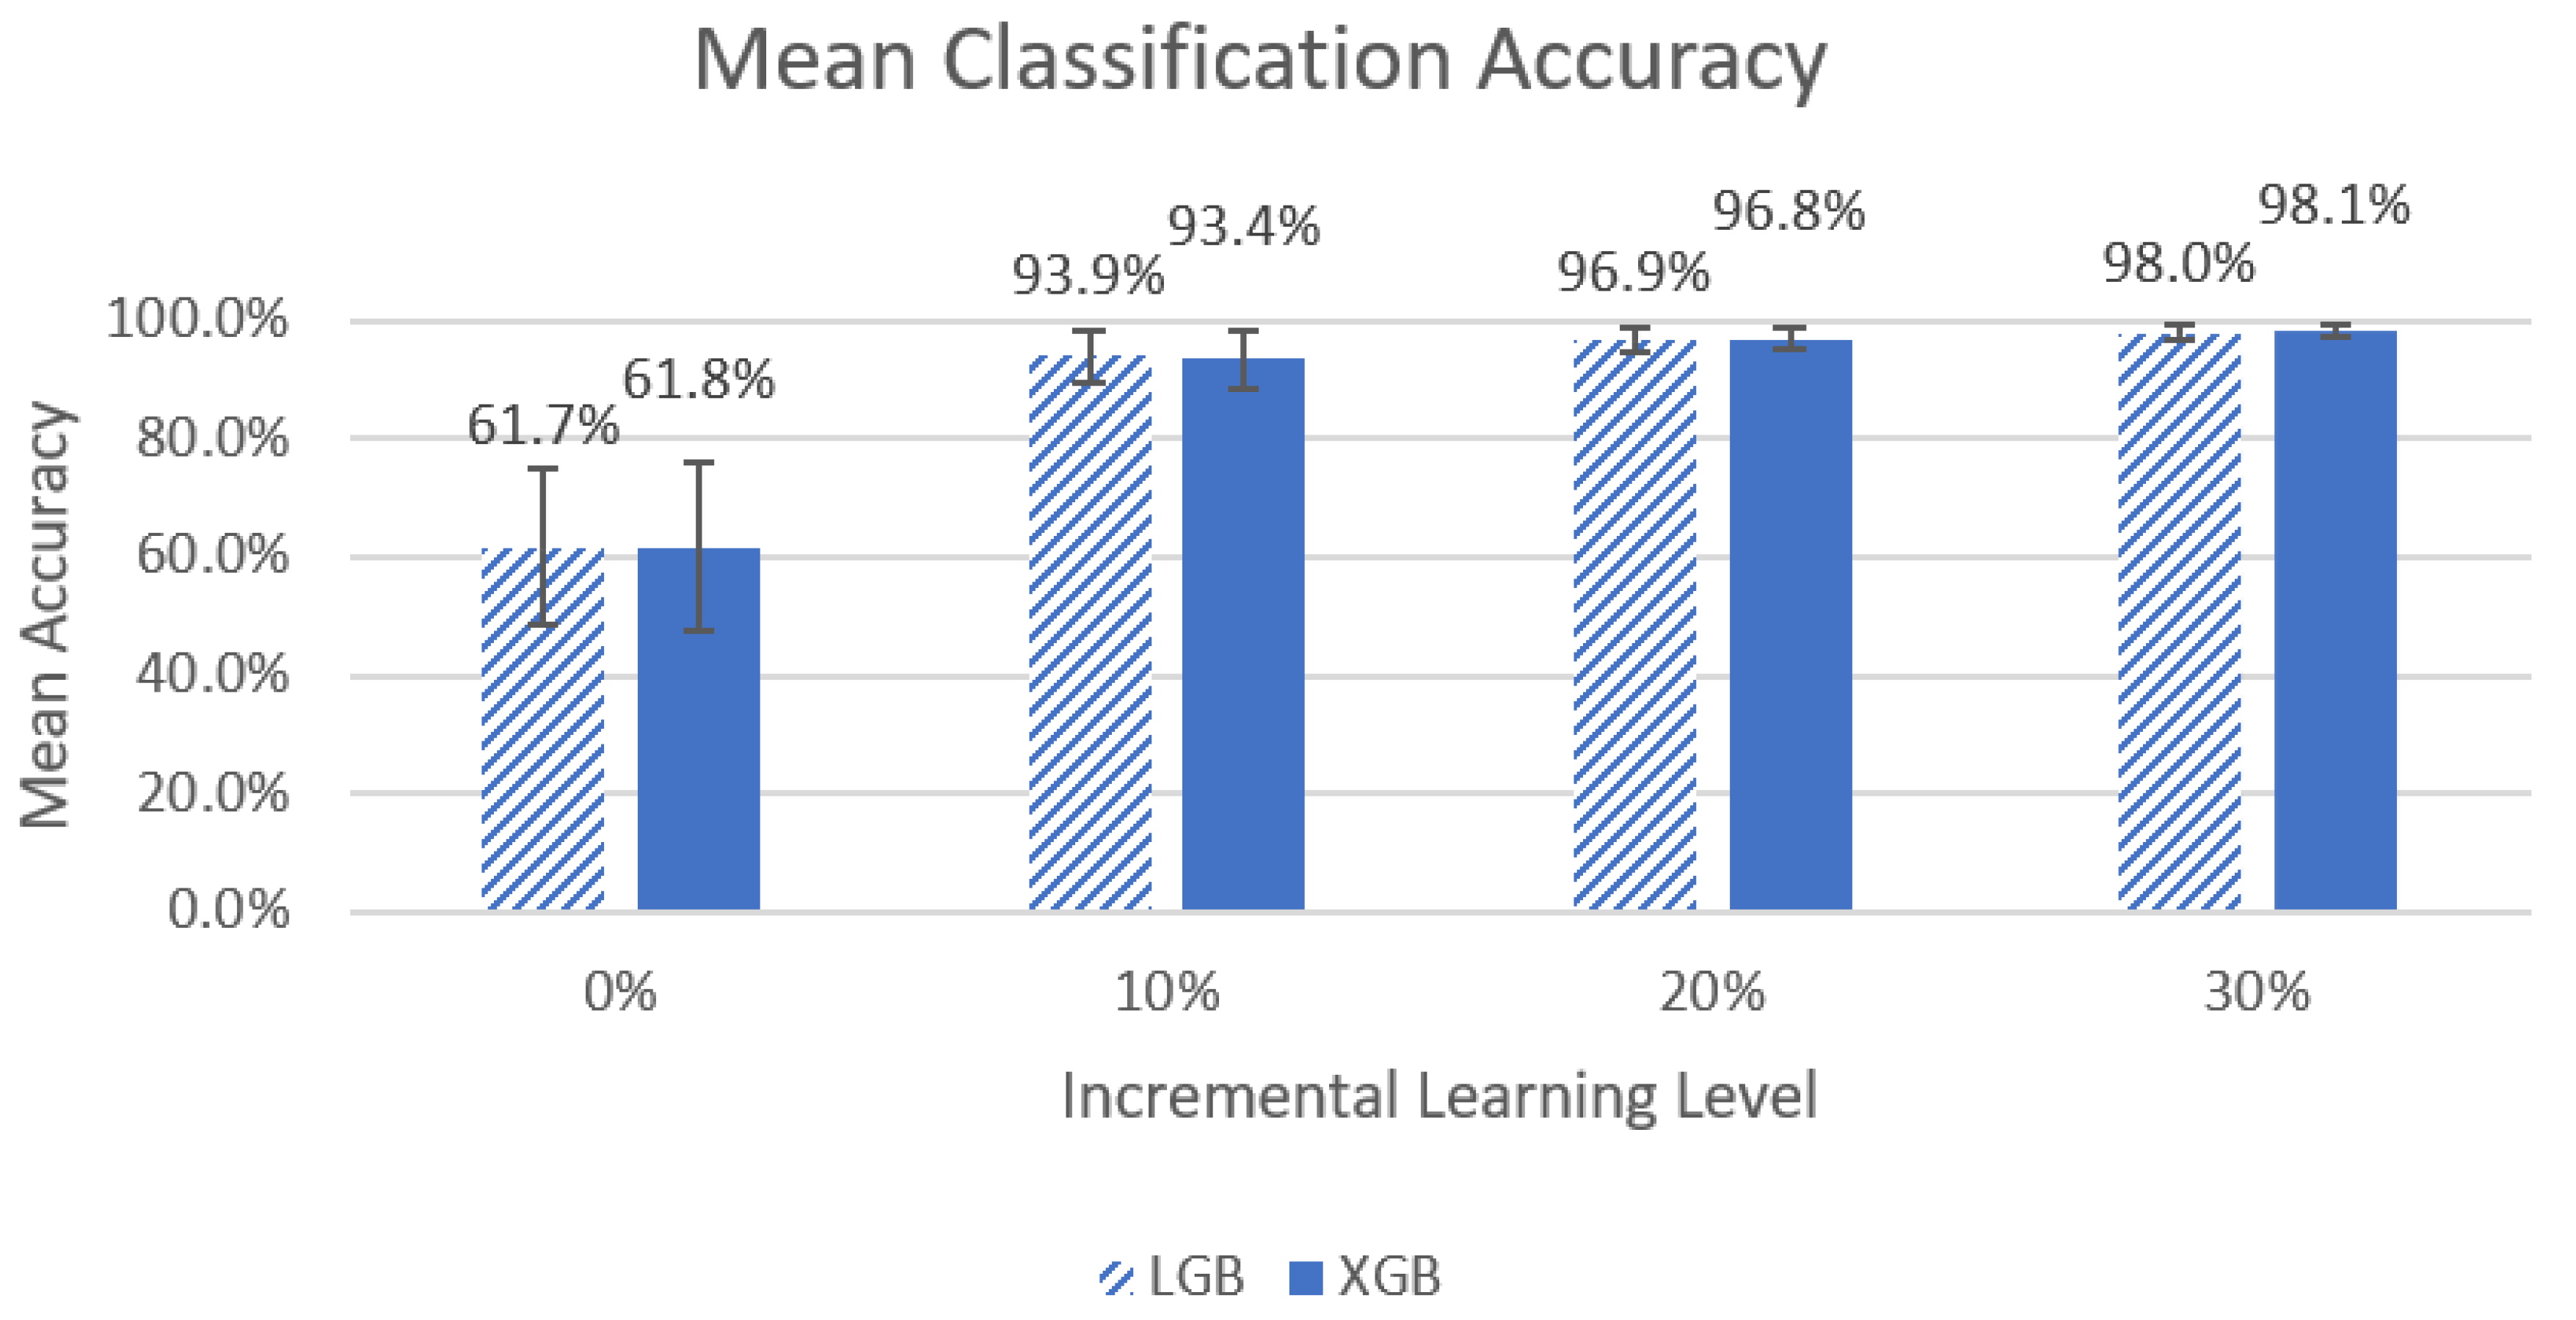
3.2.1. Mean Accuracy
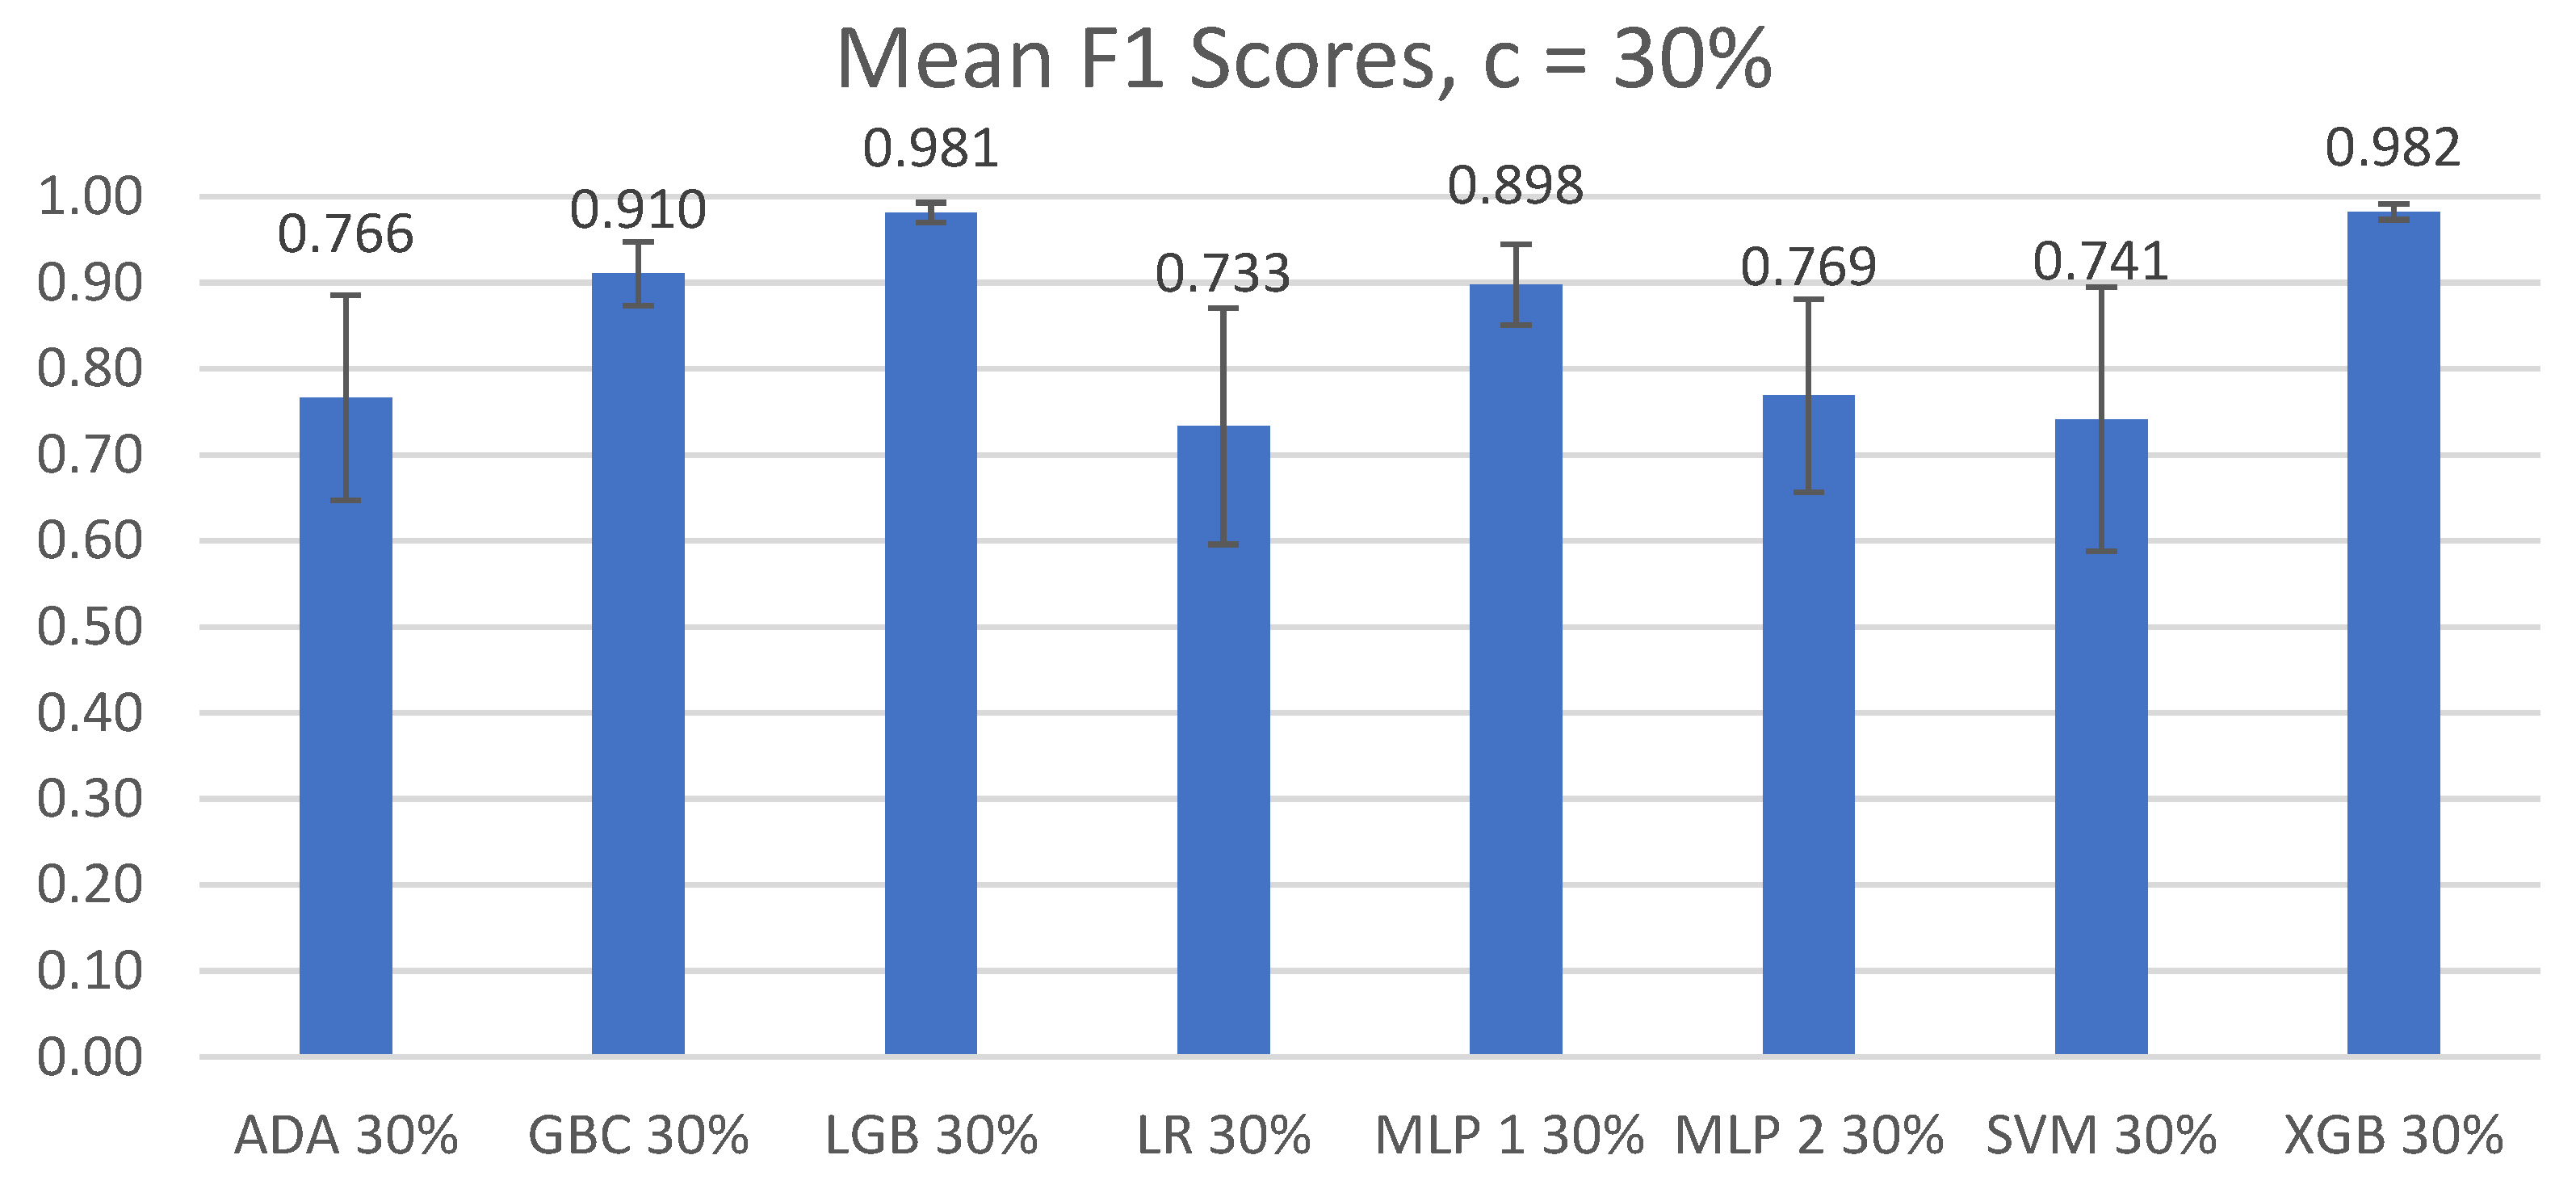
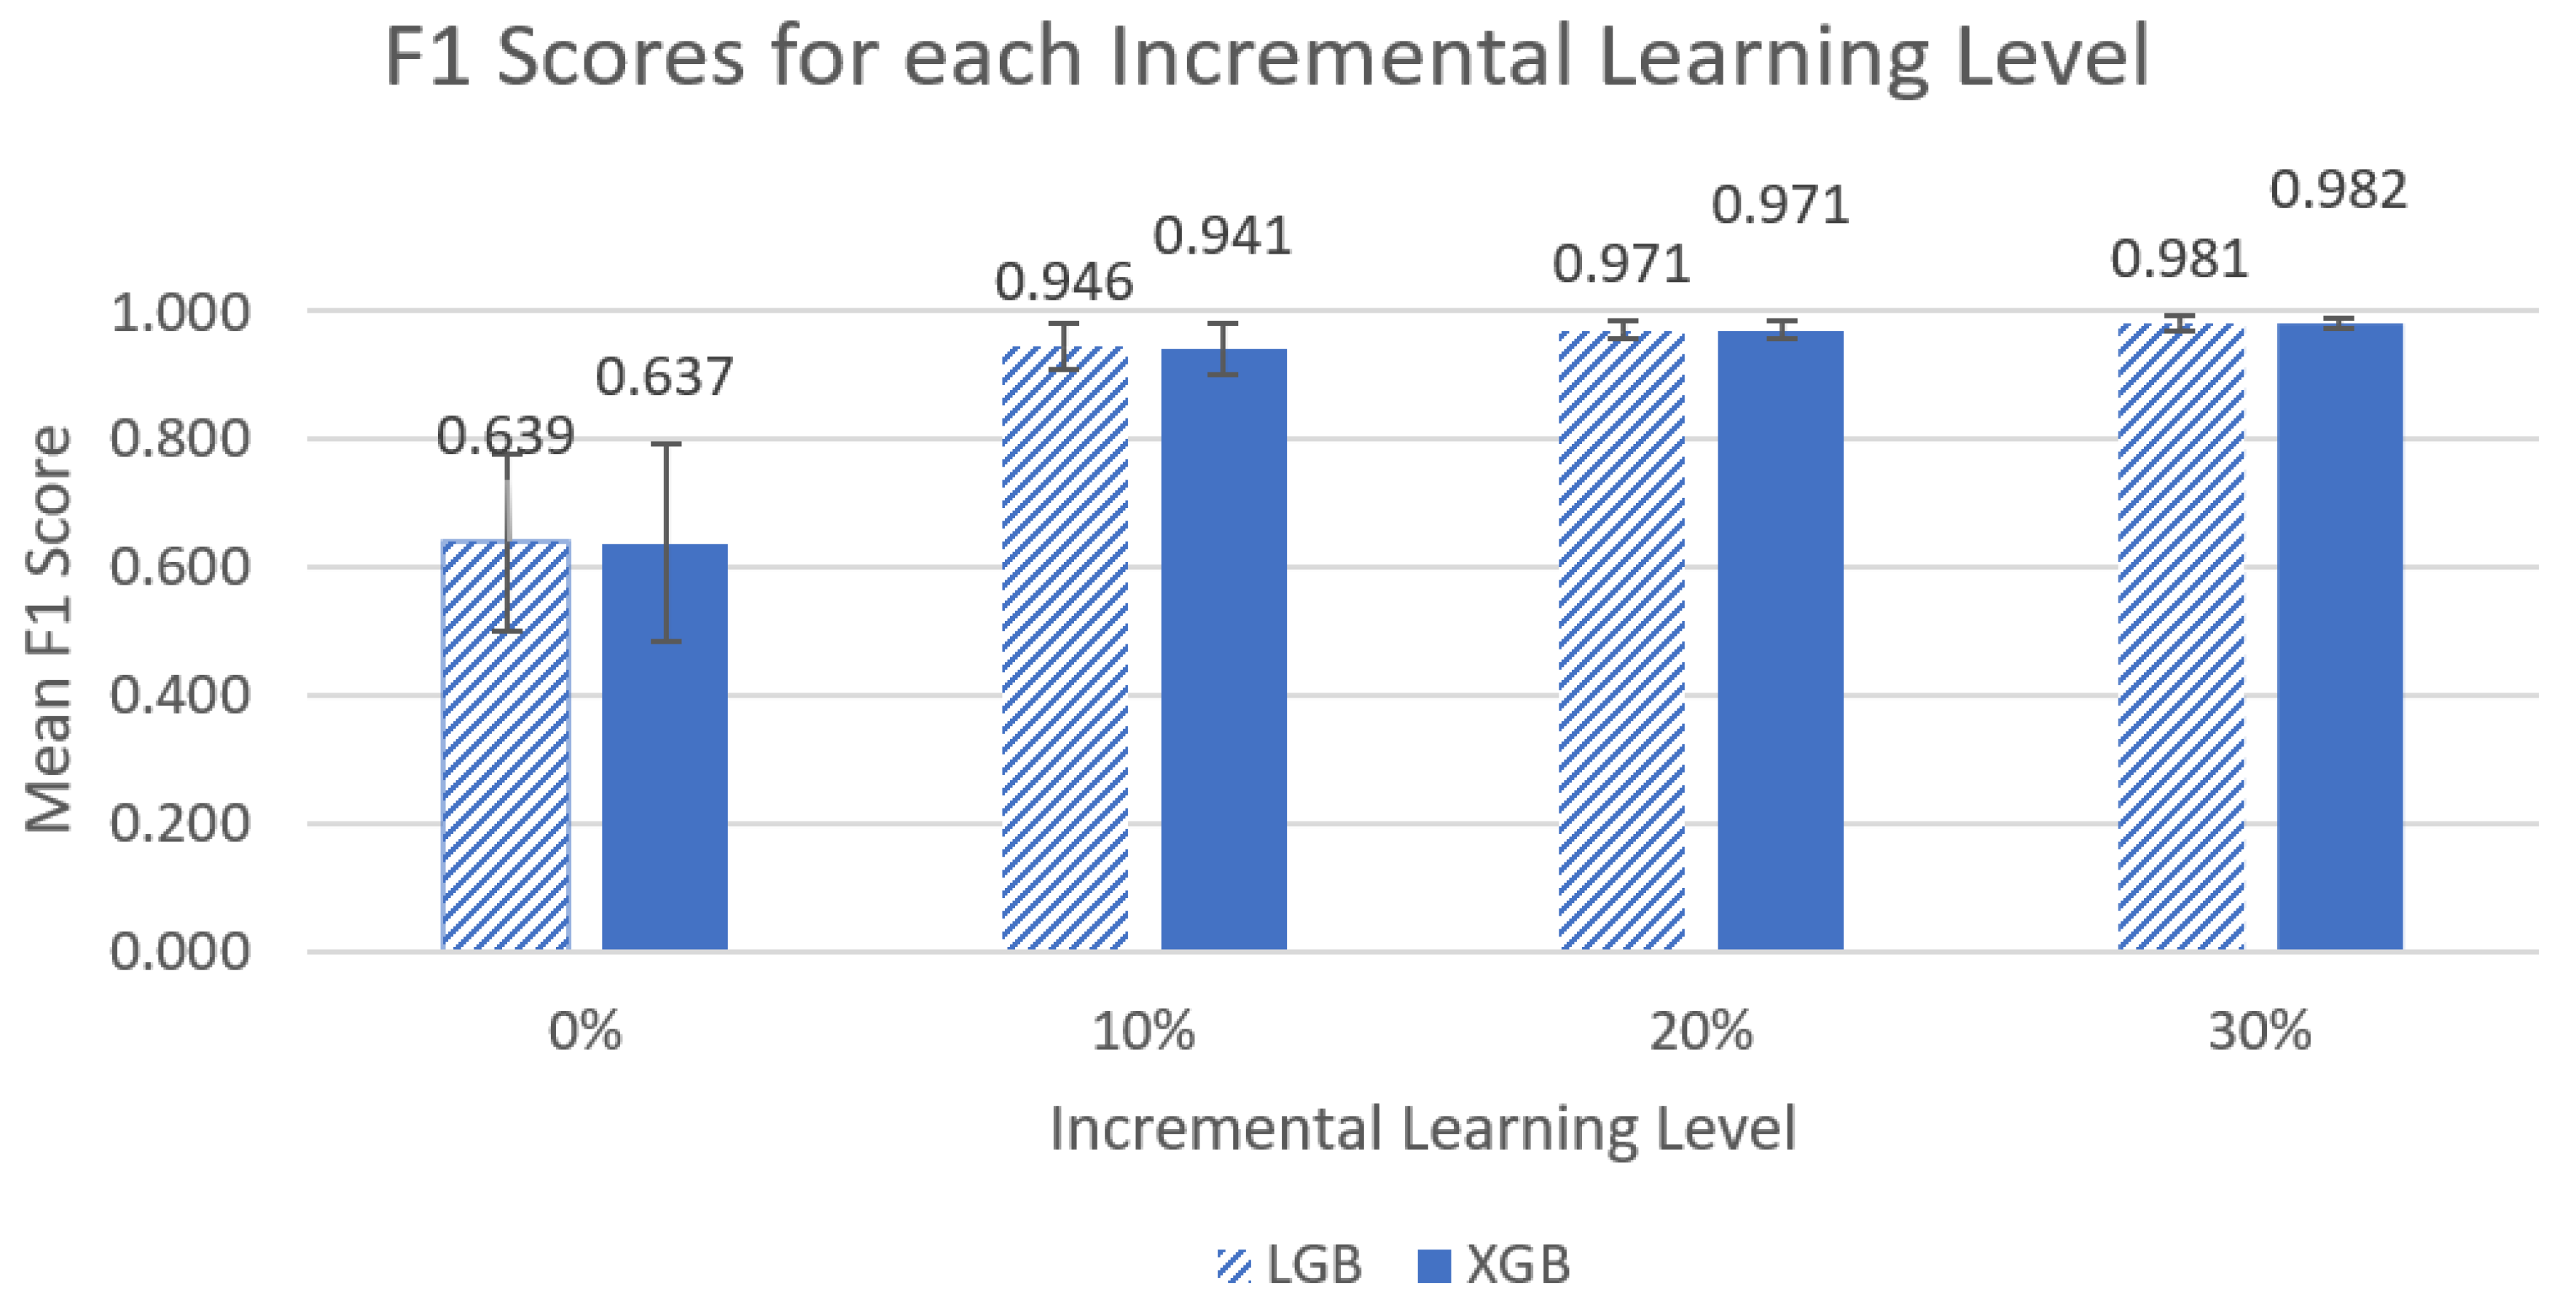
3.2.2. F1 Scores
3.3. Incremental Learning Levels
3.3.1. Mean Accuracy
3.3.2. F1 Scores
3.4. Inter-Rater Reliability
4. Discussion
4.1. Machine Learning Models
4.2. Incremental Learning
4.3. Ground Truth Labelling
4.4. Future Work
5. Conclusions
Author Contributions
Funding
Institutional Review Board Statement
Informed Consent Statement
Data Availability Statement
Acknowledgments
Conflicts of Interest
References
- Gefen, A. The future of pressure ulcer prevention is here: Detecting and targeting inflammation early. EWMA J. 2018, 19, 7–13. [Google Scholar]
- Lee, Y.N.; Kwon, D.Y.; Chang, S.O. Bridging the Knowledge Gap for Pressure Injury Management in Nursing Homes. Int. J. Environ. Res. Public Health 2022, 19, 1400. [Google Scholar] [CrossRef]
- Yamamoto, Y.; Hayashino, Y.; Higashi, T.; Matsui, M.; Yamazaki, S.; Takegami, M.; Miyachi, Y.; Fukuhara, S. Keeping vulnerable elderly patients free from pressure ulcer is associated with high caregiver burden in informal caregivers. J. Eval. Clin. Pract. 2010, 16, 585–589. [Google Scholar] [CrossRef]
- Padula, W.V.; Delarmente, B.A. The national cost of hospital-acquired pressure injuries in the United States. Int. Wound J. 2019, 16, 634–640. [Google Scholar] [CrossRef]
- Registered Nurses’ Association of Ontario. Risk Assessment & Prevention of Pressure Ulcers; Registered Nurses’ Association of Ontario: Toronto, ON, Canada, 2005. [Google Scholar]
- Singh, C.; Shoqirat, N.; Thorpe, L. The Cost of Pressure Injury Prevention. Nurse Lead. 2021, 20, 371–374. [Google Scholar] [CrossRef]
- Norton, L.; Parslow, N.; Johnston, D.; Ho, C.; Afalavi, A.; Mark, M.; O’Sullivan-Drombolis, D.; Moffat, S. Best Practice Recommendations for the Prevention and Management of Pressure Injuries; Canadian Association of Wound Care: Toronto, ON, Canada, 2018. [Google Scholar]
- Black, J.M.; Edsberg, L.E.; Baharestani, M.M.; Langemo, D.; Goldberg, M.; McNichol, L.; Cuddigan, J. Pressure Ulcers: Avoidable or Unavoidable? Results of the National Pressure Ulcer Advisory Panel Consensus Conference. Ostomy Wound Manag. 2011, 57, 24. [Google Scholar]
- Houghton, P.E.; Campbell, K.E. Canadian Best Practice Guidelines for the Prevention and Management of Pressure Ulcers in People with Spinal Cord Injury. A Resource Handbook for Clinicians; Ontario Neurotrauma Foundation: Toronto, ON, Canada, 2013. [Google Scholar]
- Ayello, E.A.; Mezey, M.; Jensen Amelia, E. Educational Assessment and Teaching of Older Clients with Pressure Ulcers. Clin. Geriatr. Med. 1997, 13, 483–496. [Google Scholar] [CrossRef]
- Masek, M.; Lam, C.P.; Tranthim-Fryer, C.; Jansen, B.; Baptist, K. Sleep monitor: A tool for monitoring and categorical scoring of lying position using 3D camera data. SoftwareX 2018, 7, 341–346. [Google Scholar] [CrossRef]
- Alaziz, M.; Jia, Z.; Howard, R.; Lin, X.; Zhang, Y. MotionTree: A Tree-Based In-Bed Body Motion Classification System Using Load-Cells. In Proceedings of the 2nd IEEE/ACM International Conference on Connected Health: Applications, Systems and Engineering Technologies, Philadelphia, PA, USA, 17–19 July 2017; pp. 127–136. [Google Scholar]
- Motamedi, S.M.; De Grood, J.; Harman, S.; Sargious, P.; Baylis, B.; Flemons, W.; Ghali, W.A. The effect of continuous pressure monitoring on strategic shifting of medical inpatients at risk for Pus. J. Wound Care 2012, 21, 517–527. [Google Scholar] [CrossRef]
- Duvall, J.; Karg, P.; Brienza, D.; Pearlman, J. Detection and classification methodology for movements in the bed that supports continuous pressure injury risk assessment and repositioning compliance. J. Tissue Viability 2019, 28, 7–13. [Google Scholar] [CrossRef]
- Beattie, Z.T.; Hagen, C.C.; Hayes, T.L. Classification of lying position using load cells under the bed. In Proceedings of the 2011 Annual International Conference of the IEEE Engineering in Medicine and Biology Society, Boston, MA, USA, 30 August–3 September 2011; Volume 2011, pp. 474–477. [Google Scholar]
- Behrendt, R.; Ghaznavi, A.M.; Mahan, M.; Craft, S.; Siddiqui, A. Continuous bedside pressure mapping and rates of hospital-associated pressure ulcers in a medical intensive care unit. Am. J. Crit. Care 2014, 23, 127–133. [Google Scholar] [CrossRef] [PubMed]
- Tamura, T.; Zhou, J.; Mizukami, H.; Togawa, T. A system for monitoring temperature distribution in bed and its application to the assessment of body movement. Physiol. Meas. 1993, 14, 33–41. [Google Scholar] [CrossRef] [PubMed]
- Renganathan, B.S.; Preejith, S.P.; Nagaiyan, S.; Jayaraj, J.; Mohanasankar, S. A novel system to tackle hospital acquired pressure ulcers. In Proceedings of the 38th Annual International Conference of the IEEE Engineering in Medicine and Biology Society (EMBC), Orlando, FL, USA, 16–20 August 2016; pp. 4780–4783. [Google Scholar]
- Kido, K.; Tamura, T.; Ono, N.; Altaf-Ul-Amin, M.D.; Sekine, M.; Kanaya, S.; Huang, M. A Novel CNN-Based Framework for Classification of Signal Quality and Sleep Position from a Capacitive ECG Measurement. Sensors 2019, 19, 1731. [Google Scholar] [CrossRef] [PubMed]
- Wong, G.; Gabison, S.; Dolatabadi, E.; Evans, G.; Kajaks, T.; Holliday, P.; Alshaer, H.; Fernie, G.; Dutta, T. Toward Mitigating Pressure Injuries: Detecting Patient Orientation from Vertical Bed Reaction Forces. J. Rehabil. Assist. Technol. Eng. 2020, 7, 2055668320912168. [Google Scholar] [CrossRef] [PubMed]
- Pupic, N.; Gabison, S.; Evans, G.; Dolatabadi, E.; Fernie, G.; Dutta, T. Detecting Patient Position Using Bed-Reaction Forces and Monitoring Skin-Bed Interface Forces for Pressure Injury Prevention and Management. medRxiv 2022. [Google Scholar] [CrossRef]
- Viera, A.J.; Garrett, J.M. Understanding Interobserver Agreement: The Kappa Statistic. Fam. Med. 2005, 37, 360–363. [Google Scholar] [PubMed]
- Registered Nurses’ Association of Ontario. Assessment and Management of Pressure Injuries for the Interprofessional Team, 3rd ed.; Registered Nurses’ Association of Ontario: Toronto, ON, Canada, 2016. [Google Scholar]


| Feature | Description |
|---|---|
| mean CoM_x | The mean of CoM_x parallel to the width of the bed |
| meanCoM_y | The mean of CoM_y parallel to the length of the bed |
| ratio_meanCoM | The quotient of meanCoM_y divided by CoM_x |
| stdCoM_x | The standard deviation of CoM_x |
| stdCoM_y | The standard deviation of CoM_y |
| ratio_stdCoM | The quotient of stdCoM_y divided by stdCoM_x |
| CoM_resp_ANG | CoM angle during inhalation phase only, averaged for all occurrences |
| stdCoM_resp_ANG | Standard deviation of CoM_resp_ANG |
| rmsCoM_resp_x | The root mean square of the x-component of CoM_resp during both inhale and exhale phases, normalized to the 97th percentile |
| rmsCoM_resp_y | The root mean square of the y-component of CoM_resp during both inhale and exhale phases, normalized to the 97th percentile |
| ratio_rmsCoM_resp | The quotient of rmsCoM_resp_y divided by rmsCoM_resp_x |
| rmsPulse | The root mean square of the load cell signals filtered to capture changes from the cardiac cycle |
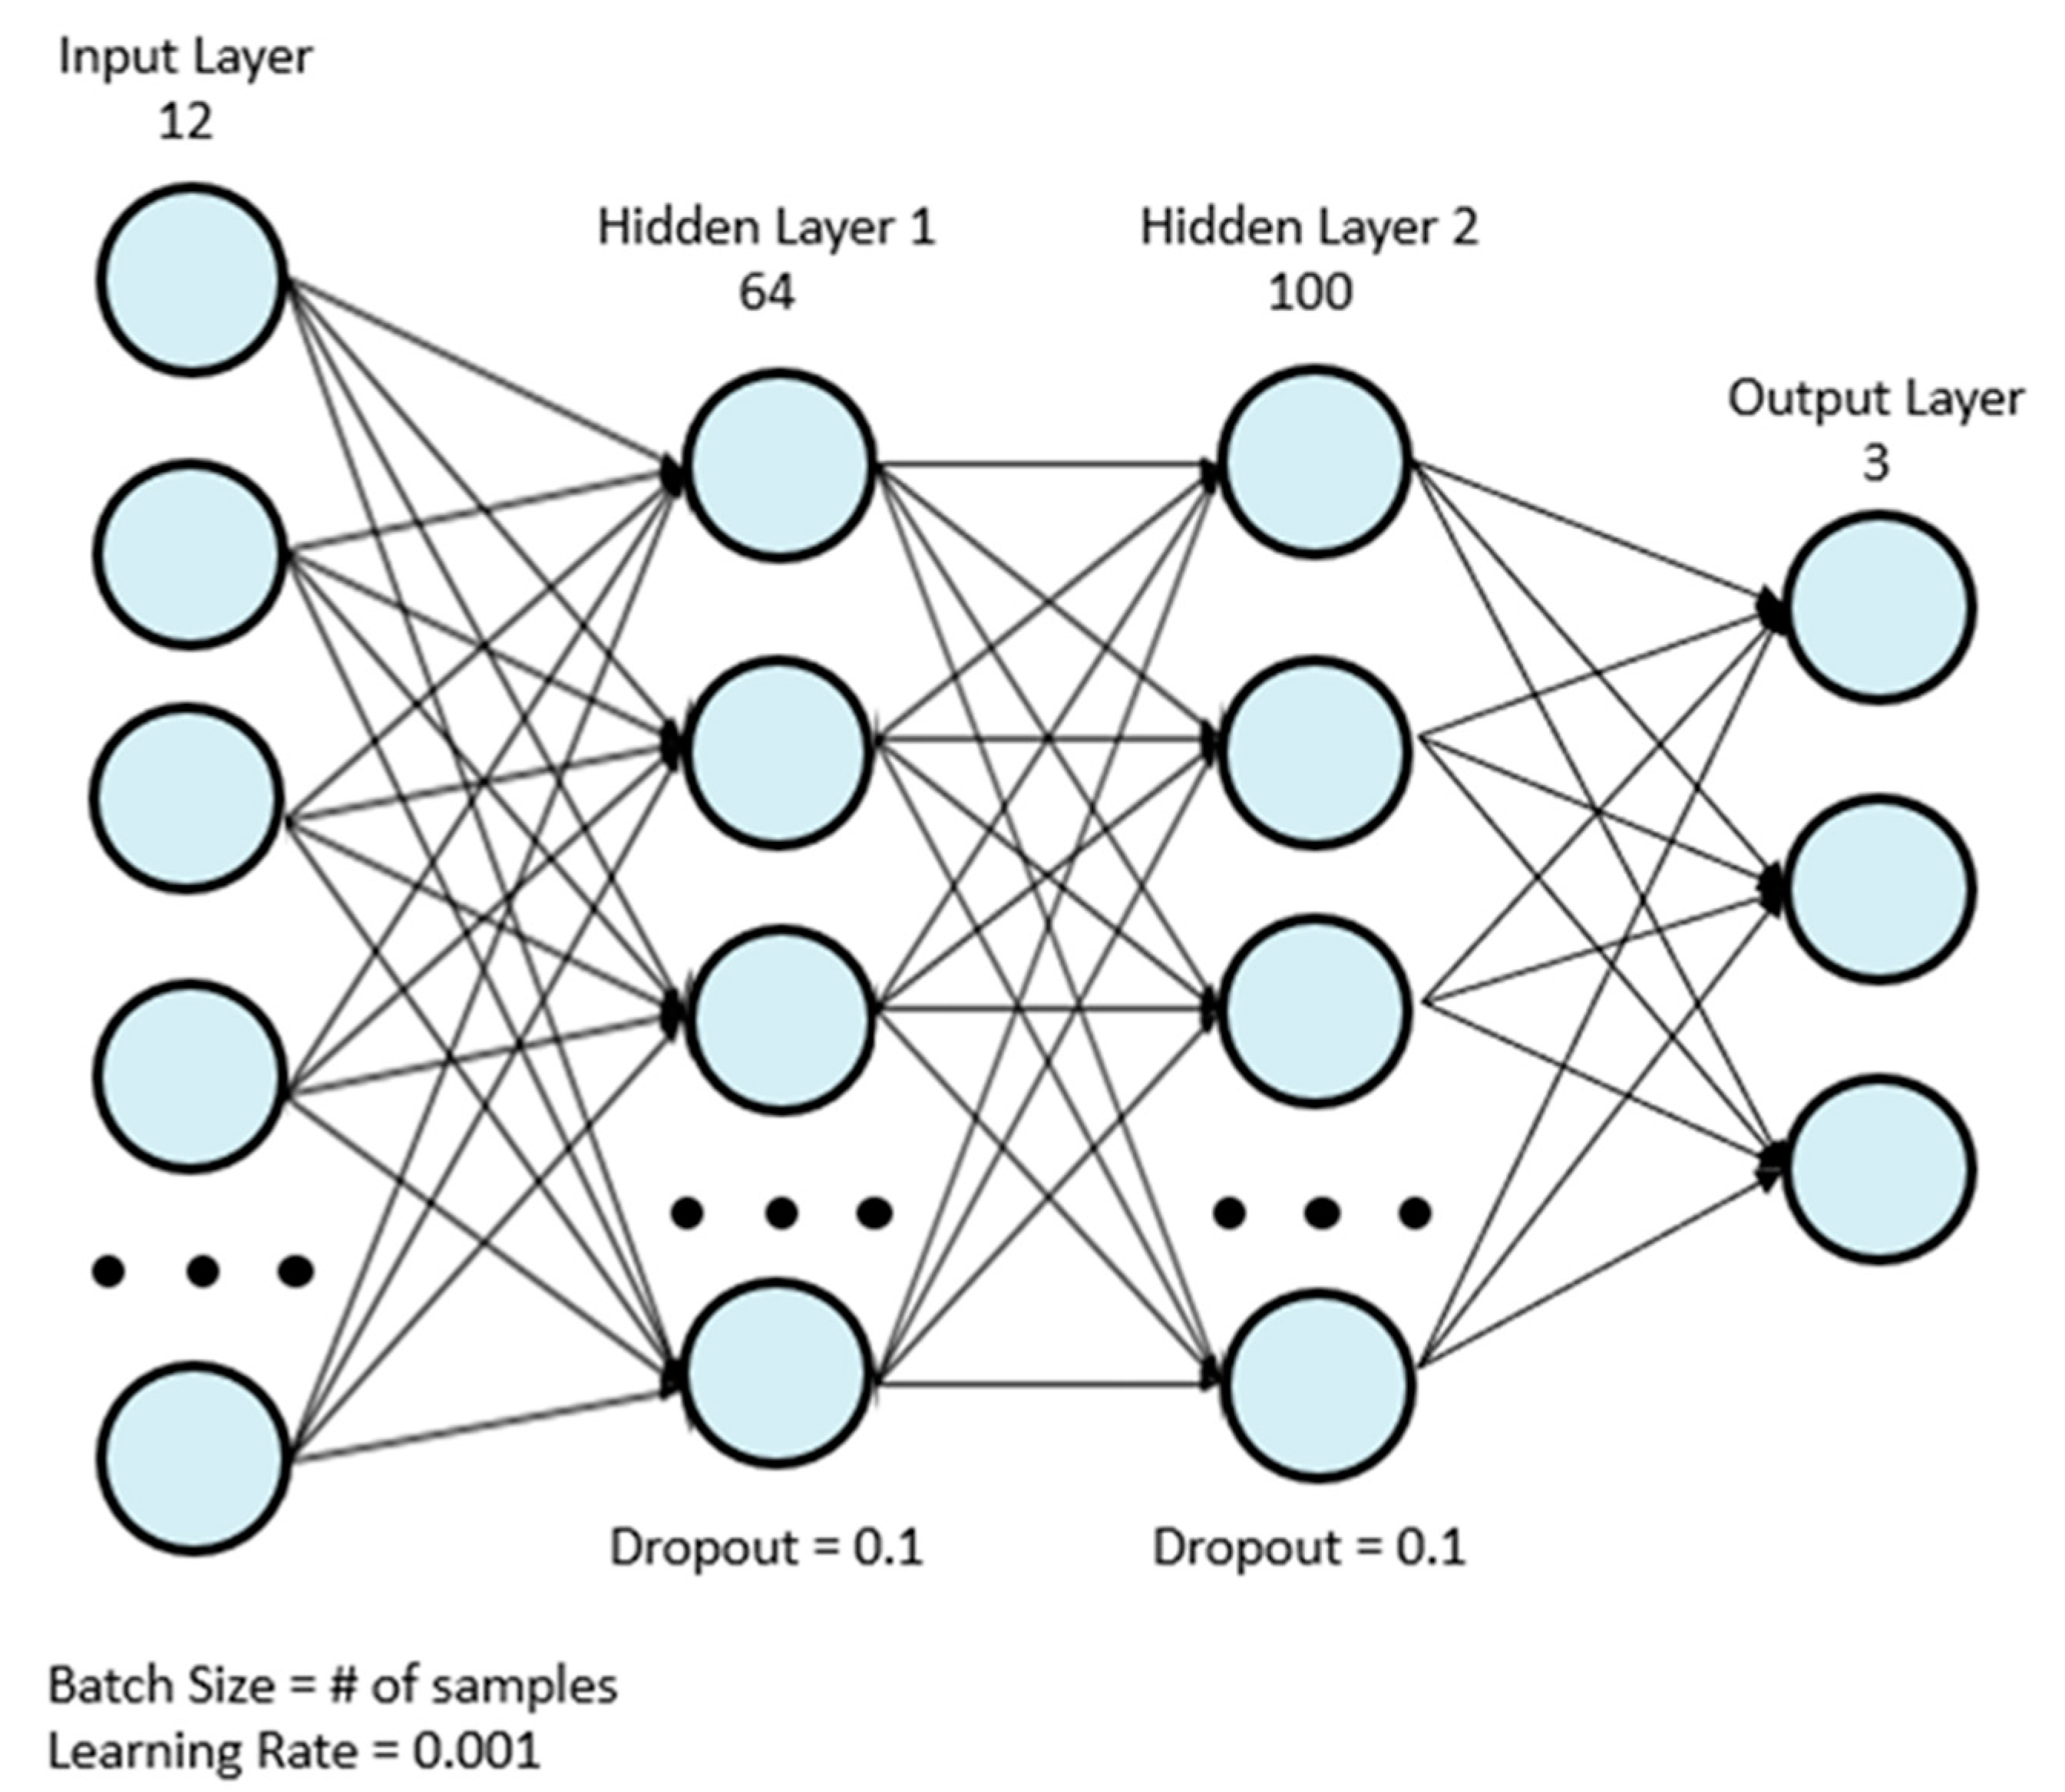
| Layer | Number of Nodes | Activation Function |
|---|---|---|
| Input | 12 | ReLu |
| Fully Connected 1 | 64 | ReLu |
| Dropout | N/A | N/A |
| Batch Normalization | N/A | N/A |
| Fully Connected 2 | 100 | ReLu |
| Dropout | N/A | N/A |
| Batch Normalization | N/A | N/A |
| Output | 3 | Softmax |
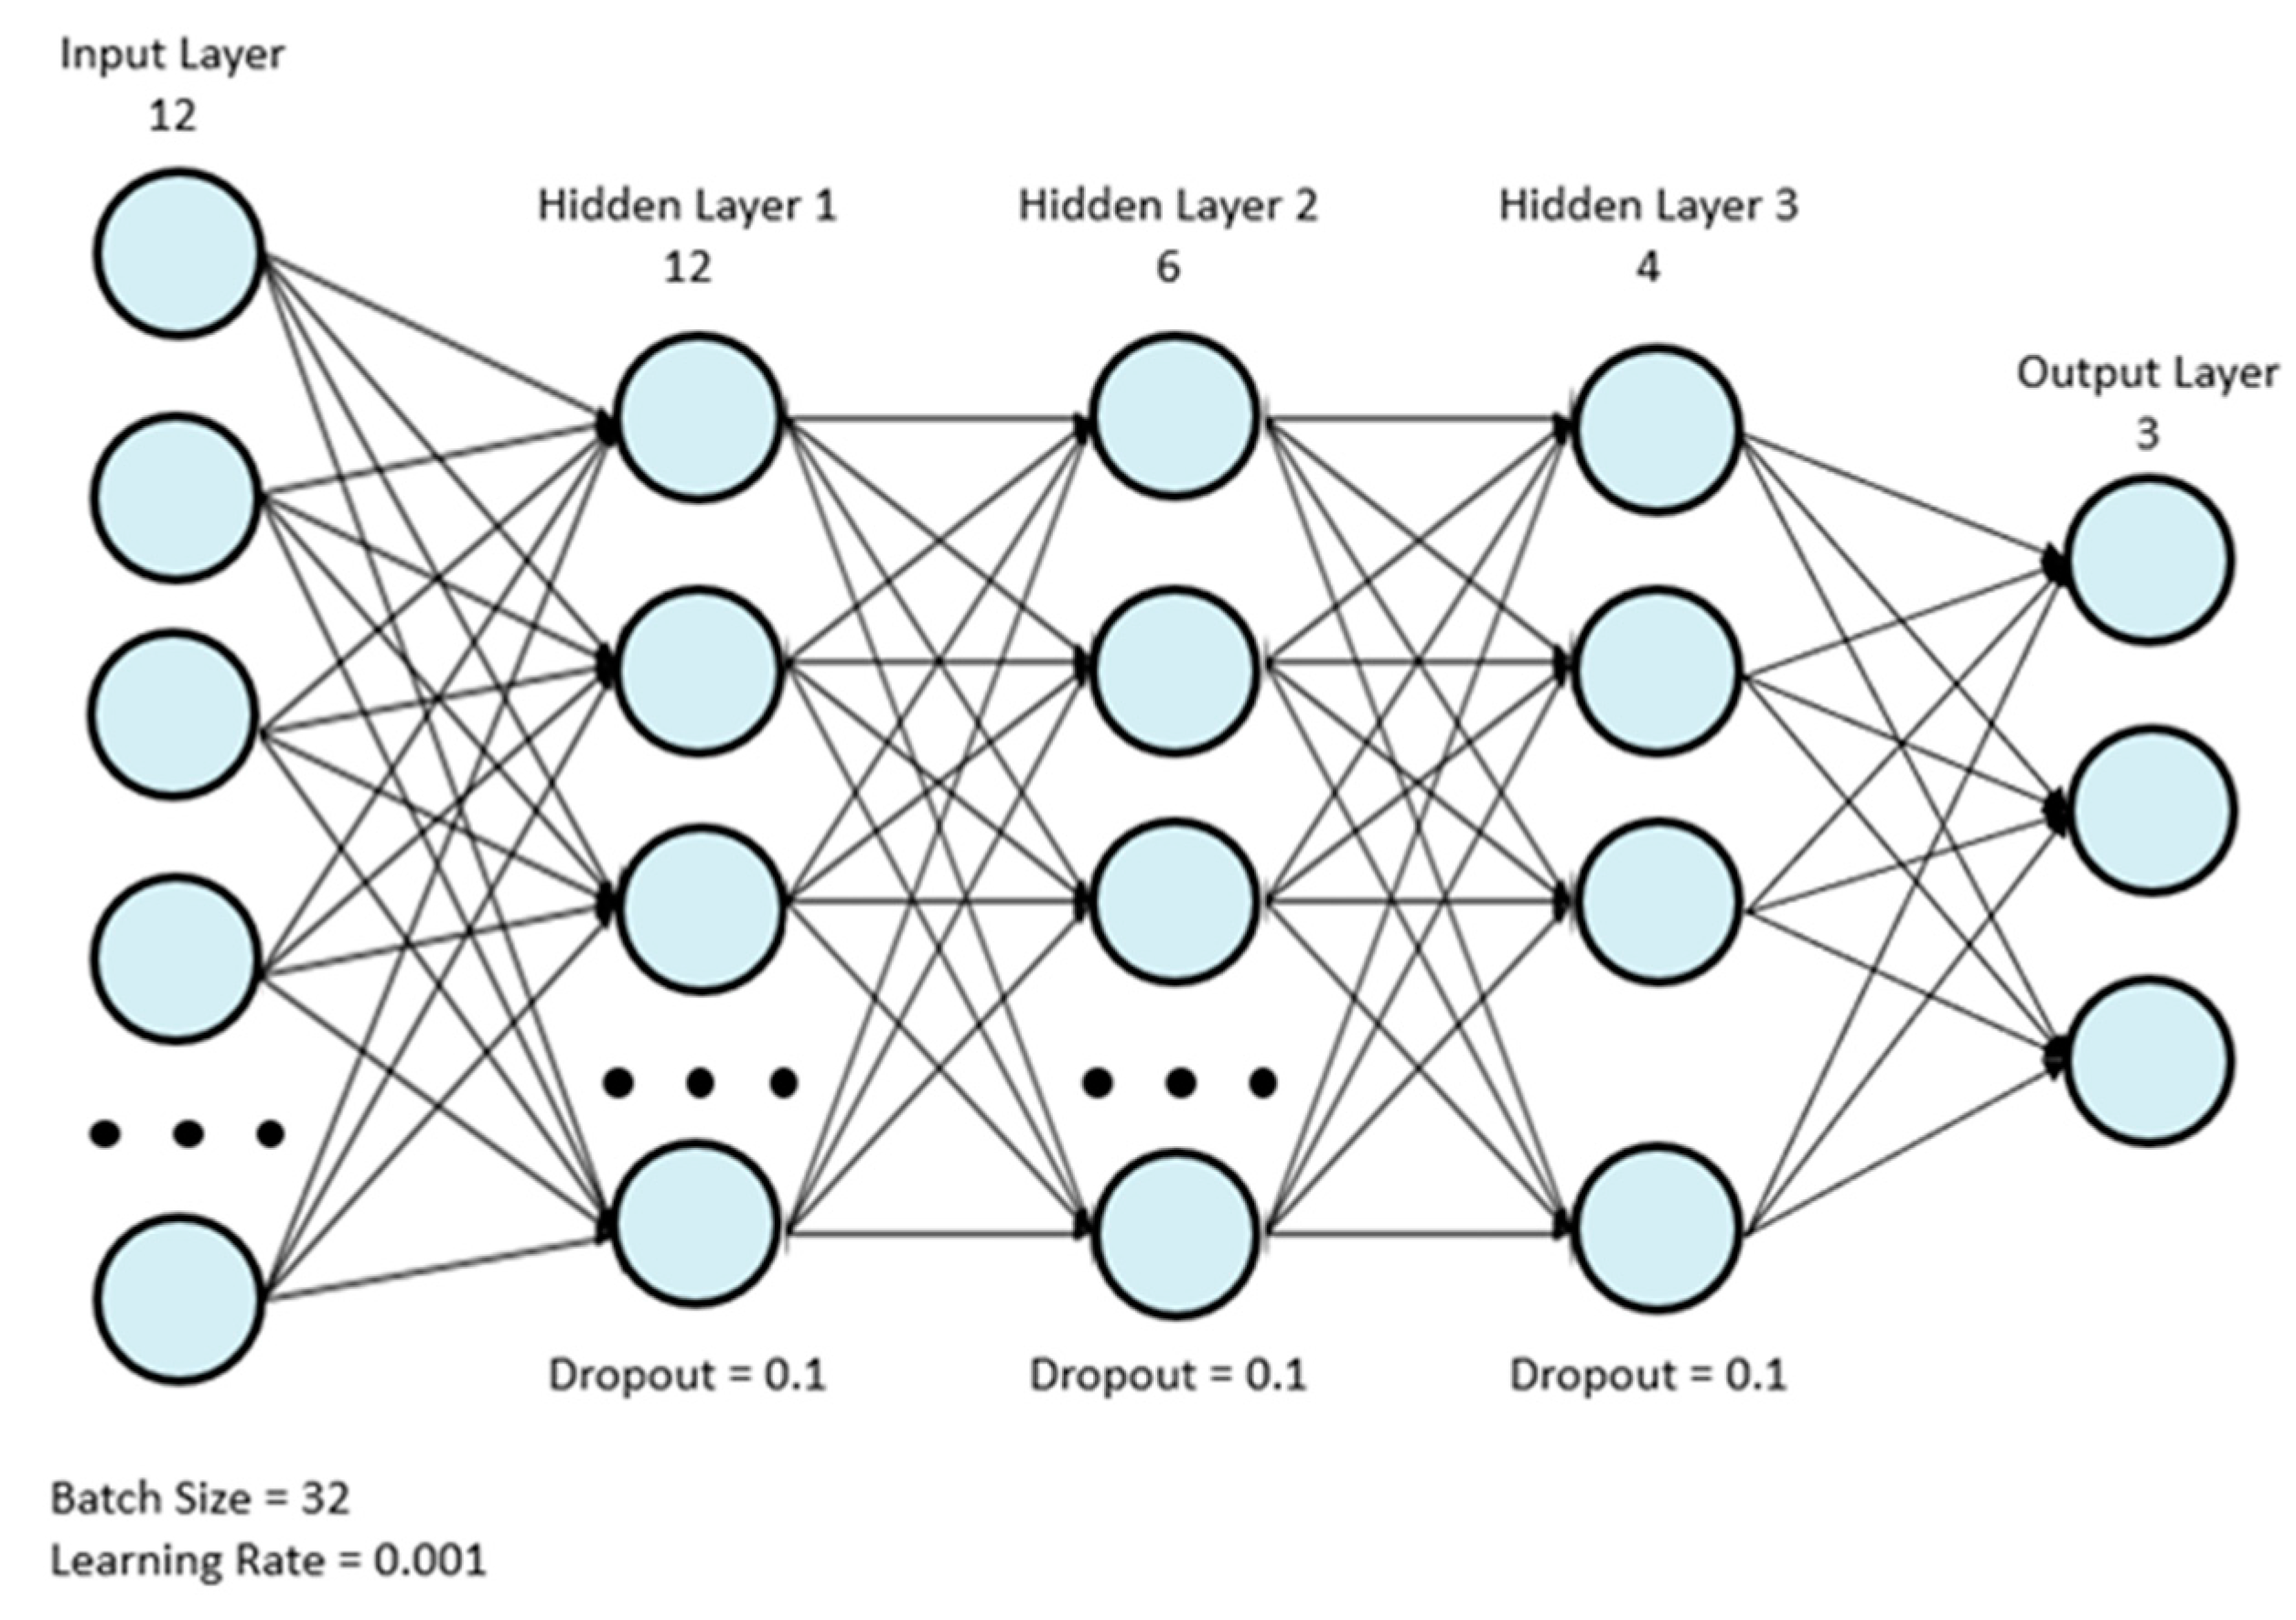
| Layer | Number of Nodes | Activation Function |
|---|---|---|
| Input | 12 | ReLu |
| Fully Connected 1 | 12 | ReLu |
| Dropout | N/A | N/A |
| Batch Normalization | N/A | N/A |
| Fully Connected 2 | 6 | ReLu |
| Dropout | N/A | N/A |
| Batch Normalization | N/A | N/A |
| Fully Connected 3 | 4 | ReLu |
| Dropout | N/A | N/A |
| Batch Normalization | N/A | N/A |
| Output | 3 | Softmax |
| Participant | Sex (M/F) | Age Range (years) | Height (cm) | Weight (kg) | BMI (kg/m2) |
|---|---|---|---|---|---|
| 1 | M | 70–79 | 171.5 | 70.0 | 23.9 |
| 2 | F | 70–79 | 160.0 | 56.8 | 22.1 |
| 3 | F | 70–79 | 170.0 | 61.3 | 21.2 |
| 4 | M | 30–39 | 180.3 | 84.1 | 25.9 |
| 5 | F | 50–59 | 157.0 | 85.0 | 34.5 |
| 6 | M | 20–29 | 167.0 | 69.5 | 24.5 |
| 7 | F | 60–69 | 156.0 | 61.4 | 25.2 |
| 8 | F | 60–69 | 162.0 | 54.4 | 20.7 |
| 9 | M | 60–69 | 181.0 | 80.5 | 24.5 |
| Model | c = 0% | c = 10% | c = 20% | c = 30% |
|---|---|---|---|---|
| ADA | 62.27% ± 15.44% | 66.68% ± 12.21% | 71.86% ± 10.33% | 74.37% ± 11.09% |
| GBC | 62.27% ± 13.45% | 79.09% ± 8.66% | 84.98% ± 6.33% | 90.13% ± 4.64% |
| LGB | 61.68% ± 13.25% | 93.94% ± 4.52% | 96.86% ± 2.00% | 97.99% ± 1.42% |
| LR | 67.77% ± 16.01% | 69.05% ± 15.05% | 70.18% ± 14.34% | 71.23% ± 13.81% |
| MLP | 67.92% ± 14.95% | 69.35% ± 17.90% | 73.06% ± 15.29% | 75.40% ± 10.68% |
| OG | 64.11% ± 16.01% | 78.25% ± 10.91% | 85.69% ± 6.70% | 88.58% ± 6.27% |
| SVM | 71.25% ± 15.84% | 72.21% ± 15.54% | 73.09% ± 15.21% | 74.01% ± 14.85% |
| XGB | 61.75% ± 14.02% | 93.40% ± 5.12% | 96.83% ± 1.82% | 98.12% ± 1.03% |
| Model | c = 0% | c = 10% | c = 20% | c = 30% |
|---|---|---|---|---|
| ADA | 0.654 ± 0.153 | 0.697 ± 0.1240 | 0.7436 ± 0.1100 | 0.766 ± 0.1190 |
| GBC | 0.650 ± 0.147 | 0.808 ± 0.0813 | 0.8637 ± 0.0578 | 0.910 ± 0.0369 |
| LGB | 0.639 ± 0.138 | 0.946 ± 0.0361 | 0.9713 ± 0.0152 | 0.981 ± 0.0116 |
| LR | 0.695 ± 0.168 | 0.710 ± 0.1540 | 0.7225 ± 0.1440 | 0.733 ± 0.1370 |
| MLP | 0.695 ± 0.153 | 0.708 ± 0.1880 | 0.7441 ± 0.1500 | 0.769 ± 0.1120 |
| OG | 0.662 ± 0.161 | 0.802 ± 0.0901 | 0.8728 ± 0.0494 | 0.898 ± 0.0470 |
| SVM | 0.713 ± 0.167 | 0.723 ± 0.1640 | 0.7317 ± 0.1590 | 0.741 ± 0.1540 |
| XGB | 0.637 ± 0.154 | 0.941 ± 0.0403 | 0.9707 ± 0.0144 | 0.982 ± 0.0030 |
| Participant | Left-Side (κ) | Supine (κ) | Right-Side (κ) | Combined (κ) | n |
|---|---|---|---|---|---|
| 1 | 0.998 | 0.997 | 0.988 | 0.991 | 1754 |
| 2 | 0.990 | 0.984 | 0.998 | 0.988 | 1684 |
| 3 | - | 0.970 | 0.975 | 0.945 | 1435 |
| 4 | 0.997 | 0.836 | 0.961 | 0.934 | 996 |
| 5 | 1.000 | 0.984 | 0.996 | 0.994 | 1419 |
| 6 | 0.999 | 0.989 | 1.000 | 0.995 | 1944 |
| 7 | 0.999 | 0.769 | 0.974 | 0.959 | 820 |
| 8 | 1.000 | 0.859 | 0.861 | 0.880 | 1295 |
| 9 | 1.000 | 1.000 | 1.000 | 1.000 | 737 |
| Overall (κ) | 0.960 | 0.969 | 0.948 | 0.935 | 12,084 |
Publisher’s Note: MDPI stays neutral with regard to jurisdictional claims in published maps and institutional affiliations. |
© 2022 by the authors. Licensee MDPI, Basel, Switzerland. This article is an open access article distributed under the terms and conditions of the Creative Commons Attribution (CC BY) license (https://creativecommons.org/licenses/by/4.0/).
Share and Cite
Gabison, S.; Pupic, N.; Evans, G.; Dolatabadi, E.; Dutta, T. Measuring Repositioning in Home Care for Pressure Injury Prevention and Management. Sensors 2022, 22, 7013. https://doi.org/10.3390/s22187013
Gabison S, Pupic N, Evans G, Dolatabadi E, Dutta T. Measuring Repositioning in Home Care for Pressure Injury Prevention and Management. Sensors. 2022; 22(18):7013. https://doi.org/10.3390/s22187013
Chicago/Turabian StyleGabison, Sharon, Nikola Pupic, Gary Evans, Elham Dolatabadi, and Tilak Dutta. 2022. "Measuring Repositioning in Home Care for Pressure Injury Prevention and Management" Sensors 22, no. 18: 7013. https://doi.org/10.3390/s22187013
APA StyleGabison, S., Pupic, N., Evans, G., Dolatabadi, E., & Dutta, T. (2022). Measuring Repositioning in Home Care for Pressure Injury Prevention and Management. Sensors, 22(18), 7013. https://doi.org/10.3390/s22187013