
Comparison of Pedestrian Detectors for LiDAR Sensor Trained on Custom Synthetic, Real and Mixed Datasets


Abstract
:1. Introduction
2. Related Works
3. Methodology and Methods
Pedestrian Detection in Autonomous Driving Systems for Vehicles
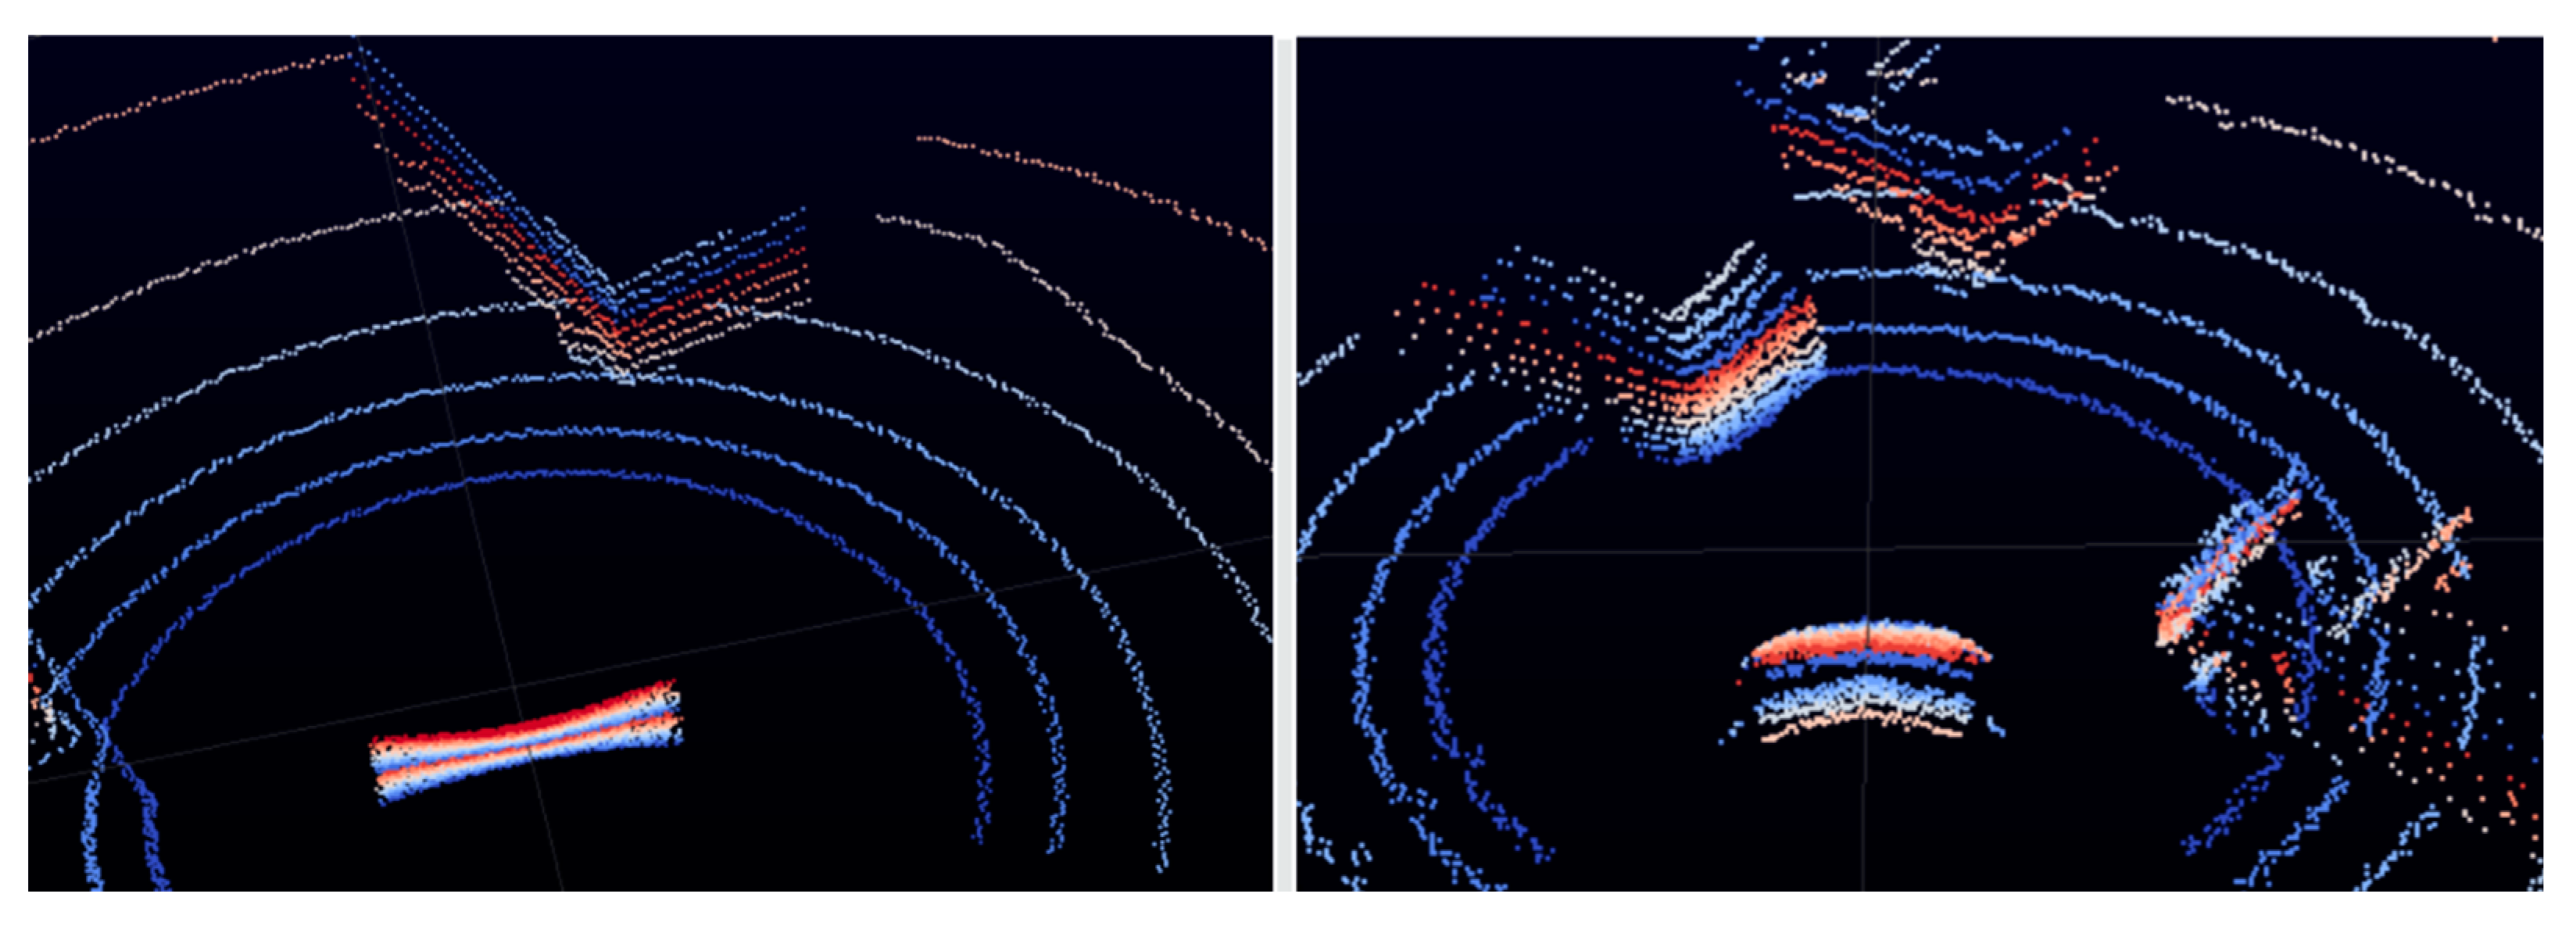
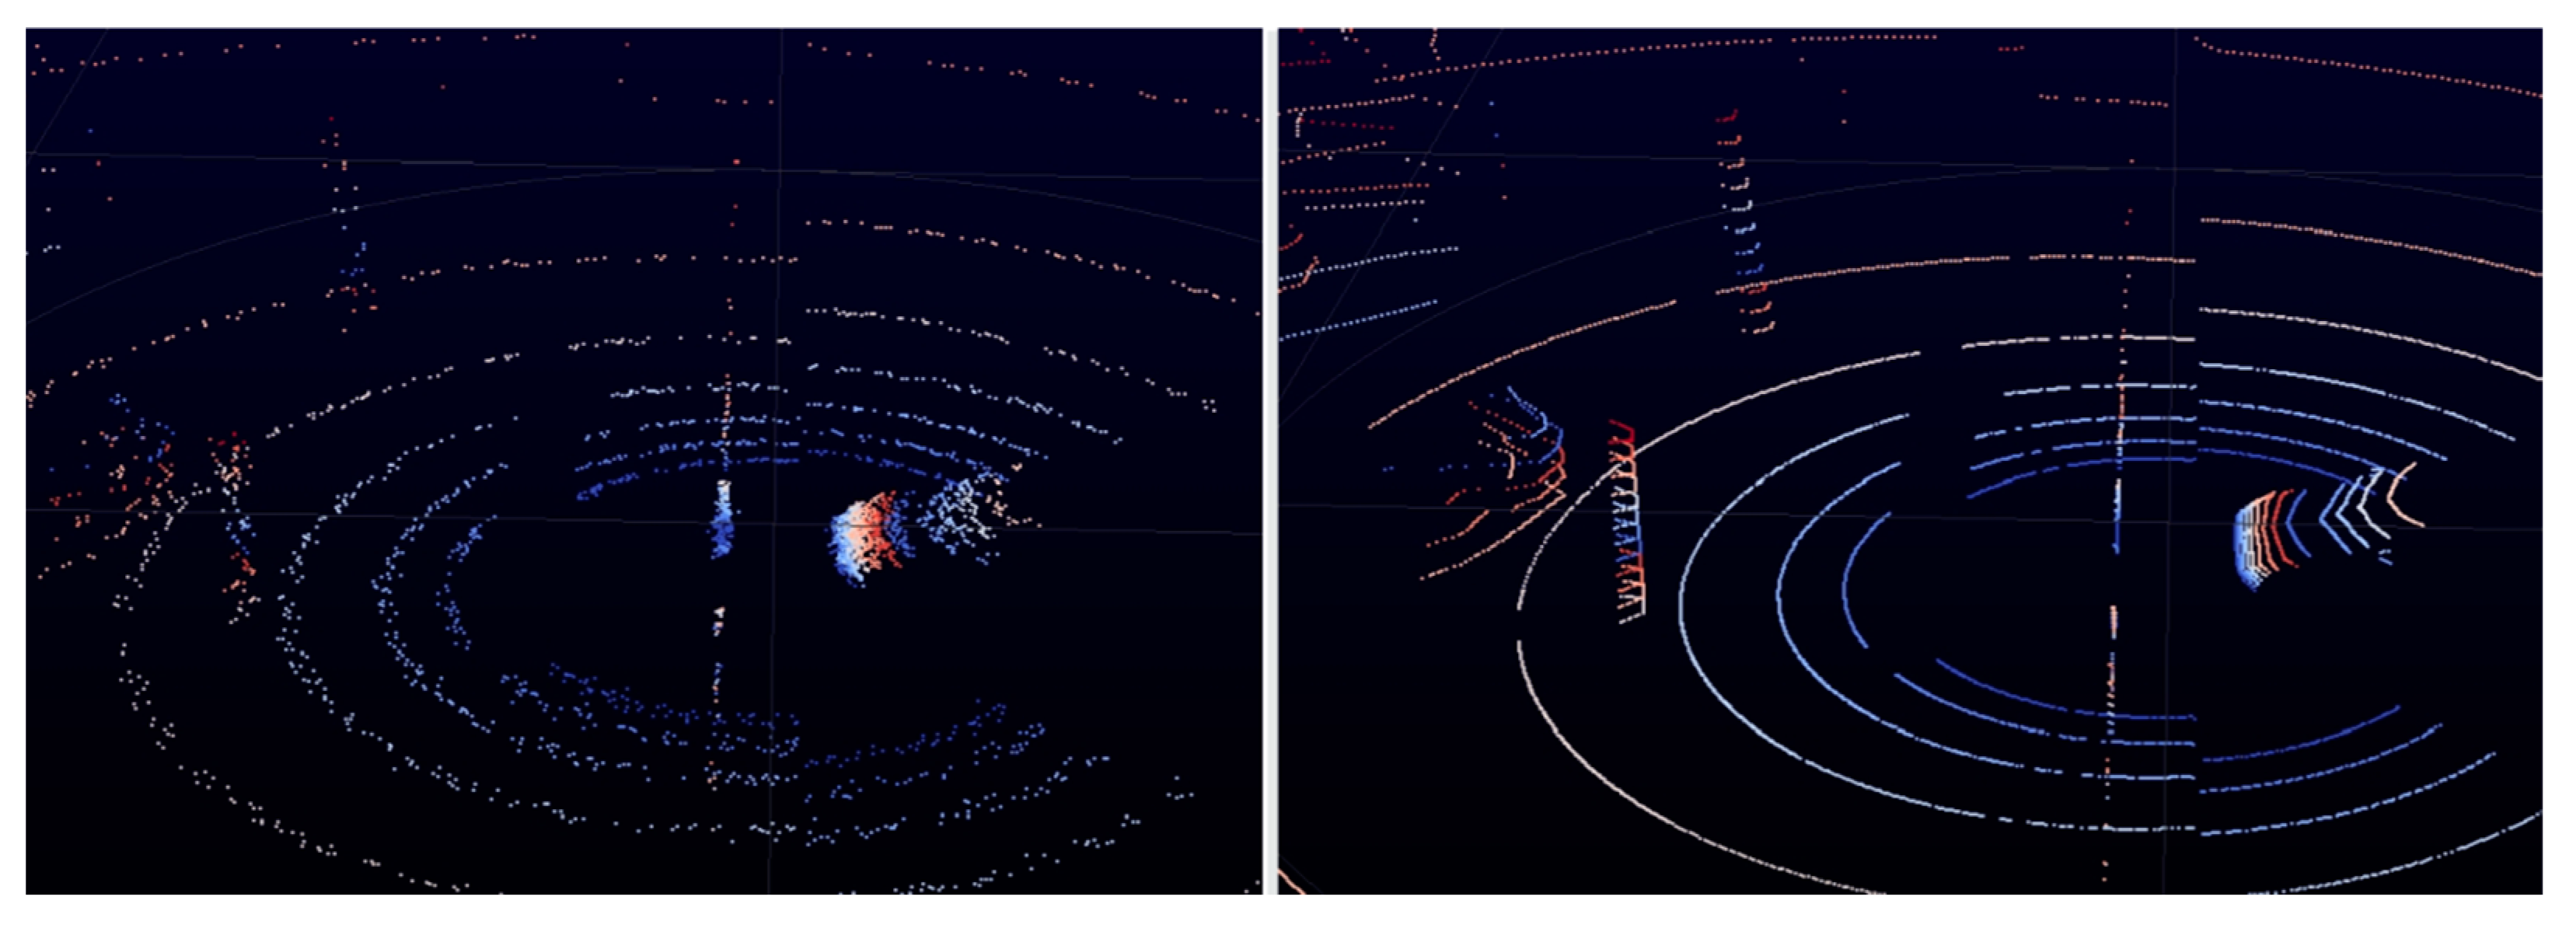
4. LiDAR Sensor Data
4.1. LiDAR Sensor Data Provided by Waymo Open Dataset
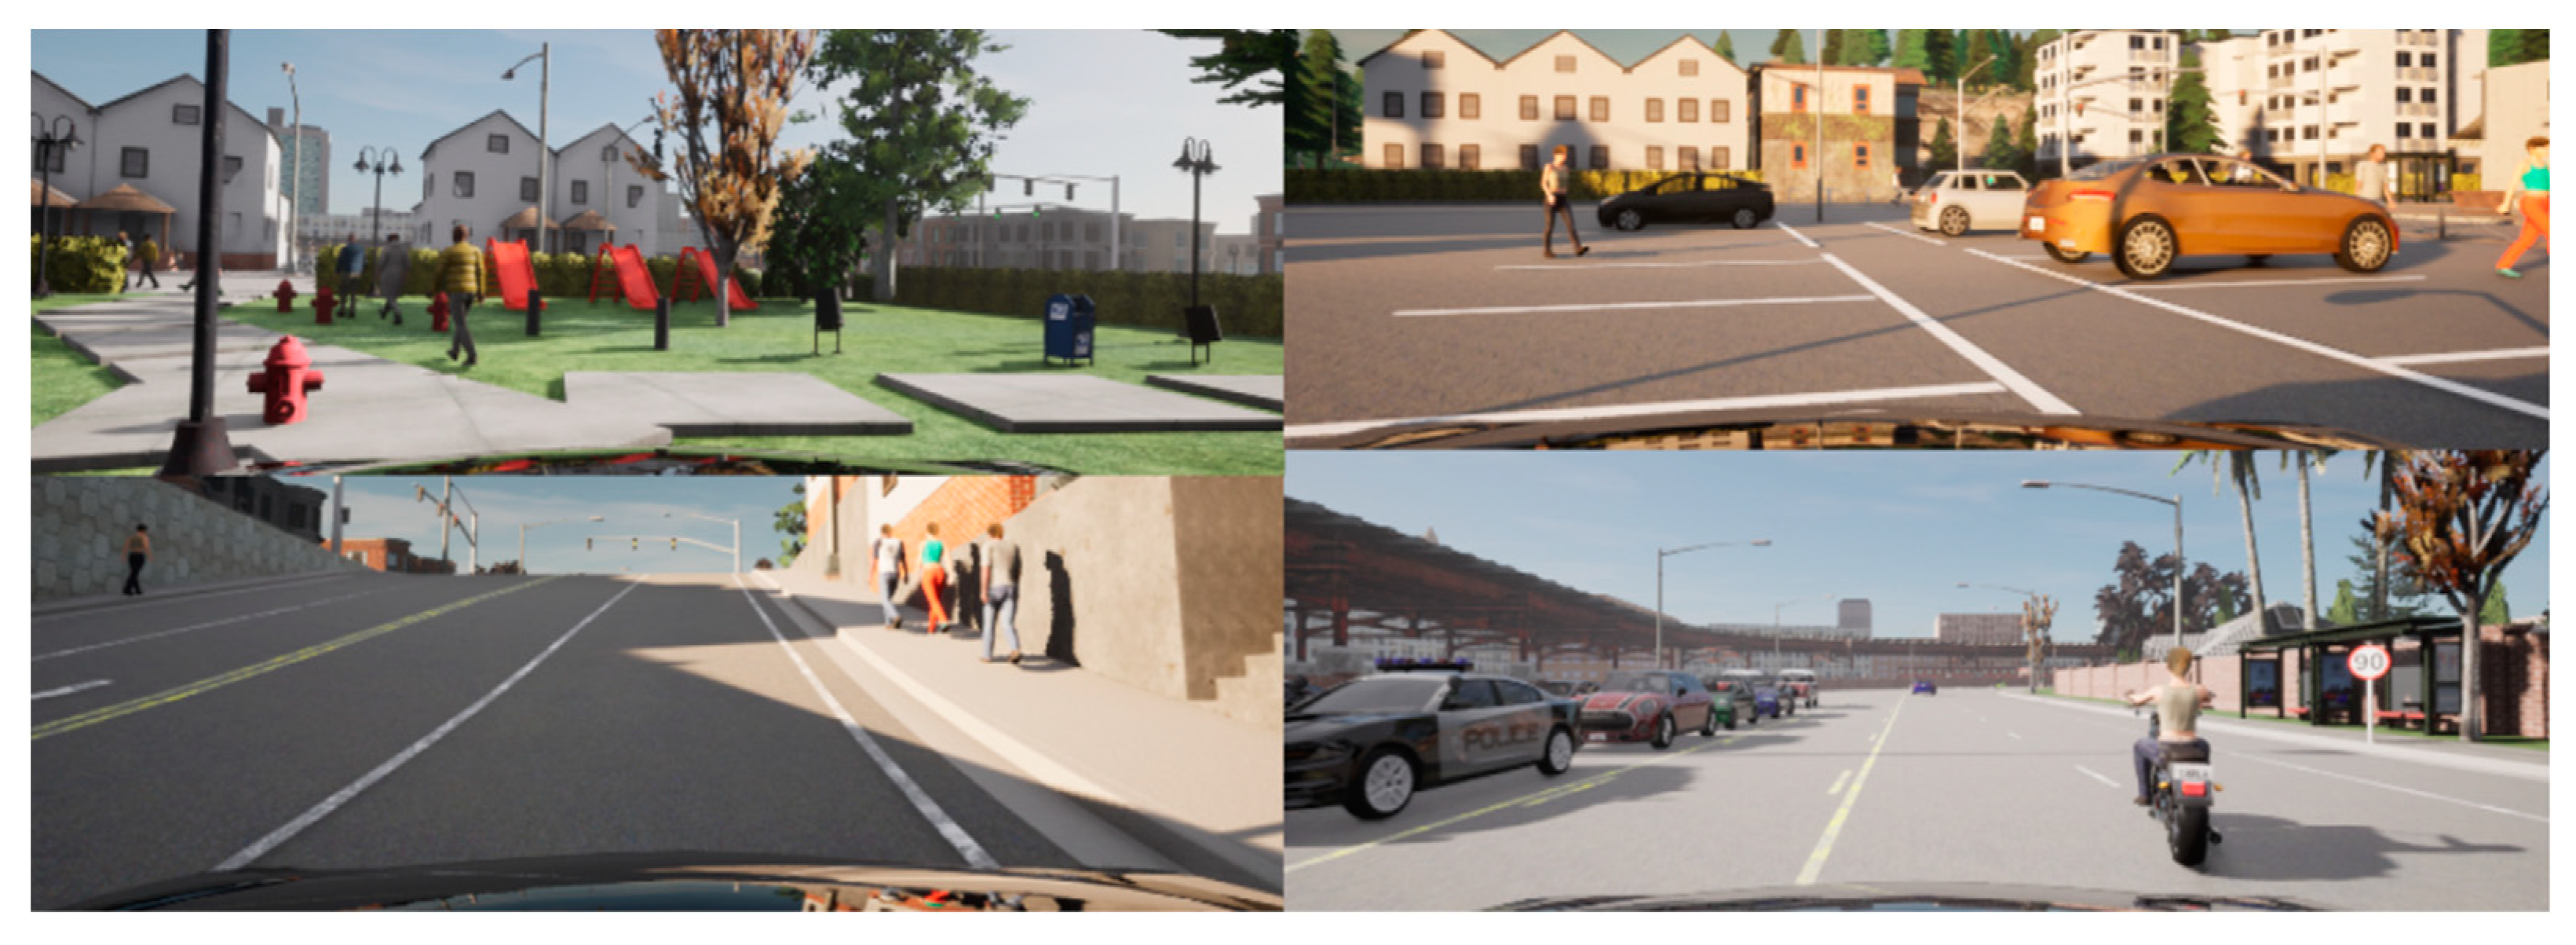
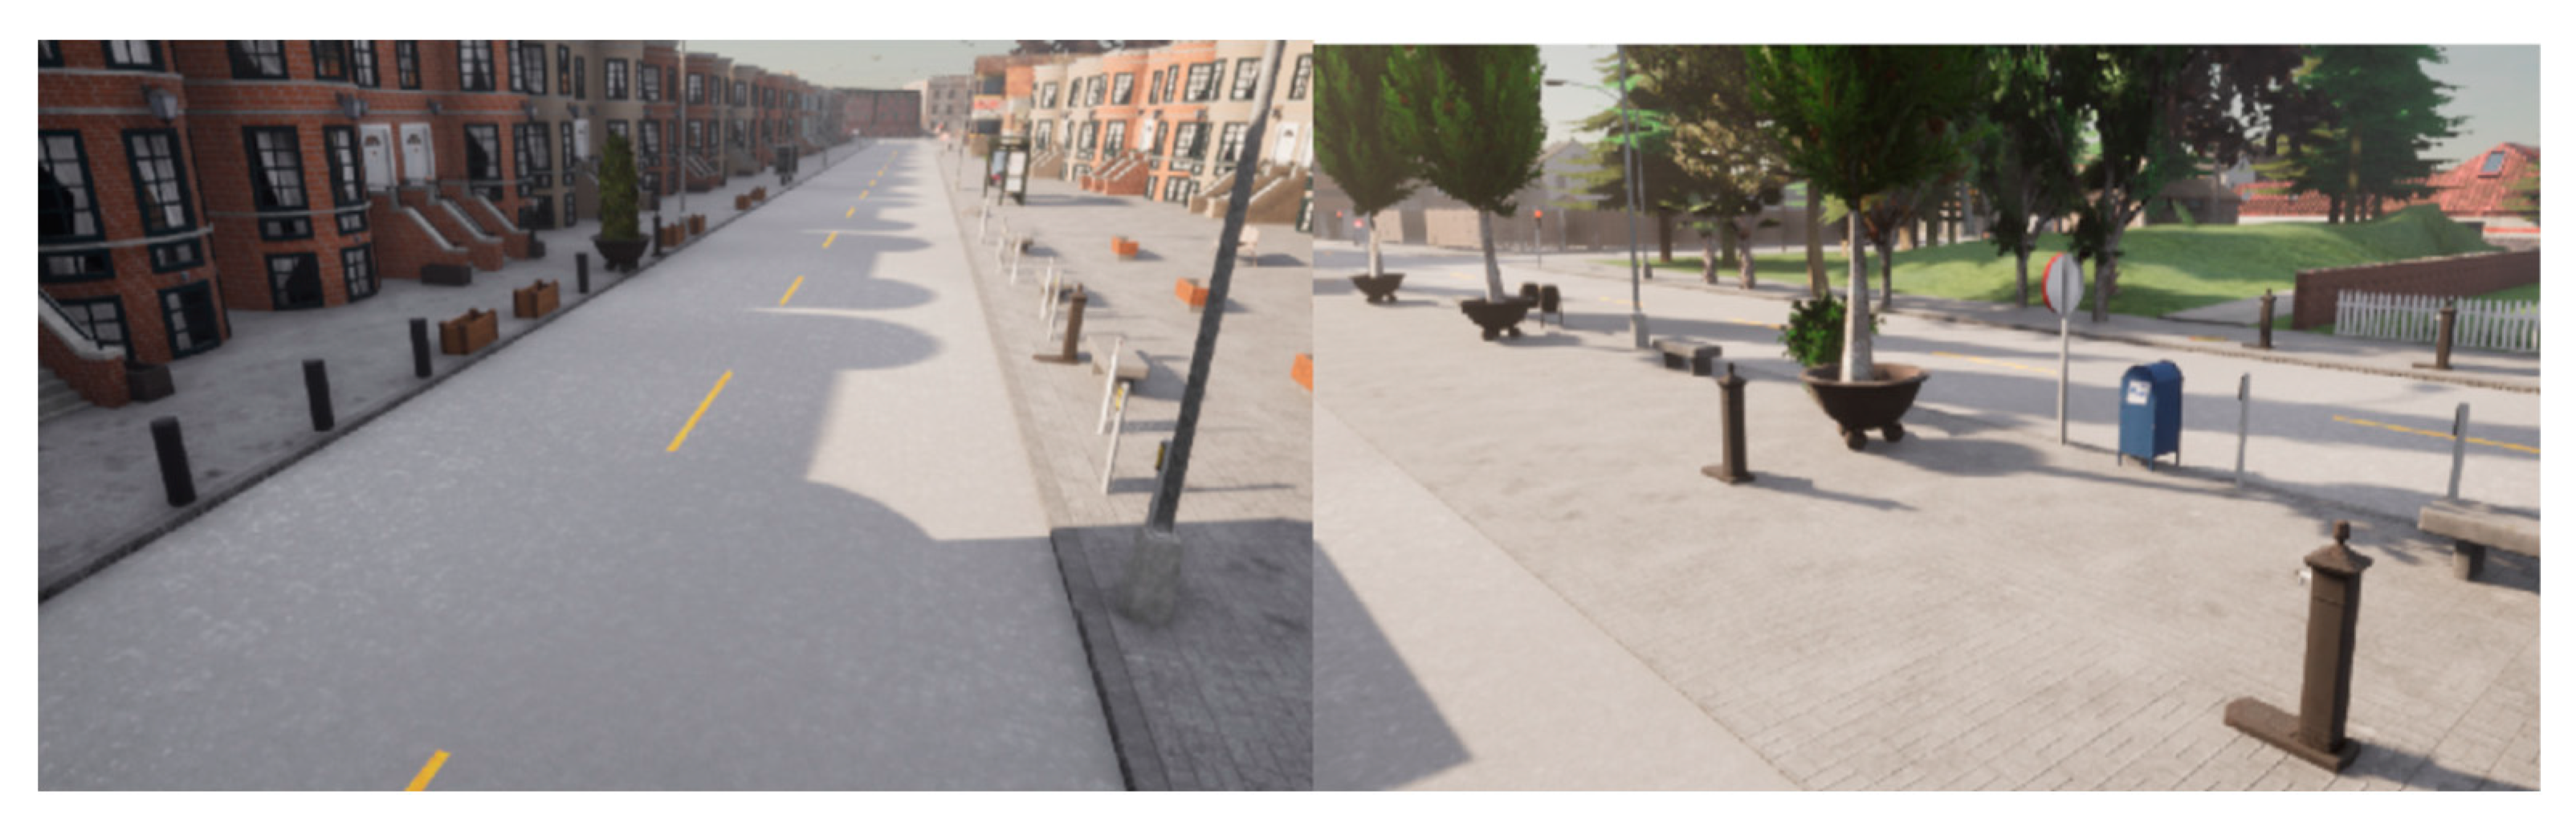
4.2. LiDAR Sensor Data Generated by Carla Simulation
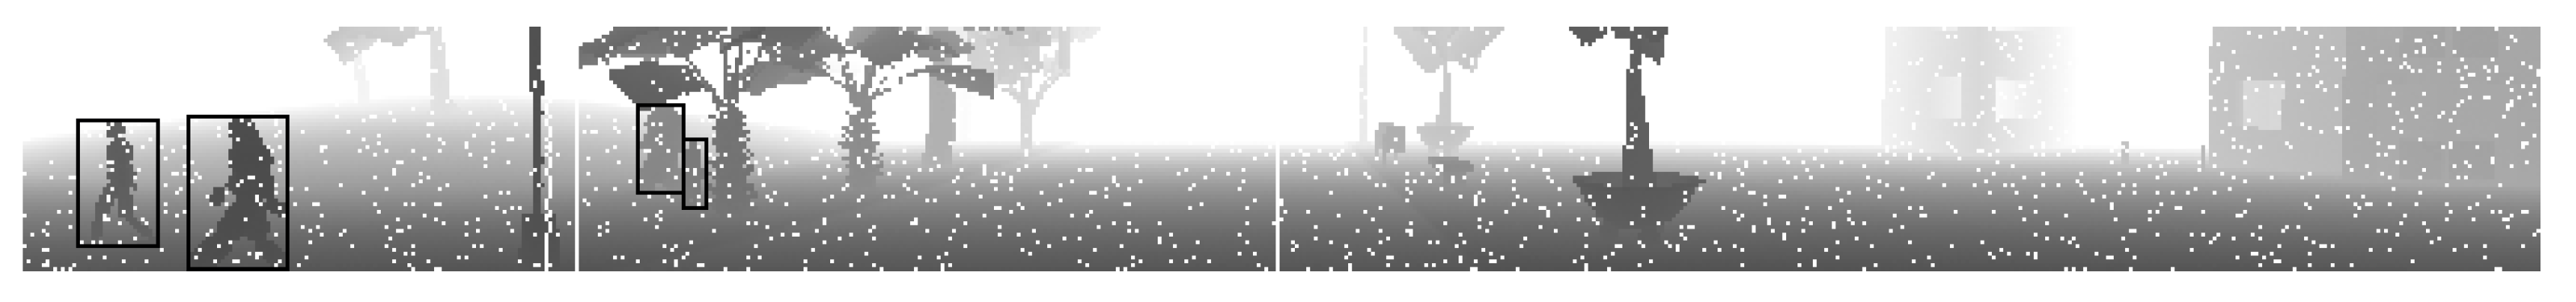
4.3. Synthetic LiDAR Data Preparation for the Training Dataset
4.4. Automatic Labeling for Synthetic LiDAR Data
5. Experiments
5.1. YOLOv4 Algorithm
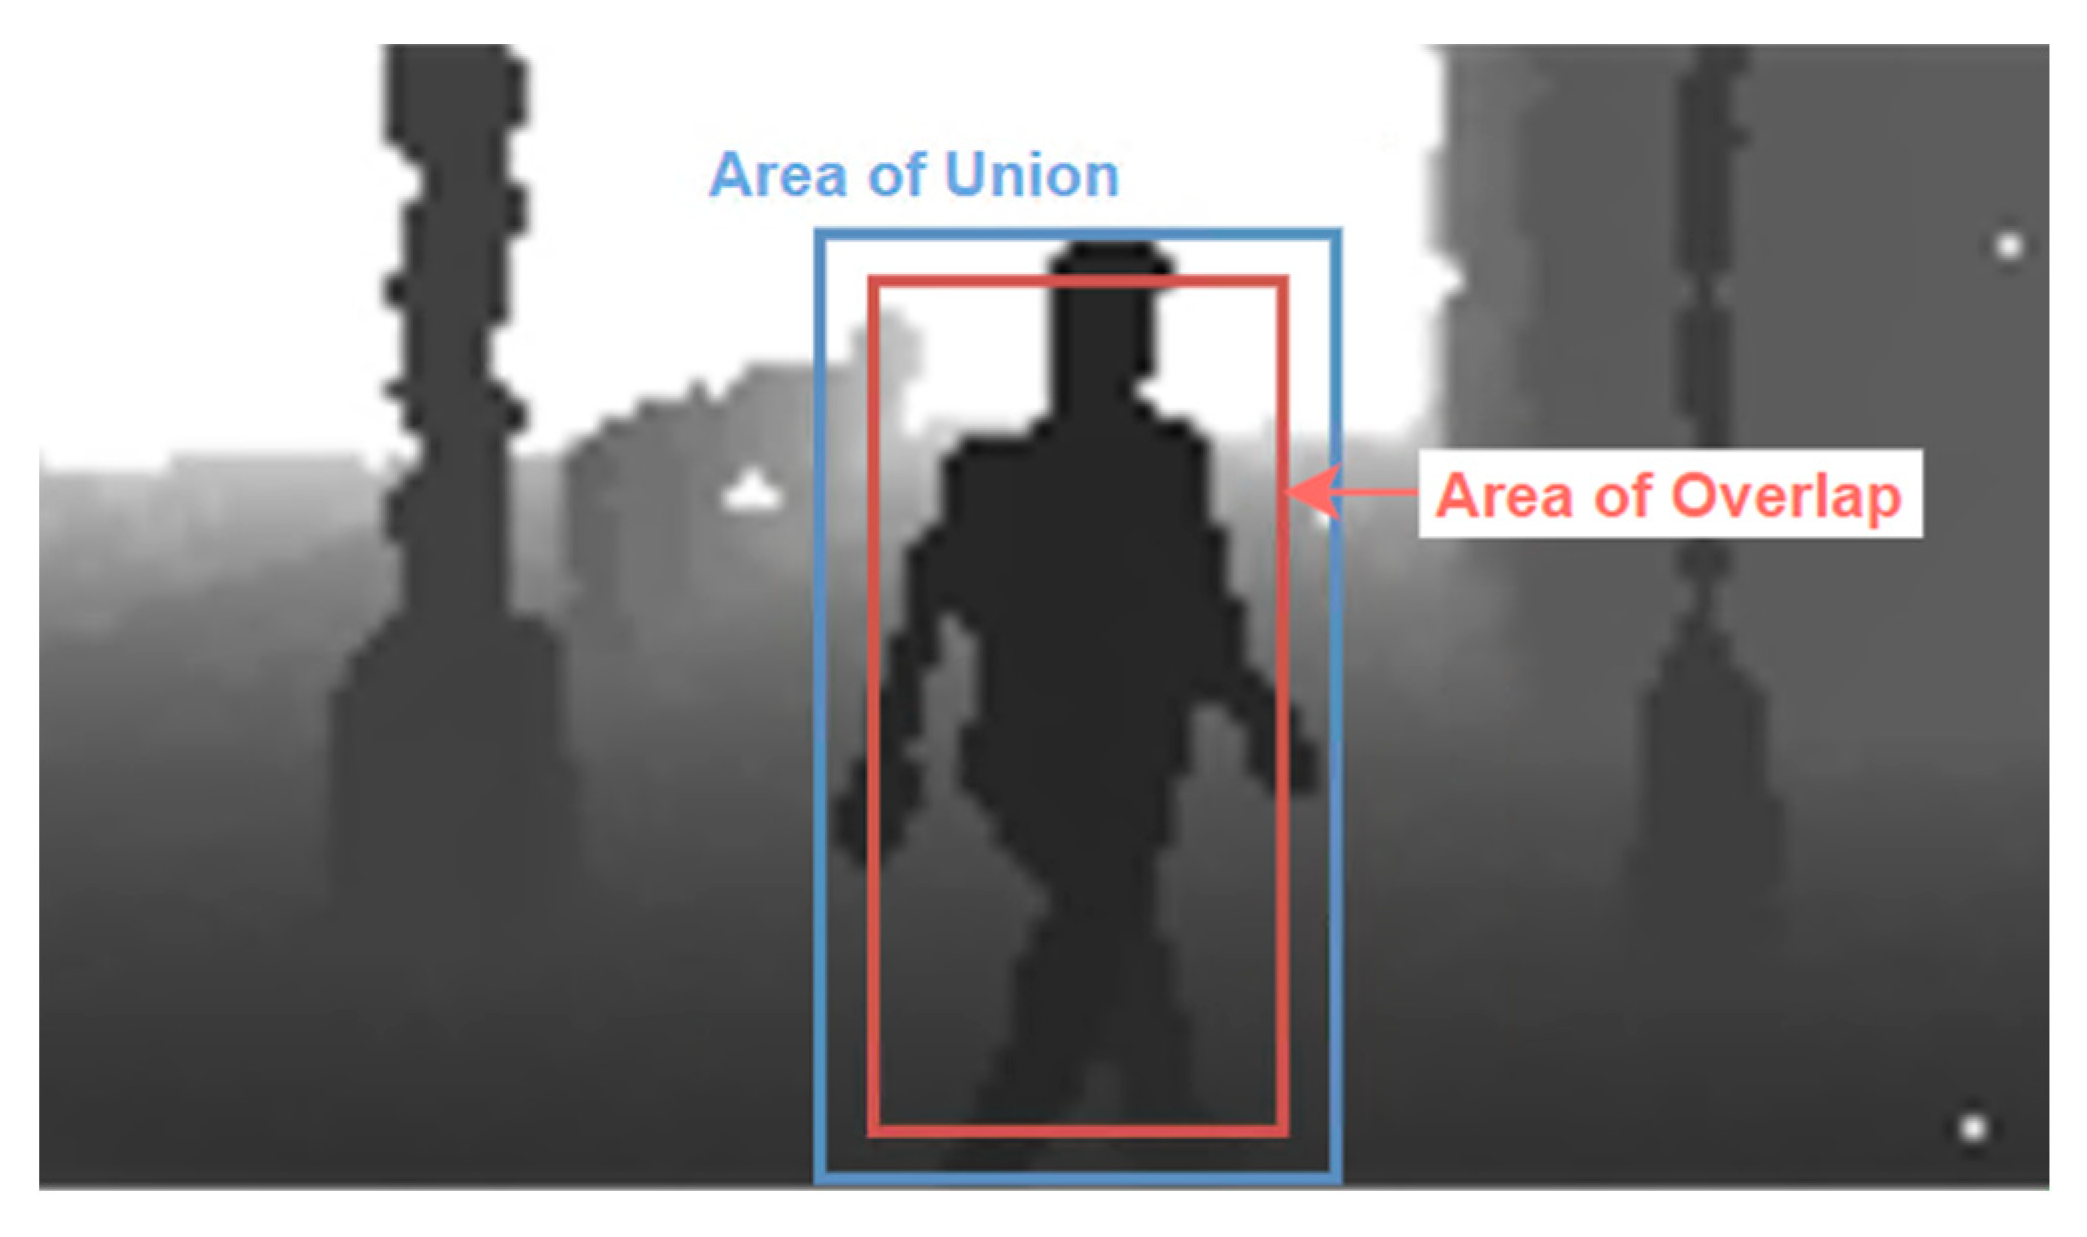
5.2. Evaluation Metrices
- True Positive (TP): correct detection, IoU ≥ threshold,
- False Positive (FP): wrong detection, IoU < threshold,
- False Negative (FN): ground-truth bounding box not detected,
- True Negative (TN): corrected misdetection.
5.3. Training
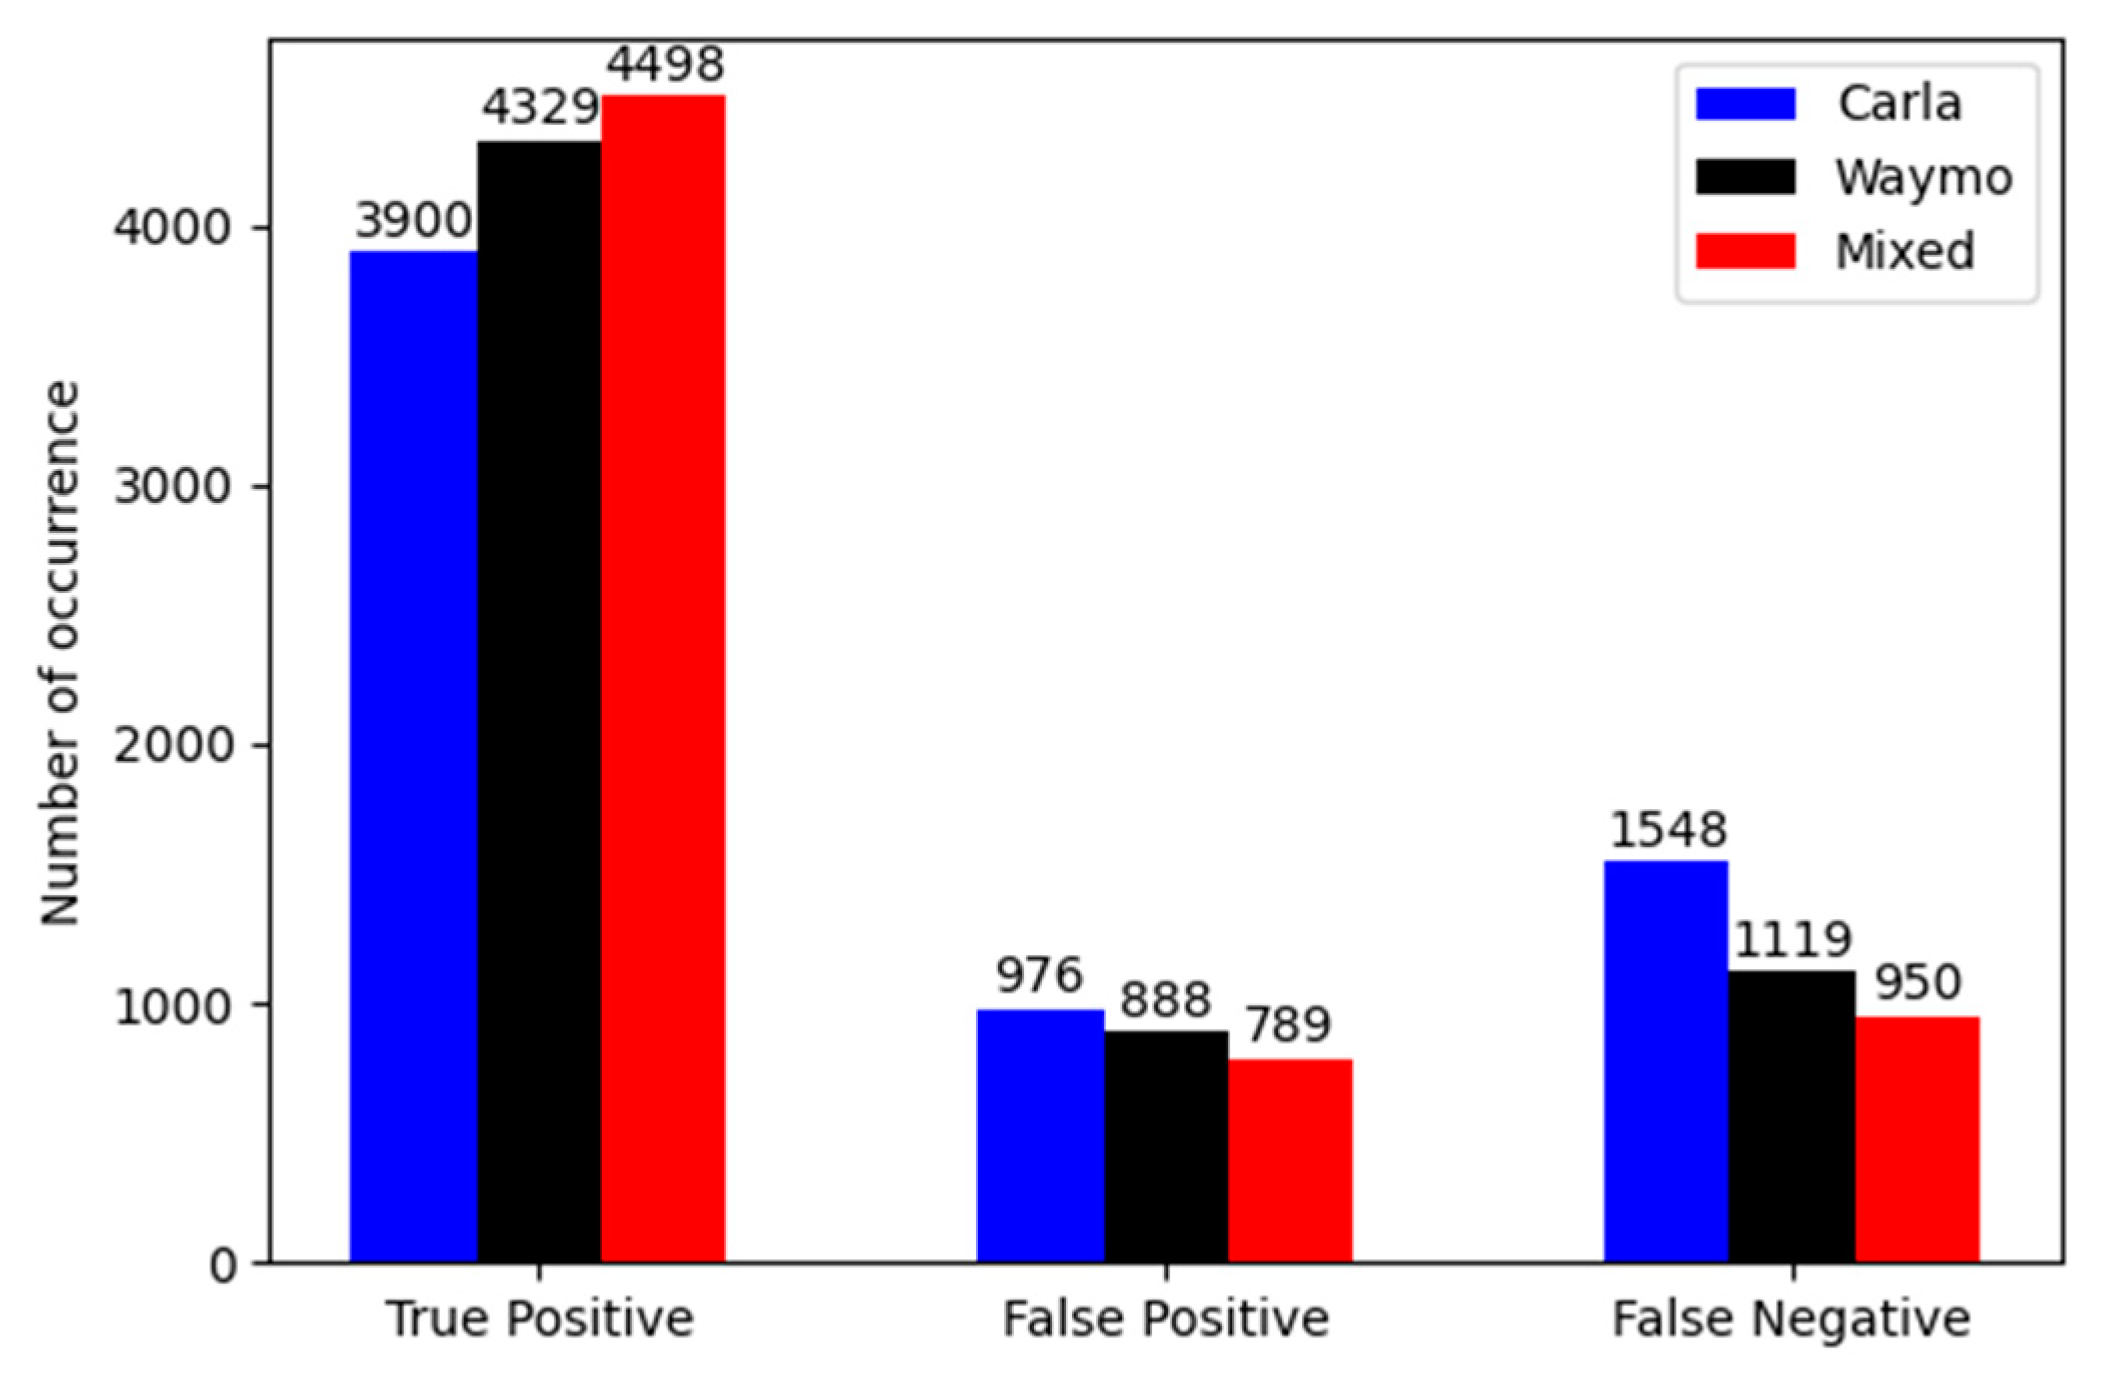
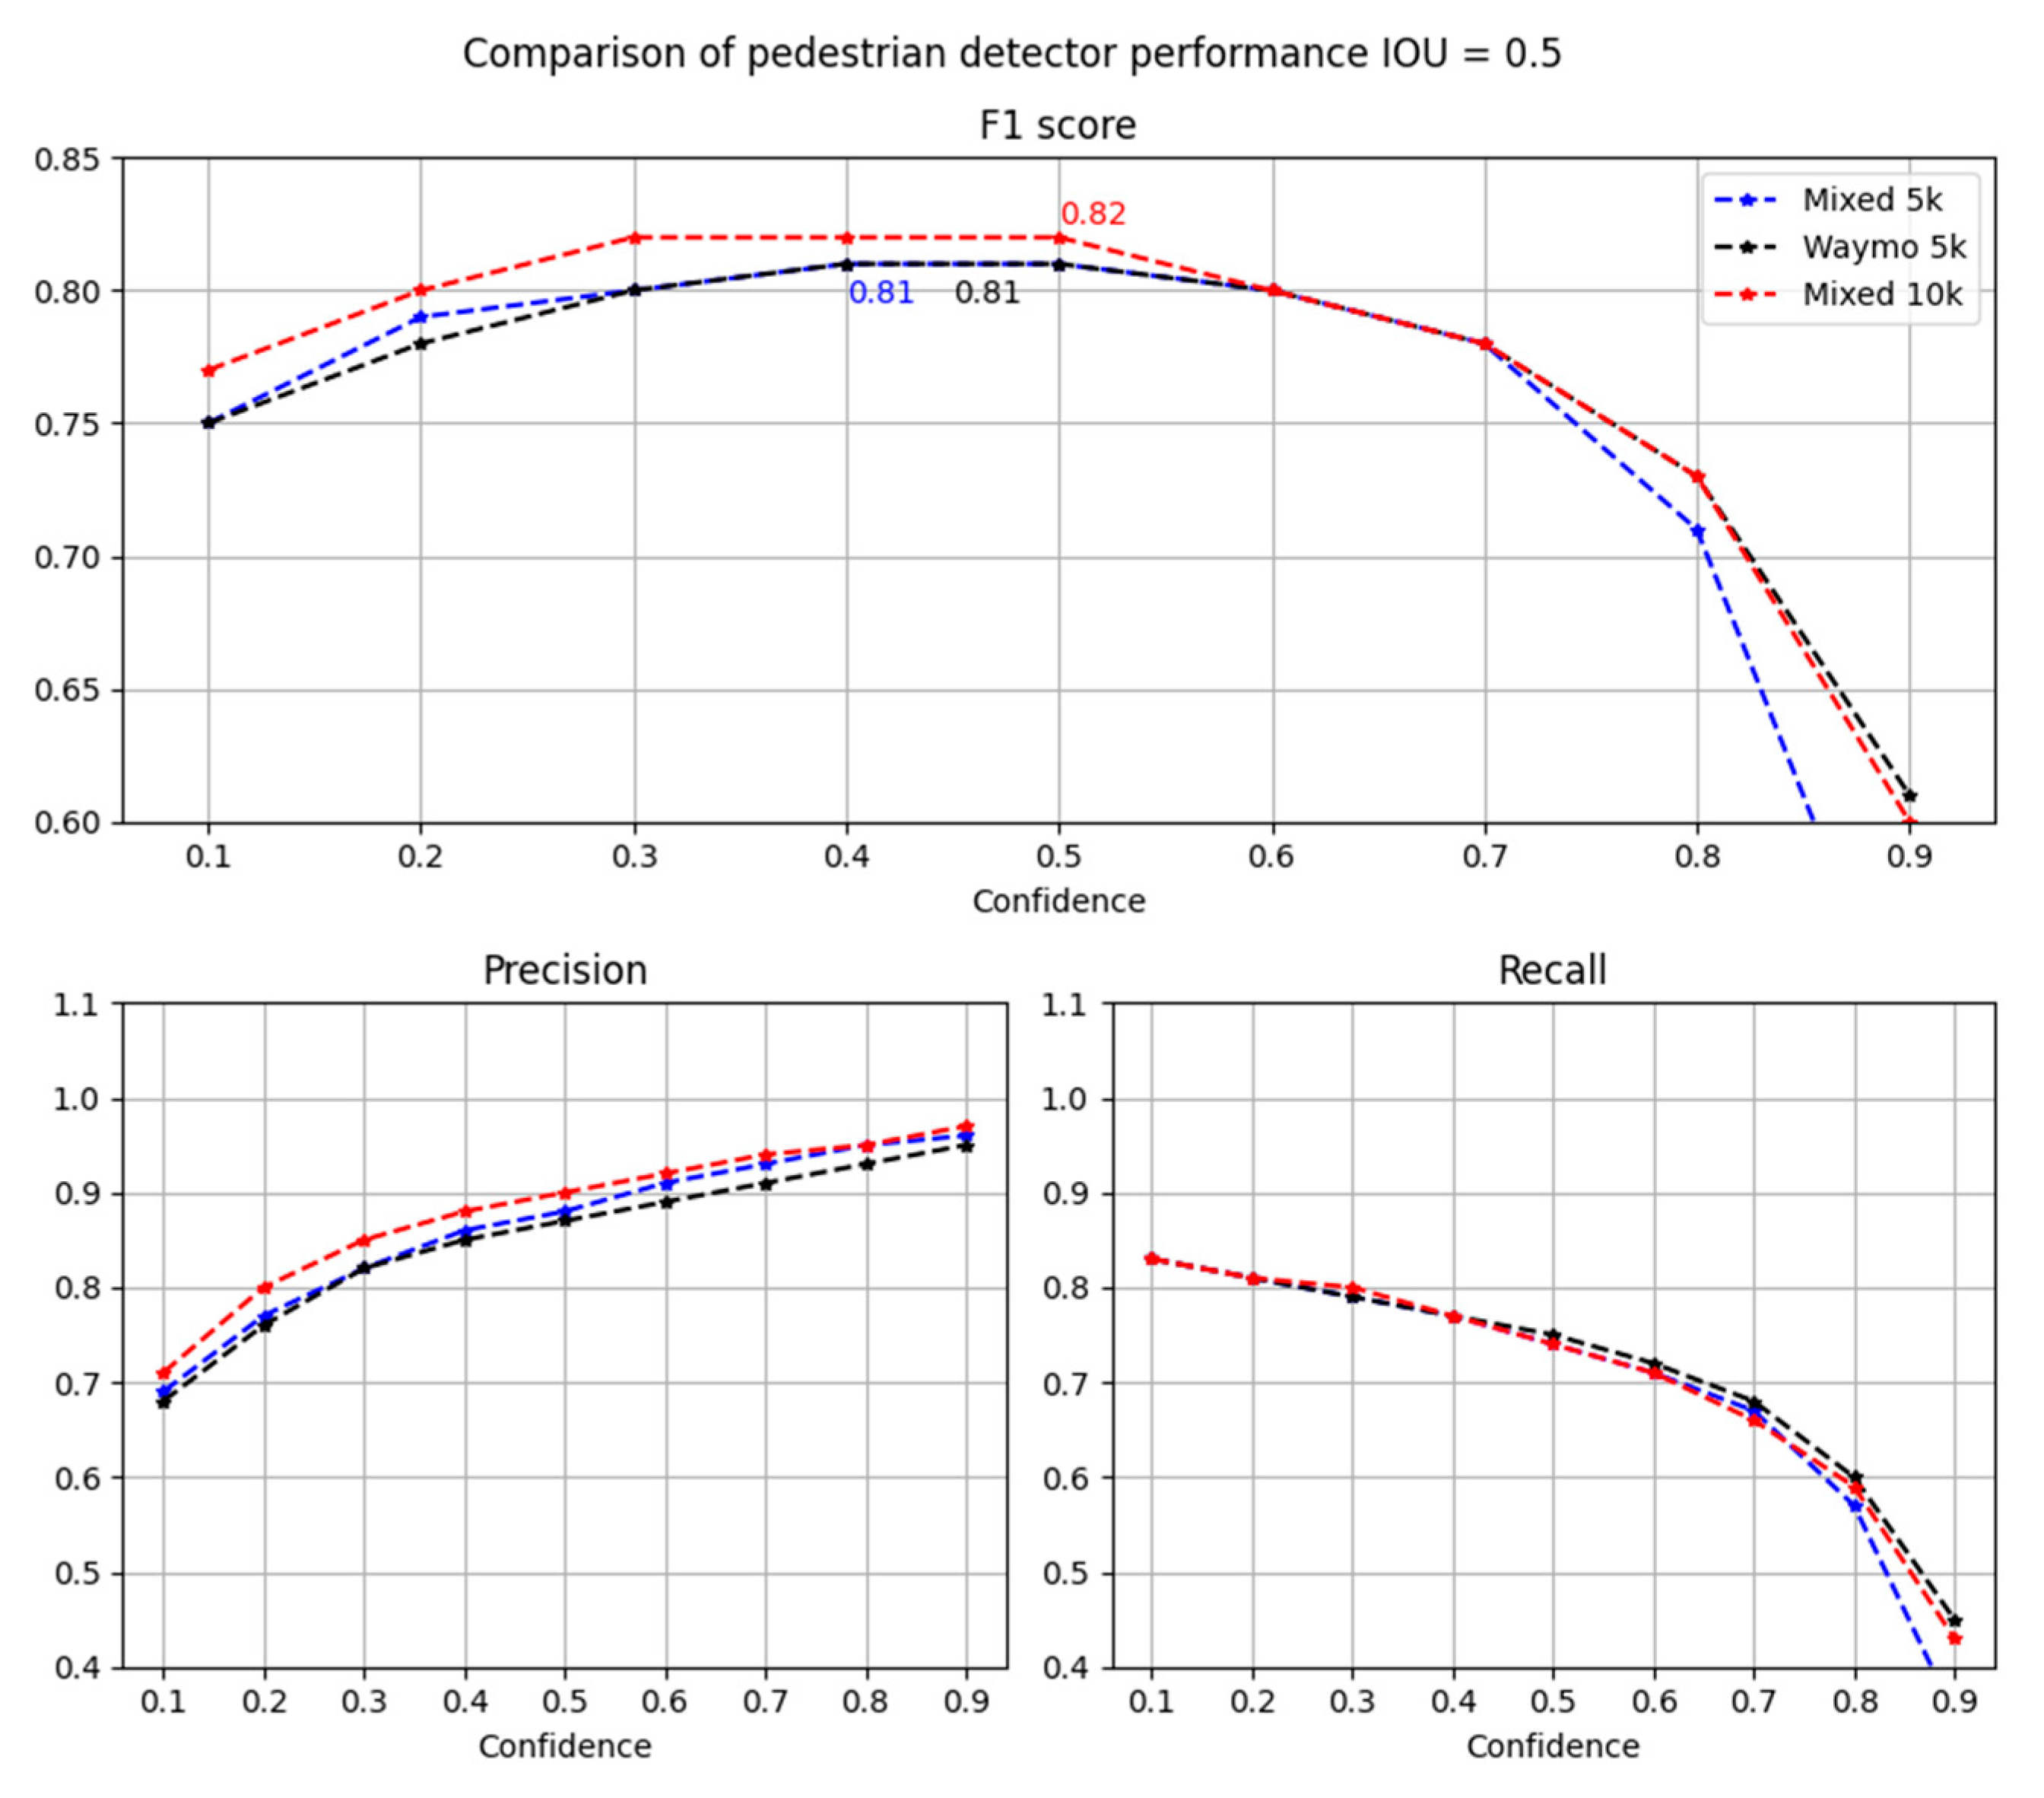
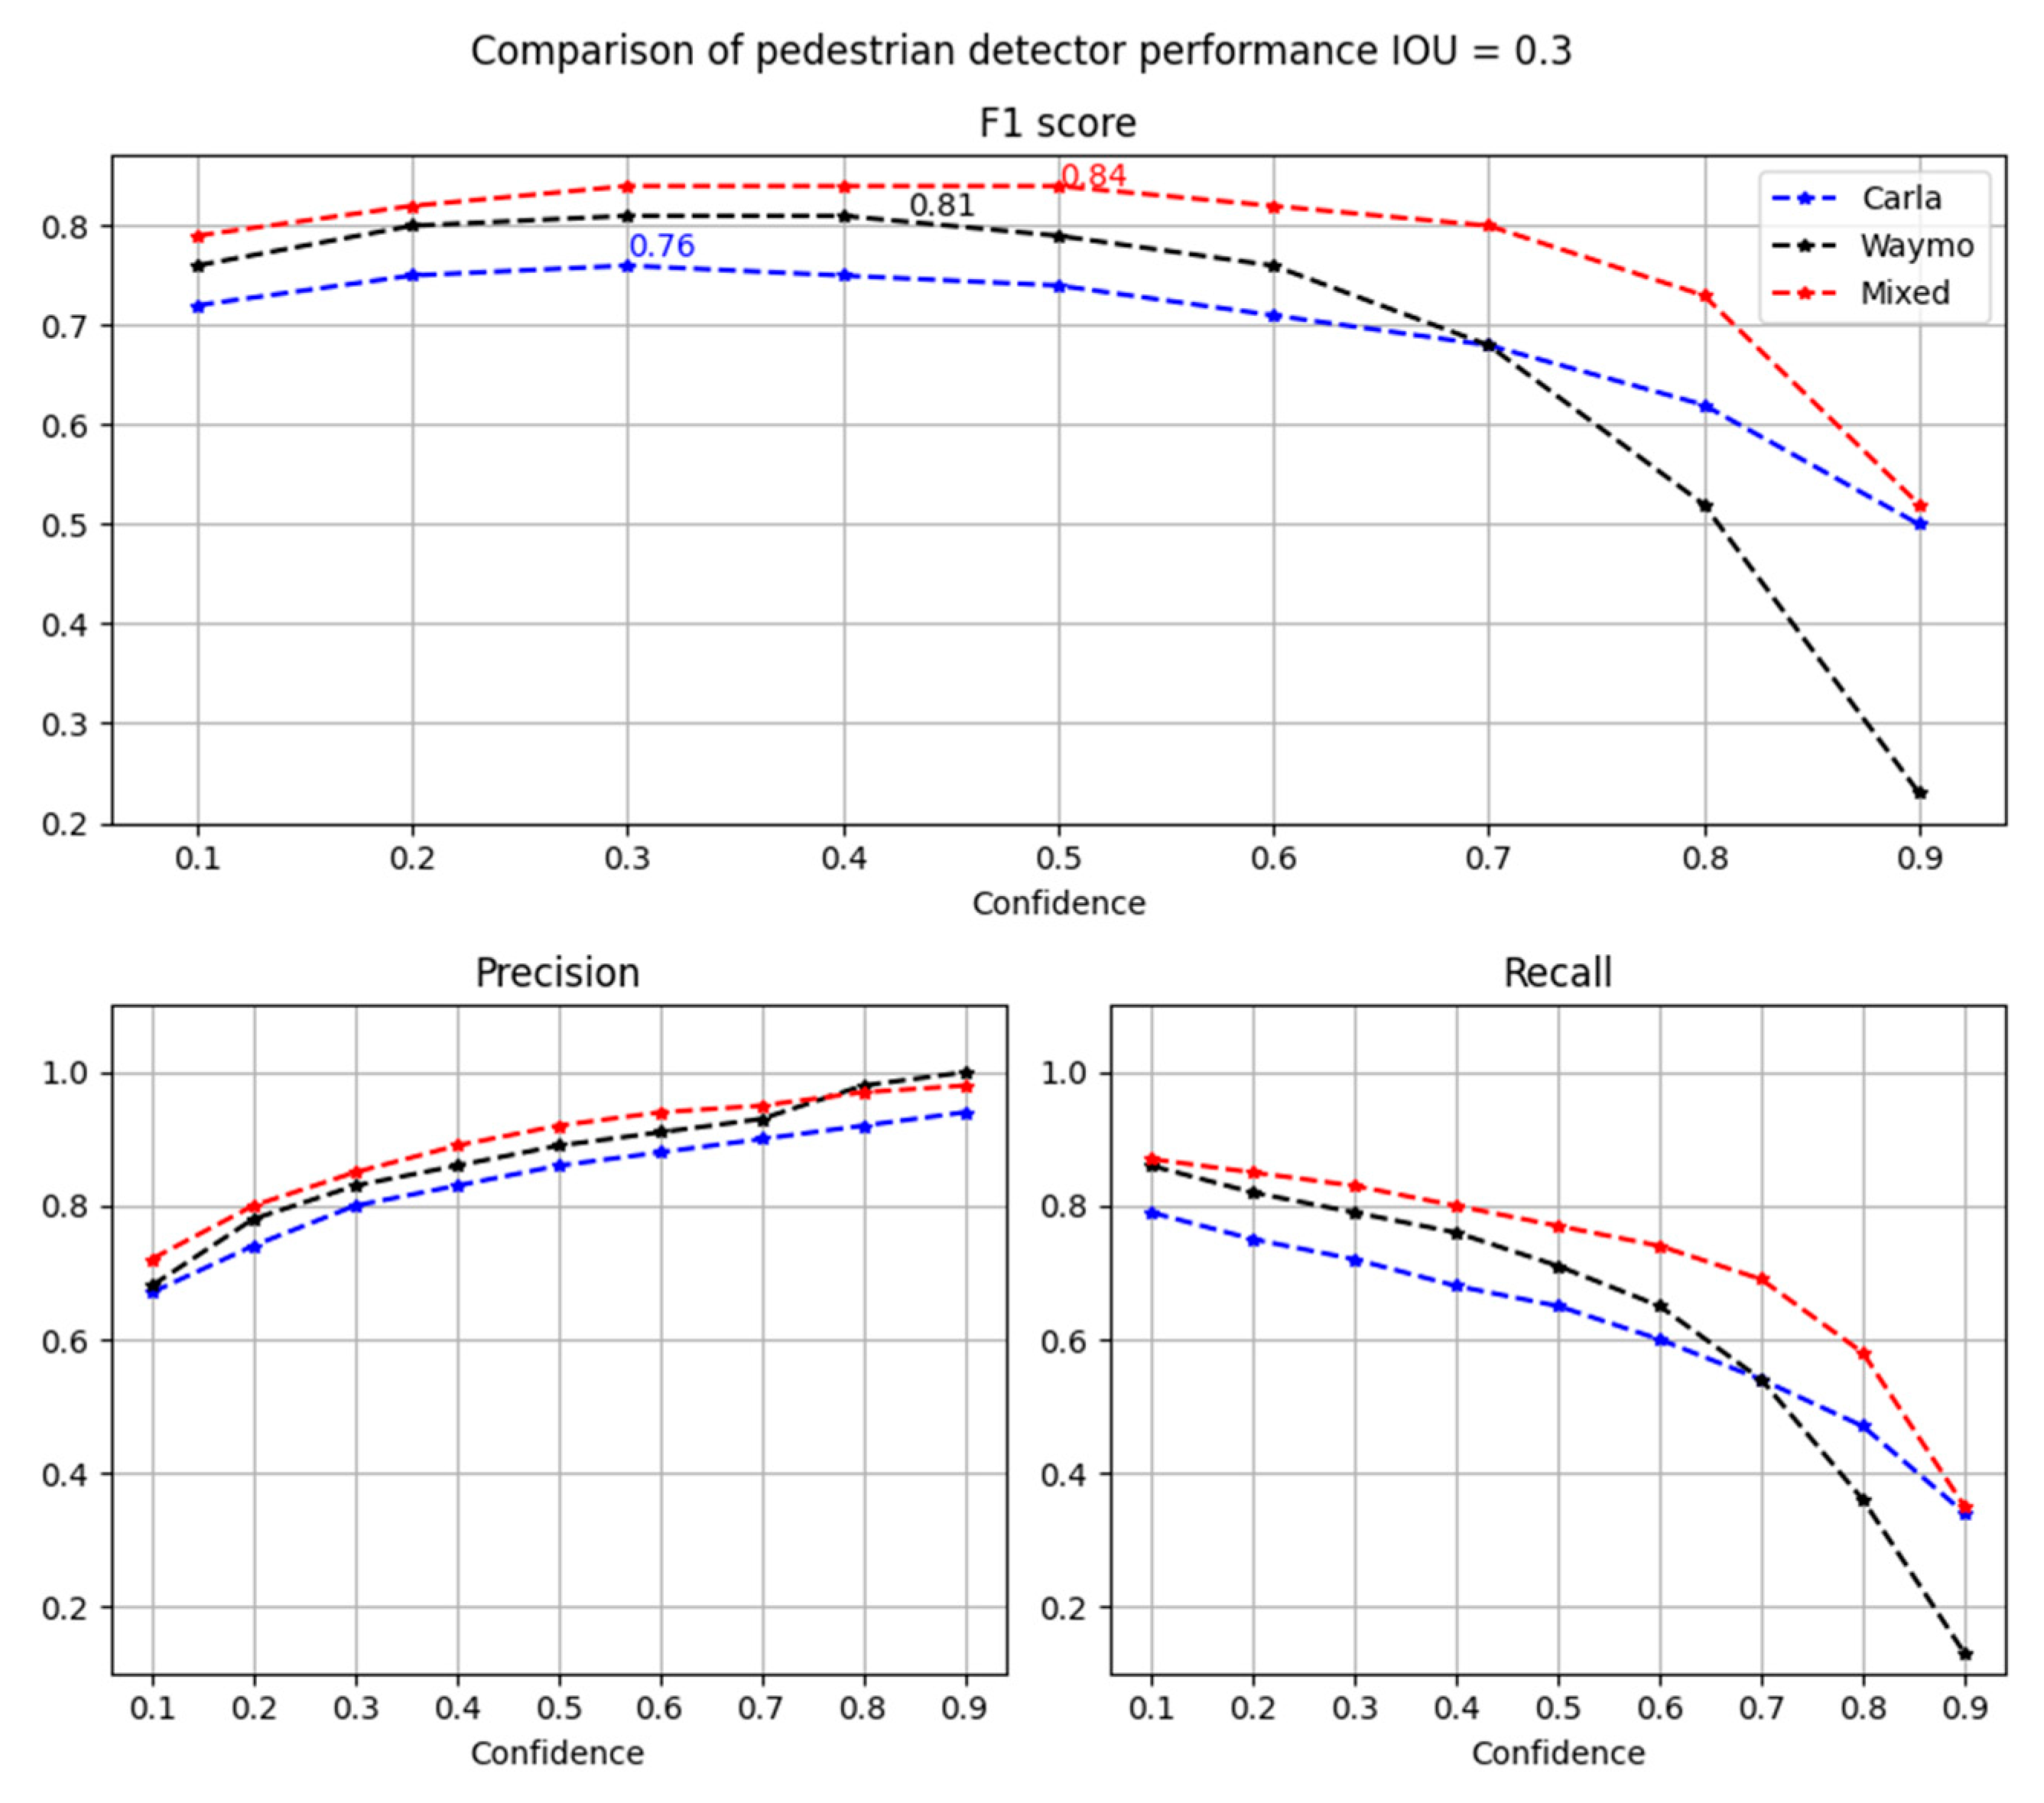
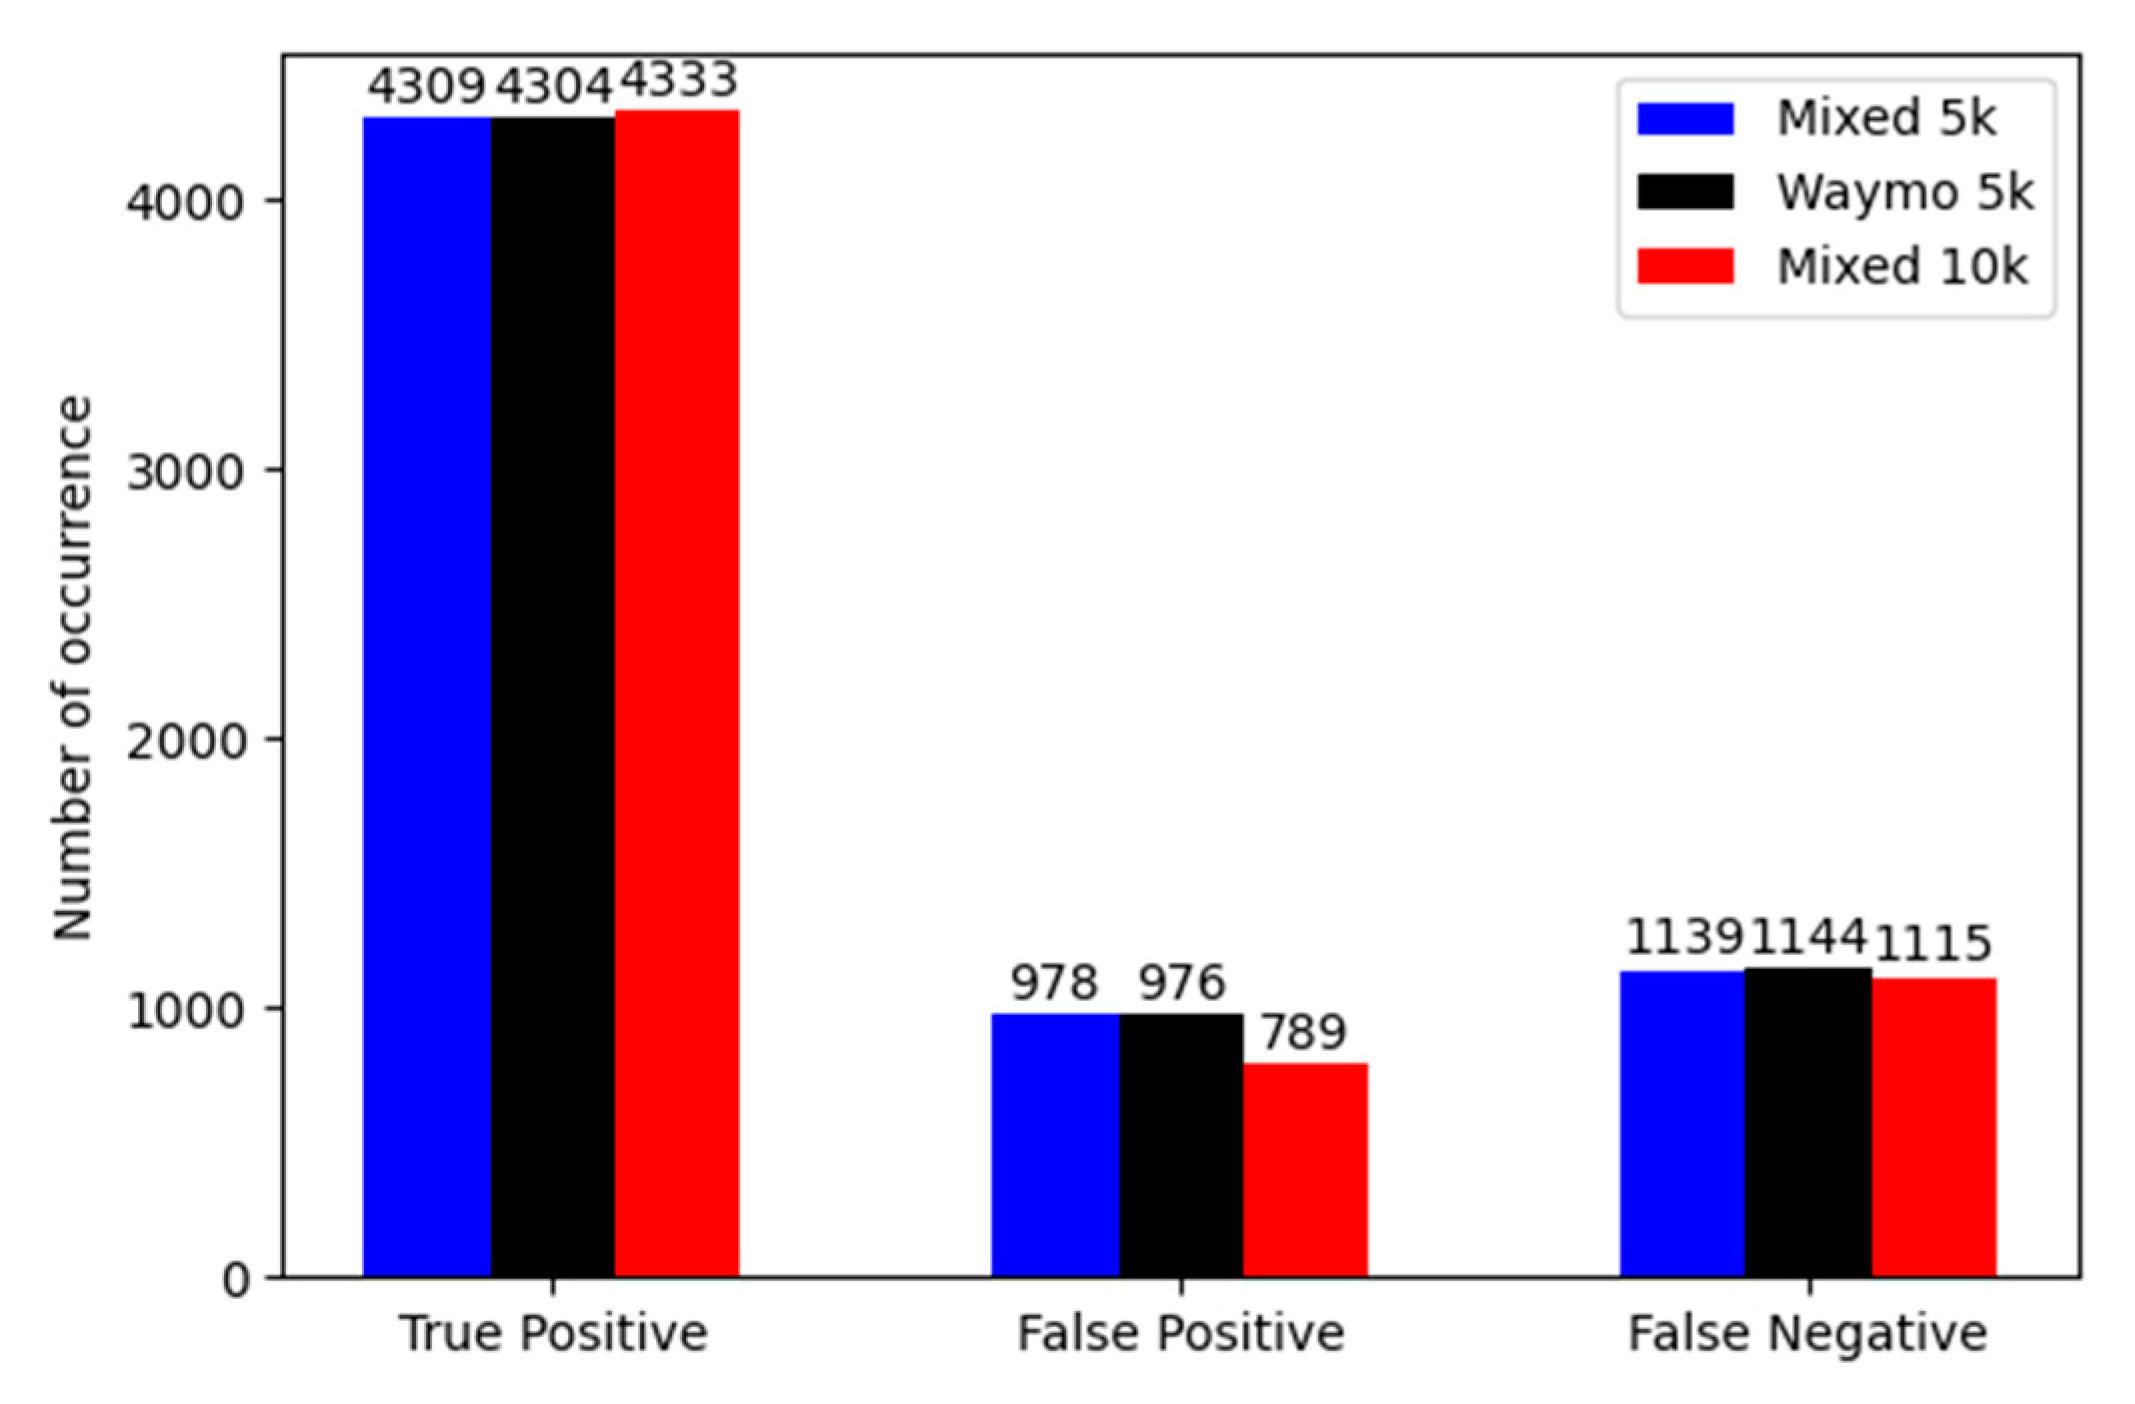
6. Results
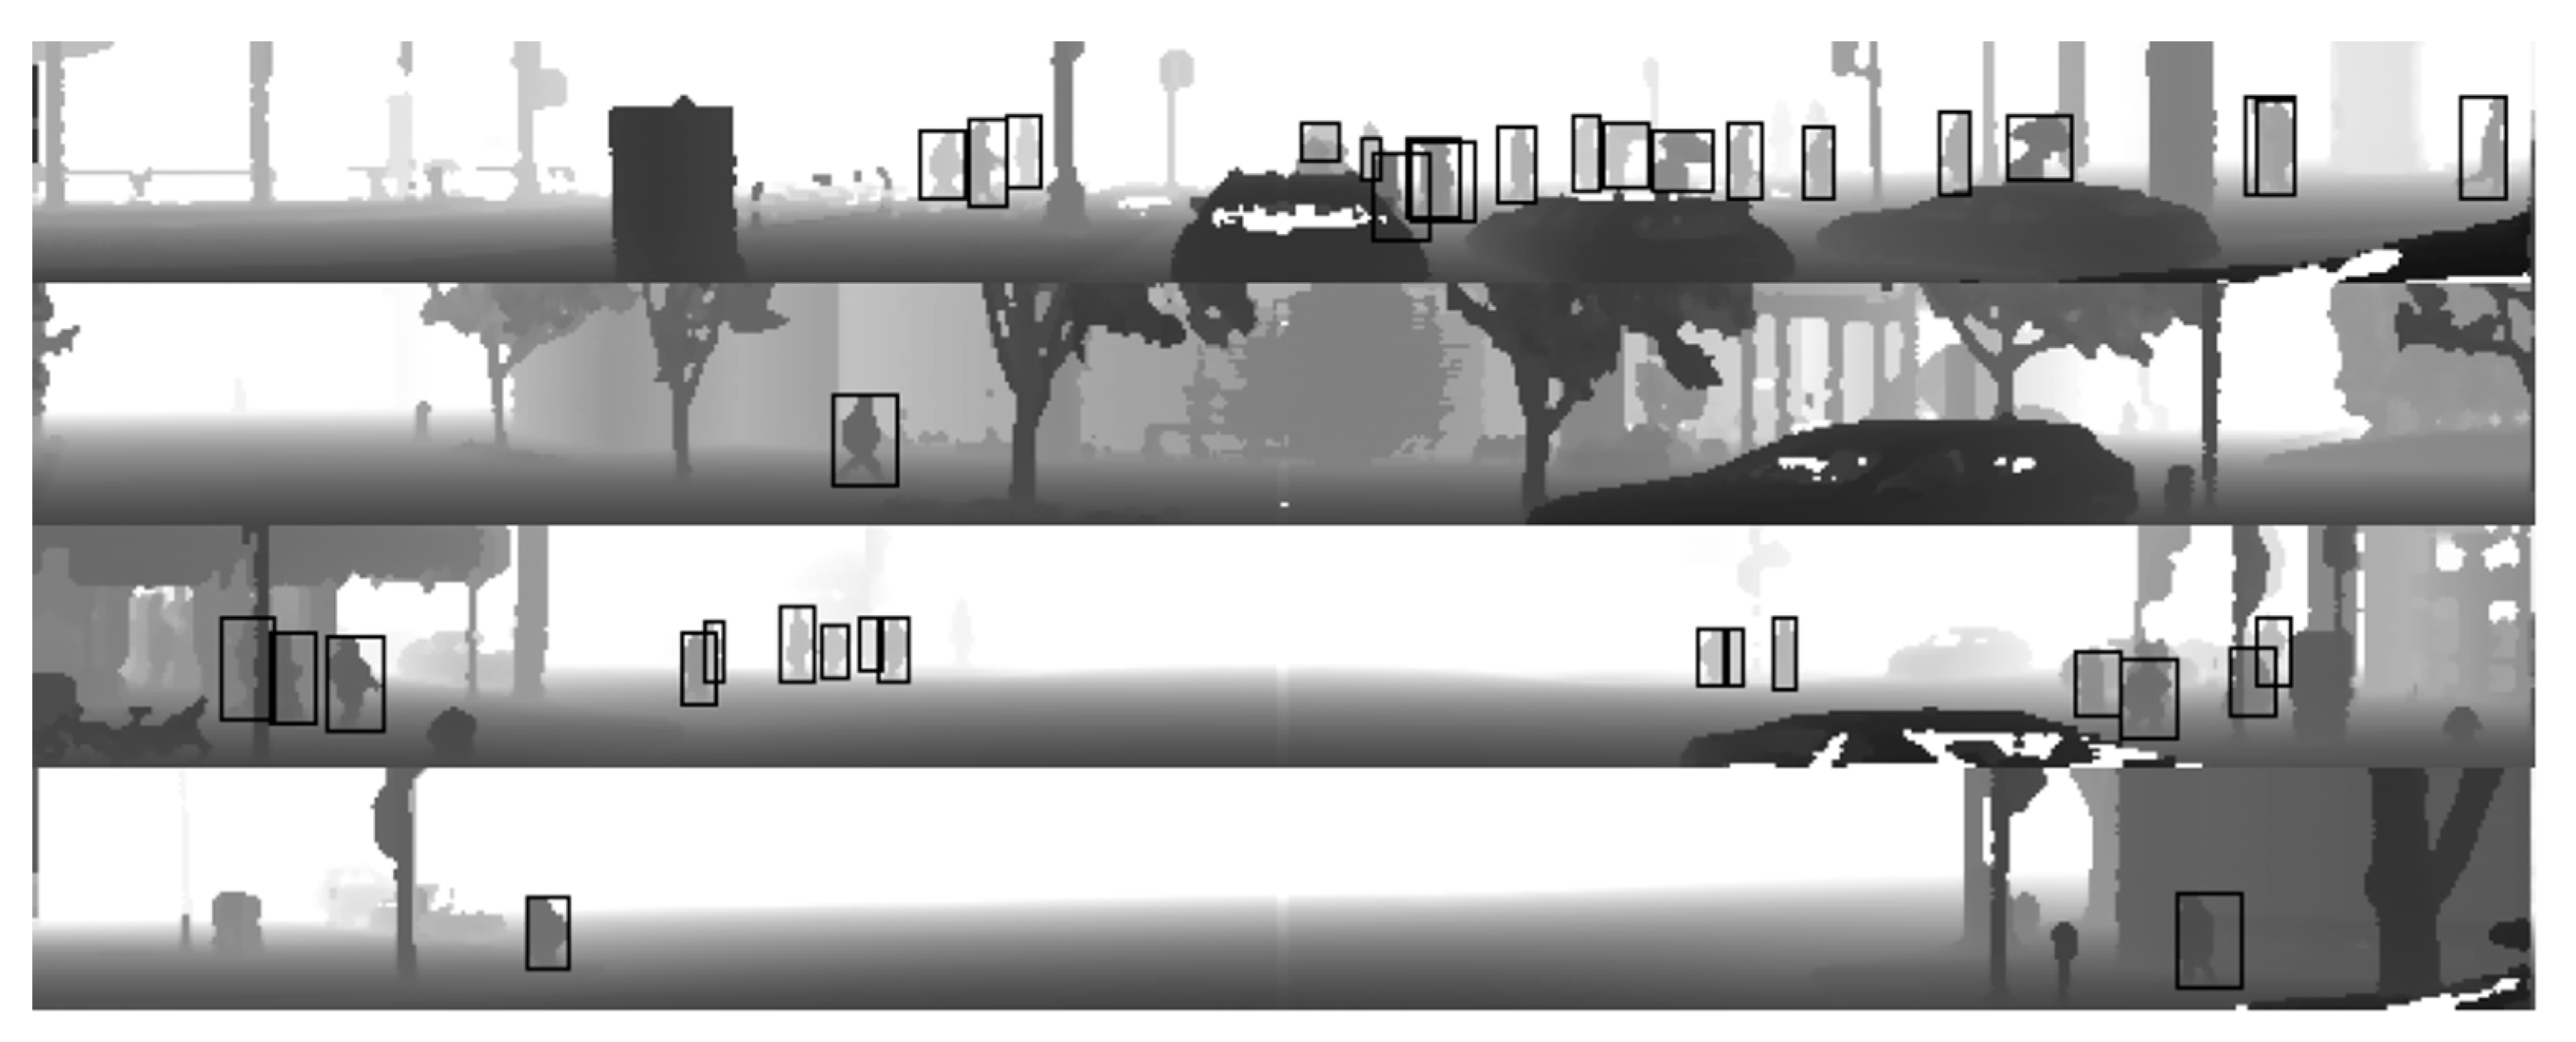
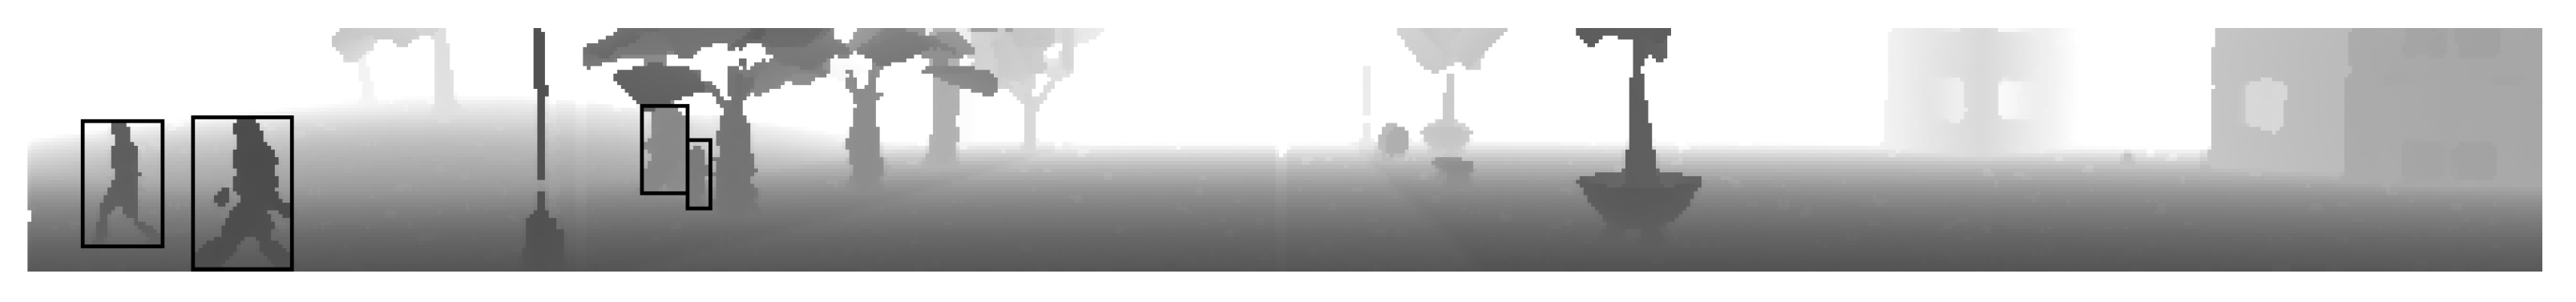
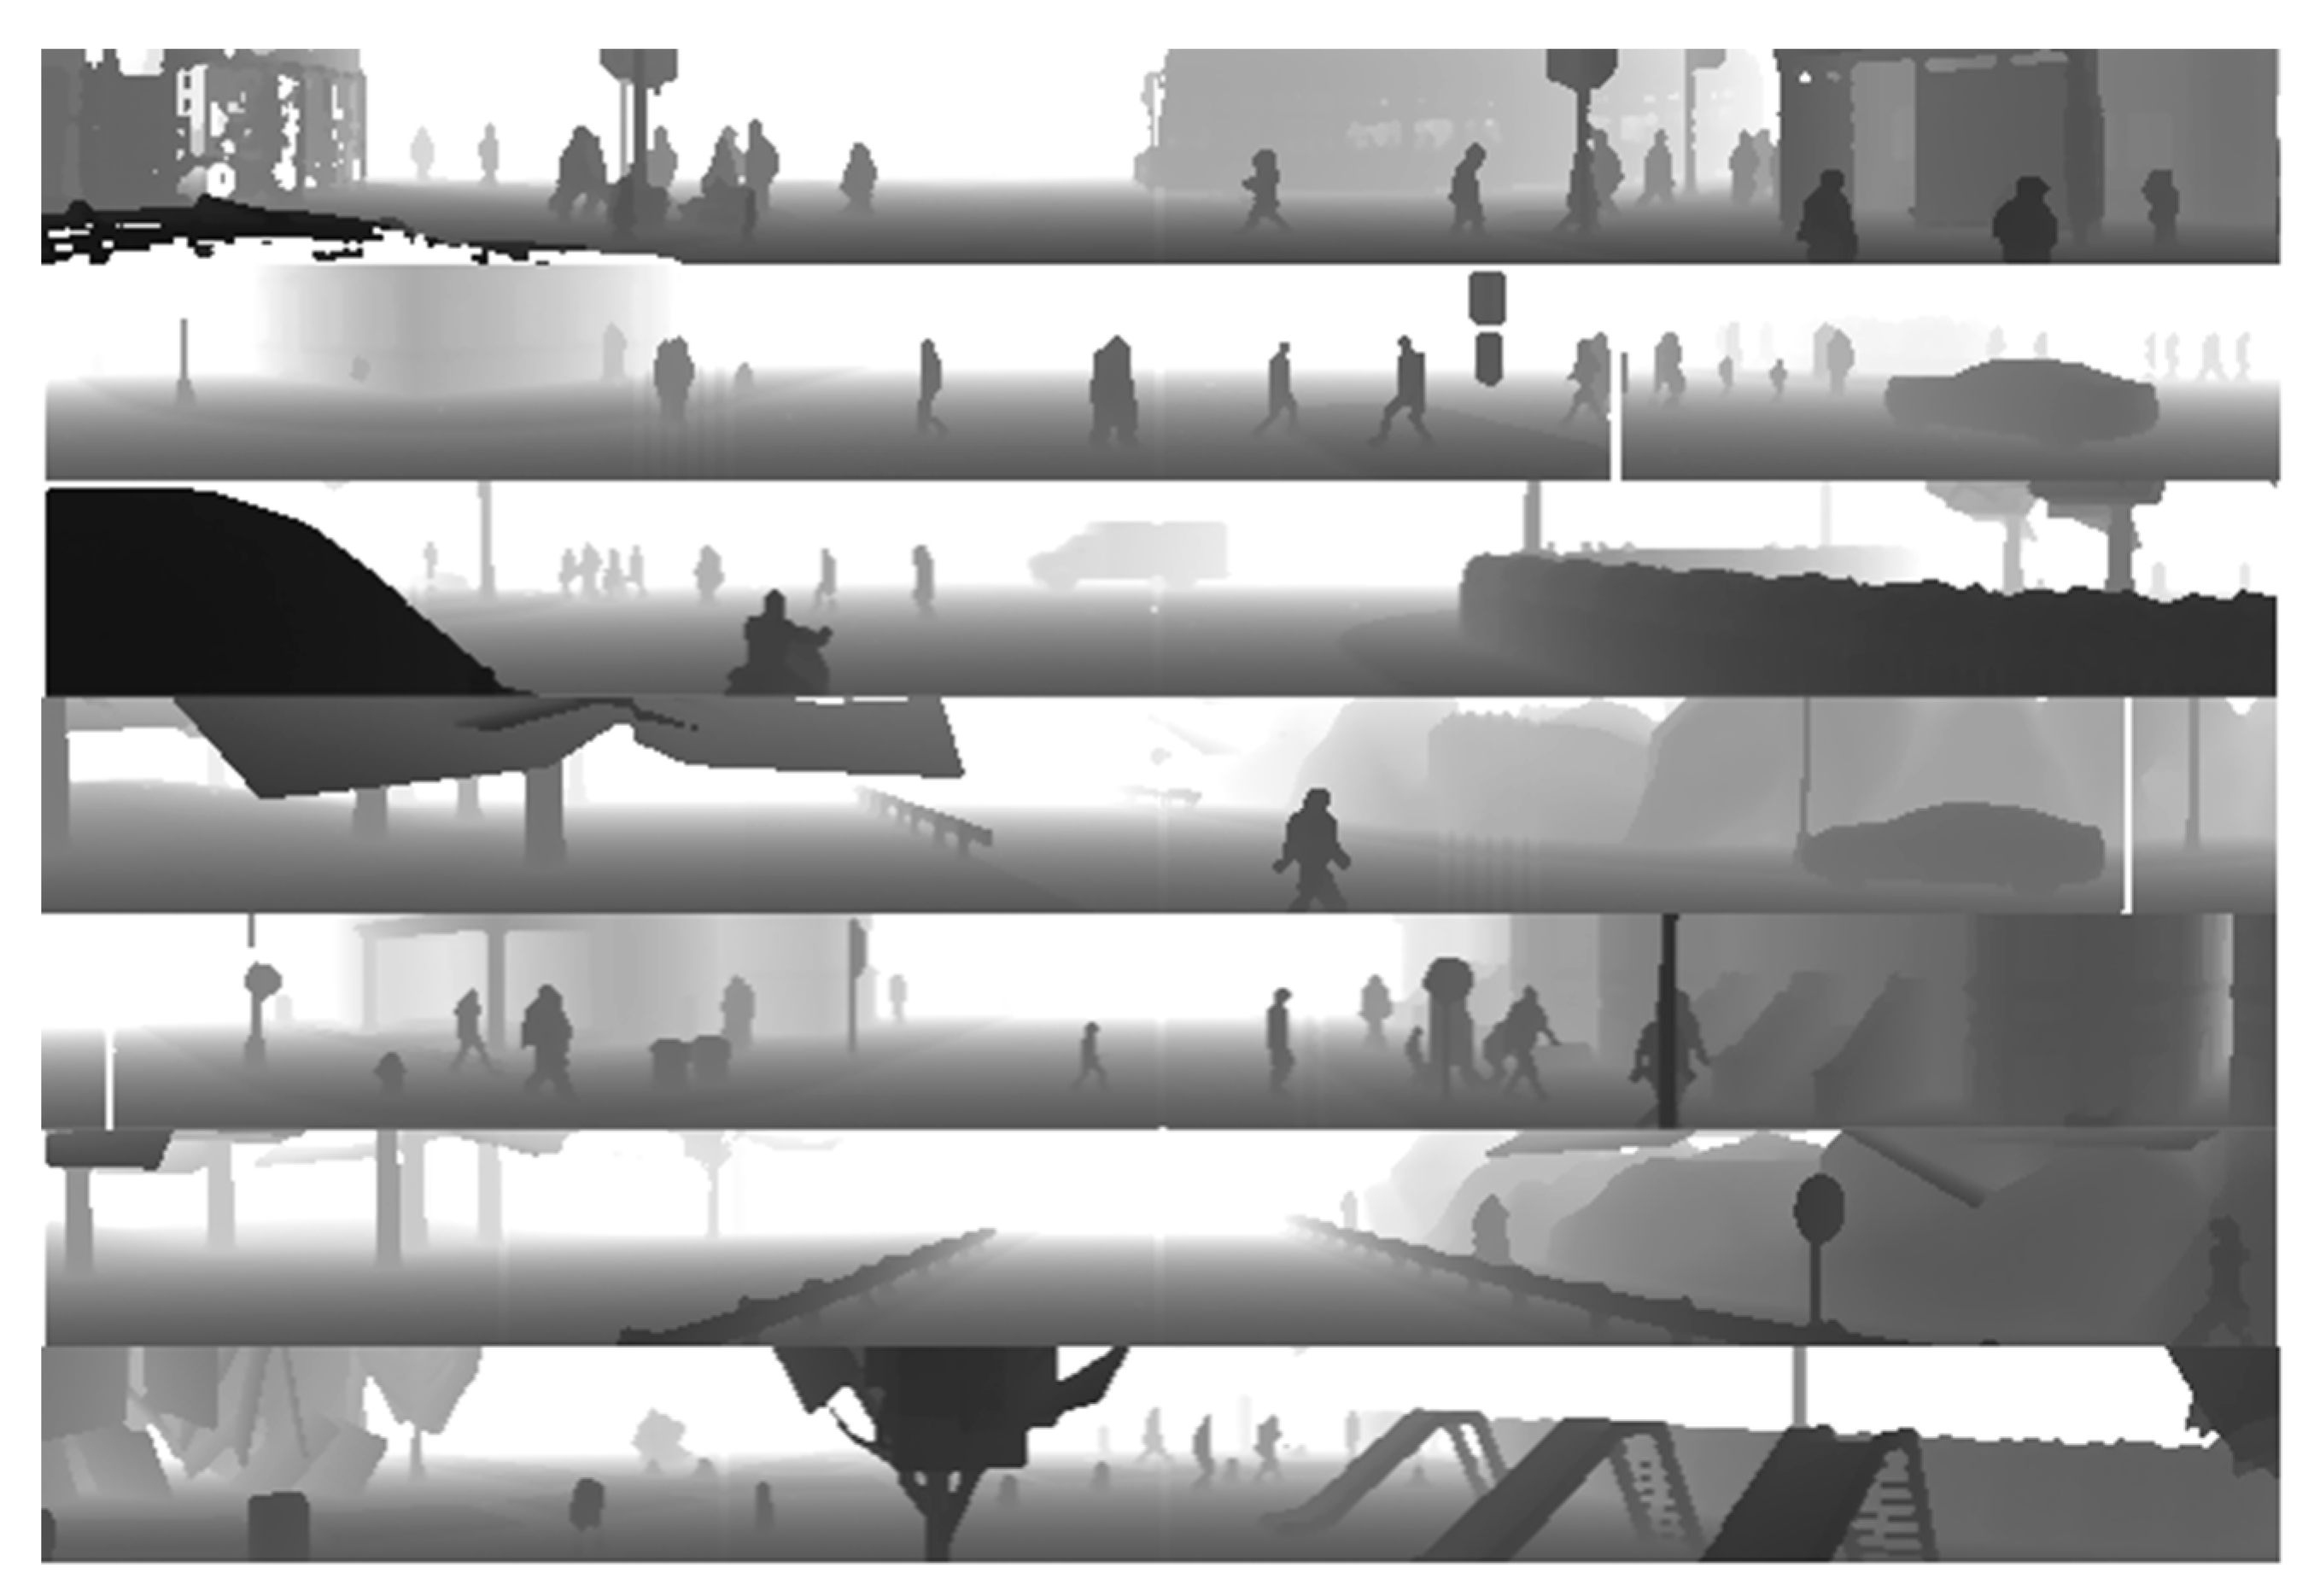
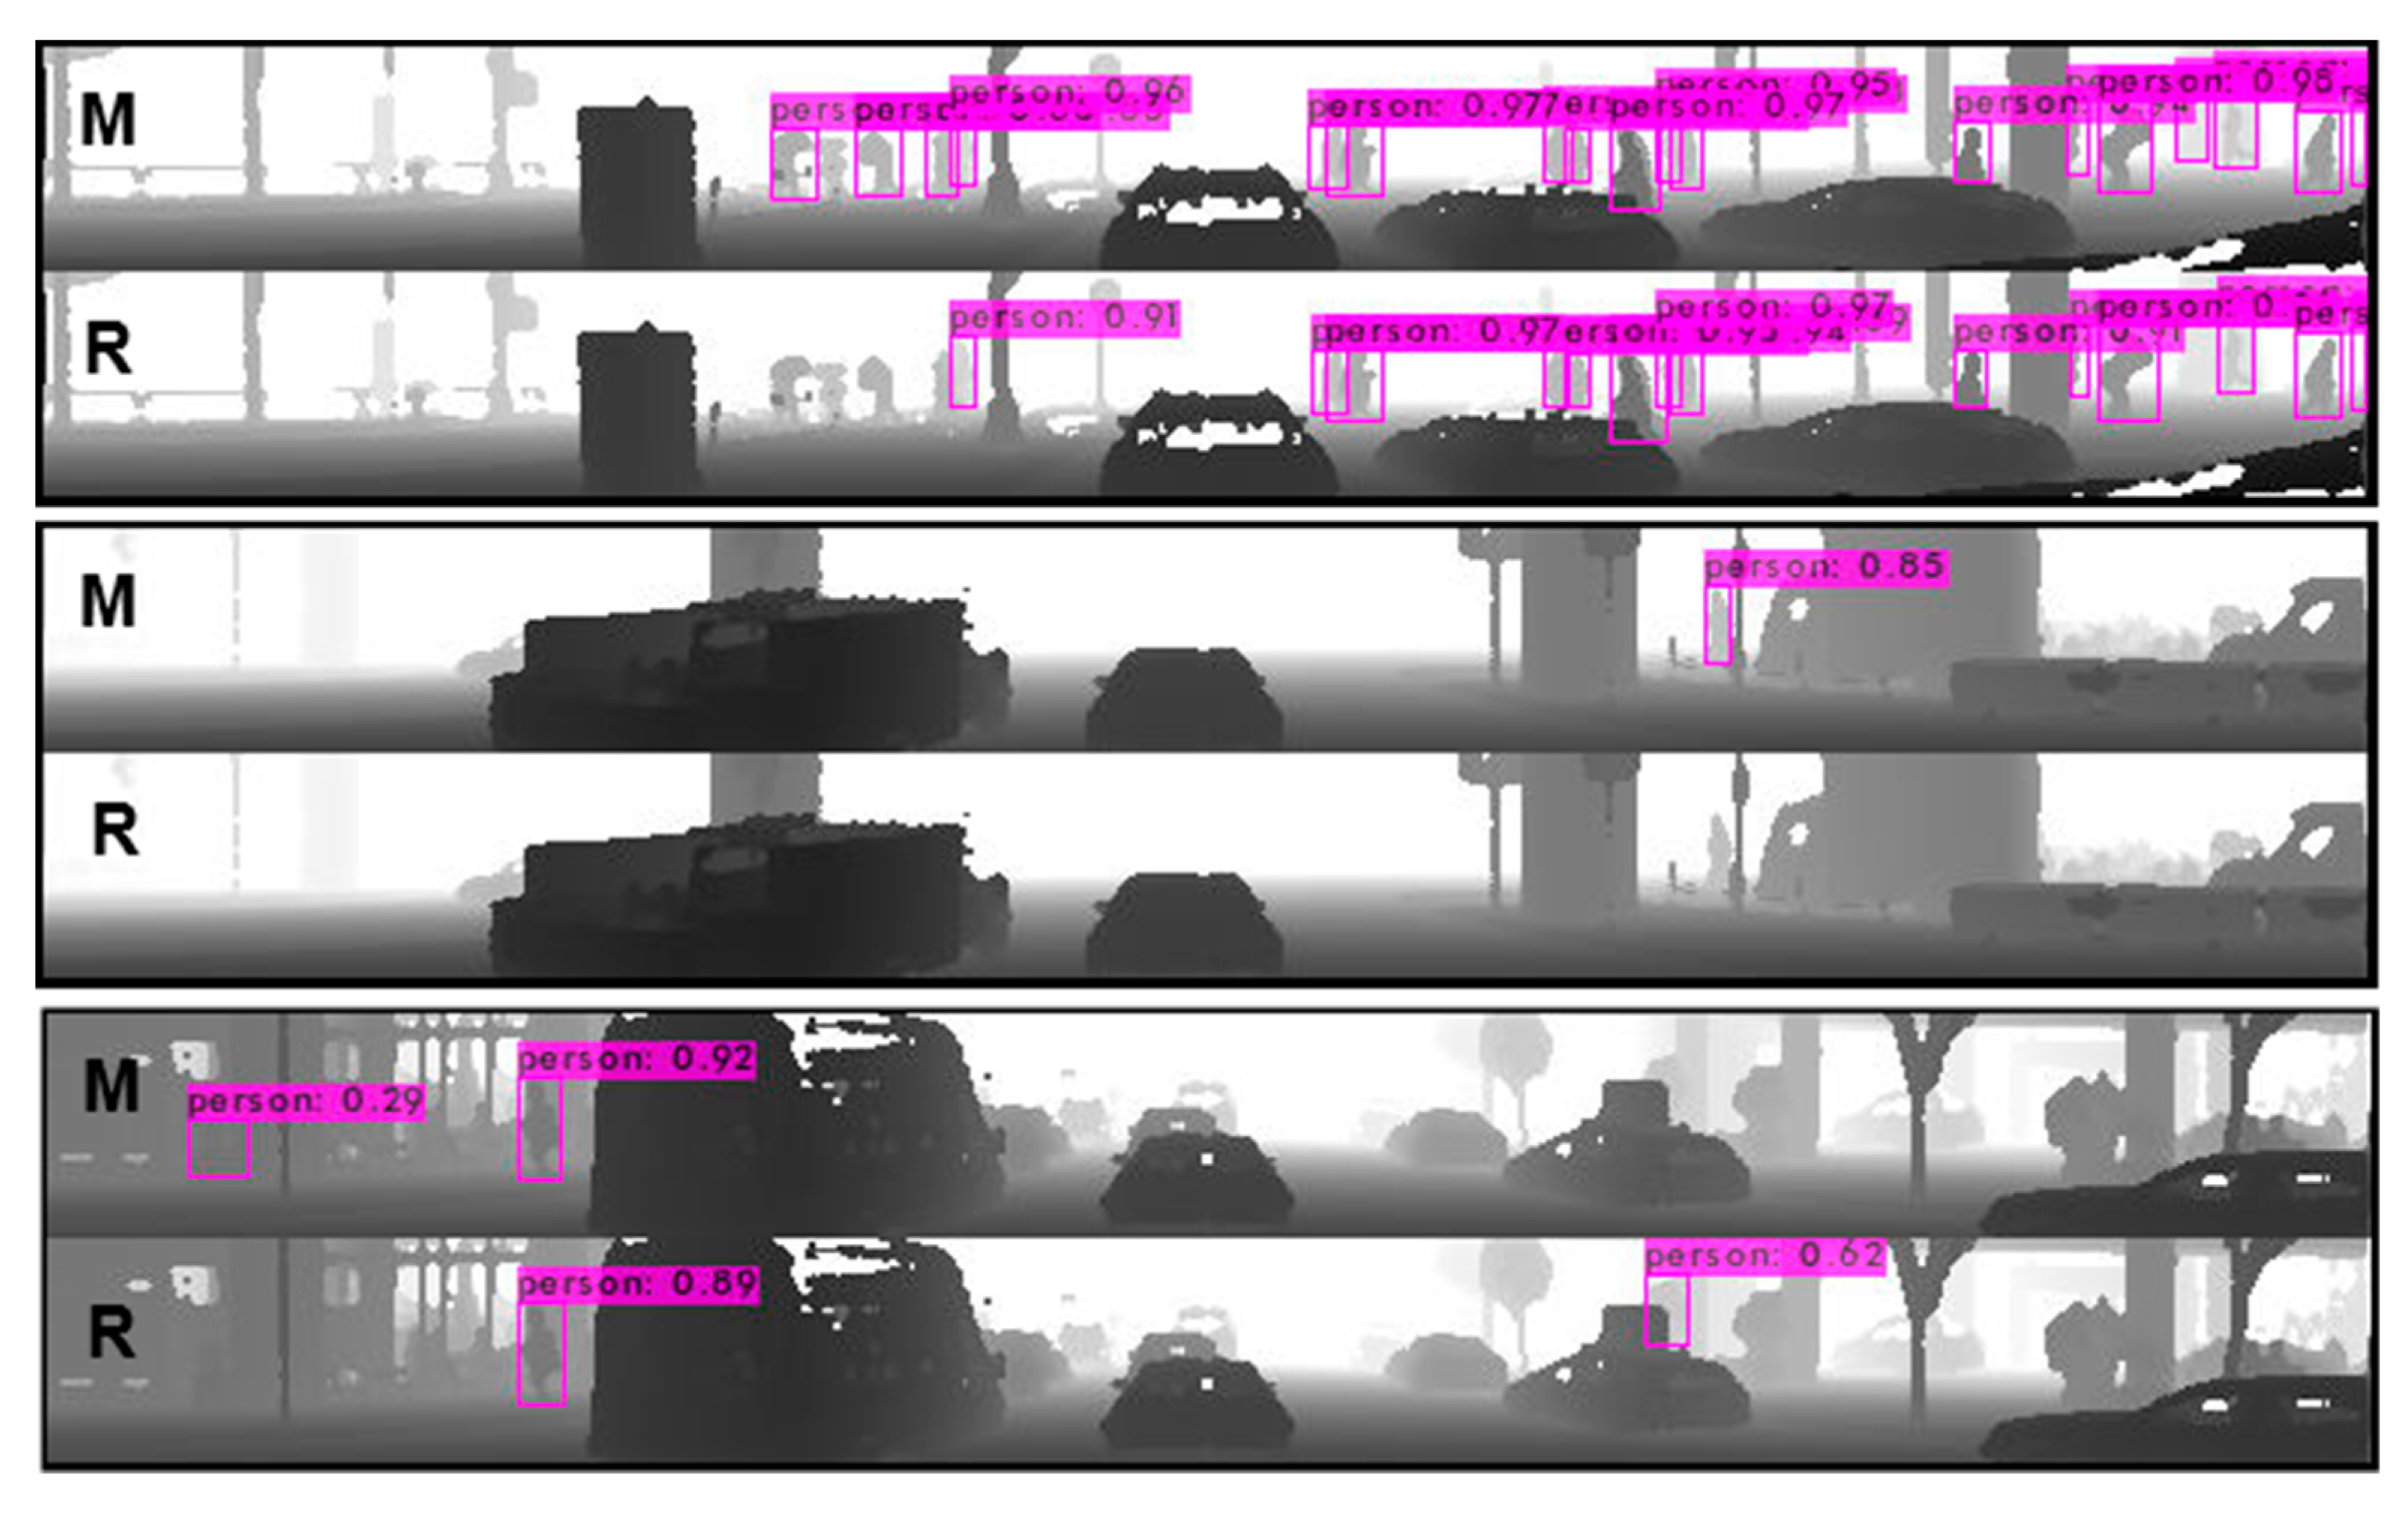
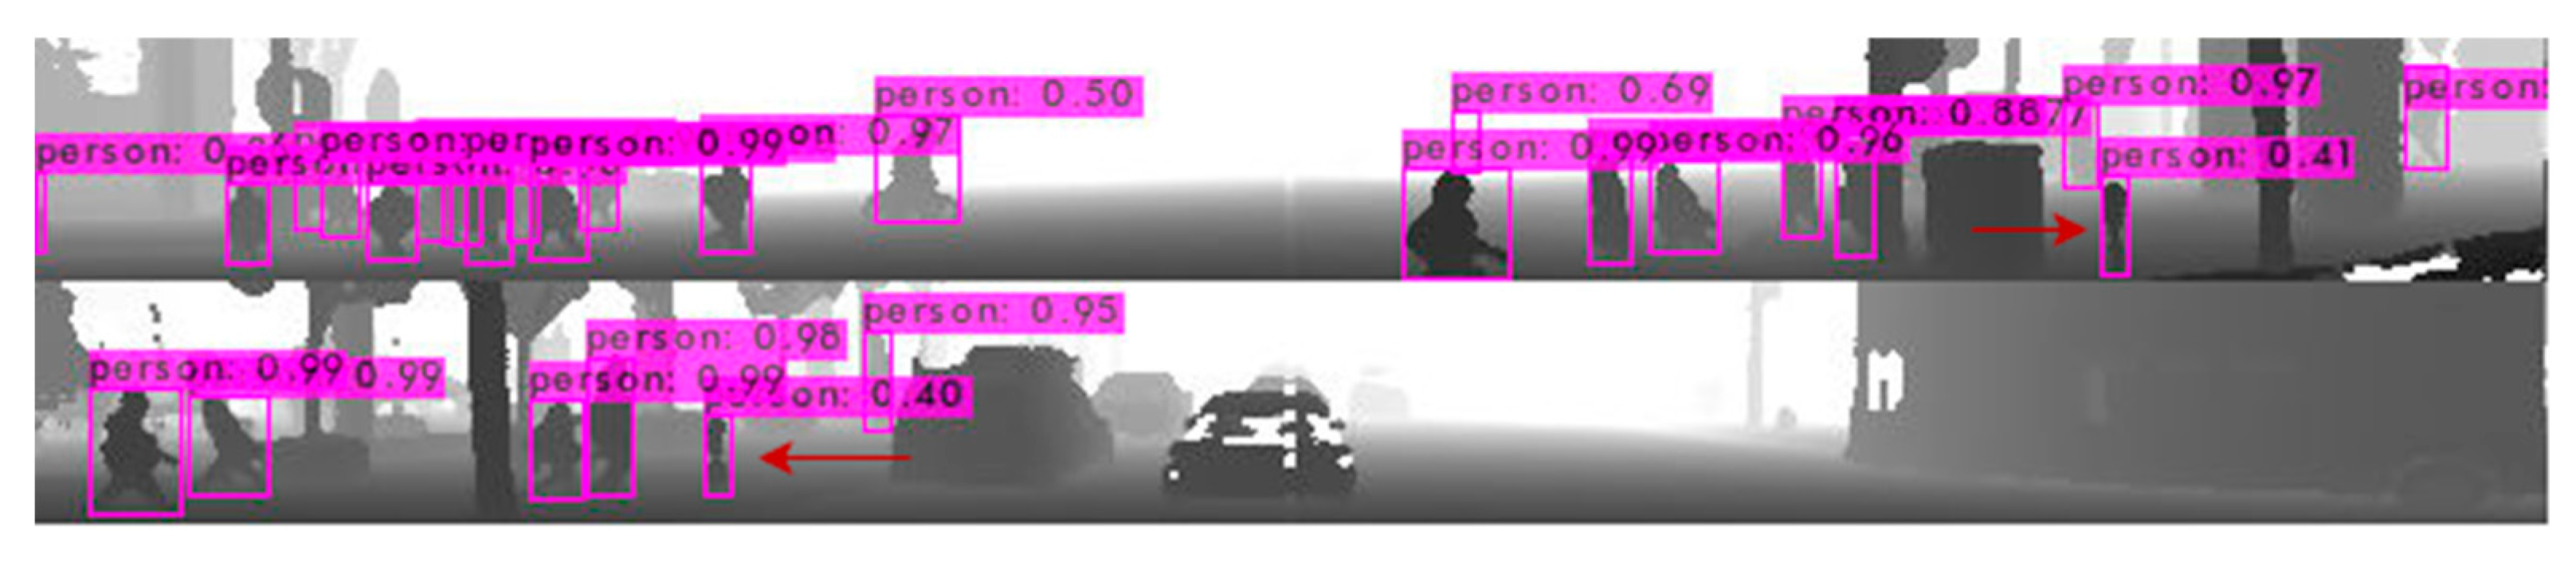
6.1. Inference Examples
6.2. Discussion
7. Conclusions
Author Contributions
Funding
Institutional Review Board Statement
Informed Consent Statement
Data Availability Statement
Conflicts of Interest
References
- Dosovitskiy, A.; Ros, G.; Codevilla, F.; Lopez, A.; Koltun, V. CARLA: An Open Urban Driving Simulator. In Proceedings of the Machine Learning Research, Amsterdam, The Netherlands, 7–10 July 2017; Volume 78, pp. 1–16. [Google Scholar]
- Fabbri, M.; Brasó, G.; Maugeri, G.; Cetintas, O.; Gasparini, R.; Ošep, A.; Calderara, S.; Leal-Taixé, L.; Cucchiara, R. Motsynth: How can synthetic data help pedestrian detection and tracking? In Proceedings of the IEEE/CVF International Conference on Computer Vision, Montreal, QC, Canada, 10–17 October 2021; pp. 10849–10859. [Google Scholar]
- Sun, P.; Kretzschmar, H.; Dotiwalla, X.; Chouard, A.; Patnaik, V.; Tsui, P.; Guo, J.; Zhou, Y.; Chai, Y.; Caine, B.; et al. Scalability in Perception for Autonomous Driving: Waymo Open Dataset. In Proceedings of the IEEE Conference on Computer Vision and Pattern Recognition (CVPR), Seattle, WA, USA, 13–19 June 2020; pp. 2446–2454. [Google Scholar]
- Clausen, J.; Olteanu, Y. New Players in the Automotive Industry: Waymo, Build Your Dreams and Sono Motors; Tech. Rep.; Borderstep: Berlin, Germany, 2021. [Google Scholar]
- Kim, T.-H.; Park, T.-H. Placement Optimization of Multiple Lidar Sensors for Autonomous Vehicles. IEEE Trans. Intell. Transp. Syst. 2019, 21, 2139–2145. [Google Scholar] [CrossRef]
- Amzajerdian, F.; Pierrottet, D.; Petway, L.B.; Hines, G.D.; Roback, V.E.; Reisse, R.A. Lidar Sensors for Autonomous Landing and Hazard Avoidance; American Institute of Aeronautics and Astronautics: Reston, VA, USA, 2013. [Google Scholar] [CrossRef]
- Yanase, R.; Hirano, D.; Aldibaja, M.; Yoneda, K.; Suganuma, N. LiDAR- and Radar-Based Robust Vehicle Localization with Confidence Estimation of Matching Results. Sensors 2022, 22, 3545. [Google Scholar] [CrossRef] [PubMed]
- Jabłoński, P.; Iwaniec, J.; Jabłoński, M. Multisensory Testing Framework for Advanced Driver Assistant Systems Supported by High-Quality 3D Simulation. Sensors 2021, 21, 8458. [Google Scholar] [CrossRef] [PubMed]
- Hurl, B.; Czarnecki, K.; Waslander, S. Precise Synthetic Image and LiDAR (PreSIL) Dataset for Autonomous Vehicle Perception. In Proceedings of the 2019 IEEE Intelligent Vehicle Symposium (IV), Paris, France, 9–12 June 2019; pp. 2522–2529. [Google Scholar] [CrossRef]
- Szarvas, M.; Yoshizawa, A.; Yamamoto, M.; Ogata, J. Pedestrian detection with convolutional neural networks. In Proceedings of the Intelligent Vehicles Symposium, Las Vegas, NV, USA, 6–8 June 2005; pp. 224–229. [Google Scholar] [CrossRef]
- Dworak, D.; Ciepiela, F.; Derbisz, J.; Izzat, I.; Komorkiewicz, M.; Wojcik, M. Performance of LiDAR object detection deep learning architectures based on artificially generated point cloud data from CARLA simulator. In Proceedings of the International conference on Methods and Models in Automation and Robotics MMAR, Miedzyzdroje, Poland, 26–29 August 2019; pp. 600–605. [Google Scholar] [CrossRef]
- Wang, F.; Zhuang, Y.; Gu, H.; Hu, H. Automatic Generation of Synthetic LiDAR Point Clouds for 3-D Data Analysis. IEEE Trans. Instrum. Meas. 2019, 68, 2671–2673. [Google Scholar] [CrossRef]
- Wu, T.; Fu, H.; Liu, B.; Xue, H.; Ren, R.; Tu, Z. Detailed Analysis on Generating the Range Image for LiDAR Point Cloud Processing. Electronics 2021, 10, 1224. [Google Scholar] [CrossRef]
- Biasutti, P.; Aujol, J.F.; Brédif, M.; Bugeau, A. Range-Image: Incorporating Sensor Topology for Lidar Point Cloud Processing. Photogramm. Eng. Remote Sens. 2018, 84, 367–375. [Google Scholar] [CrossRef]
- Ros, G.; Sellart, L.; Materzynska, J.; Vazquez, D.; Lopez, A.M. The SYNTHIA Dataset: A Large Collection of Synthetic Images for Semantic Segmentation of Urban Scenes. In Proceedings of the IEEE Conference on Computer Vision and Pattern Recognition, Las Vegas, NV, USA, 27–30 June 2016; pp. 3234–3243. [Google Scholar] [CrossRef]
- Vivan, G.P.; Goberville, N.; Asher, Z.; Brown, N.; Rojas, J. No Cost Autonomous Vehicle Advancements in CARLA through ROS. SAE Mobilus 2021. [Google Scholar] [CrossRef]
- Bochkovskiy, A.; Wang, C.Y.; Liao, H.Y.M. Yolov4: Optimal speed and accuracy of object detection. arXiv 2020, arXiv:2004.10934v1. [Google Scholar]
- Ponomarev, E.; Matveev, S.; Oseledets, I.; Glukhov, V. Latency Estimation Tool and Investigation of Neural Networks Inference on Mobile GPU. Computers 2021, 10, 104. [Google Scholar] [CrossRef]
- World Health Organization. Global Status Report on Road Safety 2018; World Health Organization: Geneva, Switzerland, 2018.
- Budzyński, M.; Gumińska, L.; Jeliński, Ł.; Kieć, M. Pedestrian safety in road traffic—Studies, recommendations and proposed improvements. MATEC Web Conf. 2017, 122, 01002. [Google Scholar] [CrossRef]
- Liu, Y.; Sun, P.; Wergeles, N.; Shang, Y. A survey and performance evaluation of deep learning methods for small object detection. Expert Syst. Appl. 2021, 172, 114602. [Google Scholar] [CrossRef]
- Zhao, L.; Thorpe, C. Stereo and neural network-based pedestrian detection. IEEE Trans. Intell. Transp. Syst. 2000, 1, 148–154. [Google Scholar] [CrossRef]
- Woehler, C.; Anlauf, J.K.; Franke, U. A time delay neural network algorithm for real-time pedestrian recognition. In Proceedings of the IEEE International Conference on Intelligent Vehicles IV 1998, Stuttgart, Germany, 28–30 October 1998; pp. 247–252. [Google Scholar]
- Roszyk, K.; Nowicki, M.R.; Skrzypczyński, P. Adopting the YOLOv4 Architecture for Low-Latency Multispectral Pedestrian Detection in Autonomous Driving. Sensors 2022, 22, 1082. [Google Scholar] [CrossRef]
- Zuo, X.; Li, J.; Huang, J.; Yang, F.; Qiu, T.; Jiang, Y. Pedestrian detection based on one-stage YOLO algorithm. J. Phys. Conf. Ser. 2021, 1871, 012131. [Google Scholar] [CrossRef]
- Velodyne Lidar HDL-64E. Available online: https://velodynelidar.com/blog/hdl-64e-lidar-sensor-retires (accessed on 5 July 2022).
- Azevedo, F.; Dias, A.; Almeida, J.; Oliveira, A.; Ferreira, A.; Santos, T.; Martins, A.; Silva, E. LiDAR-Based Real-Time Detection and Modeling of Power Lines for Unmanned Aerial Vehicles. Sensors 2019, 19, 1812. [Google Scholar] [CrossRef]
- Gao, F.; Li, C.; Zhang, B. A Dynamic Clustering Algorithm for Lidar Obstacle Detection of Autonomous Driving System. IEEE Sensors J. 2021, 21, 25922–25930. [Google Scholar] [CrossRef]
- Tian, D.; Han, Y.; Wang, B.; Guan, T.; Wei, W. A Review of Intelligent Driving Pedestrian Detection Based on Deep Learning. Comput. Intell. Neurosci. 2021, 2021, 5410049. [Google Scholar] [CrossRef]
- Girshick, R.; Donahue, J.; Darrell, T.; Malik, J. Rich feature hierarchies for accurate object detection and semantic segmentation. In Proceedings of the IEEE Conference on Computer Vision and Pattern Recognition, Columbus, OH, USA, 23–28 June 2014; pp. 580–587. [Google Scholar]
- Redmon, J.; Divvala, S.; Girshick, R.; Farhadi, A. You only look once: Unified, real-time object detection. In Proceedings of the IEEE Conference on Computer Vision and Pattern Recognition, Las Vegas, NV, USA, 27–30 June 2016; pp. 779–788. [Google Scholar]
- Redmon, J.; Farhadi, A. Yolo9000: Better, faster, stronger. In Proceedings of the 30th IEEE/CVF Conference on Computer Vision and Pattern Recognition (CVPR), Honolulu, HI, USA, 21–26 July 2017. [Google Scholar]
- Redmon, J.; Farhadi, A. Yolov3: An incremental improvement. arXiv 2018, arXiv:1804.02767. [Google Scholar]
- Bochkovskiy, A. Yolo v4, v3 and v2 for Windows and Linux. Github Repository. Available online: https://github.com/ccie29441/Yolo-v4-and-Yolo-v3-v2-for-Windows-and-Linux (accessed on 7 August 2022).
- Omar, Z.M.; Ibrahim, J. An Overview of Darknet, Rise and Challenges and Its Assumptions. Int. J. Comput. Sci. Inf. Technol. 2020, 8, 110–116. [Google Scholar]
- Pathak, A.R.; Pandey, M.; Rautaray, S. Application of deep learning for object detection. Procedia Comput. Sci. 2018, 132, 1706–1717. [Google Scholar] [CrossRef]
- Padilla, R.; Netto, S.; da Silva, E. A Survey on Performance Metrics for Object-Detection Algorithms. In Proceedings of the 2020 International Conference on Systems, Signals and Image Processing (IWSSIP), Niteroi, Brazil, 1–3 July 2020. [Google Scholar] [CrossRef]
- Gong, M. A Novel Performance Measure for Machine Learning Classification. Int. J. Manag. Inf. Technol. 2021, 13, 11–19. [Google Scholar] [CrossRef]
- Olivier, M.; der Vaart, W.V.-V. Implementing State-of-the-Art Deep Learning Approaches for Archaeological Object Detection in Remotely-Sensed Data: The Results of Cross-Domain Collaboration. J. Comput. Appl. Archaeol. 2021, 4, 274–289. [Google Scholar] [CrossRef]
- Rezatofighi, H.; Tsoi, N.; Gwak, J.; Sadeghian, A.; Reid, I.; Savarese, S. Generalized Intersection Over union: A metric and a Loss for Bounding Box Regression. In Proceedings of the IEEE Conference on Computer Vision and Pattern Recognition 2019, Long Beach, CA, USA, 15–20 June 2019; pp. 658–666. [Google Scholar] [CrossRef]
- Sammut, C.; Webb, G.I. Encyclopaedia of Machine Learning; Springer: Boston, MA, USA, 2010. [Google Scholar] [CrossRef]
- Redmon, J. Darknet: Open Source Neural Networks in C, 2013–2016. Available online: https://pjreddie.com/darknet/ (accessed on 28 May 2022).
- Bochkovskiy, A. YOLOv3. GitHub Repository. Available online: https://github.com/AlexeyAB/darknet (accessed on 25 January 2021).
- Zhou, Y.; Sun, P.; Zhang, Y.; Anguelov, D.; Gao, J.; Ouyang, T.; Guo, J.; Ngiam, J.; Vasudevan, V. End-to-End Multi-View Fusion for 3D Object Detection in LiDAR Point Clouds. In Proceedings of the Conference on Robot Learning, Virtual, 16–18 November 2020; pp. 923–932. [Google Scholar]


| Parameter | Lidar Simulation | Waymo Top Lidar |
|---|---|---|
| Number of channels | 64 | 64 |
| Measurement range [m] | 75 | 75 |
| Vertical field of view [˚] | +2.4/−17.6 | +2.4/−17.6 |
| Horizon field of view [˚] | 360 | 360 |
| Angular resolution horizontal [˚] | 0.1358 | 0.1358 |
| Rotation rate [Hz] | 5 | - |
| Points per second | 0.848 M | - |
| Parameter | Set Value | Description |
|---|---|---|
| Atmosphere attenuation rate | 0.03 | Coefficient that measures the LiDAR intensity loss per meter. |
| Dropoff general rate | 0.35 | General proportion of points that are randomly dropped. |
| Dropoff intensity limit | 0.80 | For the intensity-based drop-off, the threshold intensity value above which no points are dropped. |
| Dropoff zero intensity | 0.40 | For the intensity-based drop-off, the probability of each point with zero intensity being dropped. |
| Noise standard deviation [m] | 0.02 | Standard deviation of the noise model to disturb each point along the vector of its raycast. |
| Dataset | Data Size | F1-Score | Precision | Recall |
|---|---|---|---|---|
| Synthetic Carla | 2.5 k | 0.76 | 0.8 | 0.72 |
| Real Waymo | 2.5 k | 0.81 | 0.86 | 0.76 |
| Mixed synthetic and real | 5 k (2.5 k/2.5 k) | 0.84 | 0.89 | 0.8 |
| Dataset | Data Size | F1-Score | Precision | Recall |
|---|---|---|---|---|
| Mixed synthetic and real | 5 k (50/50) | 0.81 | 0.86 | 0.77 |
| Extended real Waymo | 5 K | 0.81 | 0.85 | 0.77 |
| Extended mixed | 10 k (35/65) | 0.82 | 0.88 | 0.77 |
Publisher’s Note: MDPI stays neutral with regard to jurisdictional claims in published maps and institutional affiliations. |
© 2022 by the authors. Licensee MDPI, Basel, Switzerland. This article is an open access article distributed under the terms and conditions of the Creative Commons Attribution (CC BY) license (https://creativecommons.org/licenses/by/4.0/).
Share and Cite
Jabłoński, P.; Iwaniec, J.; Zabierowski, W. Comparison of Pedestrian Detectors for LiDAR Sensor Trained on Custom Synthetic, Real and Mixed Datasets. Sensors 2022, 22, 7014. https://doi.org/10.3390/s22187014
Jabłoński P, Iwaniec J, Zabierowski W. Comparison of Pedestrian Detectors for LiDAR Sensor Trained on Custom Synthetic, Real and Mixed Datasets. Sensors. 2022; 22(18):7014. https://doi.org/10.3390/s22187014
Chicago/Turabian StyleJabłoński, Paweł, Joanna Iwaniec, and Wojciech Zabierowski. 2022. "Comparison of Pedestrian Detectors for LiDAR Sensor Trained on Custom Synthetic, Real and Mixed Datasets" Sensors 22, no. 18: 7014. https://doi.org/10.3390/s22187014
APA StyleJabłoński, P., Iwaniec, J., & Zabierowski, W. (2022). Comparison of Pedestrian Detectors for LiDAR Sensor Trained on Custom Synthetic, Real and Mixed Datasets. Sensors, 22(18), 7014. https://doi.org/10.3390/s22187014