Article

Design Optimization of a Submersible Chemiluminescent Sensor (DISCO) for Improved Quantification of Reactive Oxygen Species (ROS) in Surface Waters

1
MIT-WHOI Joint Program in Oceanography, Cambridge, MA 02139, USA
2
Woods Hole Oceanographic Institution, Marine Chemistry and Geochemistry, Woods Hole, MA 02543, USA
3
Woods Hole Oceanographic Institution, Applied Ocean Physics and Engineering, Woods Hole, MA 02543, USA
*
Author to whom correspondence should be addressed.
Sensors 2022, 22(17), 6683; https://doi.org/10.3390/s22176683
Submission received: 29 July 2022 / Revised: 30 August 2022 / Accepted: 31 August 2022 / Published: 3 September 2022
(This article belongs to the Special Issue Advances in Ocean Sensors)

Abstract

:
Reactive oxygen species (ROS) are key drivers of biogeochemical cycling while also exhibiting both positive and negative effects on marine ecosystem health. However, quantification of the ROS superoxide (O2) within environmental systems is hindered by its short half-life. Recently, the development of the diver-operated submersible chemiluminescent sensor (DISCO), a submersible, handheld instrument, enabled in situ superoxide measurements in real time within shallow coral reef ecosystems. Here, we present a redesigned and improved instrument, DISCO II. Similar to the previous DISCO, DISCO II is a self-contained, submersible sensor, deployable to 30 m depth and capable of measuring reactive intermediate species in real time. DISCO II is smaller, lighter, lower cost, and more robust than its predecessor. Laboratory validation of DISCO II demonstrated an average limit of detection in natural seawater of 133.1 pM and a percent variance of 0.7%, with stable photo multiplier tube (PMT) counts, internal temperature, and flow rates. DISCO II can also be optimized for diverse environmental conditions by adjustment of the PMT supply voltage and integration time. Field tests showed no drift in the data with a percent variance of 3.0%. Wand tip adaptations allow for in situ calibrations and decay rates of superoxide using a chemical source of superoxide (SOTS-1). Overall, DISCO II is a versatile, user-friendly sensor that enables measurements in diverse environments, thereby improving our understanding of the cycling of reactive intermediates, such as ROS, across various marine ecosystems.

1. Introduction

Understanding the response of organisms to stress is crucial for predicting the tolerance and adaptive capabilities of critical ocean ecosystems to global environmental changes. Reactive oxygen species (ROS), including superoxide (O2) and hydrogen peroxide (H2O2), are recognized as vital compounds produced both as a byproduct of stress as well as a means for preventing stress [1,2,3,4,5,6,7]. This dynamic role that ROS play in organism health is largely dependent on the concentration and location of production [8]. Traditionally, ROS have been viewed as molecules that cause stress in organisms; when produced intracellularly, elevated concentrations are commonly linked to health decline and diseases within eukaryotes, possibly leading to cell apoptosis [1,2]. For example, the buildup of intracellular (IC) ROS is often postulated as a trigger of coral bleaching [9,10]. However, more recent research has illustrated that IC-ROS production did not lead to symbiont expulsion [11] and elevated temperatures did not necessarily produce elevated levels of IC-ROS [12,13,14,15], raising doubt about such a link between IC-ROS and bleaching. Additional research also highlighted the important health benefits of ROS; at lower concentrations, ROS is beneficial in physiological processes, such as micronutrient acquisition, cell signaling, and growth stimulation [3,4,5,6,7]. For example, when produced extracellularly at high concentrations, ROS can play a major role in the immune response to stress in processes, such as pathogen defense, antimicrobial effects, and physiochemical defense against heat stress, osmotic stress, and wound repair [16,17,18,19,20,21,22,23,24,25,26,27,28,29,30,31].
Due to the challenges presented when measuring superoxide, most of these health benefits associated with marine organisms have been observed in cultures and in laboratories [22,26,27,32,33,34,35,36]. As a radical species with a half-life in the order of tens of seconds, superoxide represents a particularly challenging molecule to measure in the field, limiting widespread characterization of its environmental concentrations and hindering studies of its distribution and behavior under natural conditions [34,37,38,39]. The pKa of superoxide is 4.88 and, therefore, at near-neutral pH, such as that within the ocean, the superoxide anion is the dominant form (O2). Since superoxide does not pass through intact cell membranes [40], superoxide measured outside of organisms must be produced extracellularly [26,41]. A few studies have attempted to better understand superoxide production within natural environments by measuring extracellular (EC) superoxide within laboratory incubations [42], by extrapolating in situ production rates based on decay kinetics [43], and by using a benchtop instrument in shallow waters to make real-time measurements [41]. Despite such progress, these previous approaches fall short of measuring EC-superoxide production directly and are cumbersome, impractical, and restricted to calm, shallow water environments.
To directly measure superoxide concentrations in situ, we recently developed the diver-operated submersible chemiluminescent sensor (DISCO) [44]. This initial version of DISCO (hereafter referred to as DISCO I) is based on the same chemiluminescent method as a commonly utilized benchtop instrument, the FeLume [45]. The components used in the design of DISCO I were selected and/or manufactured to create a compact, submersible, handheld instrument that could be operated by a diver underwater. Initial field application of DISCO I provided the first in situ measurements of EC superoxide associated with coral reefs using a deployable sensor [44].
Direct measurements of superoxide within marine ecosystems may provide critical insight into the controls on organismal health. For example, EC-superoxide measurements associated with corals by DISCO I confirmed that coral EC-superoxide levels are species specific across several geographic regions [41,44]. Consistently high EC-superoxide concentrations associated with healthy coral were observed, with exceptionally high concentrations associated with species (i.e., Porites species) known to be stress and disease resistant [46]. These initial findings may point to EC-superoxide production as a beneficial process to coral health, possibly aiding in pathogen defense [44]. DISCO I enabled the measurement of EC superoxide at greater depths and across a wider variety of hydrographic conditions than was previously possible [41,44].
The goal of this study was to redesign DISCO II, which we present here along with a series of laboratory and field tests to verify the precision and accuracy of the instrument. DISCO II measures superoxide with a similar detection limit, yet improved sensitivity, and is more user-friendly, adaptable, and robust than DISCO I. Using DISCO I as a foundation, DISCO II is composed of a more advanced user interface, an improved fluidics module that draws less power, minimizing baseline drift and leading to a longer battery life, and an operation software that is easily adaptable. Contained within a smaller, lighter submersible housing, these improvements collectively contribute to a more robust and cost-effective sensor. These updates allow DISCO II to be more easily adopted by the scientific community and utilized across various aquatic environments, which will ultimately improve our understanding of these elusive chemicals in the environment.

2. Materials and Methods

2.1. DISCO II Design

DISCO II operates using the same principles as DISCO I [44] with important improvements to specific components and overall design (Figure 1 and Table 1). First, DISCO II contains three separate compartments: (1) a pressure-bearing compartment containing the electronics, fluid-handling pumps and lines, and photomultiplier tube (PMT), (2) an oil-compensated compartment containing a touch-screen tablet for user operation and data storage, and (3) a flooded compartment containing the reagent bags. Similar to DISCO I, DISCO II incorporates a sampling wand, which extends from the instrument to collect analyte waters, allowing the user to direct environmental samples into the instrument for analysis. The overall cost to reproduce DISCO is under USD 10,000, which is an improvement from the original DISCO I, which is estimated to cost over USD 15,000.

2.1.1. Major Improvements from DISCO I

The major improvements from DISCO I primarily include replacing the large and power-hungry syringe pumps with low-power miniature peristaltic pumps and replacing the limited “push button” user control interface with a full-fledged diver-operated touchscreen tablet. The new smaller peristaltic pumps require much less space inside the pressure-bearing section. In addition, since they require less power, it is possible to power DISCO II using a small internal lithium-ion battery, instead of the larger external battery used in DISCO I. As a result, DISCO II measures 40.6 cm L × 27.9 cm W × 14.0 cm D and weighs 10.2 kg in air, or about 38% of the size and weight of DISCO I (both versions weigh around 1kg in seawater, salinity 35 g kg−1).
The second major improvement in DISCO II is the touchscreen tablet user interface. In DISCO I, the instrument was controlled using a separate four-button handheld unit with a small display screen. In contrast, DISCO II incorporates a fully functional touchscreen tablet on the front of the instrument. This not only makes the instrument more compact but also provides vastly increased versatility and adaptability. DISCO II can be reconfigured for other software programs and the current user interface software can be amended and optimized for specific sampling parameters. The size of the screen also enhances the ability of the diver to view the signal and the touch interface facilitates a more straightforward and easier interaction.
A minor amendment to DISCO II includes the adaptation of the sample wand. DISCO II has a luer-lock attachment on the wand tip to enable sampling from a tubing connection, which facilitates in situ calibrations and decay rate measurements while increasing its versatility to sample from experimental set ups in lab-based experiments, for example.

2.1.2. DISCO II Function and Layout

The overall function and layout specifics of the instrument are provided in the DISCO II layout (Figure 1) and block diagram (Figure 2). The flooded compartment contains two reagent bags (BioProcesss Container, Thermo Scientific Labtainer, Waltham, MA USA), one for the chemiluminescent reagent and one for a solution that can mix directly with the analyte fluid (analyte-doping solution). These reagent bags can be exchanged in situ while DISCO is in use, therefore, allowing for extended reagent use and/or multiple analyte-doping solutions to be used during the same sampling session. These two reagent bags have individual fluid lines that enter the pressure-bearing section via a bulkhead. Within the pressure-bearing compartment, the analyte-doping solution line merges with the analyte line, allowing the analyte-doping solution to be directly introduced to the sample stream. Depending on the analyte-doping fluid (i.e., SOD or SOTS-1), this can help confirm specific measurements (i.e., SOD scavenges superoxide allowing for target confirmation) and/or amend the analyte for chemical analysis (i.e., SOTS-1 can be used as a standard addition for calibration or to measure superoxide decay rates within waters). This analyte line then joins the chemiluminescent reagent fluid lines in a Teflon flow cell (made in house) where chemiluminescent measurements are quantified by a photo multiplier tube (PMT, H9319, Hamamatsu Photonics, Hamamatsu City, Japan). The flow of the three fluid lines (chemiluminescent reagent, analyte-doping solution, and analyte) are individually controlled by miniature peristaltic pumps (model p625Instech Laboratories Inc., Plymouth Meeting, PA, USA) which are also housed within the pressure-bearing section. The analyte inflow and waste outflow lines are also monitored by flow and temperature sensors (SLF3S-0600F, Sensirion Inc., Stäfa, Switzerland) which are used to confirm both the flow rates of each pump and measure fluid temperature.
The pressure-bearing section also contains a custom-designed embedded controller (dimensions 5.7 cm L × 5.7 cm W) that multiplexes communication between the tablet computer, the PMT, and pumps. The tablet communicates with an Adafruit Feather M0 microprocessor (Adafruit Industries, New York City, NY, USA) incorporated into the embedded controller via a Bluetooth to transistor-transistor logic (TLL) Universal Asynchronous Receive and Transmit (UART) serial bridge connection. The M0 voltage controls the three pumps with a peripheral I2C quad channel digital-to-analog converter (PN MCP4728). The M0 also acquires the signal from the PMT over a TTL to RS-232 serial connection. Data from the PMT are collected at 2 Hz (two data points per second) and are displayed in real time on the touchscreen tablet.
The tablet itself is a Samsung Galaxy Book 2 (Samsung, Suwon-si, South Korea) touch tablet that is contained within the oil-compensated compartment. The specific features that enable the touchscreen to function underwater deserve special attention and description here. Through testing, we discovered that “Super AMOLED” touchscreen technology could operate well in oil, whereas the screen for a standard AMOLED touchscreen tablet rapidly deteriorated by turning black and eventually failing altogether. We speculate the key difference is that the Super AMOLED technology eliminates an air gap between the tablet’s outer glass surface and the touch-sensitive layer, which protects it from oil ingress. The oil-compensated compartment is covered by a 0.015″ sheet of clear polycarbonate, which retains the oil while enabling touchscreen capabilities.
The graphic user interface (GUI) was developed in the Python3 environment using a Samsung Galaxy Book II. The PyQt5 python package was used for development of the GUI’s physical user interfaces including buttons, numerical inputs, and text display. The Matplotlib python package was used on top of the PyQt5 GUI to plot/display real-time data from the sensor. In the background the GUI handles data storage and wireless serial over Bluetooth communication with the embedded electronics in the sensor for control and data acquisition. This interface allows control of the pumps and PMT, enabling the user to operate the pumps by touch and to view the PMT signal intensity, fluid flow rates, and fluid temperatures in real time. The PMT settings (i.e., supply voltage to the PMT—i.e., voltage, and integration time for each datapoint—i.e., IT) can also be adjusted in real time to allow for instrument optimization. Although flow rates can be adjusted by the user in real time, the user interface is also adapted to automatically adjust the sample line flow rate to compensate for the additional flow added from the analyte-doping fluid line. All data collected are stored within the tablet and can be exported via Bluetooth or wireless internet connection. Power is supplied via a rechargeable lithium-ion battery (ND205XA4 Inspired Energy, Newberry, FL, USA). The lithium-ion battery life is longer than that of the tablet (battery life ~12.5 h) and, therefore, does not limit the overall battery life of the instrument. DISCO II can make measurements to a maximum depth of 30 m, making it ideal for underwater handheld use.

2.2. Chemical Components

While DISCO II can be optimized to measure different chemical species depending on the chemiluminescent probe, here, DISCO II is first adapted to measure superoxide. The chemical principles for measuring superoxide are based upon DISCO I [44] and the benchtop instrument, the FeLume [45]. Briefly, DISCO II utilizes a chemiluminescent probe, Methyl Cyprindina Luciferin Analogue (MCLA, Santa Cruz Biotechnology, Dallas, TX, USA), which has a high specificity for superoxide. The MCLA (4 µmol L−1) reagent is prepared with a 50 mmol L−1 sodium acetate buffer, which contains 50 µmol L−1 diethylenetriaminepentaacetic acid (DTPA) and is adjusted to a pH of 6, as described by previous protocols [34,39]. MCLA stock solutions are kept frozen at −20 °C until mixed with the sodium acetate buffer, which is prepared daily and kept at temperatures similar to the target environment. Photons generated by the MCLA chemiluminescent reaction are measured by the PMT in counts [47], which are then converted to superoxide concentration with daily benchtop calibration curves (described in further detail below). These calibrations use analyte fluid as a matrix and are conducted at the same temperature and pH as the water analysis.
Two different analyte-doping solutions were tested independently during instrument verification. To confirm the measurement of superoxide, superoxide dismutase (SOD) can be added into the analyte line (2.5 U mL−1 final, after mixing with analyte) at the end of a sample measurement. SOD is an enzyme that rapidly degrades superoxide to hydrogen peroxide and molecular oxygen [48]. The concentrated SOD stock solution (20 U mL−1) within the reagent bag is made in Milli-Q water and kept frozen at −20 °C until used. Alternatively, a standard solution can be doped into the analyte line to provide in situ calibrations and decay rates. Here, we used superoxide thermal source (SOTS-1) as a standard solution, which was synthesized to produce superoxide slowly and continuously over a long period of time [49]. A 100 µM SOTS-1 solution was prepared in aged, filtered seawater (AFSW, 0.22 µm filtered seawater that is aged in the dark for >12 h after the addition of DTPA) 10 to 16 h prior to use and stored around in situ temperatures to achieve a steady-state concentration [50]. To prepare this solution, SOTS-1 was first dissolved in argon-purged dimethyl sulfoxide (DMSO; 100 µL per mg) prior to dilution in AFSW.

2.3. Laboratory Verification

2.3.1. Flow Rates

The fluidic system within DISCO II is optimized to pump analyte fluid at precise flow rates, delivering the sample fast enough to prevent decay, yet slow enough to allow analysis within the flow cell. Flow rates were analyzed over four days to evaluate stability of the precision. Tests were performed with DISCO II using DIW and flow rates were optimized within this study for subsequent superoxide measurements. The flow rate can be easily adjusted for other measurements via the user interface.

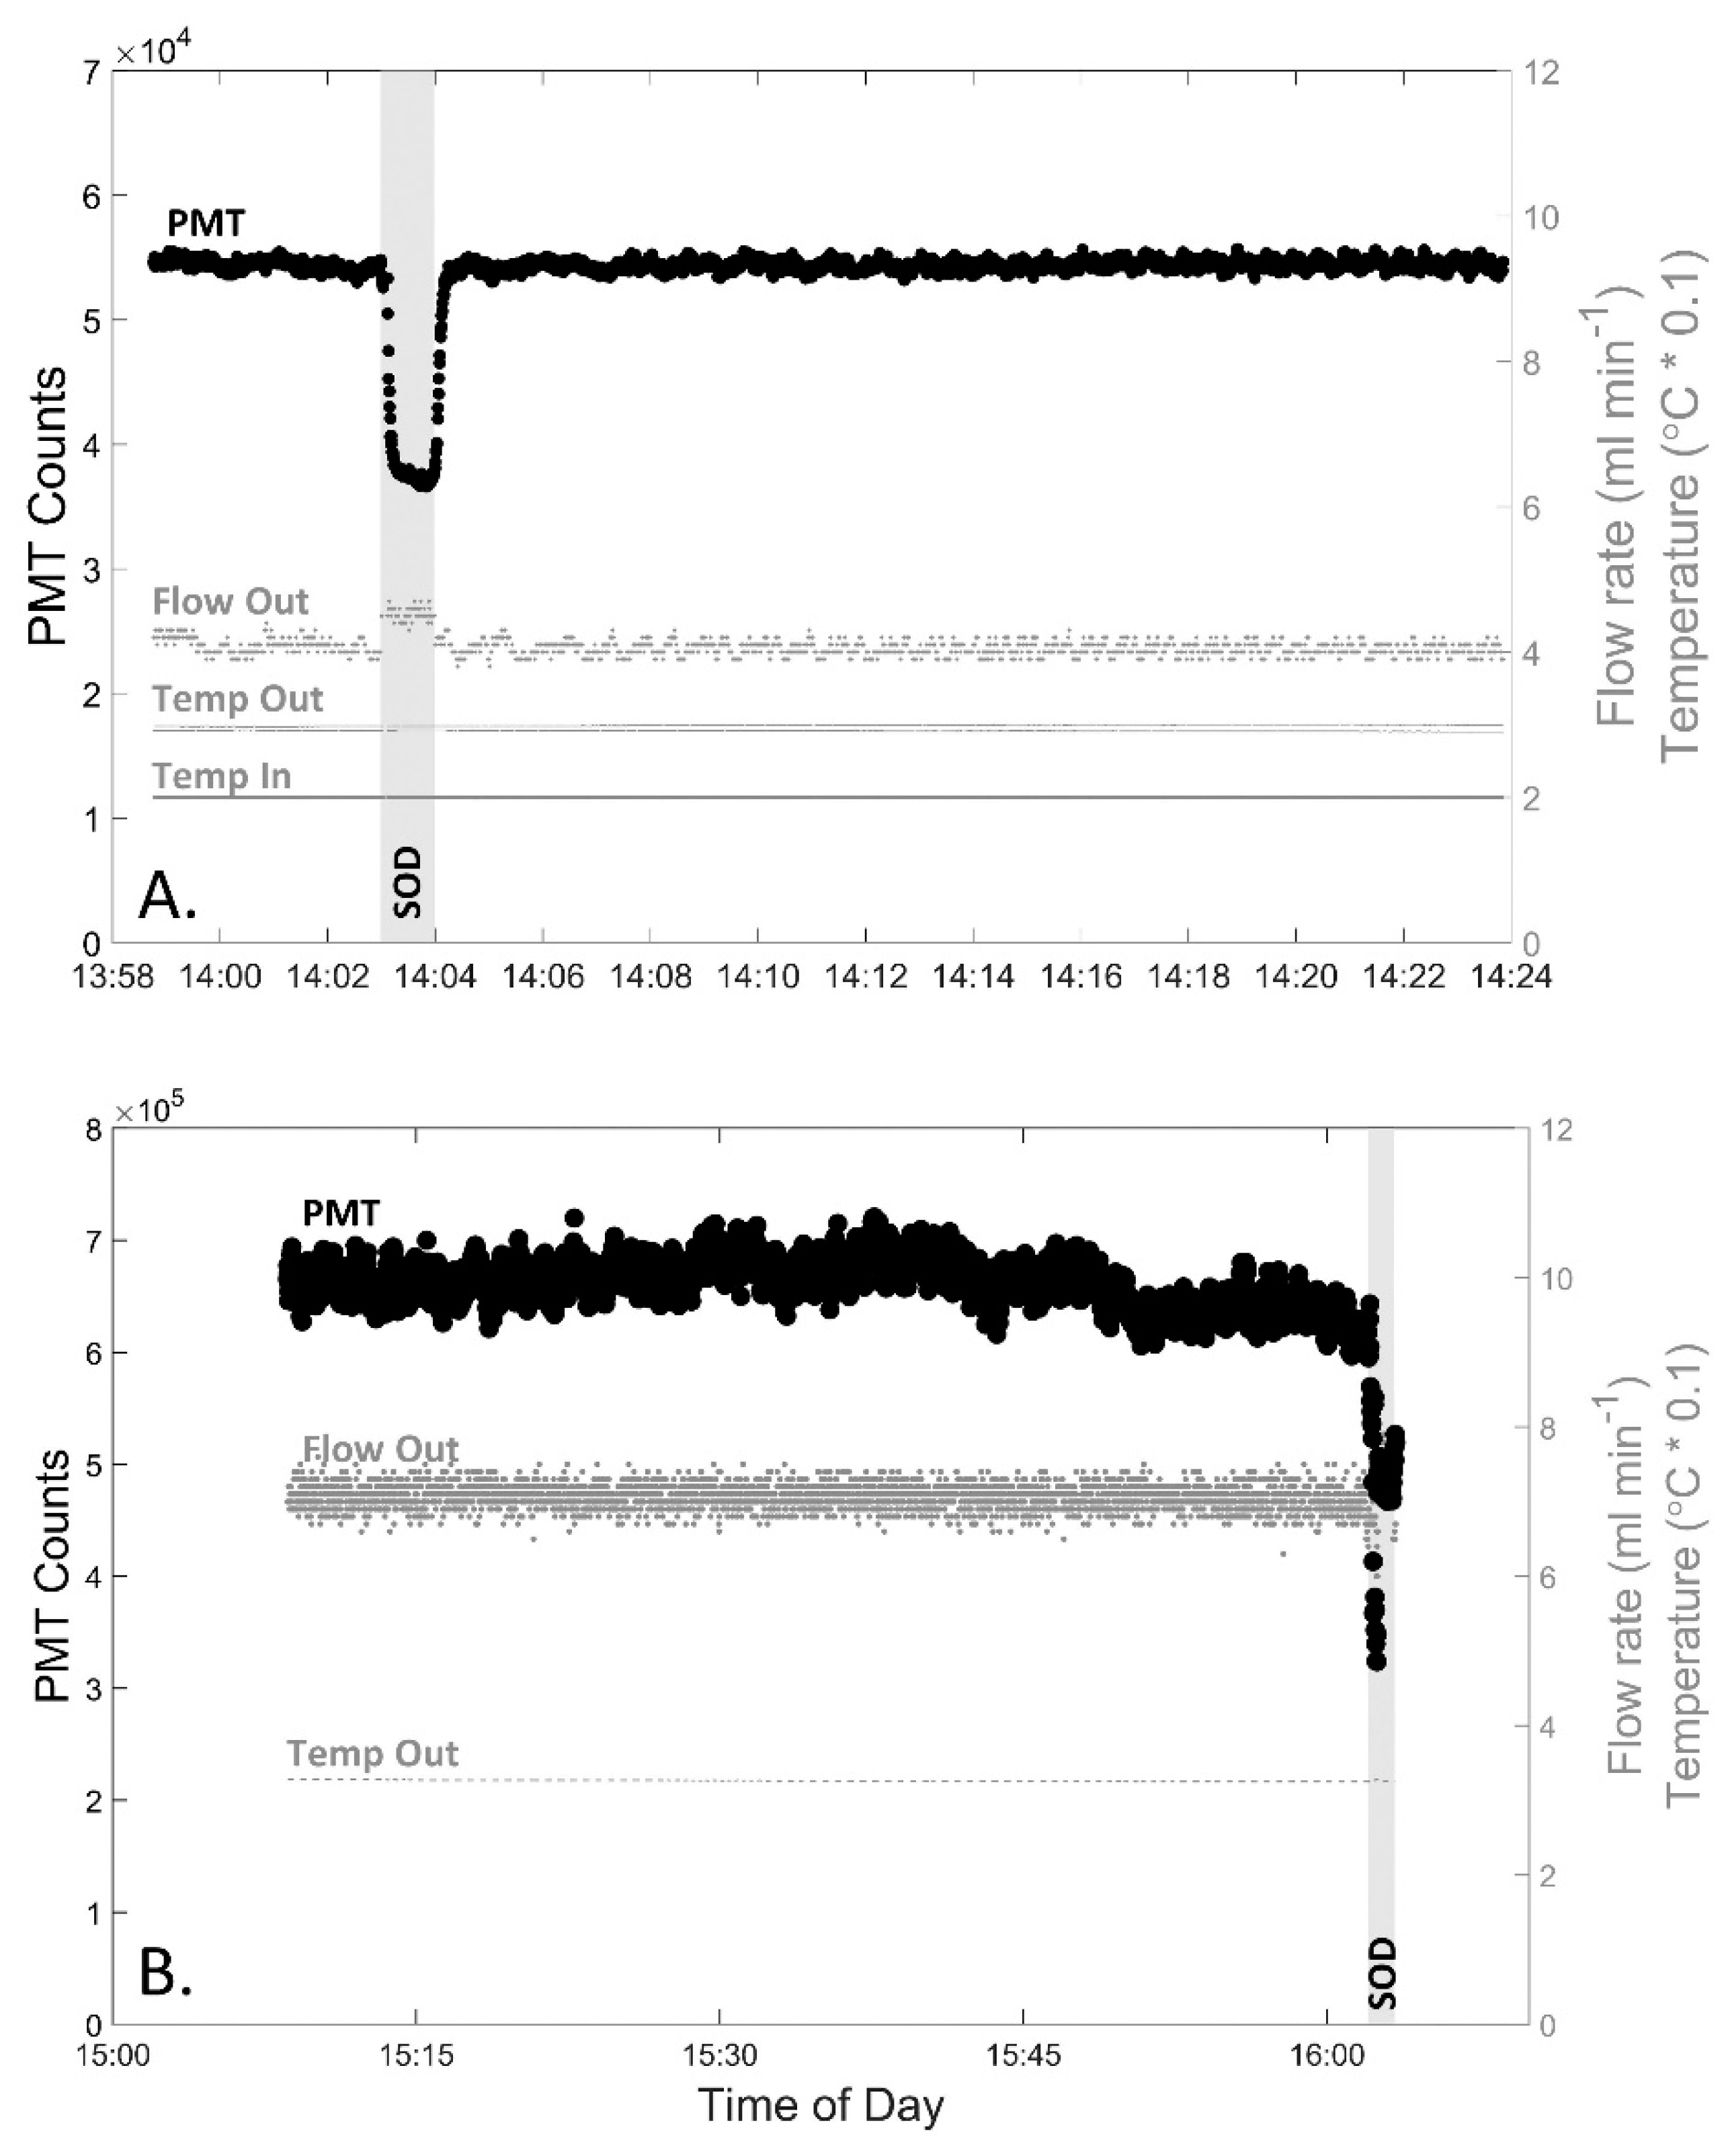
2.3.2. Instrument Stability and Precision

Stability of DISCO II was assessed by measuring aged, filtered seawater (AFSW) in the laboratory for ~30 min at a flow rate of 4 mL min−1 (default voltage ~1000 V, 500 ms integration time). AFSW was prepared by filtering (0.22 µm) seawater amended with 75 µM DTPA and allowing it to sit in the dark overnight (>12 h) to complex and remove metals that might react with superoxide and interfere with measurements. Precision was assessed through percent variance, which was calculated by dividing the standard deviation by the average AFSW counts. This test also allowed for assessment of drift, as well as the influence of temperature and flow rates.

2.3.3. Instrument Optimization

Precision and reproducibility were evaluated by repeating a total of 107 calibrations across 10 testing days, which allowed for enough replicates to provide statistical analysis across time. Calibrations were conducted over a range of voltages (default, 800, 1200) and integration times (IT, 100, 500, and 900 ms). The default voltage (recommended setting) is optimized for each PMT individually at the factory and for this PMT, was determined to be ~1000 volts. The range of PMT settings was chosen because it spanned the settings used in previous studies (DISCO I: V default, IT 900; FeLume: V 1200, IT 100) [43,44]. All tests were conducted using AFSW from Martha’s Vineyard Sound. Daily calibrations were conducted according to previous methods [44] and used to convert superoxide chemiluminescent counts to concentration (pM). Briefly, due to the short half-life of superoxide, primary standard solutions were created immediately prior to each calibration. The primary standard solution was prepared by dissolving potassium dioxide (KO2) into a basic solution (0.3 N NaOH, 50–100 µM DTPA, pH = 12.5). The concentration of the primary standard solution was quantified by measuring the difference in absorbance at 240 nm on the UV-spectrophotometer before and after an addition of SOD (4 U mL−1, final). A secondary stock solution was prepared by adding 2 µL of the primary stock solution to 10 mL AFSW. The concentration of the secondary superoxide standard ranged from 2.4 to 19.1 nM. The chemiluminescent counts of the secondary stock solution were quantified on DISCO II at a flow rate of 7 mL min−1 by first measuring a baseline of AFSW until a steady-state signal was obtained (typically 1–2 min), followed by measurement of the secondary stock solution. During the measurement of the secondary stock solution on DISCO II the primary stock solution was quantified on the UV-spectrophotometer (240 nm). After ~1 min, SOD was added through the analyte-doping fluid line at a flow rate of 1 mL min−1 (2.5 U mL−1 final concentration) to confirm measurement of superoxide.
Using these calibrations, instrument performance specifications were calculated across a range of PMT settings (Table 2). The AFSW baseline (raw counts) was calculated from the steady-state signal obtained prior to superoxide standard addition. The decay of the superoxide standard exhibited a pseudo-first-order decay with a log-linear distribution, from which the decay rate constant (s−1) and half-life (min) were determined [43,51]. Using the modeled fit of the decay kinetics and concentration of the primary standard, a calibration factor (pM count−1) and instrument sensitivity (count pM−1) were derived. The calibration factor can be used to convert chemiluminescent counts to pM. Since AFSW was treated to remove particles and metals, it served as an appropriate medium to calculate the limit of detection (LOD), which was calculated as three-times the standard deviation of the AFSW baseline signal. The percent variance for these measurements was also calculated by dividing the standard deviation by the average AFSW baseline.

2.3.4. Versatility for Application

To verify the use of SOTS-1 within the analyte-doping fluid line and investigate the concentration measurements of superoxide observed with different integration times, we also measured SOTS-1 across time at a default voltage and IT of 100, 500, and 900 ms. SOTS-1 was added to AFSW through the analyte-doping fluid line at a flow rate of 2 mL min−1. With the addition of SOTS-1, the sample flow rate was automatically adjusted from 7 mL min−1 to 5 mL min−1 to compensate for the fluid addition and maintain a constant fluid flow rate through the cell of a total (analyte, analyte doping, and reagent fluids combined) of 14 mL min−1. All values are reported as background seawater (BGSW)-normalized SOTS-1 concentration (pM), which reflects the SOTS-1 signal minus the background AFSW signal, multiplied by the calibration factor that was collected prior to measurements.
To further assess robustness, DISCO II was tested by conducting calibrations with new luer-lock wand sampling tips as well as under a range of spatial orientations.

2.4. Field Verification

DISCO II was tested for in situ functionality at depth and across temperatures, as well as for an extended deployment to determine long-term in situ stability. To test the depth capabilities, DISCO II was used on SCUBA down to 20 m depth in Woods Hole, MA, and pressure tested and rated to 30 m. The function of the pumps has been previously used within the deep sea and, therefore, is suitable for shallow-water methods. DISCO II also measured in situ superoxide at temperatures from 19 to 33 °C during dives in Woods Hole, MA, and in the U.S. Virgin Islands. To evaluate long-term stability, DISCO II was operated continuously for ~60 min close to a shallow reef (depth ~5 m) off the coast of St. John’s, U.S. Virgin Islands.

2.5. Statistical Analysis

Statistical analysis was performed in Excel. Significant trends in data (i.e., if two PMT settings are related) were determined by calculating the coefficient of determination (R2), which was calculated for the linear regression between two variables. Single-factor ANOVA was used to determine if two groups of data (i.e., if PMT settings altered PMT counts) were significantly different from one another. p-values are reported to indicate statistical significance, with a p-value > 0.05 indicating that the two groups are not statistically different.

3. Results and Discussion

In comparison to DISCO I, DISCO II improvements presented here highlight a more sensitive, stable, and adaptable instrument. Here, we report on DISCO II’s performance through laboratory and field verifications. Overall, DISCO II, in comparison to DISCO I, showcases an improved user interface, better sensitivity, greater stability over time, and increased adaptability to diverse sampling conditions.

3.1. Laboratory Testing

3.1.1. Flow Rates

The stability of flow rates was vital for reliably delivering reagent and analyte fluids and achieving high-precision measurements. Flow rates ranging from 1 to 8 mL min−1 were measured over four days (to confirm continued stability) with a precision of ± 0.1 mL min−1. Superoxide measurements were conducted with a flow rate of 7 mL min−1 for both reagent and analyte fluid delivery, allowing samples to be measured within 27 s after entering the sampling wand. The flow rate of the SOD fluid line was 1 mL min−1 and SOTS-1 was added at 2 mL min−1. This range of tested flow rates and the sample delivery time were within the bounds of previously tested flow rates on DISCO I and the benchtop instrument [26,34,41,44]. The half-life of superoxide varies with environmental conditions and has been reported to range between 9.3 and 346.6 s [37,38,39,41,52]. Therefore, even at the fastest decay rates, DISCO II can measure superoxide within three half-lives.

3.1.2. Instrument Stability and Precision

Extended measurements of superoxide demonstrated that the instrument had an increased stability when compared to its predecessor, DISCO I. During the 30-min analysis of AFSW within the laboratory (Figure 3A), the percent variance of DISCO II was 0.7%, which was less than half the variance observed with DISCO I (1.90%) [44]. There was also no significant drift in PMT counts (R2 = 0.10), temperature (R2 = 0.737), or flow rate (R2 = 0.301). In comparison, pumps within DISCO I generated heat within the housing, leading to substantial baseline drift over time that required post-processing correction. The increased stability of DISCO II allowed for increased precision and accuracy over longer deployments and in situ measurements. Although the temperature trend across time was not statistically significant throughout this test, the temperature visually showed a slight change over time (−1.1 °C h−1). This minor temperature variation was not of concern, however, because each sample measurement was typically corrected to the baseline collected immediately prior, thereby accounting for any minor differences in temperature variation over the course of measurement collection.

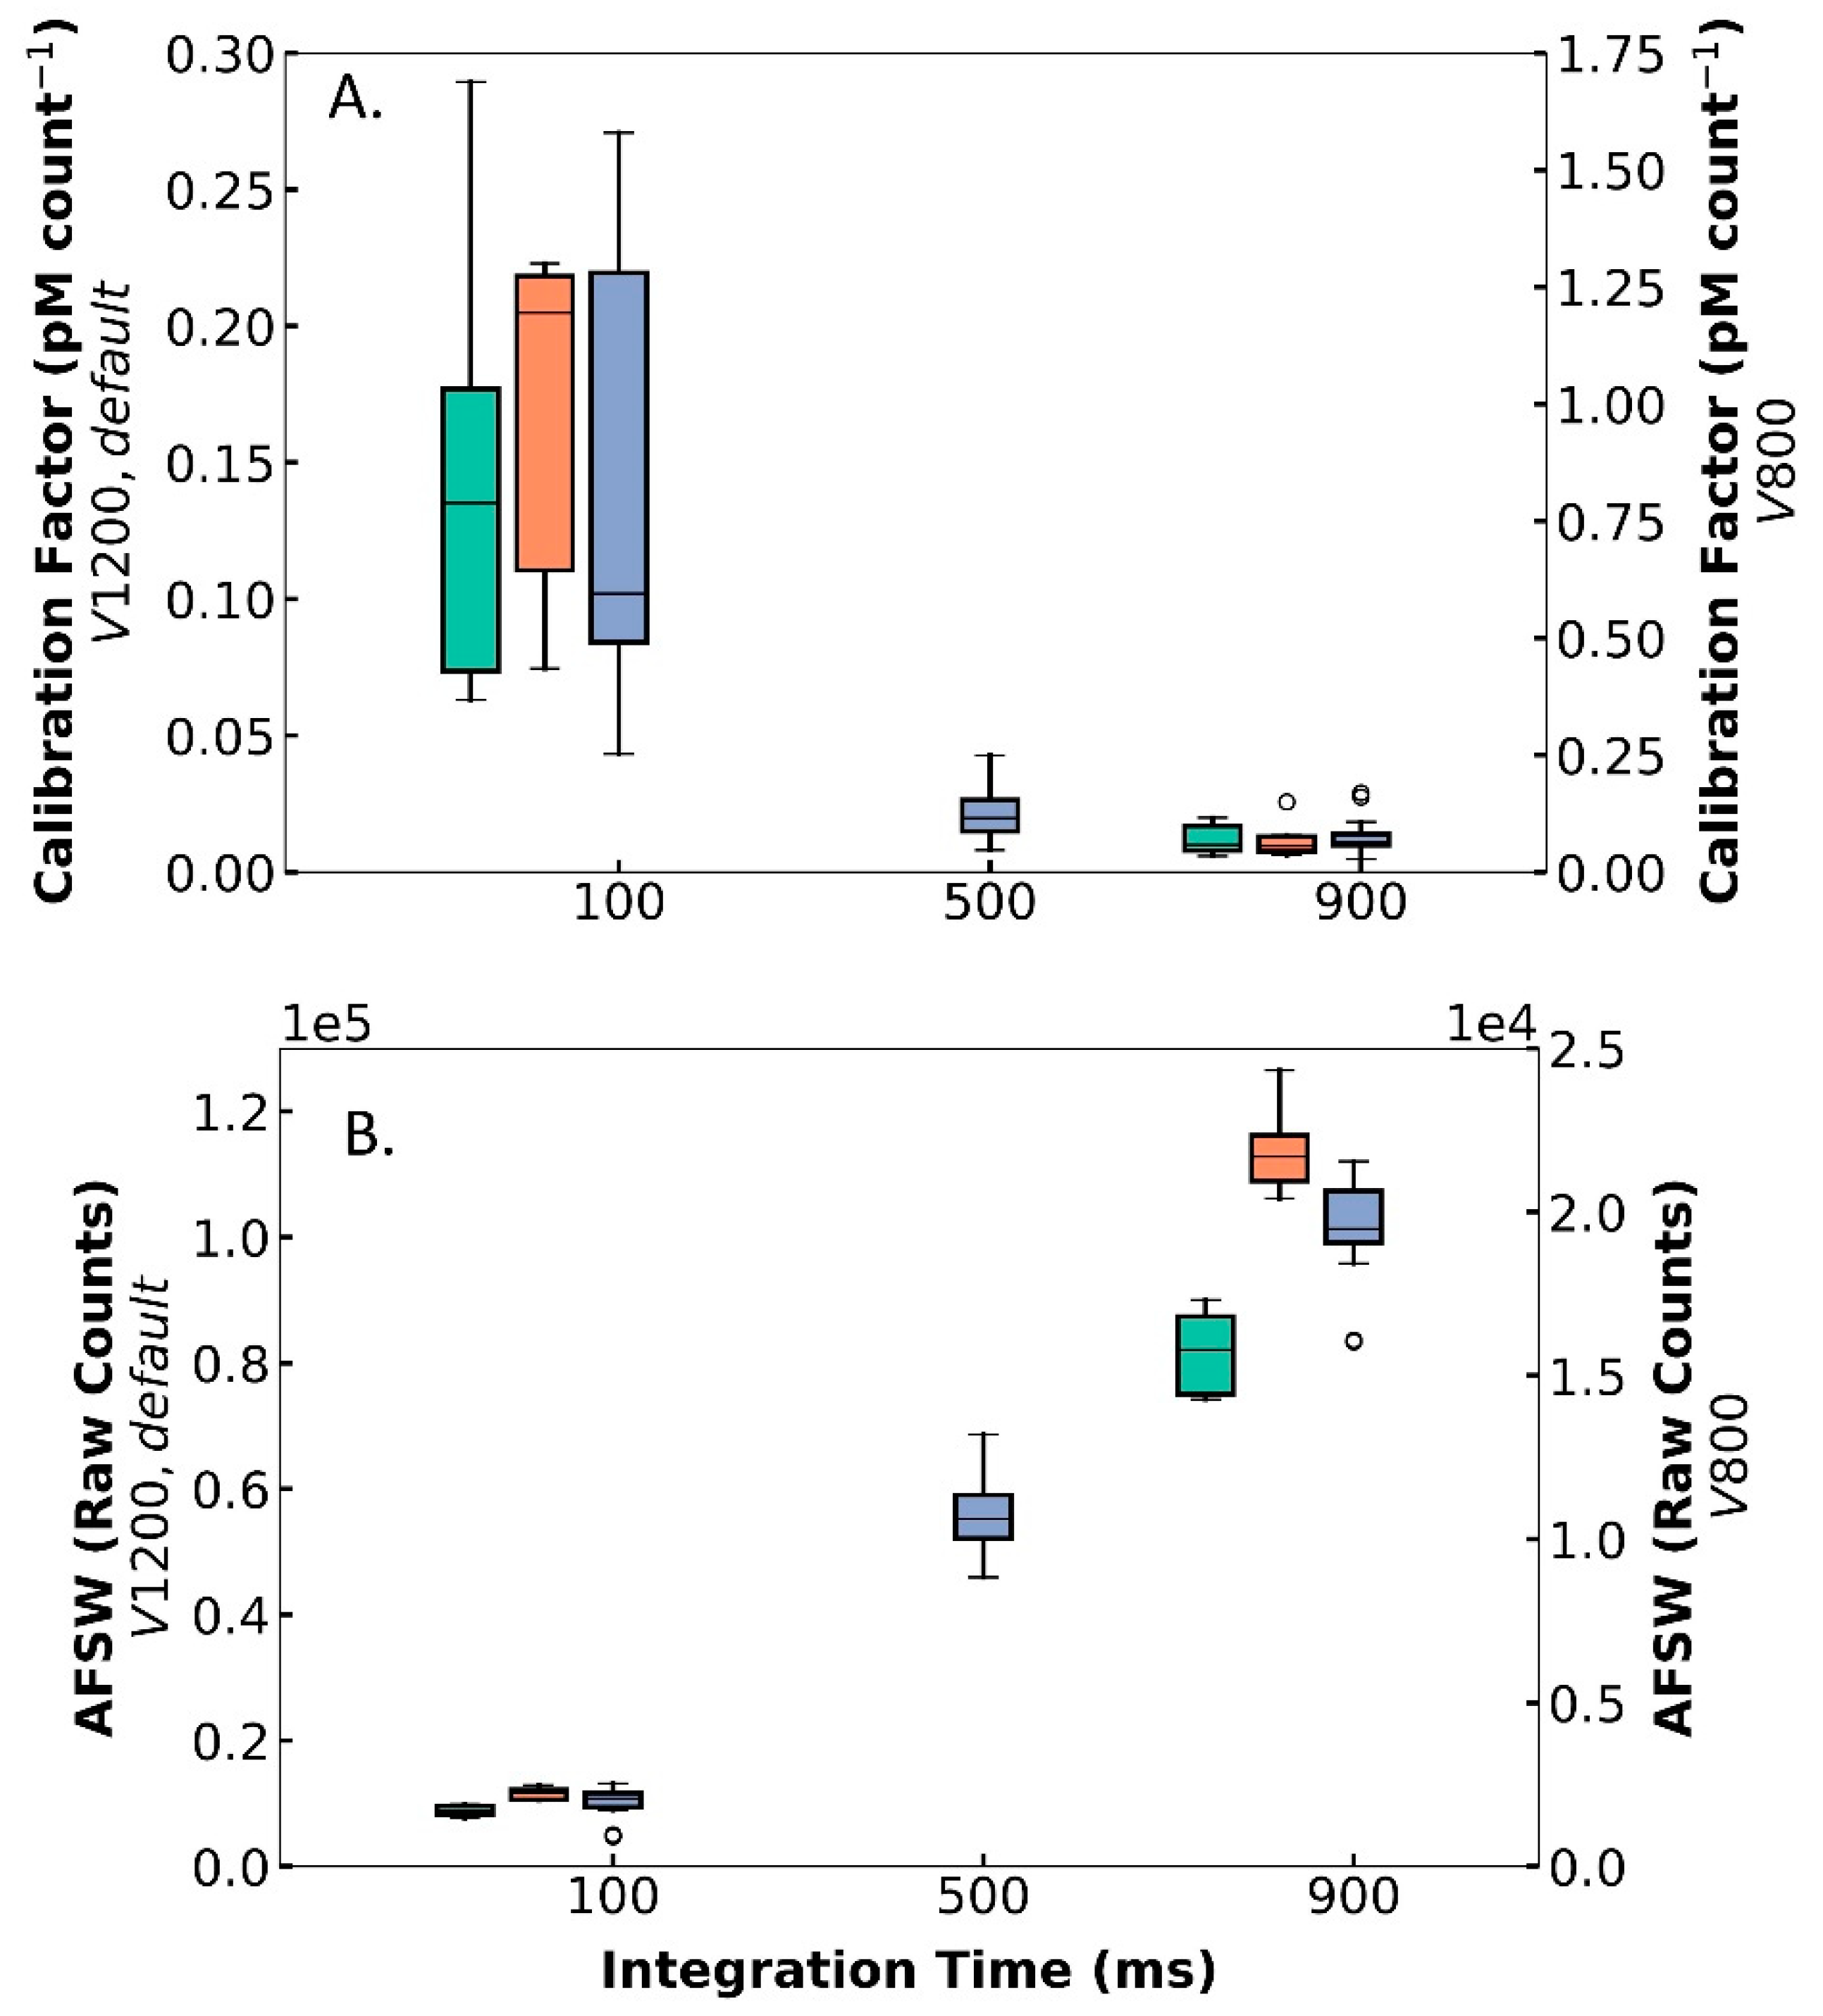
3.1.3. Instrument Optimization

The 107 benchtop calibrations across 10 sample days demonstrated a similar detection limit and precision, with better sensitivity and improved reproducibility compared to the original DISCO I. While the calibrations were collected at a range of PMT configurations (voltage: default, 800, 1200; IT: 100, 500, 900 ms), the measurements that were independent of PMT settings (i.e., half-life, decay rate constant, LOD, and percent variance) were comparable to DISCO I (Table 2). Specifically, the average half-life of superoxide measured by DISCO II was 0.586 ± 0.215 min, which was comparable to that observed by DISCO I (0.28–1.10 min) [44]. Similarly, the decay rate constant (average 0.022 ± 0.008 s−1) and LOD (average 133.1 ± 87.4 pM) measured by DISCO II were within the range of specifications measured by DISCO I (0.01–0.041 s−1 and 111–116 pM, respectively) [44]. While it is noted that the percent variance of superoxide measurements by DISCO II during these calibrations (average 3.3 ± 1.0%) was higher than that observed above during the 30-min stability test (0.7%), this range of precision was still similar to DISCO I, which was 1.9% [44]. This variation in precision may be explained by minor undulations in signals, sometimes observed over short timescales, such as those at which the AFSW baseline is observed (~1–2 min). Although the sensitivity changed with PMT configurations, across all tested DISCO II settings, sensitivity ranged from 1.6 ± 0.8 to 104.9 ± 41.2 counts pM−1, typically orders of magnitude higher than DISCO I’s sensitivity (0.424 ± 0.116 counts pM−1). Across all calibrations, there were few outliers and calibrations were relatively consistent over varying sampling parameters, showcasing DISCO II’s ability to reliably reproduce measurements and perform similar to or generally better than DISCO I.
While the PMT setting adjustments did not affect the precision and reproducibility of DISCO II, variations in the PMT supply voltage and integration time did alter the calibration factor, the sensitivity, and the baseline raw counts (ANOVA p-value < 0.05) (Table 2). Overall, the calibration factor (pM count−1) was inversely related to voltage and IT values, with lower voltage and lower IT yielding higher calibration factors (i.e., V 800, IT 100, calibration factor averaged 0.842 ± 0.463 pM count−1) and vice versa (i.e., V 1200, IT 900, calibration factor averaged 0.012 ± 0.007 pM count−1) (Figure 4A). Since sensitivity is inversely related to the calibration factor, it was expected that lower voltages and IT values would lead to lower sensitivity (i.e., V 800, IT 100, sensitivity 1.6 count pM−1) and vice versa (i.e., V 1200, IT 900, sensitivity averaged 104.9 count pM−1). Comparatively, the AFSW baseline signal was positively correlated with voltage and IT, with higher voltage and IT values exhibiting elevated AFSW counts (i.e., V 1200, IT 900, AFSW raw counts averaged 113,900 ± 6690 counts) and vice versa (i.e., V 800, IT 100, AFSW raw counts averaged 1695 ± 163 counts) (Figure 4B). For example, these data indicate that in environments with lower superoxide, DISCO II can be adjusted in real time to a higher voltage and IT to detect smaller changes in signals. Overall, the PMT settings within DISCO II can be optimized for specific situations without sacrificing the functionality, precision, and reproducibility of DISCO II.

3.1.4. Instrument Versatility of Application

Although the baseline raw counts change with PMT settings, the concentration measurements are not statistically different between integration times of 100 ms and 500 ms, demonstrating DISCO II’s ability to be used reliably across these different PMT settings (Figure 5). When measuring SOTS-1, the BGSW-normalized raw counts scaled proportionally with the integration time; an IT of 900 ms measured counts (average 476,700 ± 52,780 counts), nearly an order of magnitude higher than counts observed with an IT of 100ms (average 48,400 ± 6681), and those with an IT of 500 ms split the difference (246,400 ± 37,000). When applying IT-specific calibration factors (using KO2, as described above) that were determined directly prior to SOTS-1 measurements, the corrected concentration of SOTS-1 was similar across all tested integration times; average BGSW-normalized SOTS-1 concentration was 3723 ± 257 pM, 3489 ± 343 pM, and 3973 ± 315 pM, for IT 100, 500, and 900 ms, respectively. For IT values of 100 ms, no statistical differences were observed between measurements at IT values of 500 ms (ANOVA p-value = 0.085) or 900 ms (ANOVA p-value = 0.054). However, there was a statistical difference between IT 500 ms and 900 ms (ANOVA p-value = 0.002). Therefore, integration times of 100 ms and 500 ms can reliably be used interchangeably with comparable data as long as the calibration factors are completed using the same PMT settings. However, these tests indicate that longer integration times, such as 900 ms, might require further investigation to determine accuracy compared to lower integration times. Additionally, the use of SOTS-1 as a reliable superoxide concentration showcases SOTS-1 as a standard solution that can be used for in situ calibrations and decay rate measurements. Overall, these tests indicate that DISCO II can collect measurements at a range of PMT settings, allowing DISCO II to be versatile and adaptable to diverse coastal environments.
In addition to the internal settings, the adaptable luer-lock wand tip and flexible orientation make DISCO II versatile to collect measurements in a wide range of environments. The luer-lock wand tip addition did not impact superoxide AFSW raw counts (ANOVA p-value = 0.265) or calibration factors (ANOVA p-value = 0.772), therefore, allowing the wand tip to be interchanged without affecting measurements. Additionally, there were no significant differences in DISCO II superoxide measurements as a function of orientation (ANOVA p-value = 0.164 for AFSW raw counts, 0.073 for calibration factors), making it easy to use DISCO II in a variety of circumstances that might require different orientations (i.e., placing it upright on a lab bench vs. holding it at various angles between upright and horizonal while sampling within the environment).

3.2. Field Verification

DISCO II proved to function normally at depths up to 20 m and within the tested temperatures of 19 to 33 °C. Depths and temperatures outside of these ranges were not tested, yet we expect DISCO II would operate similarly within its 30-m depth rating and in colder environments.

In Situ Stability Test

DISCO II was deployed for nearly 60 min in a near-reef environment to test the signal stability in seawater (Figure 3B). Overall, the BGSW was, on average, 663,000 ± 19,900 counts, equating to a percent variance of 3.0%. Throughout this time, there was no significant drift in PMT signal (R2 = 0.161). During these measurements, two distinct segments were noted that showed a decrease in counts towards the end. While it cannot be confirmed, it is likely that there were natural variations in superoxide within the ecosystem due to changes in photochemical production of superoxide as the sun lowered behind trees, creating a shadow during the ~60 min. Prior to these changes in signal, during the first ~30 min, the average BGSW was 670,900 ± 16,000 counts with a percent variance of 2.4% and there was still no significant drift in the PMT signal (R2 = 0.194). While these measurements take into account all real environmental changes, DISCO II exhibits about a third less variance than that of DISCO I in a similar near-reef environment (7.6%) [44]. During these measurements, the effluent from DISCO II recorded an average temperature of 32.6 ± 0.1 °C and a flow rate of 7.1 ± 0.2 mL min−1, confirming that the flow rate did not change significantly over time (R2 = 0.002). The temperature did show a slight decrease over time (32.8 to 32.5 °C over 60 min) (R2 = 0.819). While this temperature change is within the ~1 °C variation observed within laboratory testing, it may also be influenced by in situ temperature changes as well, since this test was completed between 1500 and 1600 local time.

3.3. Future Applications

DISCO II could easily be adapted to make measurements on various platforms, using different fluid-intake approaches, and over more extended periods of time. In addition, pump operations could be pre-programmed to allow for deployment and autonomous operation of DISCO II within a system. For instance, such an operation modality would allow DISCO II to measure superoxide concentrations over the course of a diel cycle, providing insight on the role of light-dependent and light-independent superoxide production processes. The main limiting factor here would likely be reagent reactivity, which declines over a timeframe of several days; yet, this could be tested and characterized to adjust data accordingly. We also plan to use DISCO II as a foundation for developing a microfluidic-based chemiluminescent sensor to further decrease size and move towards deployable devices.
Similar to DISCO I, DISCO II could also be adapted to measure other chemical species that have high-sensitivity chemiluminescent probes [44,53]. For example, DISCO II can be easily adapted to measure hydrogen peroxide by using the chemiluminescence of acrodinium esters (AE-CL method) [45]. The ability to measure both superoxide and hydrogen peroxide would allow for even more robust in situ characterization of ROS cycling. DISCO II could also be adapted for chemicals beyond ROS that can be measured via chemiluminescent probes, including species that are difficult to measure in situ, such as those with short half-lives (e.g., nitric oxide (NO), adenosine triphosphate (ATP), or that are redox sensitive (e.g., aqueous ferrous (Fe2+) and ferric (Fe3+) iron, and hydrogen sulfide (H2S)). The demonstrated versatility of DISCO II opens doors to understanding the distribution and quantification of elusive reactive chemicals.

4. Conclusions

This study highlights the improved operation, versatility, and adaptability of our previously designed handheld submersible chemiluminescent sensor (DISCO) [44]. Here, DISCO II was further adapted to enable the adjustment of PMT settings in real time, making measurements within diverse environmental settings possible. Improvements also allowed for in situ calibrations and decay rates. DISCO II reliably measured superoxide over several hours without drift or mechanical issues. The compact size and user-friendly operational interface make DISCO II accessible for all users across different types of coastal ecosystems. This ability to measure superoxide in situ across a wide variety of environments allows DISCO II to be integrated into a wide variety of field applications. These features are crucial for obtaining precise and real-time measurements of superoxide near production sources. Superoxide measurements of this type are necessary on a larger scale to truly understand the superoxide dynamics across marine environments and to characterize the role that superoxide plays in marine organismal health.

Author Contributions

Conceptualization, J.K., S.D.W. and C.M.H.; Data curation, K.C.G.; Formal analysis, K.C.G., W.A.P., J.K., E.B.H. and C.M.H.; Funding acquisition, C.M.H.; Investigation, K.C.G., W.A.P., J.K., S.D.W., E.B.H. and C.M.H.; Methodology, K.C.G., W.A.P., J.K., S.D.W., E.B.H. and C.M.H.; Project administration, J.K., S.D.W. and C.M.H.; Resources, W.A.P., S.D.W. and C.M.H.; Software, W.A.P. and E.B.H.; Supervision, J.K., S.D.W. and C.M.H.; Validation, K.C.G., W.A.P., J.K. and E.B.H.; Visualization, K.C.G.; Writing—original draft, K.C.G.; Writing—review and editing, K.C.G., W.A.P., J.K., S.D.W., E.B.H. and C.M.H. All authors have read and agreed to the published version of the manuscript.

Funding

The development and verification of DISCO was funded by Schmidt Marine Technology Partners (G-2010-59878 to C.M.H., S.D.W. and J.K.). This research was further supported, in part, by grants from NSF GRFP (2016230168 to K.C.G.), WHOI Ocean Ventures Fund (2020 and 2021 to K.C.G.), and the MIT Wellington and Irene Loh Fund Fellowship (4000111995 to K.C.G.).

Institutional Review Board Statement

Not applicable.

Informed Consent Statement

Not applicable.

Data Availability Statement

Data is available within this paper.

Acknowledgments

The authors would like to thank Edward Obrien and Kim Malkoski from WHOI Dive Office for endless SCUBA diving support for testing and verification of DISCO. We would also like to thank the Apprill Lab and Mooney Lab members for assistance with field verification.

Conflicts of Interest

The authors declare no conflict of interest.

References

  1. Lesser, M.P. Elevated temperatures and ultraviolet radiation cause oxidative stress and inhibit photosynthesis in ymbiotic dinoflagellates. Limnol. Oceanogr. 1996, 41, 271–283. [Google Scholar] [CrossRef]
  2. Tchernov, D.; Gorbunov, M.Y.; de Vargas, C.; Yadav, S.N.; Milligan, A.J.; Häggblom, M.; Falkowski, P.G. Membrane lipids of symbiotic algae are diagnostic of sensitivity to thermal bleaching in corals. Proc. Natl. Acad. Sci. USA 2004, 101, 13531–13535. [Google Scholar] [CrossRef] [PubMed]
  3. Banin, E.; Vassilakos, D.; Orr, E.; Martinez, R.J.; Rosenberg, E. Superoxide Dismutase Is a Virulence Factor Produced by the Coral Bleaching Pathogen Vibrio shiloi. Curr. Microbiol. 2003, 46, 418–422. [Google Scholar] [CrossRef] [PubMed]
  4. Babior, B.M. NADPH oxidase: An update. Blood 1999, 93, 1464–1476. [Google Scholar] [CrossRef]
  5. Oda, T.; Akaike, T.; Sato, K.; Ishimatsu, A.; Takeshita, S.; Muramatsu, T.; Maeda, H. Hydroxyl radical generation by red tide algae. Arch. Biochem. Biophy. 1992, 294, 38–43. [Google Scholar] [CrossRef]
  6. Beutler, B. Innate immunity: An overview. Mol. Immunol. 2004, 40, 845–859. [Google Scholar] [CrossRef]
  7. Hansel, C.M.; Diaz, J.M.; Plummer, S. Tight Regulation of Extracellular Superoxide Points to Its Vital Role in the Physiology of the Globally Relevant Roseobacter Clade. mBio 2019, 10, e02668-18. [Google Scholar] [CrossRef]
  8. Hansel, C.M.; Diaz, J.M. Production of Extracellular Reactive Oxygen Species by Marine Biota. Annu. Rev. Mar. Sci. 2021, 13, 177–200. [Google Scholar] [CrossRef]
  9. Weis, V.M. Cellular mechanisms of Cnidarian bleaching: Stress causes the collapse of symbiosis. J. Exp. Biol. 2008, 211, 3059–3066. [Google Scholar] [CrossRef]
  10. Lesser, M.P. Coral Bleaching: Causes and Mechanisms. In Coral Reefs Ecosystem Transit; Dubinsky, Z., Stambler, N., Eds.; Springer: Dordrecht, The Netherlands, 2011; pp. 405–419. [Google Scholar] [CrossRef]
  11. Nielsen, D.A.; Petrou, K.; Gates, R.D. Coral bleaching from a single cell perspective. ISME J. 2018, 12, 1558–1567. [Google Scholar] [CrossRef]
  12. Portune, K.J.; Voolstra, C.R.; Medina, M.; Szmant, A.M. Development and heat stress-induced transcriptomic changes during embryogenesis of the scleractinian coral Acropora palmata. Mar. Genomics 2010, 3, 51–62. [Google Scholar] [CrossRef] [PubMed]
  13. Rodrigues, J.V.; Gomes, C.M. Enhanced superoxide and hydrogen peroxide detection in biological assays. Free Radic. Biol. Med. 2010, 49, 61–66. [Google Scholar] [CrossRef] [PubMed]
  14. Seneca, F.O.; Palumbi, S.R. The role of transcriptome resilience in resistance of corals to bleaching. Mol. Ecol. 2015, 24, 1467–1484. [Google Scholar] [CrossRef]
  15. Cleves, P.A.; Krediet, C.J.; Lehnert, E.M.; Onishi, M.; Pringle, J.R. Insights into coral bleaching under heat stress from analysis of gene expression in a sea anemone model system. Proc. Natl. Acad. Sci. USA 2020, 117, 28906–28917. [Google Scholar] [CrossRef] [PubMed]
  16. Bouarab, K.; Potin, P.; Correa, J.; Kloareg, B. Sulfated Oligosaccharides Mediate the Interaction between a Marine Red Alga and Its Green Algal Pathogenic Endophyte. Plant Cell 1999, 11, 1635–1650. [Google Scholar] [CrossRef]
  17. Coelho, S.M.; Taylor, A.R.; Ryan, K.P.; Sousa-Pinto, I.; Brown, M.T.; Brownlee, C. Spatiotemporal Patterning of Reactive Oxygen Production and Ca2+ Wave Propagation in Fucus Rhizoid Cells. Plant Cell 2002, 14, 2369–2381. [Google Scholar] [CrossRef]
  18. Kupper, F.C.K.; Ller, D.G.M.; Peters, A.F.; Kloareg, B.; Potin, P. Oligoalginate Recognition and Oxidative Burst Play A Key Role In Natural And Induced Resistance Of Sporophytes Of Laminariales. J. Chem. Ecol. 2002, 28, 1. [Google Scholar] [CrossRef]
  19. Coelho, S.M.B.; Brownlee, C.; Bothwell, J.H.F. A tip-high, Ca2+-interdependent, reactive oxygen species gradient is associated with polarized growth in Fucus serratus zygotes. Planta 2008, 227, 1037–1046. [Google Scholar] [CrossRef]
  20. Rose, A.L.; Webb, E.A.; Waite, T.D.; Moffett, J.W. Measurement and Implications of Nonphotochemically Generated Superoxide in the Equatorial Pacific Ocean. Environ. Sci. Technol. 2008, 42, 2387–2393. [Google Scholar] [CrossRef]
  21. Learman, D.R.; Voelker, B.M.; Vazquez-Rodriguez, A.I.; Hansel, C.M. Formation of manganese oxides by bacterially generated superoxide. Nat. Geosci. 2011, 4, 95–98. [Google Scholar] [CrossRef]
  22. Diaz, J.M.; Hansel, C.M.; Voelker, B.M.; Mendes, C.M.; Andeer, P.F.; Zhang, T. Widespread Production of Extracellular Superoxide by Heterotrophic Bacteria. Science 2013, 340, 1223–1226. [Google Scholar] [CrossRef] [PubMed]
  23. McDowell, R.E.; Amsler, C.D.; McClintock, J.B.; Baker, B.J. Reactive oxygen species as a marine grazing defense: H2O2 and wounded Ascoseira mirabilis both inhibit feeding by an amphipod grazer. J. Exp. Mar. Biol. Ecol. 2014, 458, 34–38. [Google Scholar] [CrossRef]
  24. Luo, Q.; Zhu, Z.; Zhu, Z.; Yang, R.; Qian, F.; Chen, H.; Yan, X. Different Responses to Heat Shock Stress Revealed Heteromorphic Adaptation Strategy of Pyropia haitanensis (Bangiales, Rhodophyta). PLoS ONE 2014, 9, e94354. [Google Scholar] [CrossRef] [PubMed]
  25. Roe, K.L.; Barbeau, K.A. Uptake mechanisms for inorganic iron and ferric citrate in Trichodesmium erythraeum IMS101. Metallomics 2014, 6, 2042–2051. [Google Scholar] [CrossRef]
  26. Zhang, T.; Diaz, J.M.; Brighi, C.; Parsons, R.; McNally, S.; Apprill, A.; Hansel, C.M. Dark Production of Extracellular Superoxide by the Coral Porites astreoides and Representative Symbionts. Front Mar. Sci. 2016, 3, 1–16. [Google Scholar] [CrossRef]
  27. Diaz, J.M.; Plummer, S. Production of extracellular reactive oxygen species by phytoplankton: Past and future directions. J. Plankton Res. 2018, 40, 655–666. [Google Scholar] [CrossRef] [PubMed]
  28. Diaz, J.M.; Plummer, S.; Hansel, C.M.; Andeer, P.F.; Saito, M.A.; McIlvin, M.R. NADPH-dependent extracellular superoxide production is vital to photophysiology in the marine diatom Thalassiosira oceanica. Proc. Natl. Acad. Sci. USA 2019, 116, 16448–16453. [Google Scholar] [CrossRef]
  29. Shikata, T.; Takahashi, F.; Nishide, H.; Shigenobu, S.; Kamei, Y.; Sakamoto, S.; Yuasa, K.; Nishiyama, Y.; Yamasaki, Y.; Uchiyama, I. RNA-Seq Analysis Reveals Genes Related to Photoreception, Nutrient Uptake, and Toxicity in a Noxious Red-Tide Raphidophyte Chattonella antiqua. Front. Microbiol. 2019, 10, 1764. [Google Scholar] [CrossRef] [PubMed]
  30. Sutherland, K.M.; Coe, A.; Gast, R.J.; Plummer, S.; Suffridge, C.P.; Diaz, J.M.; Bowman, J.S.; Wankel, S.D.; Hansel, C.M. Extracellular superoxide production by key microbes in the global ocean. Limnol. Oceanogr. 2019, 64, 2679–2693. [Google Scholar] [CrossRef] [Green Version]
  31. Bond, R.J.; Hansel, C.M.; Voelker, B.M. Heterotrophic Bacteria Exhibit a Wide Range of Rates of Extracellular Production and Decay of Hydrogen Peroxide. Front. Mar. Sci. 2020, 7, 72. [Google Scholar] [CrossRef]
  32. Marshall, J.-A. Photosynthesis does influence superoxide production in the ichthyotoxic alga Chattonella marina (Raphidophyceae). J. Plankton Res. 2002, 24, 1231–1236. [Google Scholar] [CrossRef]
  33. Marshall, J.-A.; Ross, T.; Pyecroft, S.; Hallegraeff, G. Superoxide production by marine microalgae: I.I. Towards understanding ecological consequences and possible functions. Mar. Biol. 2005, 147, 541–549. [Google Scholar] [CrossRef]
  34. Rose, A.L.; Moffett, J.W.; Waite, T.D. Determination of Superoxide in Seawater Using 2-Methyl-6-(4-methoxyphenyl)-3,7- dihydroimidazo[1,2-a]pyrazin-3(7 H )-one Chemiluminescence. Anal. Chem. 2008, 80, 1215–1227. [Google Scholar] [CrossRef] [PubMed]
  35. Hansel, C.M.; Buchwald, C.; Diaz, J.M.; Ossolinski, J.E.; Dyhrman, S.T.; Van Mooy, B.A.S.; Polyviou, D. Dynamics of extracellular superoxide production by Trichodesmium colonies from the Sargasso Sea: Controls on ROS production by Trichodesmium. Limnol. Oceanogr. 2016, 61, 1188–1200. [Google Scholar] [CrossRef]
  36. Schneider, R.J.; Roe, K.L.; Hansel, C.M.; Voelker, B.M. Species-Level Variability in Extracellular Production Rates of Reactive Oxygen Species by Diatoms. Front. Chem. 2016, 4, 5. [Google Scholar] [CrossRef]
  37. Roe, K.L.; Schneider, R.J.; Hansel, C.M.; Voelker, B.M. Measurement of dark, particle-generated superoxide and hydrogen peroxide production and decay in the subtropical and temperate North Pacific Ocean. Deep Sea Res. Part Oceanogr. Res. Pap. 2016, 107, 59–69. [Google Scholar] [CrossRef]
  38. Heller, M.I.; Croot, P.L. Superoxide Decay Kinetics in the Southern Ocean. Environ. Sci. Technol. 2010, 44, 191–196. [Google Scholar] [CrossRef]
  39. Hansard, P.; Vermilyea, A.W.; Voelker, B.M. Measurements of superoxide radical concentration and decay kinetics in the Gulf of Alaska. Deep Sea Res. Part Oceanogr. Res. Pap. 2010, 57, 1111–1119. [Google Scholar] [CrossRef]
  40. Korshunov, S.S.; Imlay, J.A. A potential role for periplasmic superoxide dismutase in blocking the penetration of external superoxide into the cytosol of Gram-negative bacteria. Mol. Microbiol 2002, 43, 95–106. [Google Scholar] [CrossRef]
  41. Diaz, J.M.; Hansel, C.M.; Apprill, A.; Brighi, C.; Zhang, T.; Weber, L.; McNally, S.; Xun, L. Species-specific control of external superoxide levels by the coral holobiont during a natural bleaching event. Nat. Commun. 2016, 7, 13801. [Google Scholar] [CrossRef]
  42. Saragosti, E.; Tchernov, D.; Katsir, A.; Shaked, Y. Extracellular Production and Degradation of Superoxide in the Coral Stylophora pistillata and Cultured Symbiodinium. PLoS ONE 2010, 5, e12508. [Google Scholar] [CrossRef] [PubMed]
  43. Sutherland, K.M.; Grabb, K.C.; Karolewski, J.S.; Plummer, S.; Farfan, G.A.; Wankel, S.D.; Diaz, J.M.; Lamborg, C.H.; Hansel, C.M. Spatial Heterogeneity in Particle-Associated, Light-Independent Superoxide Production Within Productive Coastal Waters. J. Geophys. Res. Oceans 2020, 125, e2020JC016747. [Google Scholar] [CrossRef] [PubMed]
  44. Grabb, K.C.; Kapit, J.; Wankel, S.D.; Manganini, K.; Apprill, A.; Armenteros, M.; Hansel, C.M. Development of a Handheld Submersible Chemiluminescent Sensor: Quantification of Superoxide at Coral Surfaces. Environ. Sci. Technol. 2019, 53, 13850–13858. [Google Scholar] [CrossRef]
  45. King, D.W.; Cooper, W.J.; Rusak, S.A.; Peake, B.M.; Kiddle, J.J.; O’Sullivan, D.W.; Melamed, M.L.; Morgan, C.R.; Theberge, S.M. Flow Injection Analysis of H2O2 in Natural Waters Using Acridinium Ester Chemiluminescence: Method Development and Optimization Using a Kinetic Model. Anal. Chem. 2007, 79, 4169–4176. [Google Scholar] [CrossRef]
  46. Muller, E.M.; Sartor, C.; Alcaraz, N.I.; van Woesik, R. Spatial Epidemiology of the Stony-Coral-Tissue-Loss Disease in Florida. Front. Mar. Sci. 2020, 7. [Google Scholar] [CrossRef]
  47. Okajima, T.; Tokuda, K.; Ohsaka, T. Chemiluminescence of a Cypridina luciferin analogue by electrogenerated superoxide ion. Bioelectrochem. Bioenerg. 1996, 41, 205–208. [Google Scholar] [CrossRef]
  48. Bartosz, G. Reactive oxygen species: Destroyers or messengers? Biochem. Pharmacol. 2009, 77, 1303–1315. [Google Scholar] [CrossRef]
  49. Ingold, K.U.; Paul, T.; Young, M.J.; Doiron, L. Invention of the First Azo Compound to Serve as a Superoxide Thermal Source under Physiological Conditions: Concept, Synthesis, and Chemical Properties 1. J. Am. Chem. Soc. 1997, 119, 12364–12365. [Google Scholar] [CrossRef]
  50. Heller, M.I.; Croot, P.L. Application of a superoxide (O2−) thermal source (SOTS-1) for the determination and calibration of O2− fluxes in seawater. Anal. Chim. Acta 2010, 667, 1–13. [Google Scholar] [CrossRef] [Green Version]
  51. Shaked, Y.; Armoza-Zvuloni, R. Dynamics of hydrogen peroxide in a coral reef: Sources and sinks: H2O2 dynamics in a coral reef. J. Geophys. Res. Biogeosciences 2013, 118, 1793–1801. [Google Scholar] [CrossRef]
  52. Rose, A.L.; Godrant, A.; Godrant, A.; Furnas, M.; Waite, T.D. Dynamics of nonphotochemical superoxide production in the Great Barrier Reef lagoon. Limnol. Oceanogr. 2010, 55, 1521–1536. [Google Scholar] [CrossRef]
  53. Fletcher, P.; Andrew, K.N.; Calokerinos, A.C.; Forbes, S.; Worsfold, P.J. Analytical applications of flow injection with chemiluminescence detection?a review. Luminescence 2001, 16, 1–23. [Google Scholar] [CrossRef] [PubMed]
Figure 1. Diagram of DISCO II showing the (A) front and (B) back of the instrument alongside photos of the (C) front and (D) back. Numbers correspond with Table 1 and point to essential components in DISCO II.
Sensors 22 06683 g001
Figure 2. Block diagram of DISCO II showing the layout of DISCO and highlighting the function of the key features. The different operating systems are color coded, showing distinction between the fluidics system (blue), electronics system (green), the oil-compensated section (orange), and the tablet and PMT (gray). The other two compartments (pressure-bearing and flooded) are labeled accordingly. The blue arrows associated with the fluidics system indicate the direction of flow.
Sensors 22 06683 g002
Figure 3. Raw DISCO II data during extended measurements to test for stability and drift within the instrument both in the (A) laboratory (~30 min) and (B) in situ near a shallow reef (~60 min), PMT settings are default voltage, IT 500ms. Graphs display the PMT counts (left y-axis, black large circles), effluent flow rate (ml min−1, right y-axis, grey small circles labeled “Flow Out”), effluent temperature (°C * 0.1, right y-axis, grey small dashes labeled “Temp Out”), and for graph A only, analyte temperature (°C * 0.1, right y-axis, grey small dashes for line on bottom labeled “Temp In”) throughout the time of day (x-axis). The time when the SOD pump is turned on is labeled and highlighted in a gray vertical bar.
Sensors 22 06683 g003
Figure 4. Results from multiple laboratory tests with DISCO, showing the (A) calibration factor (y-axis, pM count−1) and (B) AFSW raw counts (y-axis) across integration time (x-axis, ms) for different voltages (V): 800 (right y-axis, green), 1200 (left y-axis, orange), and default (left y-axis, blue). The box and whisker plot indicates the middle 50 percentile (box), the median (horizontal line), the middle 90 percentile (vertical lines), and the outliers (“o”).
Sensors 22 06683 g004
Figure 5. Results from multiple laboratory tests using SOTS-1 across time (x-axis, hours since SOTS-1 was mixed), showing (A) background seawater (BGSW)-normalized raw counts of SOTS-1 and (B) BGSW-normalized concentration of SOTS-1 (pM). Tests were completed using default voltage and different integration times: 100 ms (green), 500 ms (orange), and 900 ms (blue). Points represent the average signal and error bars represent the standard deviation.
Sensors 22 06683 g005
Table 1. List of DISCO II components with description of the brand, model, details, function inside the instrument, and cost for all units. Numbers (Num) correspond with the components shown in Figure 1. The “*” indicates components that are updated from DISCO I to DISCO II.
NumNameBrandModelDetailsFunctionCost for All Units
1 *Dive housingMade in-houseNADelrin housing, sealed water tightProtects electronics and mechanical parts against water and pressureUSD 1500
2 *Oil-Filled Tablet CompartmentMade in-houseNADelrin housing covered with clear 0.005″ thick PVC plastic front, flooded with oilHouses tabletIncluded in Dive Housing
3 *Pressure bearing compartmentMade in-houseNADelrin housing with black plastic lid, sealed with O-ring and screwsHouses electronics, pumps, and PMTIncluded in Dive Housing
4 *Flooded compartmentMade in-houseNADelrin housing covered with black plastic lid with holes that allow water in, secured with magnetsHouses reagent bagsIncluded in Dive Housing
5 *Oil compensatorMade in-houseNASilicone bellow attached to oil-filled compartmentExcess oil to compensate oil-filled compartmentUSD 100
6 *TabletSamsungGalaxy Book 2Hosts user interface and instrument control and communication, stores dataProtects electronics and mechanical parts against water and pressureUSD 400
7Sampling wandMade in-houseNAPlastic tube with inlet tubingIntake of analyte fluidsUSD 150
8Wand Filter ScreenLee FluidicsFSHF-2304025AFilter screen with 0.010″ holesFilter to prevent clogging and particulate matter from enteringIncluded in Wand
9TubingMcMaster CarrPolyethelene Tubing1/8″ OD × 1/16″ IDTransports fluids from source through pumps, and flow cellUSD 20
10Fangeless furrule fittingsIDEX Health and ScienceP-235XPEEK, 1/4-28 thread with flat bottomFit tubing to ports of dive housing, pumps, and flow cellUSD 100
11 *Check valvesIDEX Health and ScienceCV-3335Peek, Chemically inertAllows fluid to flow in one direction to prevent back-flowUSD 100
12 *Mini peristaltic pumpsInstech Laboratories Inc.p625Three pumps with viton tubingThree pumps for analyte fluid and chemical reagentsUSD 2200
13Photomultiplier tube (PMT)Hamamatsu PhotonicsH93192.54 cm diameter head-on PMTMeasures chemiluminescent signalUSD 1980
14 *PMT HousingMade in-houseNACovers sensing portion of PMT from stray lightHouses PMTUSD 700
15 *Flow cellMade in-houseNASpiral path, TeflonMixes analyte and reagent for PMT to measureUSD 100
16Reagent BagsThermo Scientific LabtainerBioProcess Containerplastic, 500 mL (MCLA) and 50 mL (SOD)Holds chemical reagentsUSD 30
17 *Smart Lithum Ion BatteryInspired EnergyND205XA414.4 [V], 4 [A] maximum, 4.9 [Ah] capacityPowers PMT, electronics, and tabletUSD 120
18 *Micro Controller and I/O BoardAdafruit FeatherM0Incorporated into custom built embedded controller (WHOI 3-0002-01), dimensions 5.72 × 5.72 cmCommunicates with tablet via Bluetooth. Controls voltage and acquires the signal from the PMT over an RS232 serial connectionUSD 50
19 *Battery Charger and Power DistributorWHOI Acomms204104, 205099Power control board that control the battery charging and distribution of power to the microcontroller, PMT, and pumpsPower supply and managementUSD 850
20 *Flow and Temperature SensorSensirionSLF3S-0600FPlaced in-line and sends flow rate and temperature in real time to tablet via BluetoothMeasures flow rate and temperature for analytical inlet and combined outletUSD 250
21 *Fluidics bulkheadIndustrial Specialties MfgPBHV-116-18-WNConnects pressure-bearing and flooded compartmentsBulkhead to pass through reagent fluid linesUSD 200
22 *Electrical bulkheadCeramTecPressure: Ceramtight 50040-01-AConnects pressure bearing and oil filled compartmentsBulkhead to pass through charging cord for tabletUSD 100
23HOBO loggerOnsetMX2202Temp/LightRecords temperature and light intensityUSD 100
24Waste outletIDEX Health and SciencePEEK Tubing0.159 cm OD, 0.076 cm IDDischarges all fluidsUSD 50
Total CostUSD 9100
Table 2. Summary of DISCO II calibrations within the laboratory at different voltages (800, 1200, and default) and integration times (IT: 100, 500, 900 ms). The average and standard deviation of results are displayed for calibrations conducted within aged, filtered seawater (AFSW). Displayed are the baseline counts prior to superoxide spike (raw counts), the calibration factor (pM count−1), the sensitivity (count pM−1), the half-life of superoxide during the calibration (min), the decay rate constant (s−1), the initial concentration of superoxide (pM), the limit of detection (pM), and the percent variance (%). The ANOVA p-value is indicated for each measurement across different PMT settings, with an “*” indicating statistical significance (p-value < 0.050). For those measurements that were not statistically different across PMT settings, the instrument (inst.) average and standard deviation across all settings are displayed.
PMT SettingVoltage80080012001200DefaultDefaultDefaultANOVA p-ValueInst. Average
IT (ms)100900100900100500900
Count 6656312726
AFSW Baseline (Raw Counts)Average1695.415,715.711,568.9113,858.710,261.556,483.1101,393.2* 5.47 × 10−85
Std. Dev.163.71279.2922.56687.22369.96176.47943.0
Cal Factor (pM count−1)Average0.8420.0700.1660.0120.1450.0220.013* 2.27 × 10−25
Std. Dev.0.4630.0320.0620.0070.0750.0090.006
Sensitivity (count pM−1)Average1.617.57.3104.99.255.092.5* 1.72 × 10−23
Std. Dev.0.87.43.541.24.823.836.1
Half-life (min)Average0.5530.5160.5650.5240.6330.5990.5570.7720.586
Std. Dev.0.3300.2440.1550.1780.2580.1470.1770.215
Decay Rate Const (s−1)Average0.0300.0260.0230.0250.0210.0200.0230.0540.022
Std. Dev.0.0160.0090.0080.0080.0080.0040.0070.008
Initial Superoxide Conc. (pM)Average10,748.59114.111,285.07831.78409.47785.97514.80.2108307.3
Std. Dev.3262.34725.33161.12890.23243.53300.62558.33345.6
Limit of Detection (pM)Average163.296.1168.7149.5144.9132.5110.70.545133.1
Std. Dev.88.842.753.558.9113.090.351.887.4
Percent Variance (%)Average3.93.03.03.93.23.52.90.1103.3
Std. Dev.0.40.50.50.70.91.30.71.0
Publisher’s Note: MDPI stays neutral with regard to jurisdictional claims in published maps and institutional affiliations.

