
Identification of Landslides in Mountainous Area with the Combination of SBAS-InSAR and Yolo Model

 , ,
, ,  ,
, 
Abstract
:1. Introduction
2. Study Area
3. Methods
3.1. Data
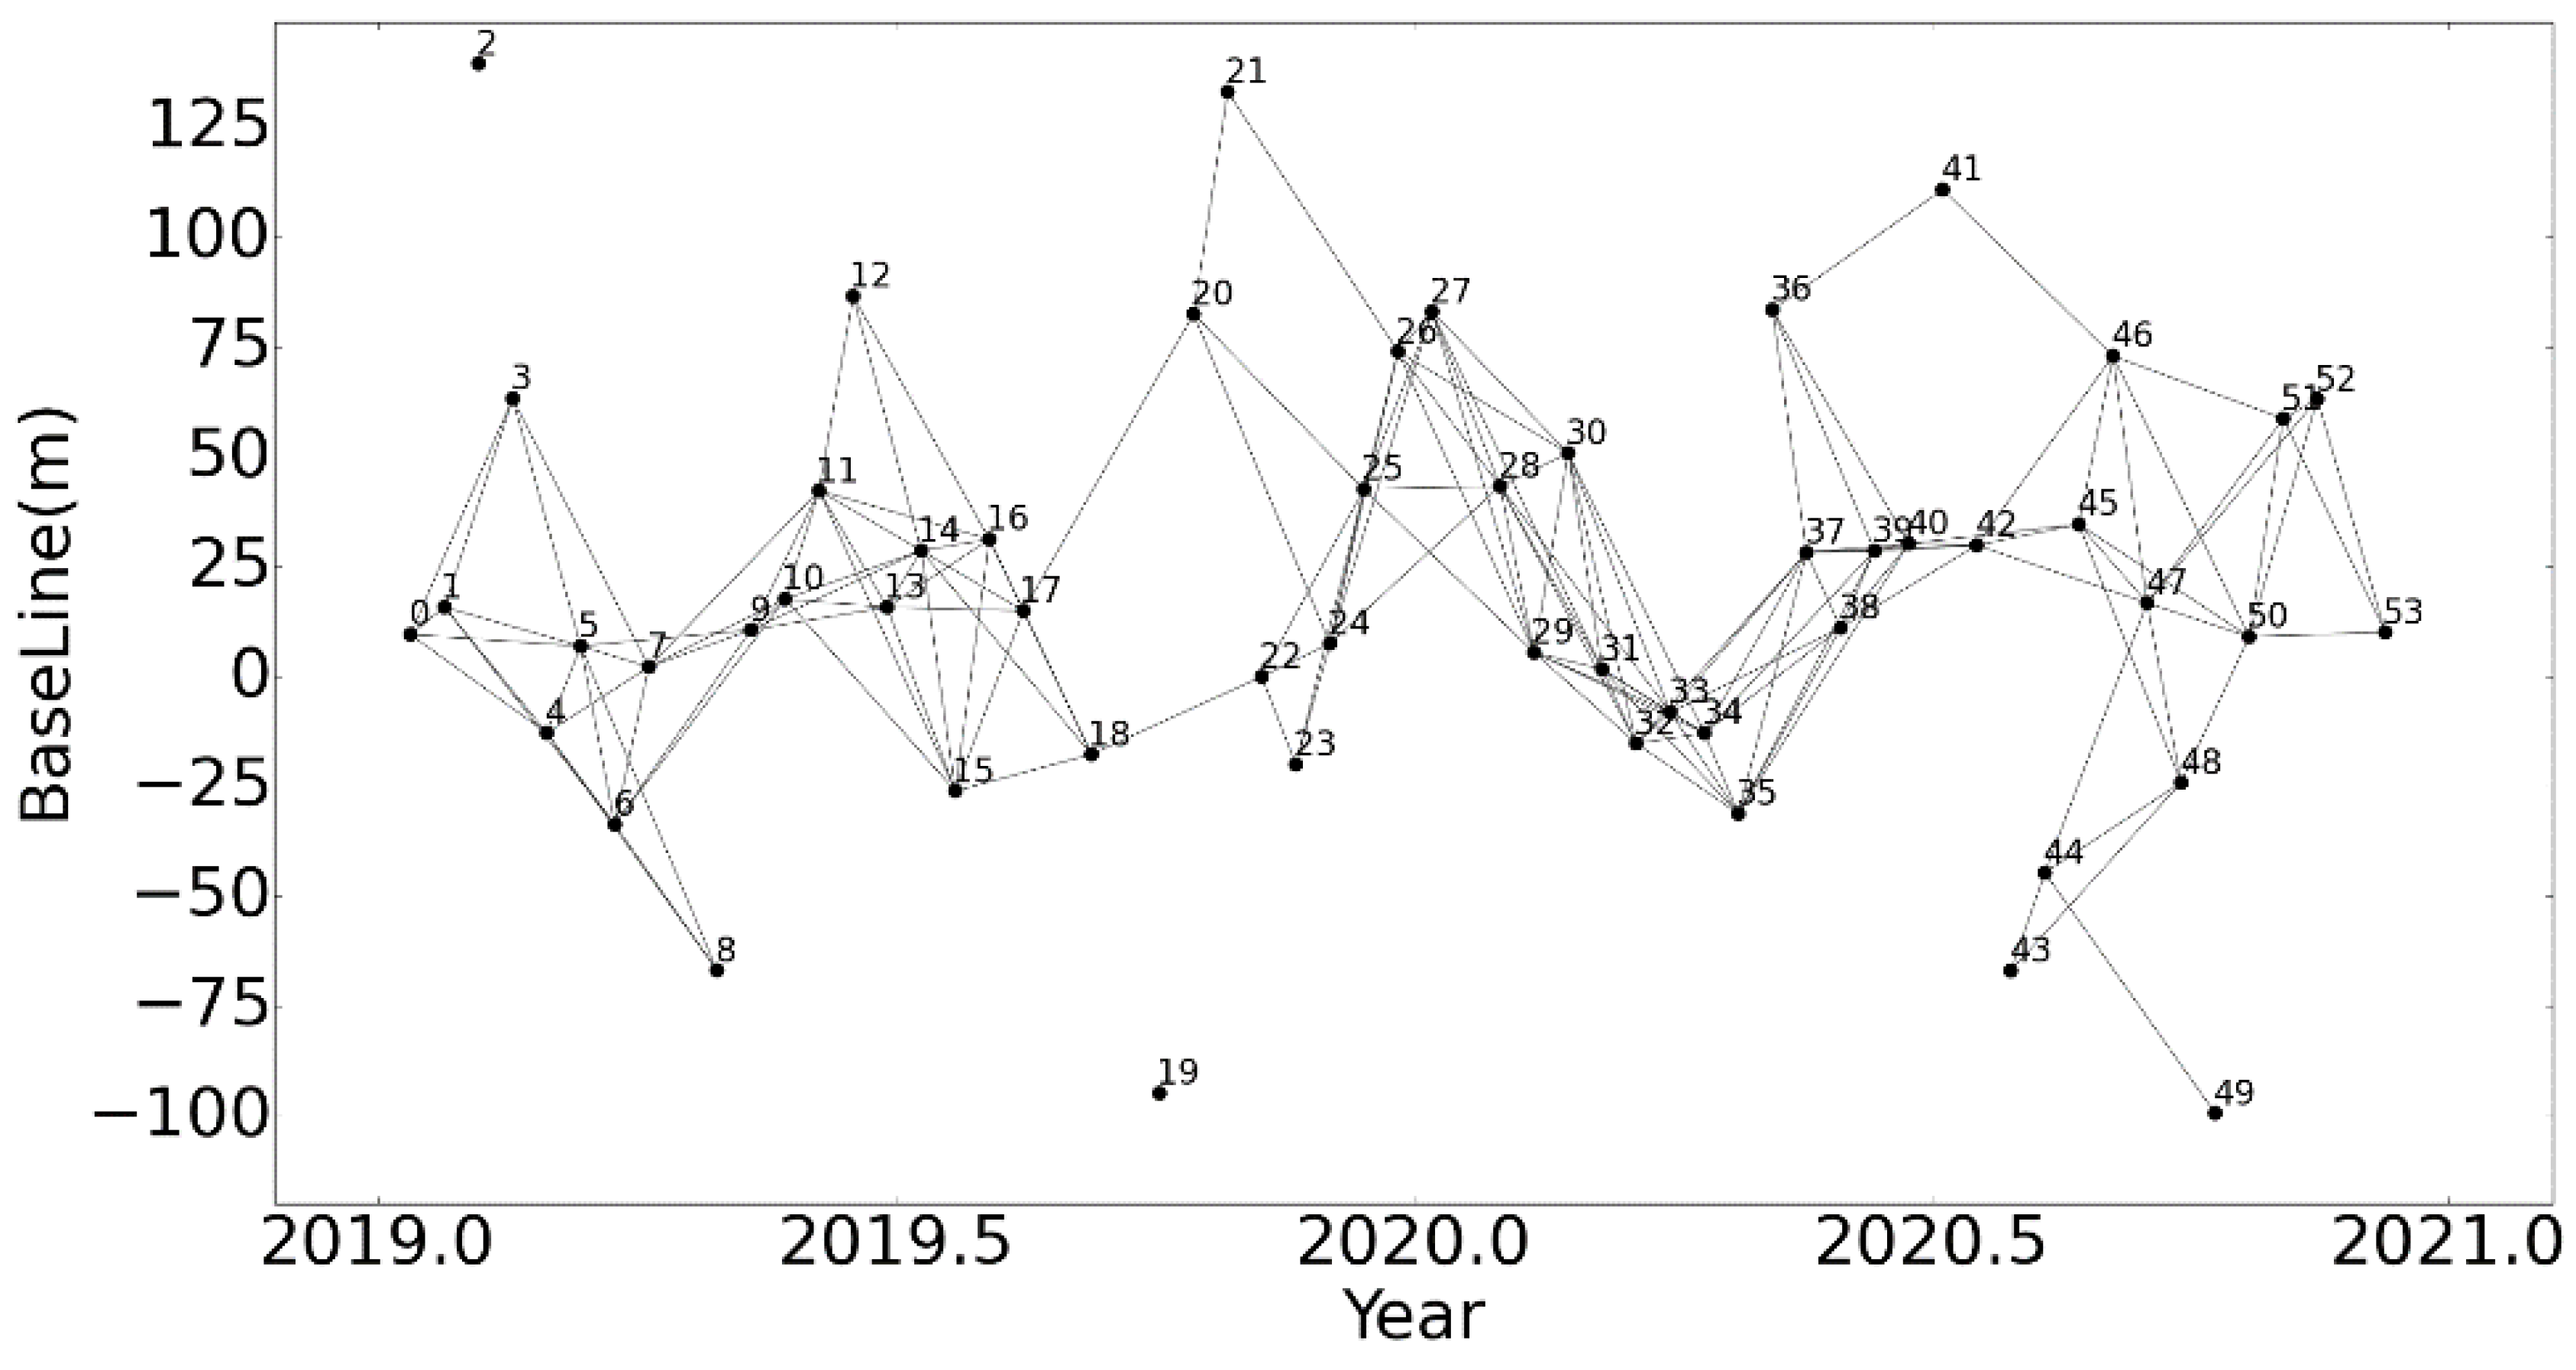
3.1.1. Remote Sensing Images
3.1.2. References and Ancillary Data
3.2. Methods
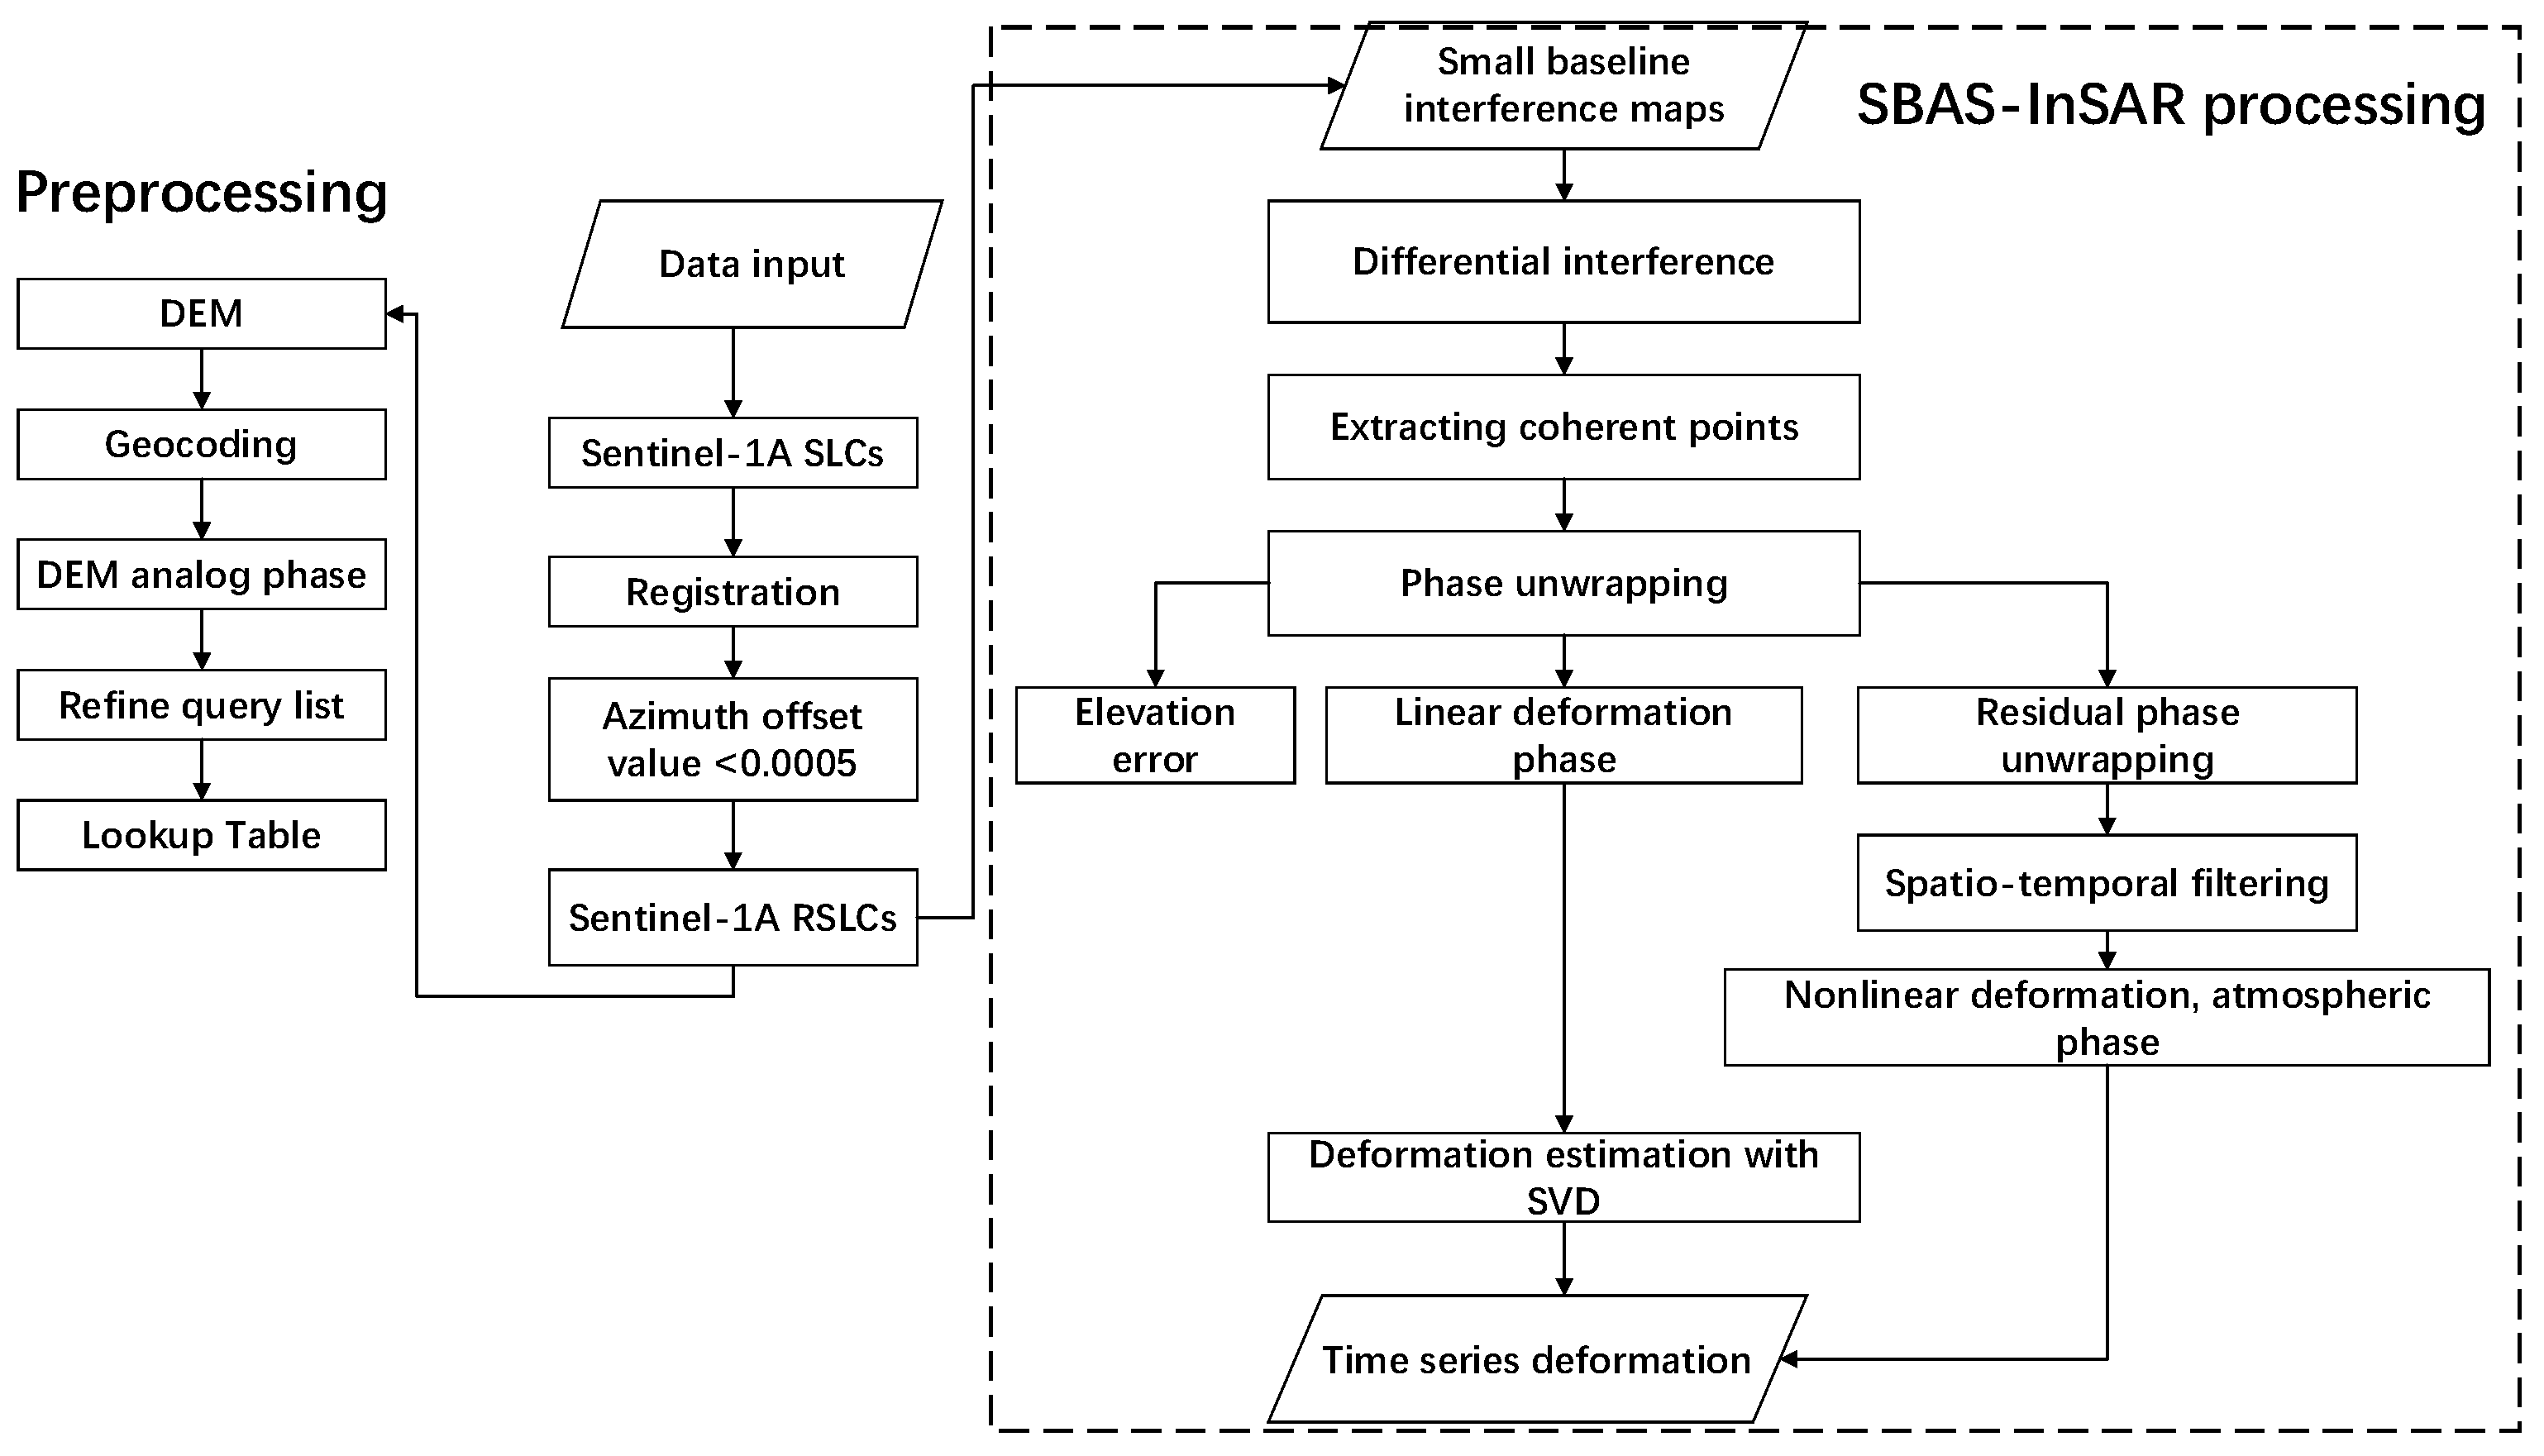
3.2.1. SBAS-InSAR
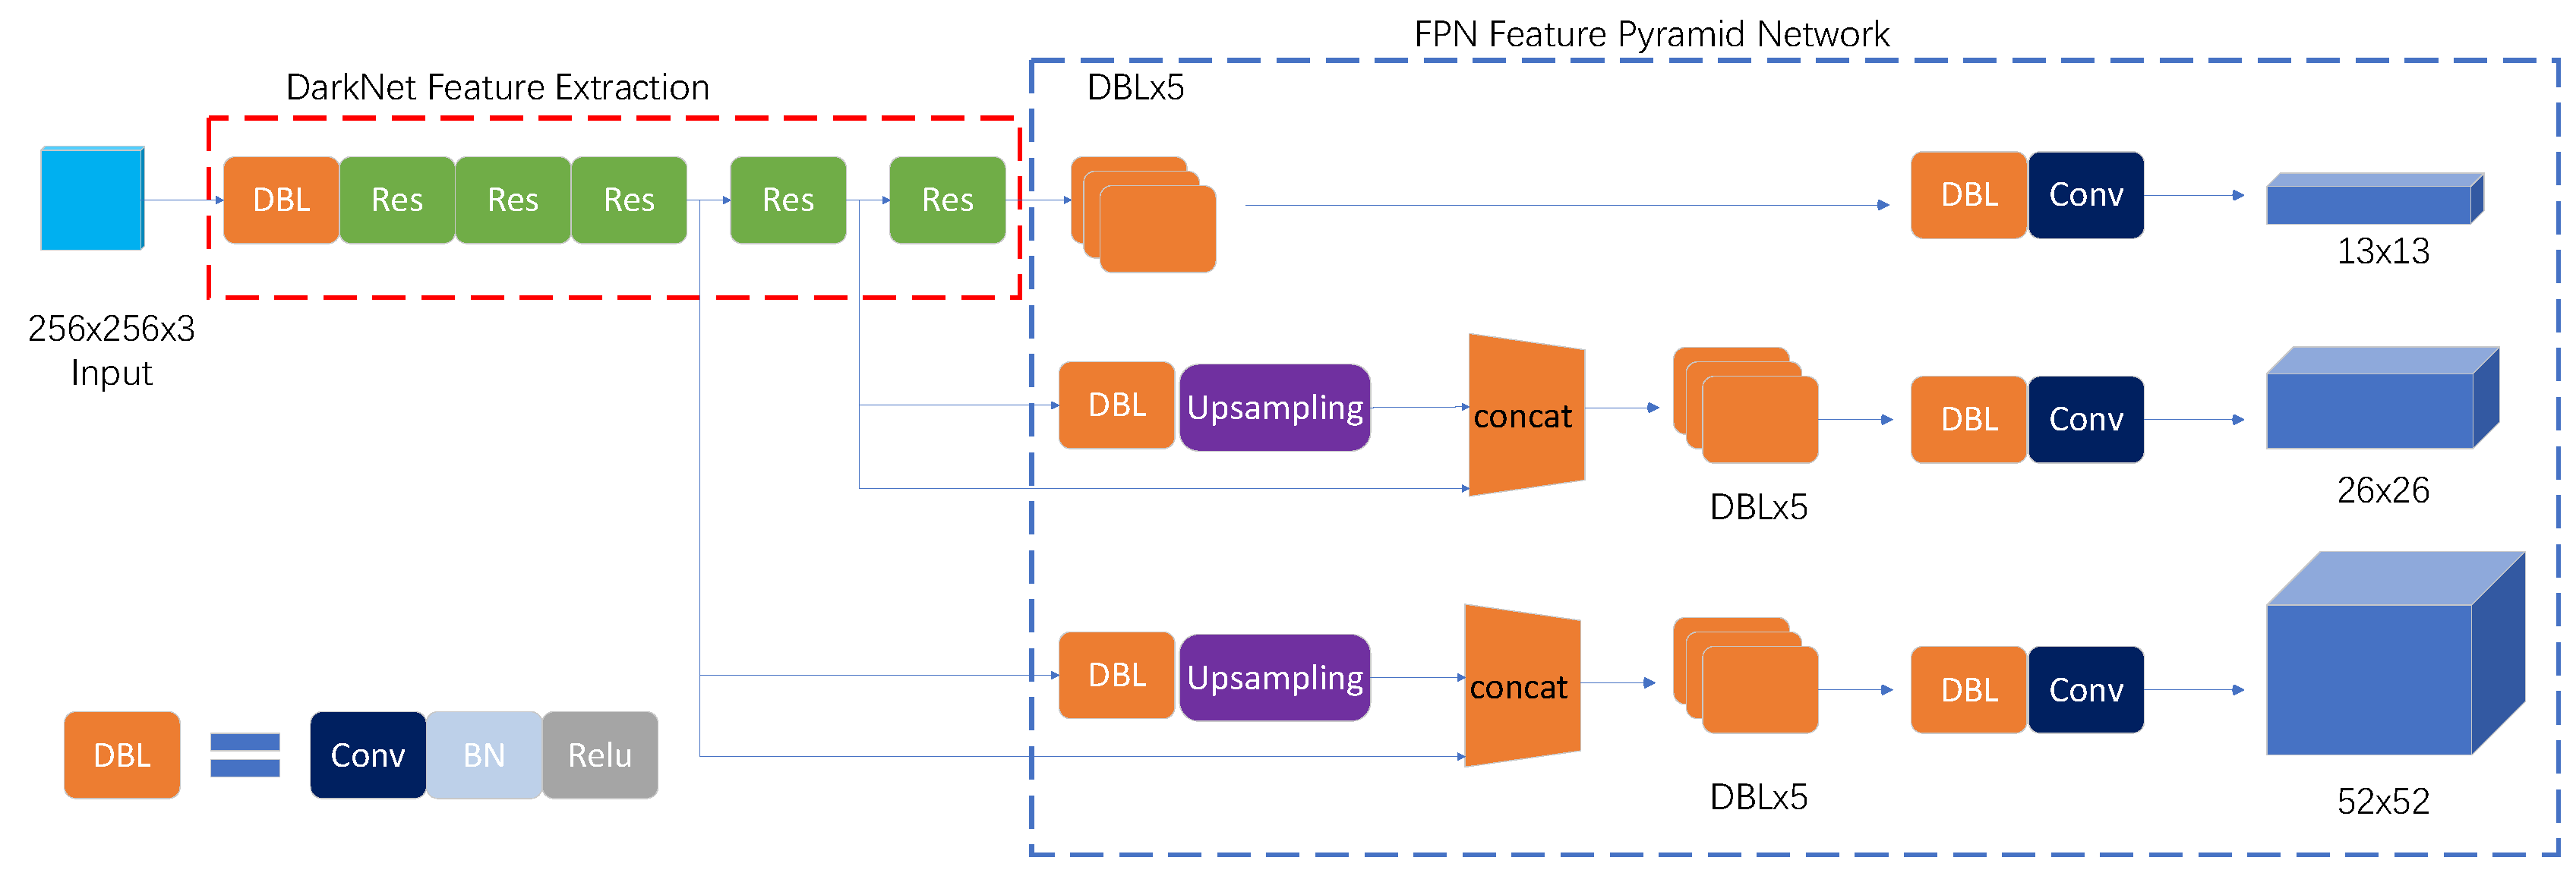
3.2.2. Yolo Model
4. Results
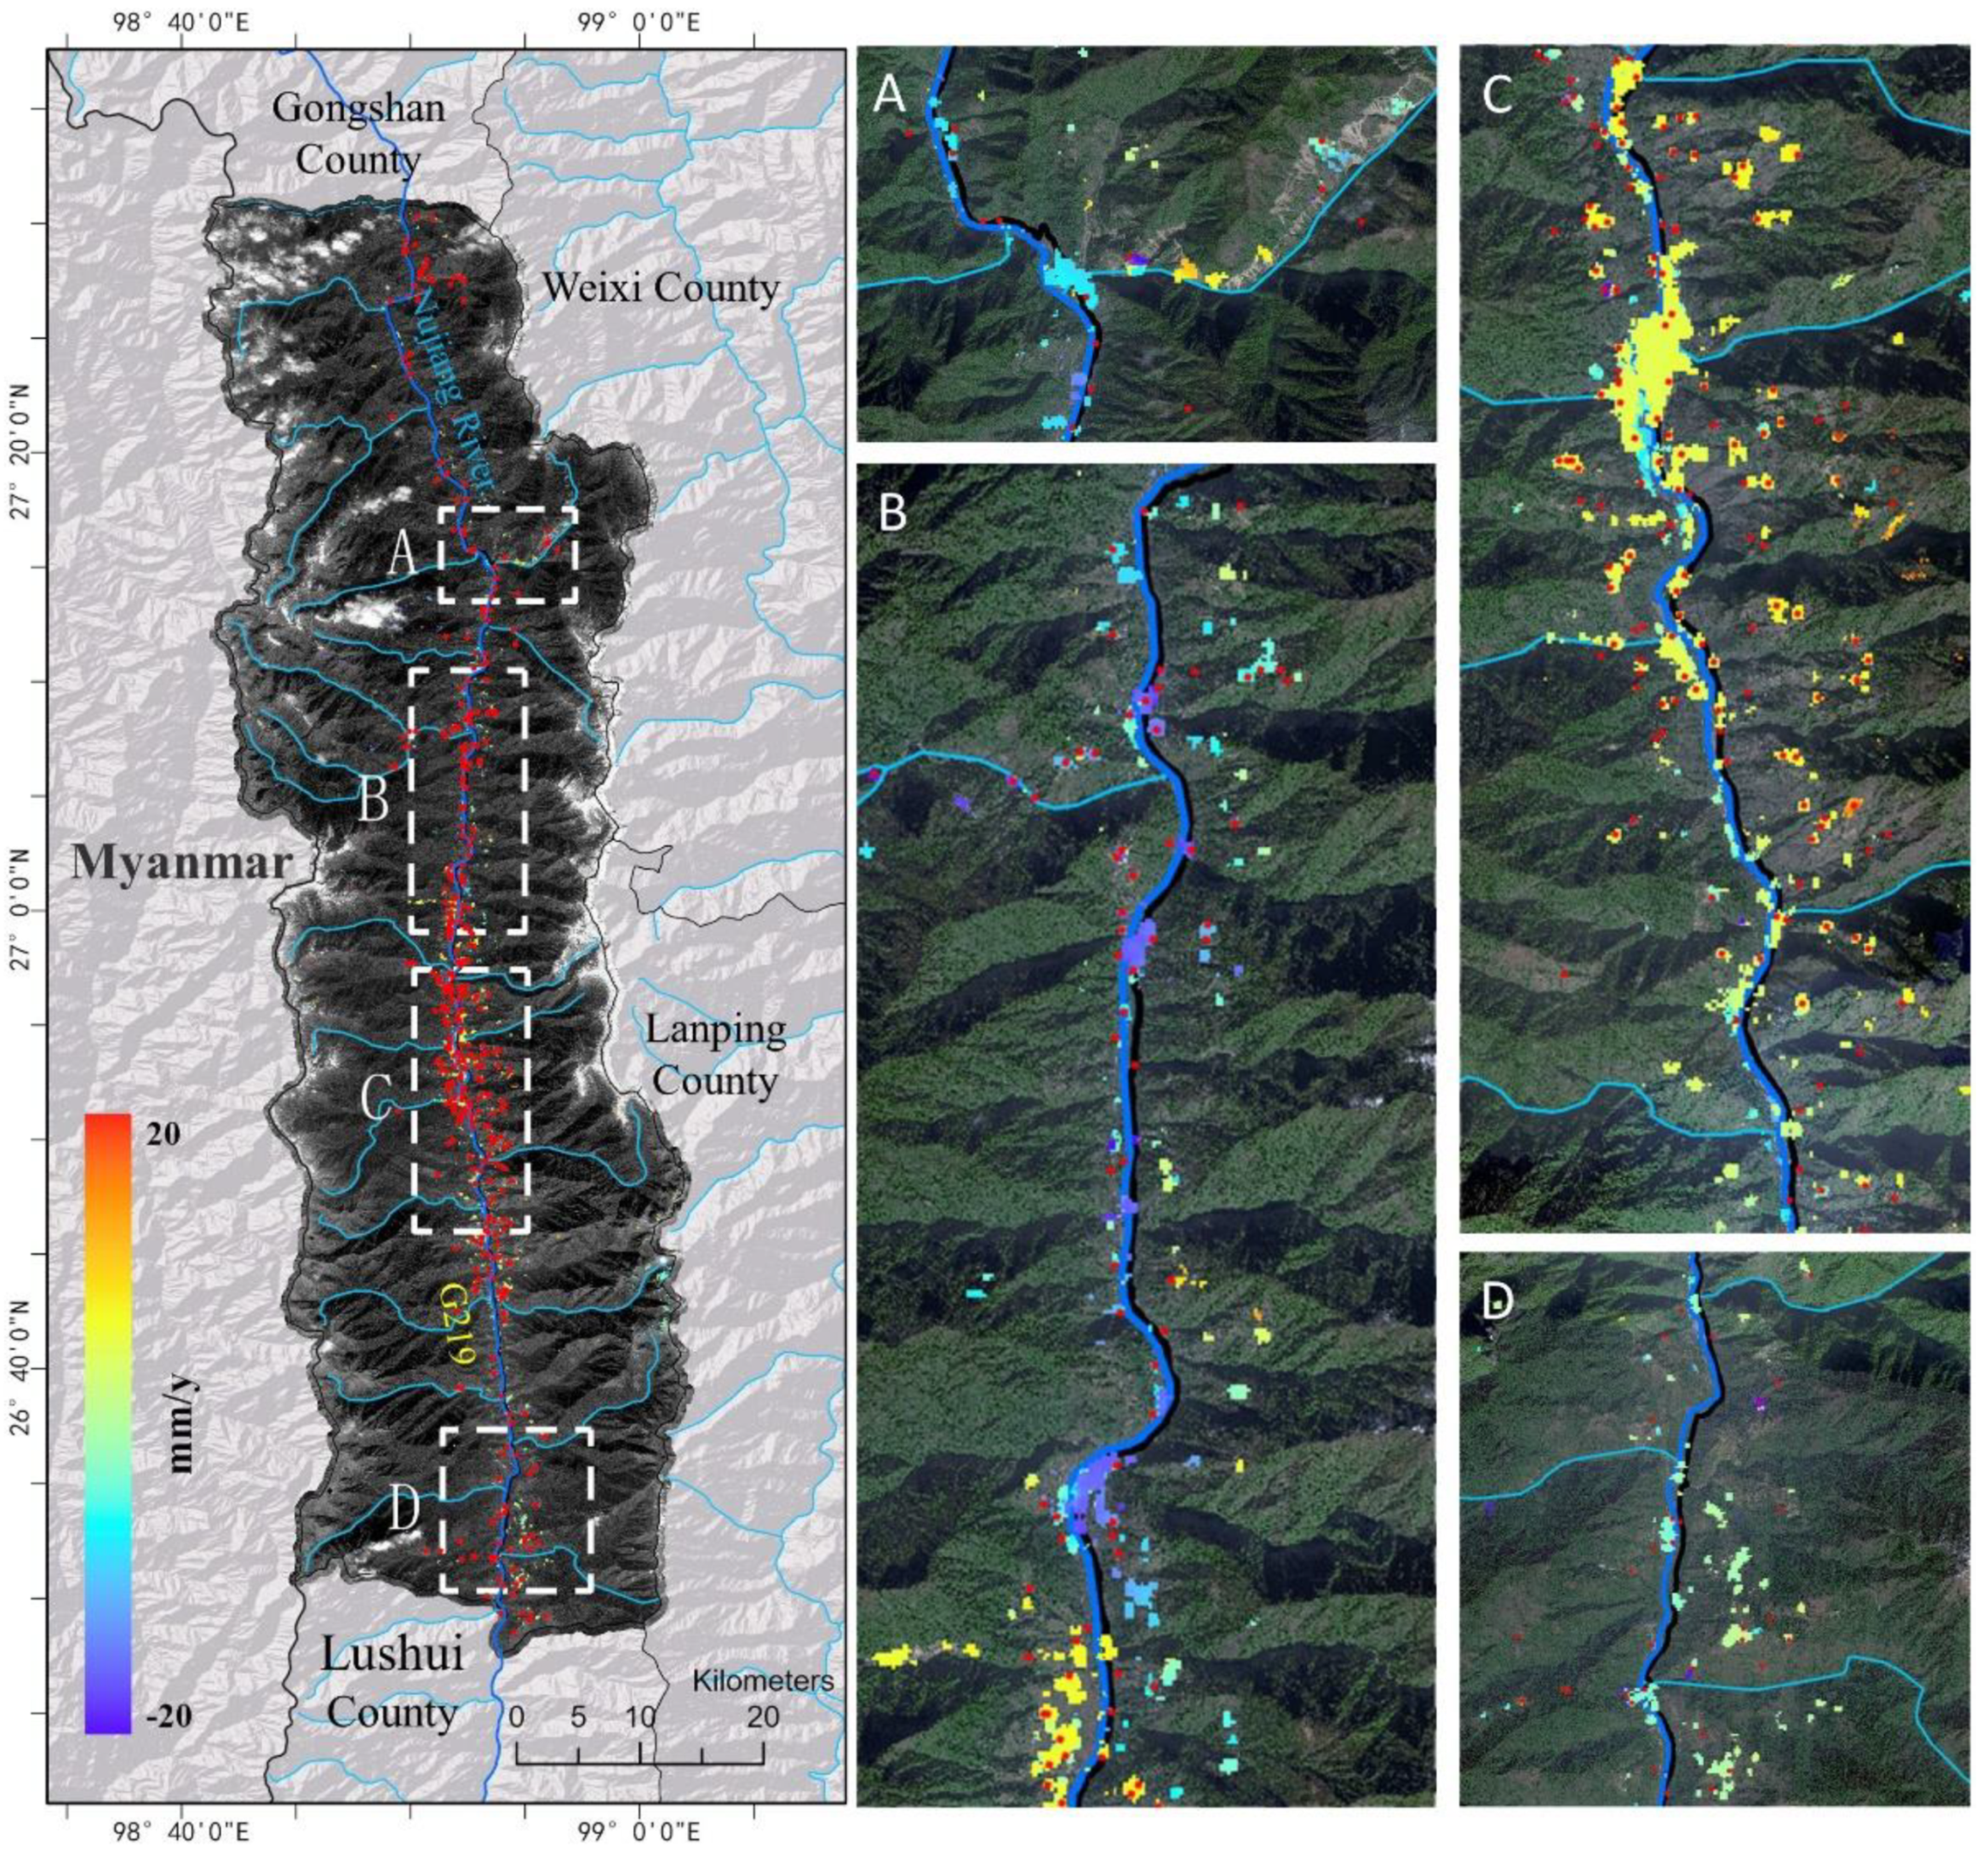
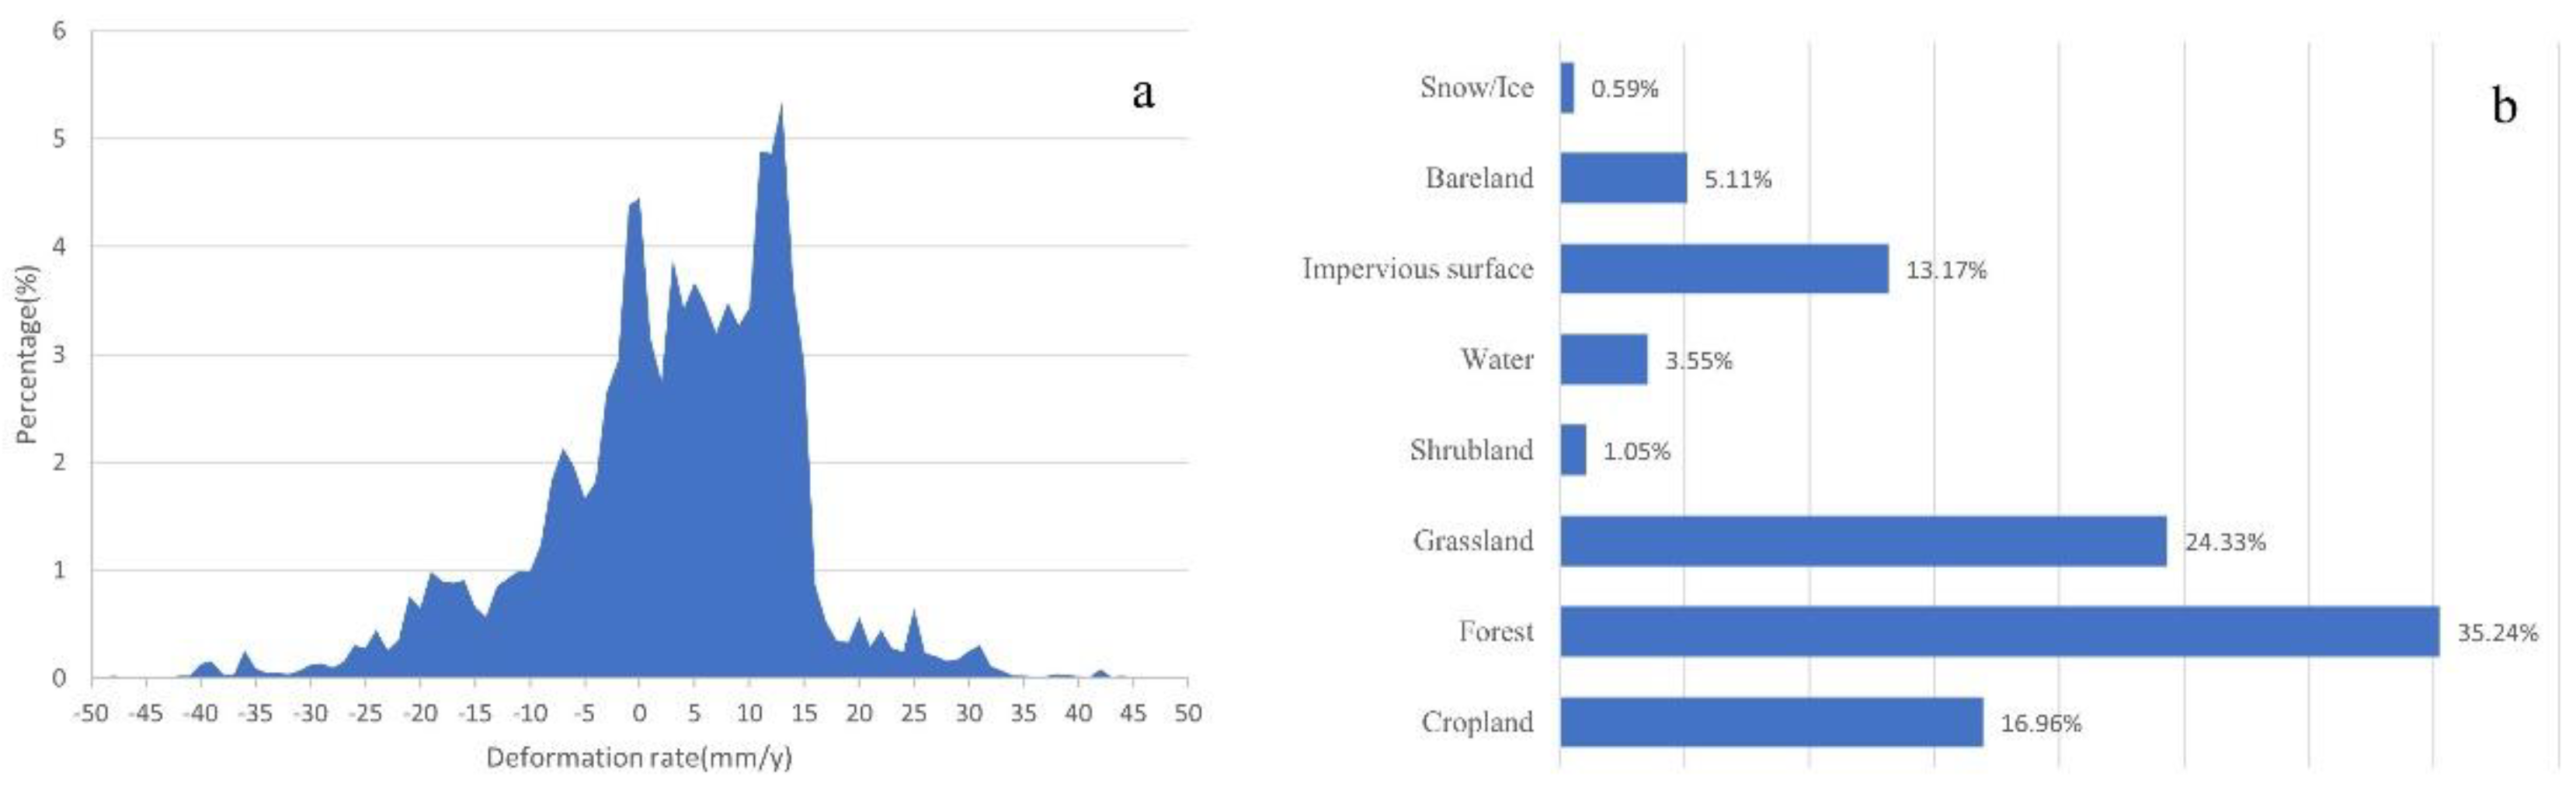
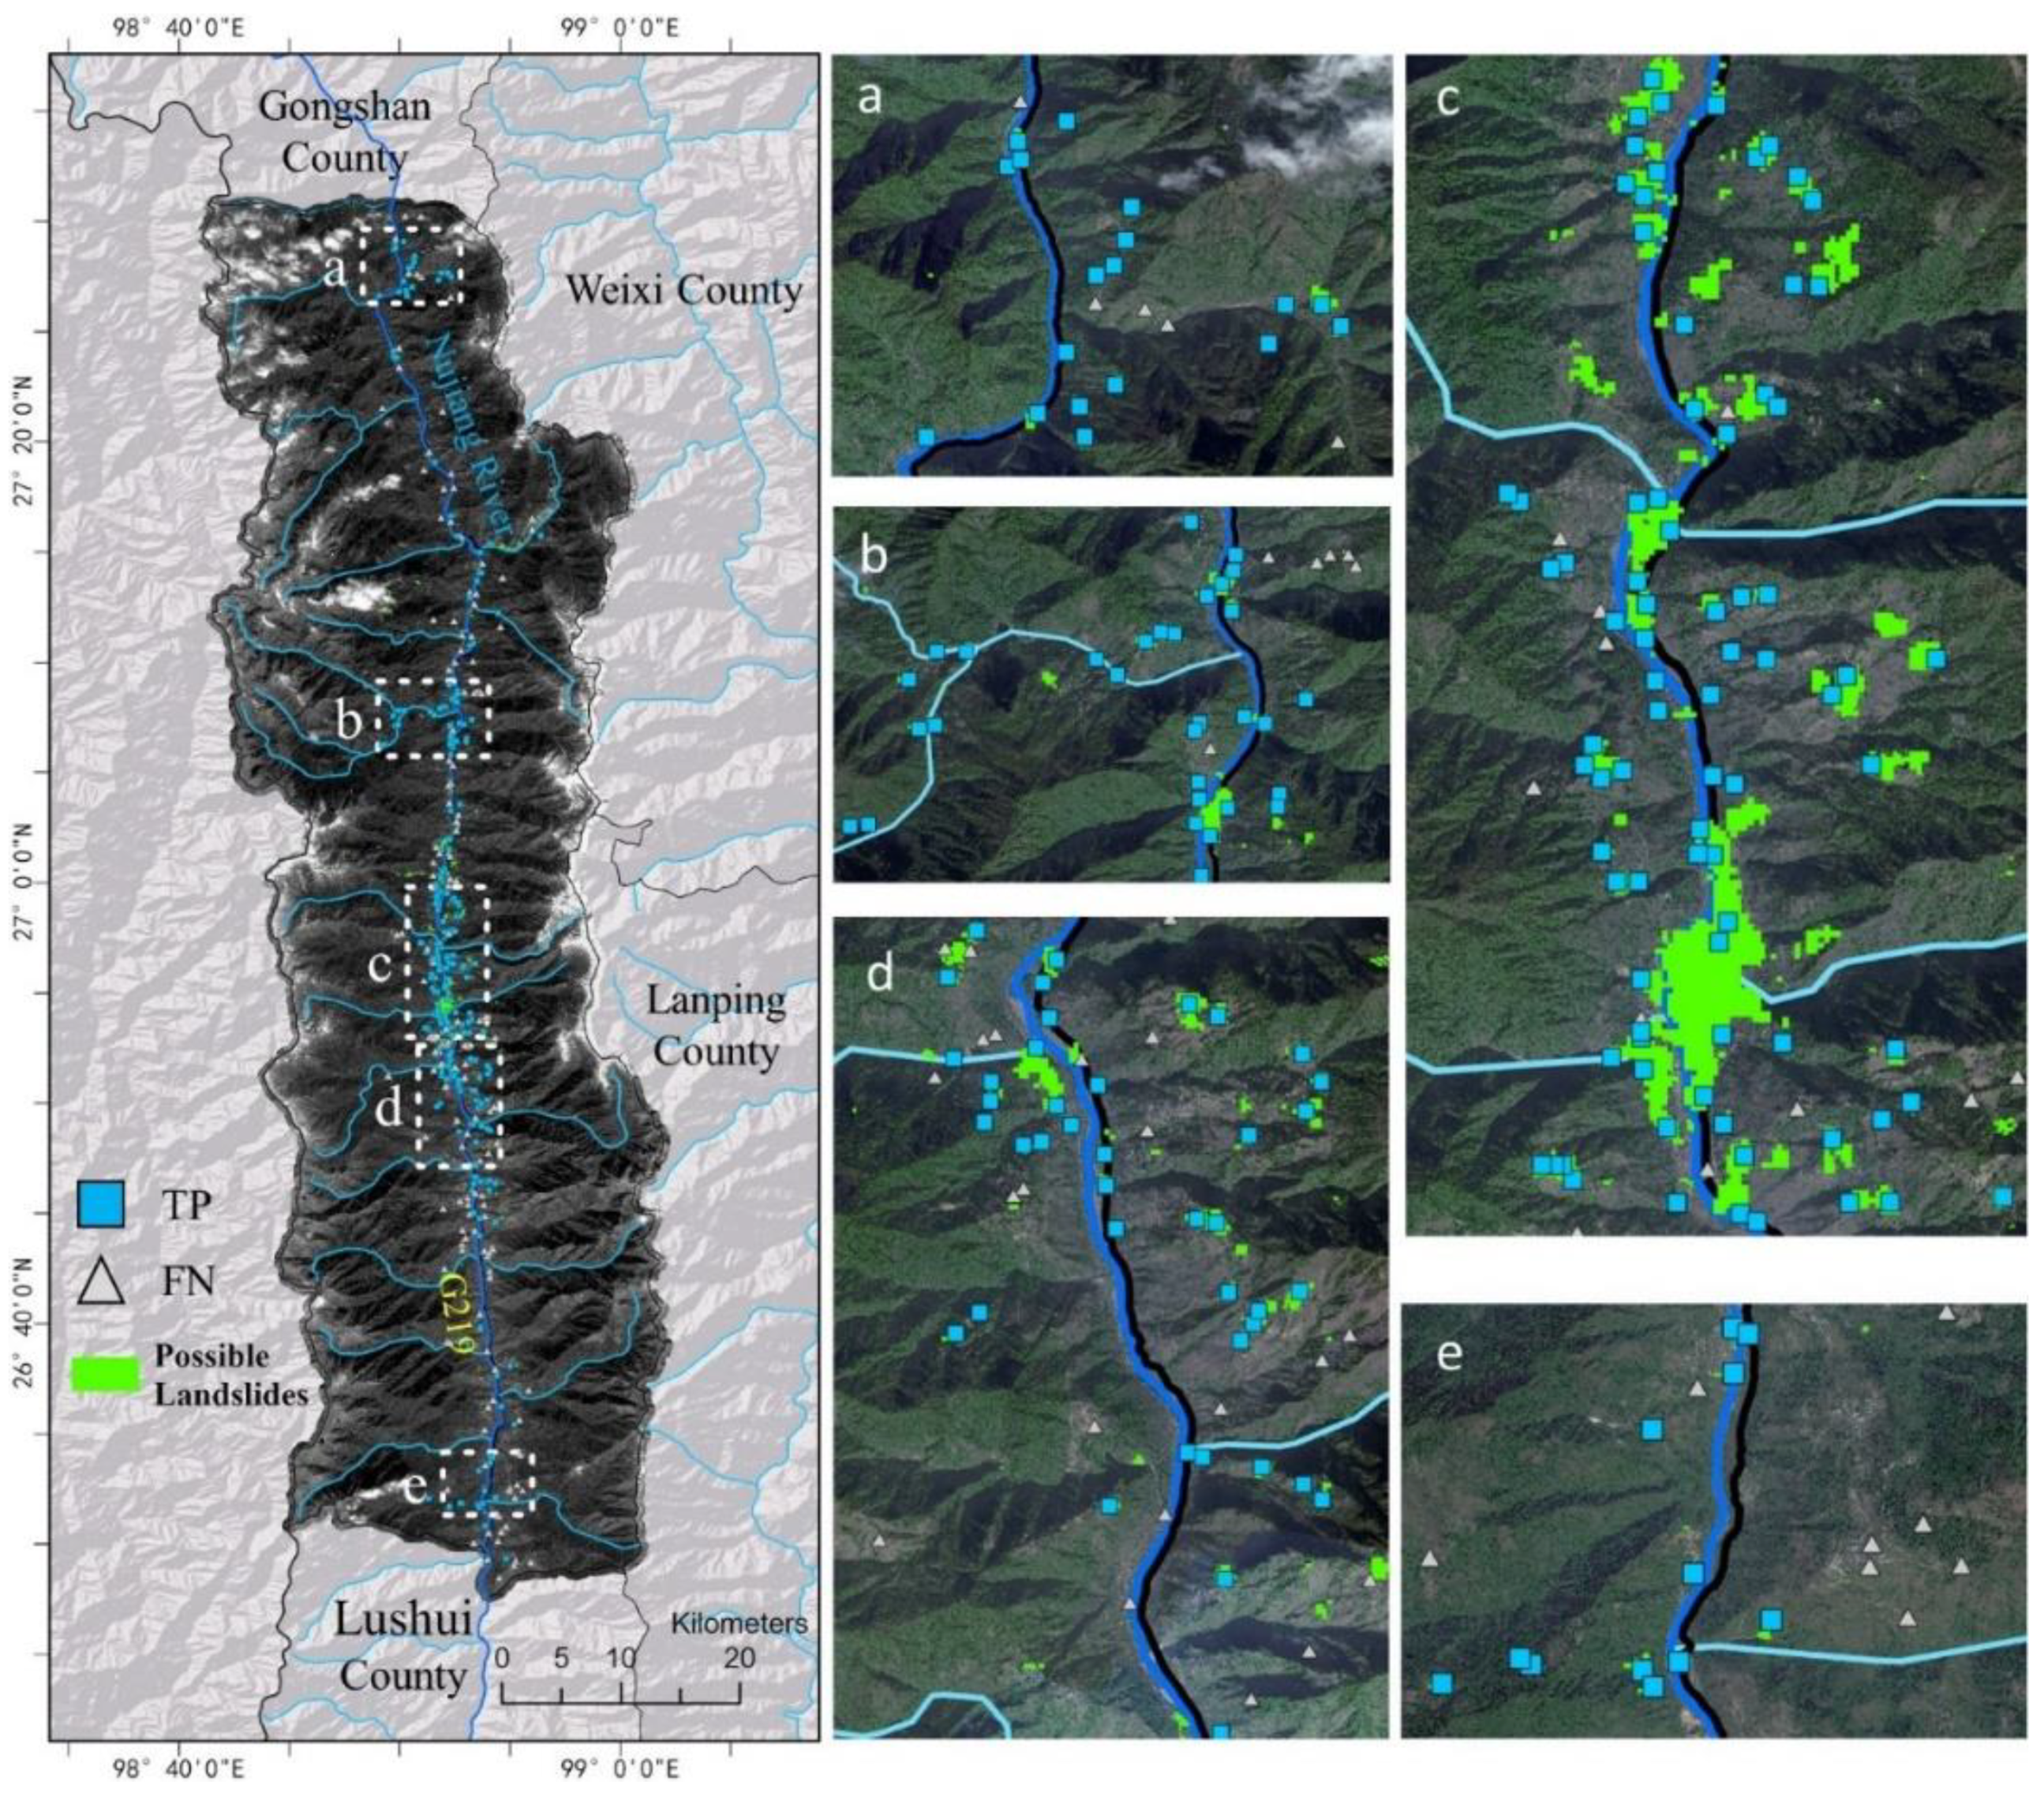
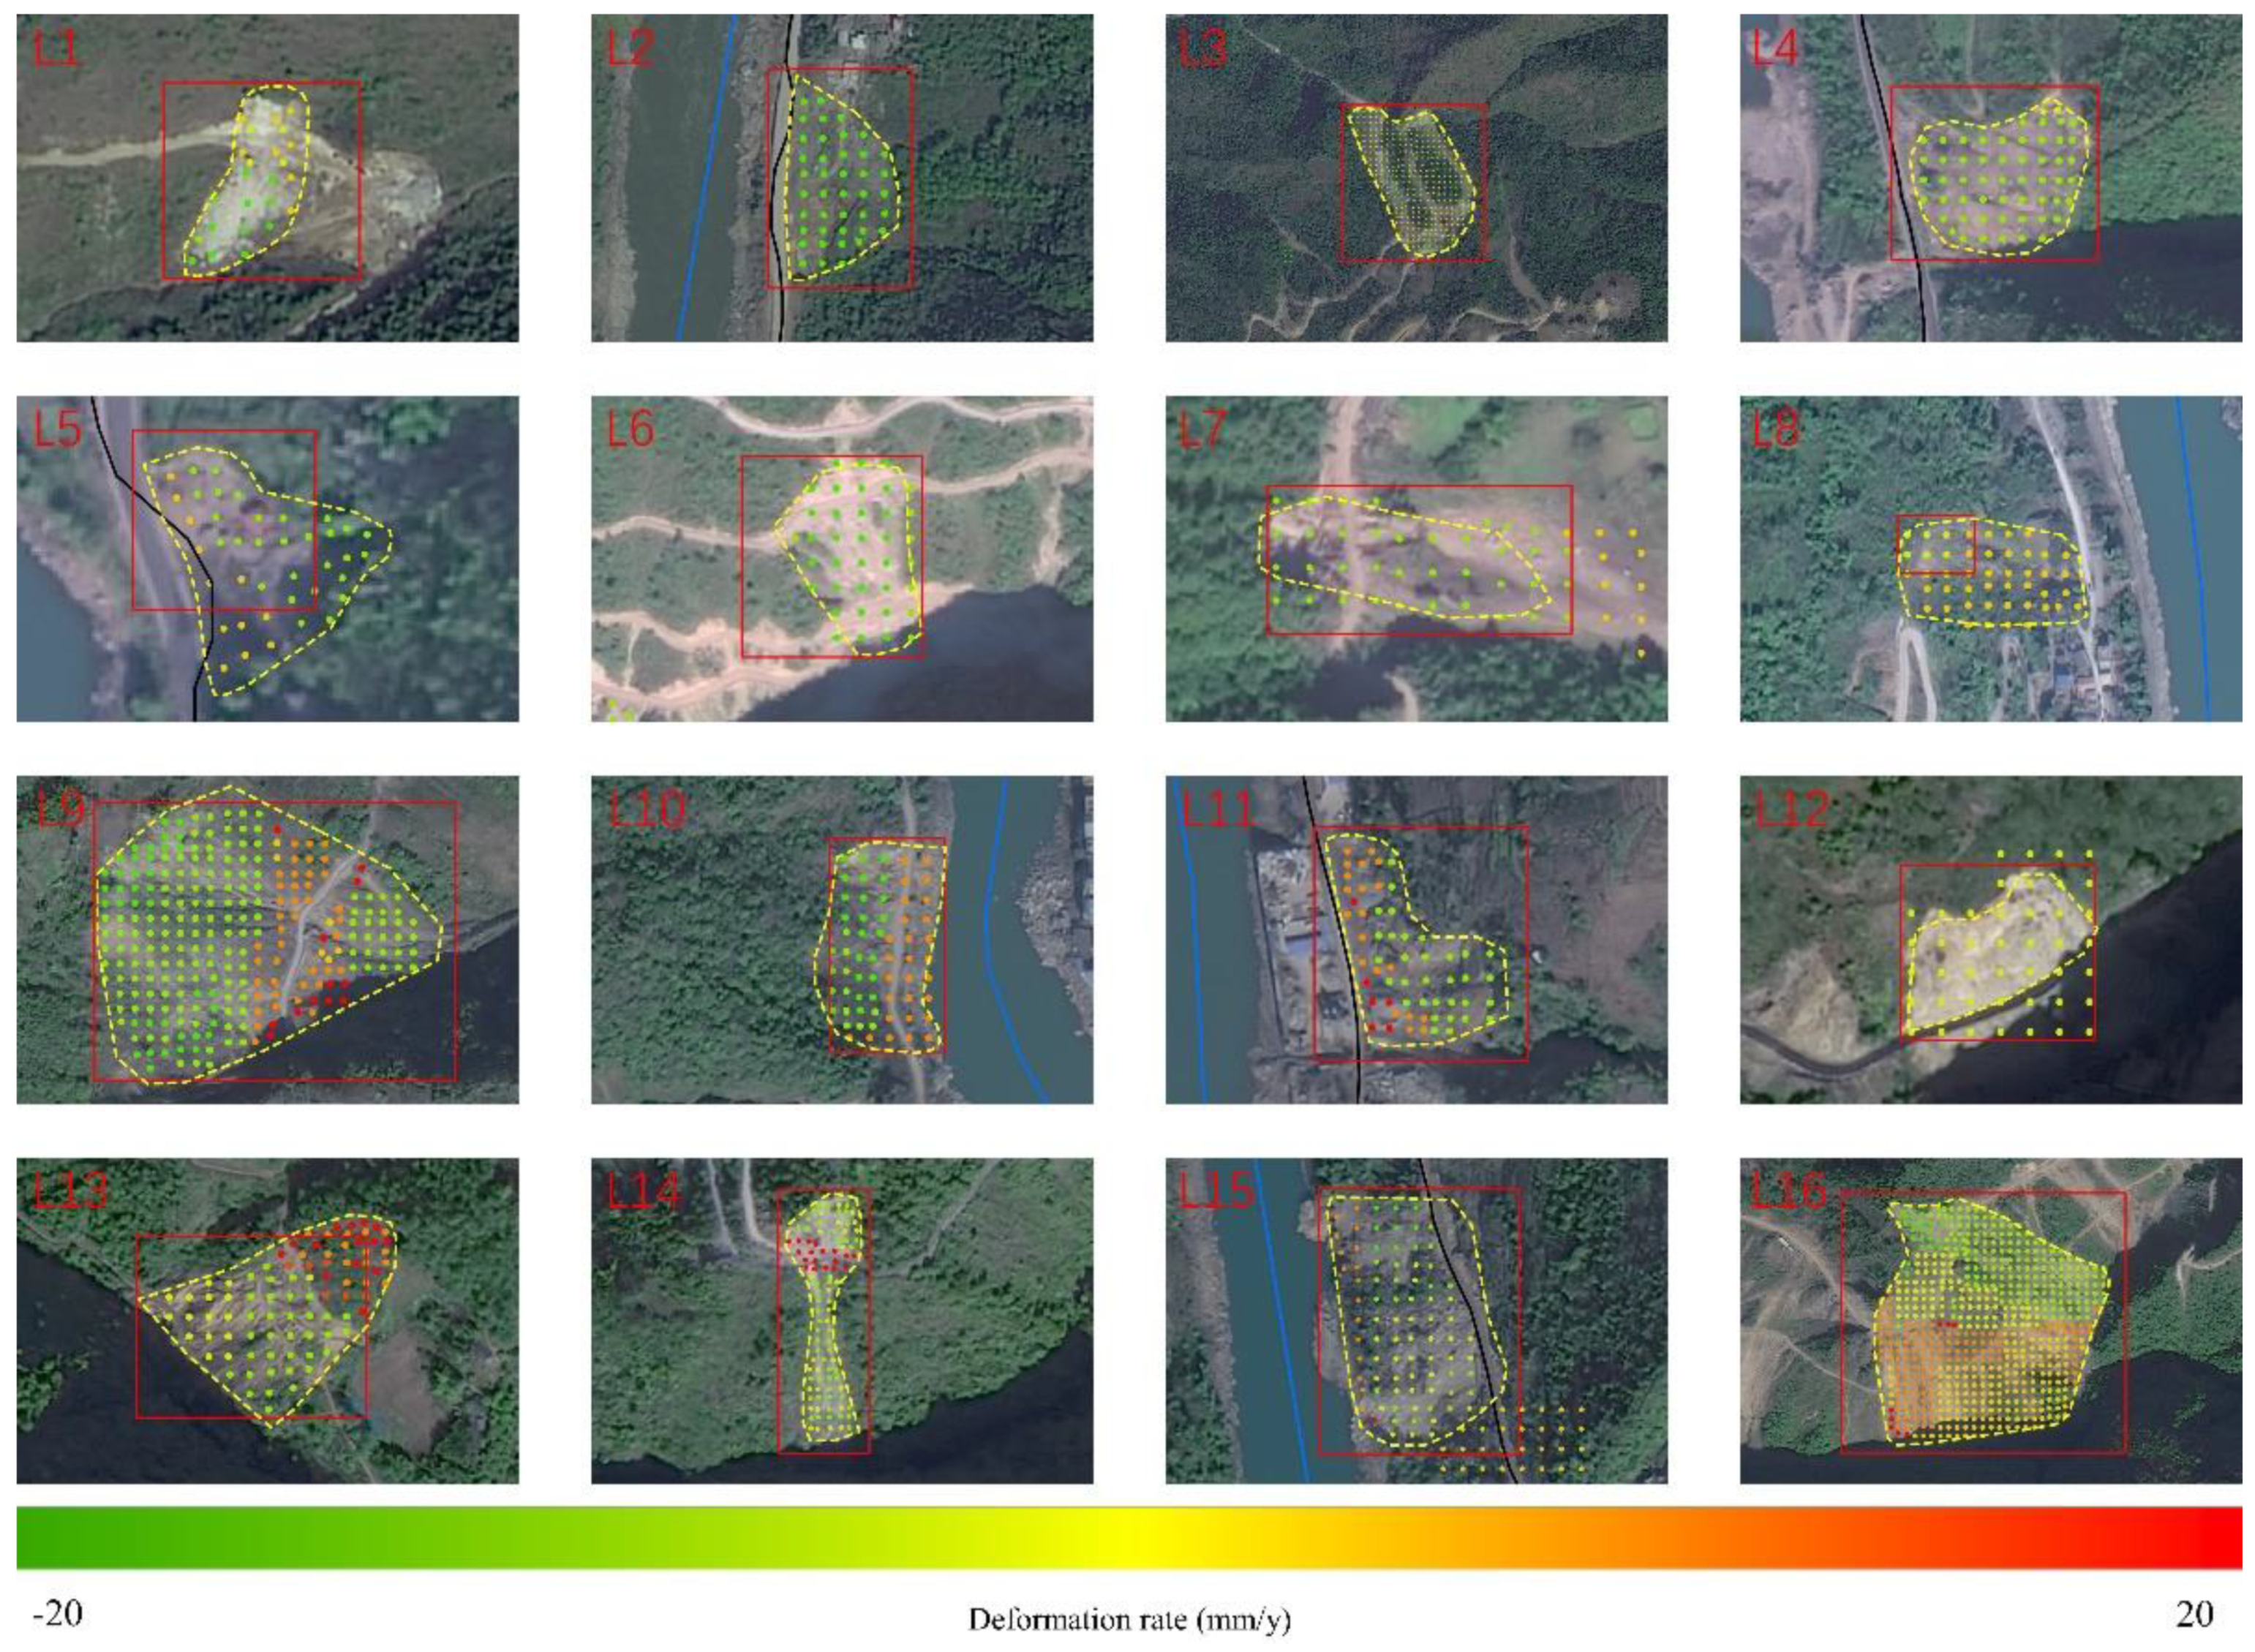
4.1. Landslides Detected by SBAS-InSAR
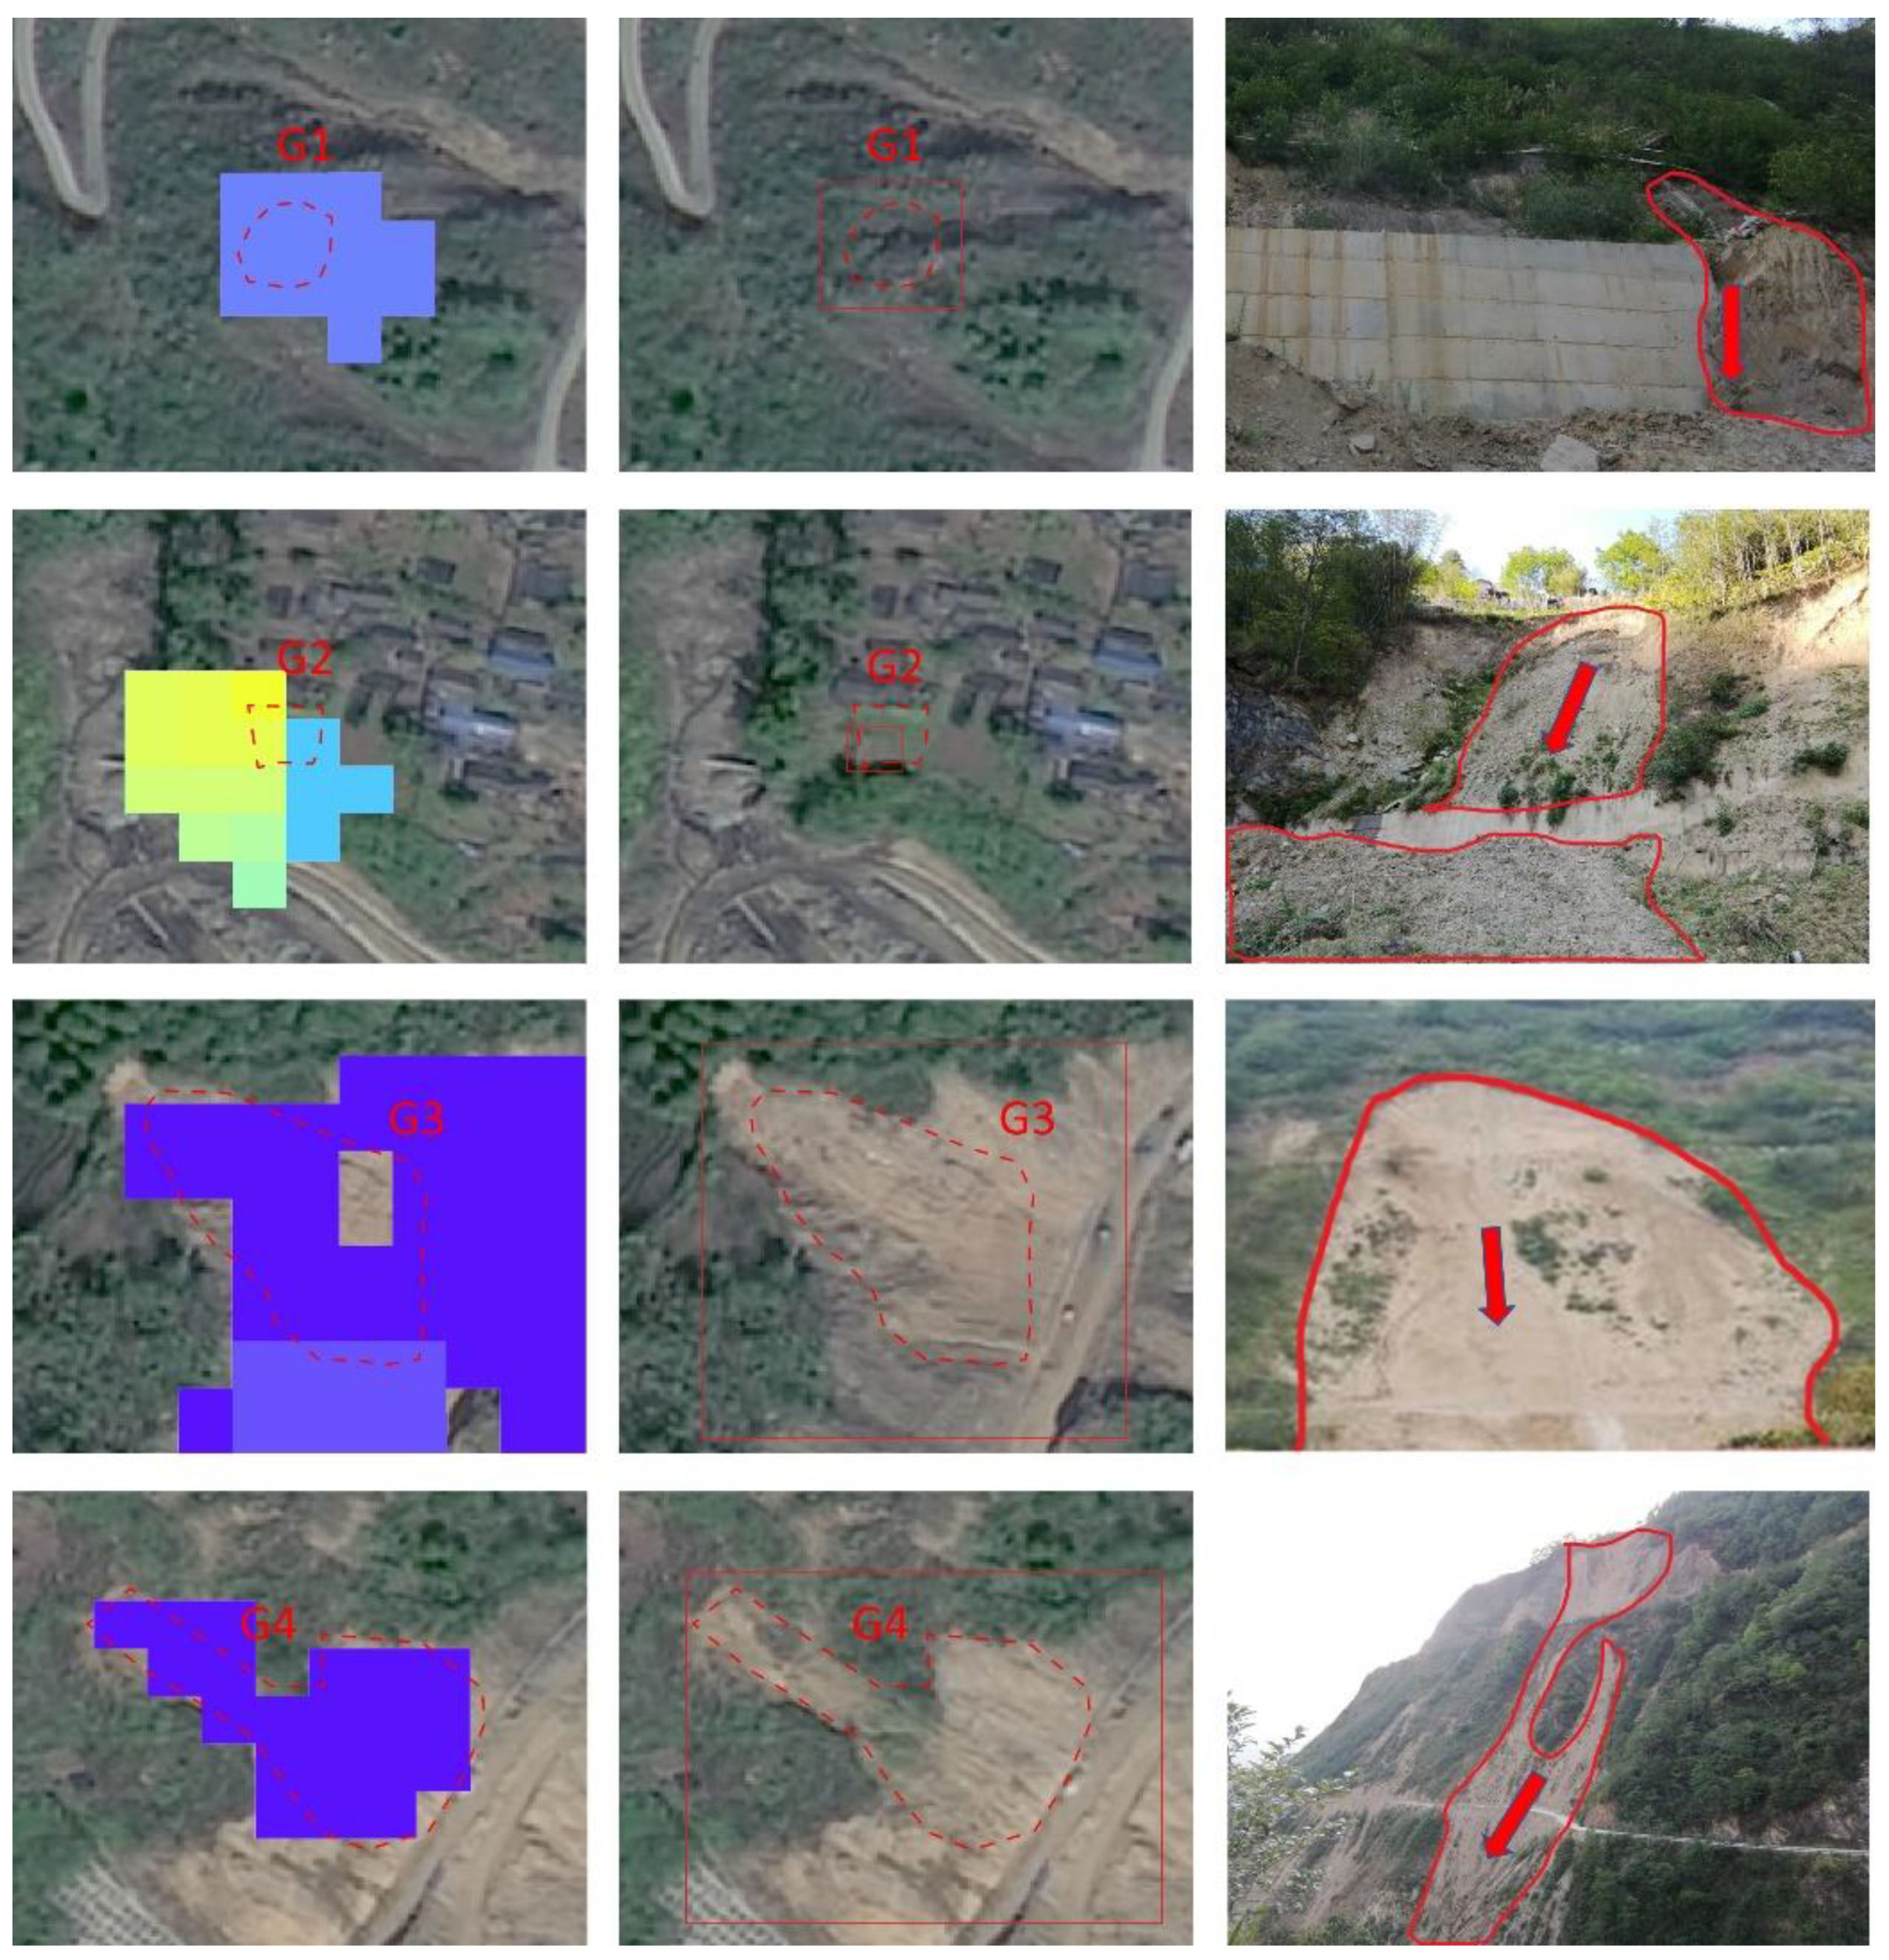
4.2. Landslide Identification with Yolo
4.3. The Combination of SBAS-InSAR and Yolo
5. Discussion
5.1. Natural and Anthropogenic Factors
5.2. Contributions, Limitations, and Further Directions
6. Conclusions
Author Contributions
Funding
Institutional Review Board Statement
Informed Consent Statement
Data Availability Statement
Acknowledgments
Conflicts of Interest
References
- Zhang, P.; Deng, Q.; Zhang, Z.; Li, H. Active Faults, Earthquake Hazards and Associated Geodynamic Processes in Continental China. Sci. Sin. Terrae 2013, 43, 1607–1620. [Google Scholar]
- Liu, C.; Chen, C. Achievements and countermeasures in risk reduction of geological disasters in China. J. Eng. Geol. 2020, 28, 375–383. [Google Scholar] [CrossRef]
- Xu, Q.; Dong, X.; Li, W. Integrated Space-Air-Ground Early Detection, Monitoring and Warning System for Potential Catastrophic Geohazard. Geomat. Inf. Sci. Wuhan Univ. 2019, 44, 957–966. [Google Scholar] [CrossRef]
- Zhu, Q.; Zeng, H.; Ding, Y.; Xie, X.; Liu, F.; Zhang, L.; Li, H.; Hu, H.; Zhang, J.; Chen, L.; et al. A review of major potential landslide hazards analysis. Acta Geod. Cartogr. Sin. 2019, 48, 1551–1561. [Google Scholar]
- Liao, M.; Zhang, L.; Shi, X. Methods and Practices of Landslide Deformation Monitoring with SAR.; Science Press: Beijing, China, 2017. [Google Scholar]
- Antonielli, B.; Monserrat, O.; Bonini, M.; Righini, G.; Sani, F.; Luzi, G.; Feyzullayev, A.A.; Aliyev, C.S. Pre-eruptive ground deformation of Azerbaijan mud volcanoes detected through satellite radar interferometry (DInSAR). Tectonophysics 2014, 637, 163–177. [Google Scholar] [CrossRef]
- Fu, B.; Xie, S.; Li, T.; Li, H.; Zuo, P.; Gao, E. Comparative Study of Landslide Remote Sensing Monitoring Based on SBAS/PS-InSAR Technology. J. Geod. Geodyn. 2021, 41, 392–398. [Google Scholar] [CrossRef]
- Yang, C.; Dong, J.; Zhu, S.; Xiong, G. Detection, Identification and Deformation Characteristics of Landslide Groups by InSAR in Batang Section of Jinsha River Convergence Zone, China. J. Earth Sci. Environ. 2021, 43, 398–408. [Google Scholar] [CrossRef]
- Dai, C.; Li, W.; Lu, H.; Yang, F.; Xu, Q.; Jian, J. Active Landslides Detection in Zhouqu County, Gansu Province Using InSAR Technology. Geomat. Inf. Sci. Wuhan Univ. 2021, 46, 994–1002. [Google Scholar] [CrossRef]
- Lu, H.; Li, W.; Xu, Q.; Dong, X.; Dai, C.; Wang, D. Early Detection of Landslides in the Upstream and Downstream Areas of the Baige Landslide, the Jinsha River Based on Optical Remote Sensing and InSAR Technologies. J. Earth Sci. Environ. 2019, 44, 1342–1354. [Google Scholar] [CrossRef]
- Shi, X.; Liao, M.; Li, M.; Zhang, L.; Cunningham, C. Wide-Area Landslide Deformation Mapping with Multi-Path ALOS PALSAR Data Stacks: A Case Study of Three Gorges Area, China. Remote Sens. 2016, 8, 136. [Google Scholar] [CrossRef]
- Crosetto, M.; Monserrat, O.; Cuevas-González, M.; Devanthéry, N.; Crippa, B. Persistent Scatterer Interferometry: A Review. ISPRS J. Photogramm. Remote Sens. 2016, 115, 78–89. [Google Scholar] [CrossRef]
- Zhang, L.; Liao, M.; Dong, J.; Xu, Q.; Gong, J. Early Detection of Landslide Hazards in Mountainous Areas of West China Using Time Series SAR Interferometry—A Case Study of Danba, Sichuan. J. Earth Sci. Environ. 2018, 43, 286–296. [Google Scholar]
- Berardino, P.; Fornaro, G.; Lanari, R.; Sansosti, E. A new algorithm for surface deformation monitoring based on small baseline differential SAR interferograms. IEEE Trans. Geosci. Remote Sens. 2002, 40, 2375–2383. [Google Scholar] [CrossRef]
- Rosin, P.L.; Hervás, J. Remote sensing image thresholding methods for determining landslide activity. Int. J. Remote Sens. 2005, 26, 1075–1092. [Google Scholar] [CrossRef]
- Yu, B.; Chen, F. A new technique for landslide mapping from a large-scale remote sensed image: A case study of Central Nepal. Comput. Geosci. 2017, 100, 115–124. [Google Scholar] [CrossRef]
- Li, Z.; Shi, W.; Lu, P.; Yan, L.; Wang, Q.; Miao, Z. Landslide mapping from aerial photographs using change detection-based Markov random field. Remote Sens. Environ. 2016, 187, 76–90. [Google Scholar] [CrossRef]
- Zhao, W.; Li, A.; Nan, X.; Zhang, Z.; Lei, G. Postearthquake Landslides Mapping From Landsat-8 Data for the 2015 Nepal Earthquake Using a Pixel-Based Change Detection Method. IEEE J. Sel. Top. Appl. Earth Obs. Remote Sens. 2017, 10, 1758–1768. [Google Scholar] [CrossRef]
- Li, C.; Yi, B.; Gao, P.; Li, H.; Sun, J.; Chen, X.; Zhong, C. Valuable Clues for DCNN-Based Landslide Detection from a Com-parative Assessment in the Wenchuan Earthquake Area. Sensors 2021, 21, 5191. [Google Scholar] [CrossRef]
- Ghorbanzadeh, O.; Blaschke, T.; Gholamnia, K.; Sansar, R.M.; Tiede, D.; Aryal, J. Evaluation of different machine learning methods and deep-learning convolutional neural networks for landslide detection. Remote Sens. 2019, 11, 196. [Google Scholar] [CrossRef]
- Sameen, M.I.; Pradhan, B. Landslide detection using residual networks and the fusion of spectral and topographic information. IEEE Access 2019, 7, 114363–114373. [Google Scholar] [CrossRef]
- Ji, S.; Yu, D.; Shen, C.; Li, W.; Xu, Q. Landslide detection from an open satellite imagery and digital elevation model dataset using attention boosted convolutional neural networks. Landslides 2020, 17, 1337–1352. [Google Scholar] [CrossRef]
- Prakash, N.; Manconi, A.; Loew, S. Mapping Landslides on EO Data: Performance of Deep Learning Models vs. Traditional Machine Learning Models. Remote Sens. 2020, 12, 346. [Google Scholar] [CrossRef]
- Yi, Y.; Zhang, W. A New Deep-Learning-Based Approach for Earthquake-Triggered Landslide Detection From Single-Temporal RapidEye Satellite Imagery. IEEE J. Sel. Top. Appl. Earth Obs. Remote Sens. 2020, 13, 6166–6176. [Google Scholar] [CrossRef]
- Shi, W.; Zhang, M.; Ke, H.; Fang, X.; Zhan, Z.; Chen, S. Landslide Recognition by Deep Convolutional Neural Network and Change Detection. IEEE Trans. Geosci. Remote Sens. 2020, 59, 4654–4672. [Google Scholar] [CrossRef]
- Ullo, S.L.; Mohan, A.; Sebastianelli, A.; Ahamed, S.E.; Kumar, B.; Dwivedi, R.; Sinha, G.R. A new mask R-CNN-based method for improved landslide detection. IEEE J. Sel. Top. Appl. Earth Obs. Remote Sens. 2021, 14, 3799–3810. [Google Scholar] [CrossRef]
- Cotecchia, F.; Santaloia, F.; Tagarelli, V. Towards a geo-hydro-mechanical characterization of landslide classes: Preliminary results. Appl. Sci. 2020, 10, 7960. [Google Scholar] [CrossRef]
- Pepe, A.; Euillades, L.D.; Manunta, M.; Lanari, R. New advances of the extended minimum cost flow phase unwrapping algorithm for SBAS-DInSAR analysis at full spatial resolution. IEEE Trans. Geosci. Remote Sens. 2011, 49, 4062–4079. [Google Scholar] [CrossRef]
- Sandwell, D.T.; Mellors, R.J.; Tong, X.; Wei, M.; Wessel, P. Open radar interferometry software for mapping surface Deformation. Eos 2011, 92, 234. [Google Scholar] [CrossRef]
- Sandwell, D.; Mellors, R.; Tong, X.; Wei, M.; Wessel, P. GMTSAR: An InSAR Processing System Based on Generic Mapping Tools; UC San Diego, Scripps Institution of Oceanography: San Diego, CA, USA, 2011. [Google Scholar] [CrossRef]
- Zhong, C.; Liu, Y.; Gao, P.; Chen, W.; Li, H.; Hou, Y.; Nuremanguli, T.; Ma, H. Landslide mapping with remote sensing: Challenges and opportunities. Int. J. Remote Sens. 2019, 41, 1555–1581. [Google Scholar] [CrossRef]
- Zhong, C.; Li, C.; Gao, P.; Li, H. Discovering Vegetation Recovery and Landslide Activities in the Wenchuan Earthquake Area with Landsat Imagery. Sensors 2021, 21, 5243. [Google Scholar] [CrossRef]
- Guirado, E.; Tabik, S.; Alcaraz-Segura, D.; Cabello, J.; Herrera, F. Deep-learning convolutional neural networks for scattered shrub detection with google earth imagery. arXiv 2017, arXiv:1706.00917. [Google Scholar]
- Lin, Q.; Liu, Y.; Liu, L.; Wang, Y. Earthquake-triggered landslide susceptibility assessment based on support vector machine combined with Newmark displacement model. J. Geo-Inf. Sci. 2017, 19, 1623–1633. [Google Scholar] [CrossRef]


Publisher’s Note: MDPI stays neutral with regard to jurisdictional claims in published maps and institutional affiliations. |
© 2022 by the authors. Licensee MDPI, Basel, Switzerland. This article is an open access article distributed under the terms and conditions of the Creative Commons Attribution (CC BY) license (https://creativecommons.org/licenses/by/4.0/).
Share and Cite
Guo, H.; Yi, B.; Yao, Q.; Gao, P.; Li, H.; Sun, J.; Zhong, C. Identification of Landslides in Mountainous Area with the Combination of SBAS-InSAR and Yolo Model. Sensors 2022, 22, 6235. https://doi.org/10.3390/s22166235
Guo H, Yi B, Yao Q, Gao P, Li H, Sun J, Zhong C. Identification of Landslides in Mountainous Area with the Combination of SBAS-InSAR and Yolo Model. Sensors. 2022; 22(16):6235. https://doi.org/10.3390/s22166235
Chicago/Turabian StyleGuo, Haojia, Bangjin Yi, Qianxiang Yao, Peng Gao, Hui Li, Jixing Sun, and Cheng Zhong. 2022. "Identification of Landslides in Mountainous Area with the Combination of SBAS-InSAR and Yolo Model" Sensors 22, no. 16: 6235. https://doi.org/10.3390/s22166235
APA StyleGuo, H., Yi, B., Yao, Q., Gao, P., Li, H., Sun, J., & Zhong, C. (2022). Identification of Landslides in Mountainous Area with the Combination of SBAS-InSAR and Yolo Model. Sensors, 22(16), 6235. https://doi.org/10.3390/s22166235