
Agreement of Sleep Measures—A Comparison between a Sleep Diary and Three Consumer Wearable Devices


Abstract
:1. Introduction
2. Materials and Methods
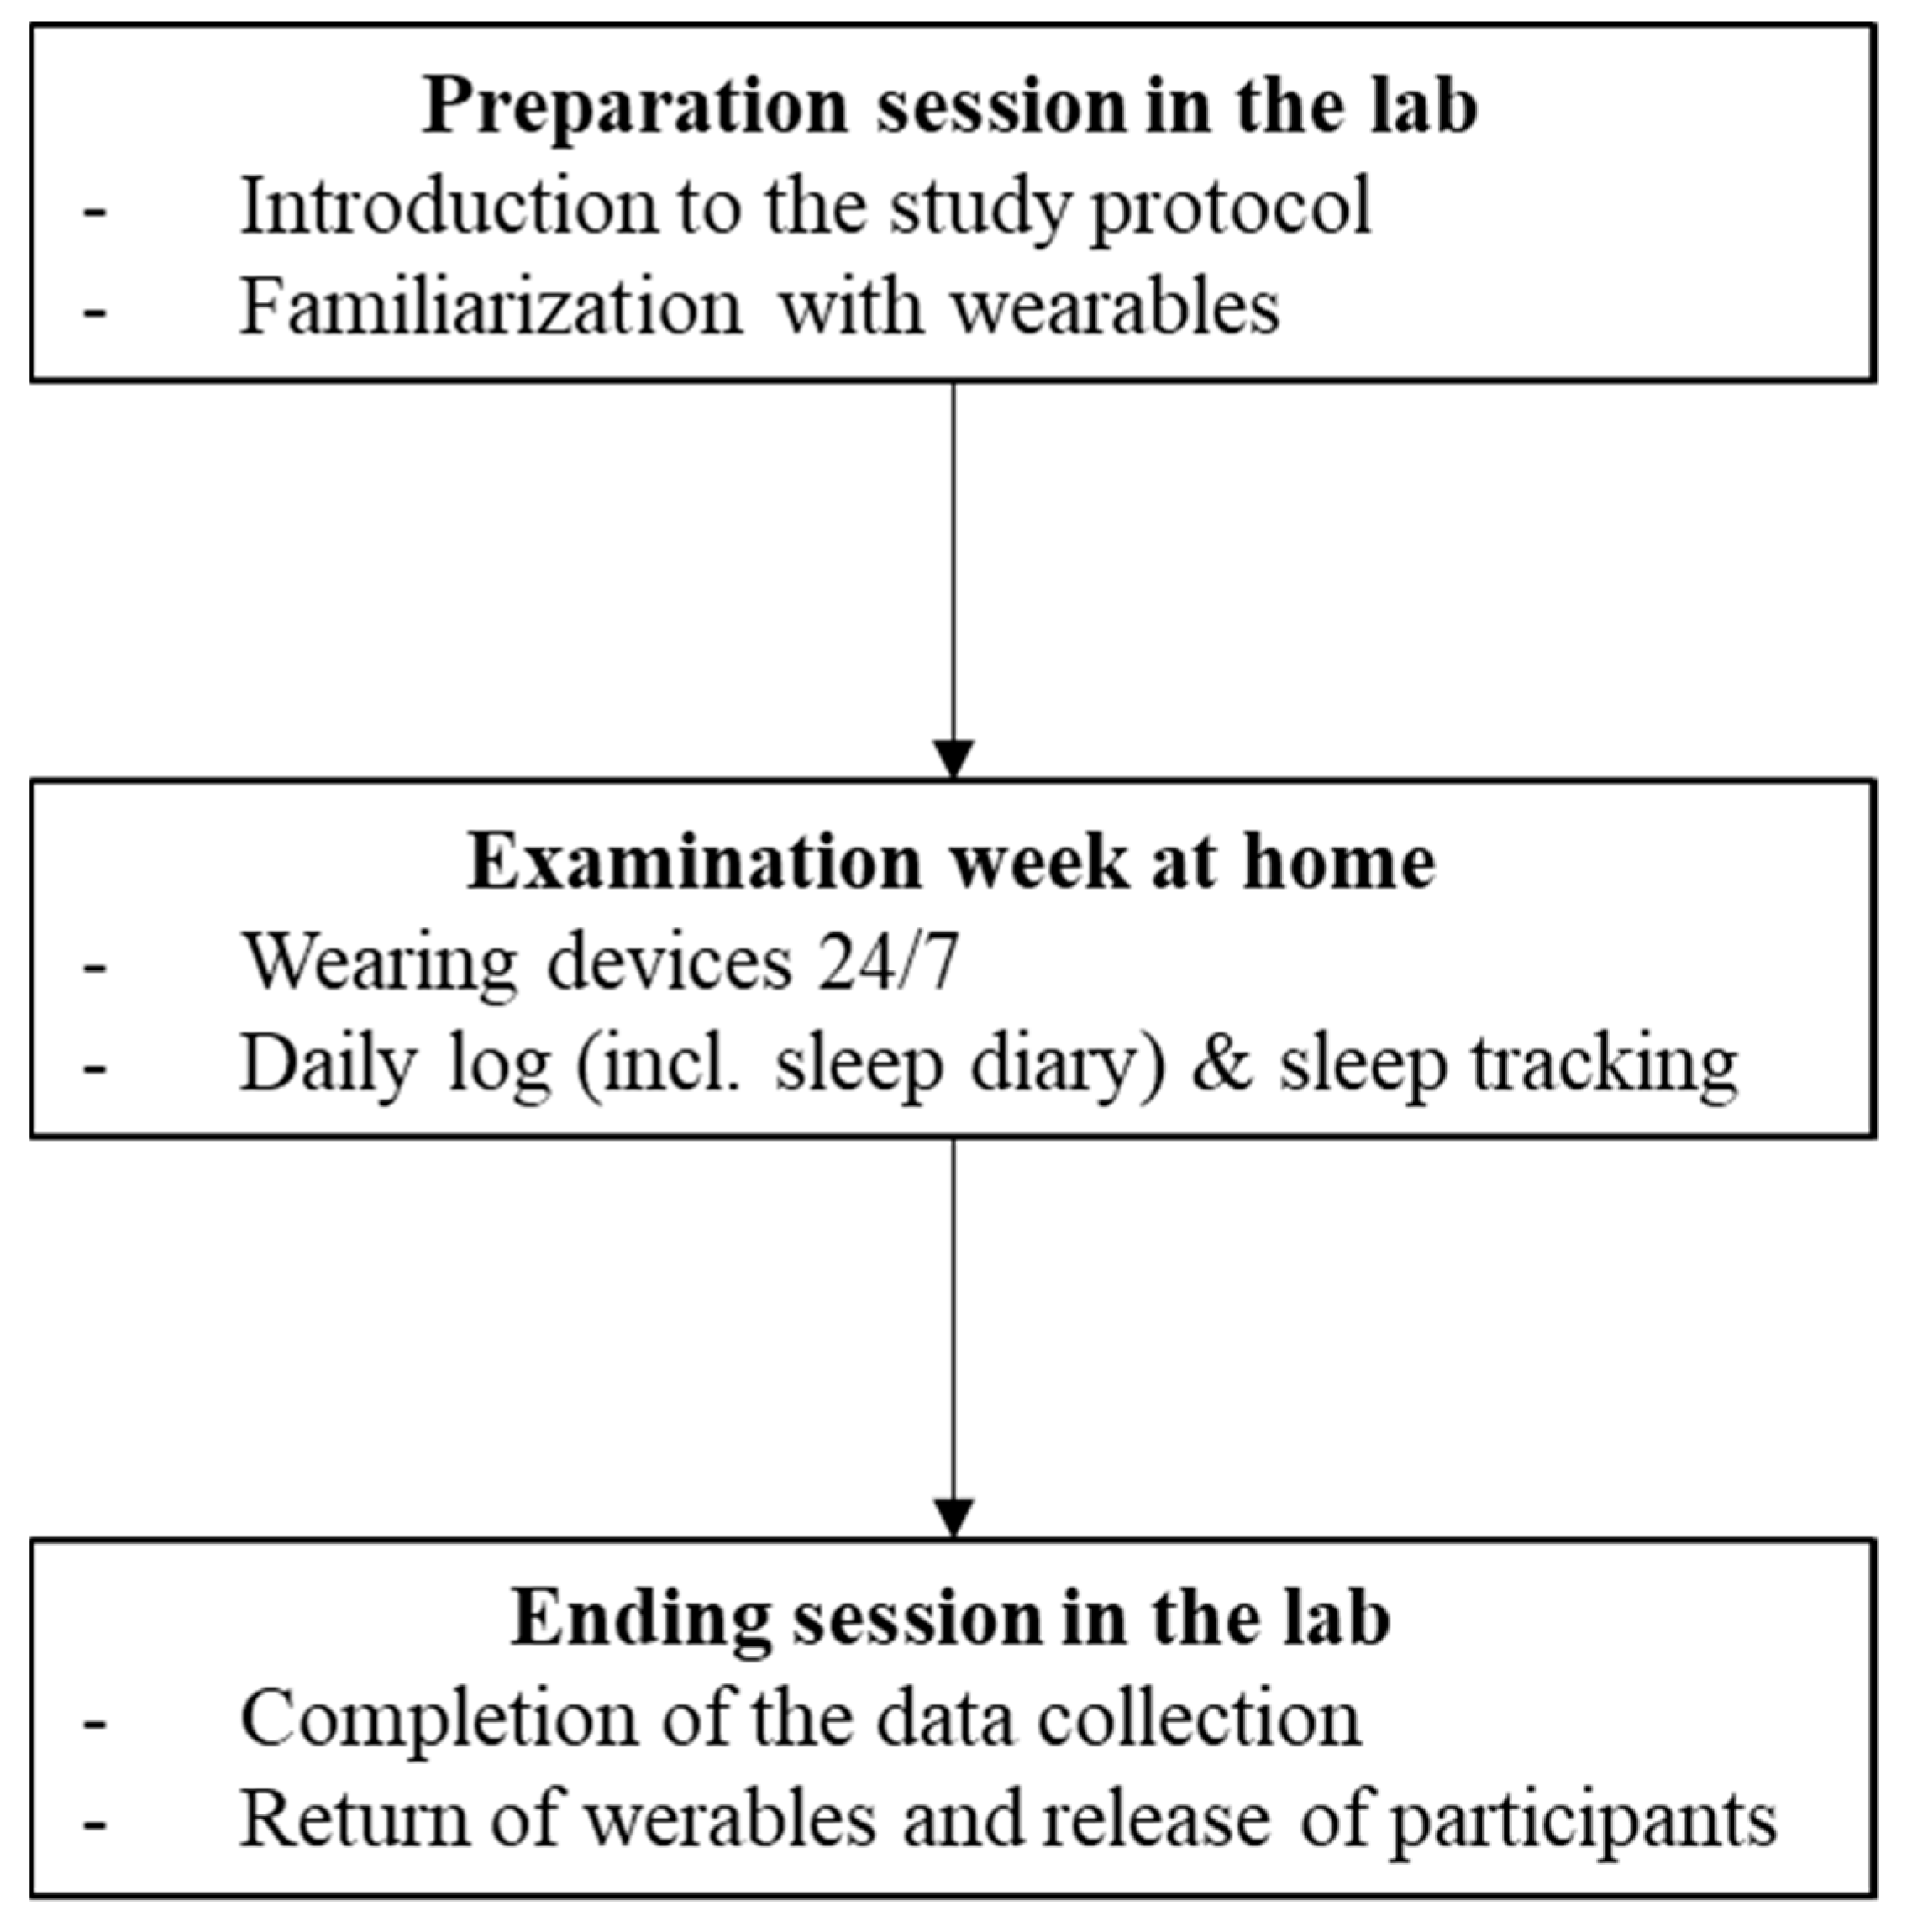
2.1. Study Conception and Procedure
2.2. Participants
2.3. Materials
2.4. Data Analysis
3. Results
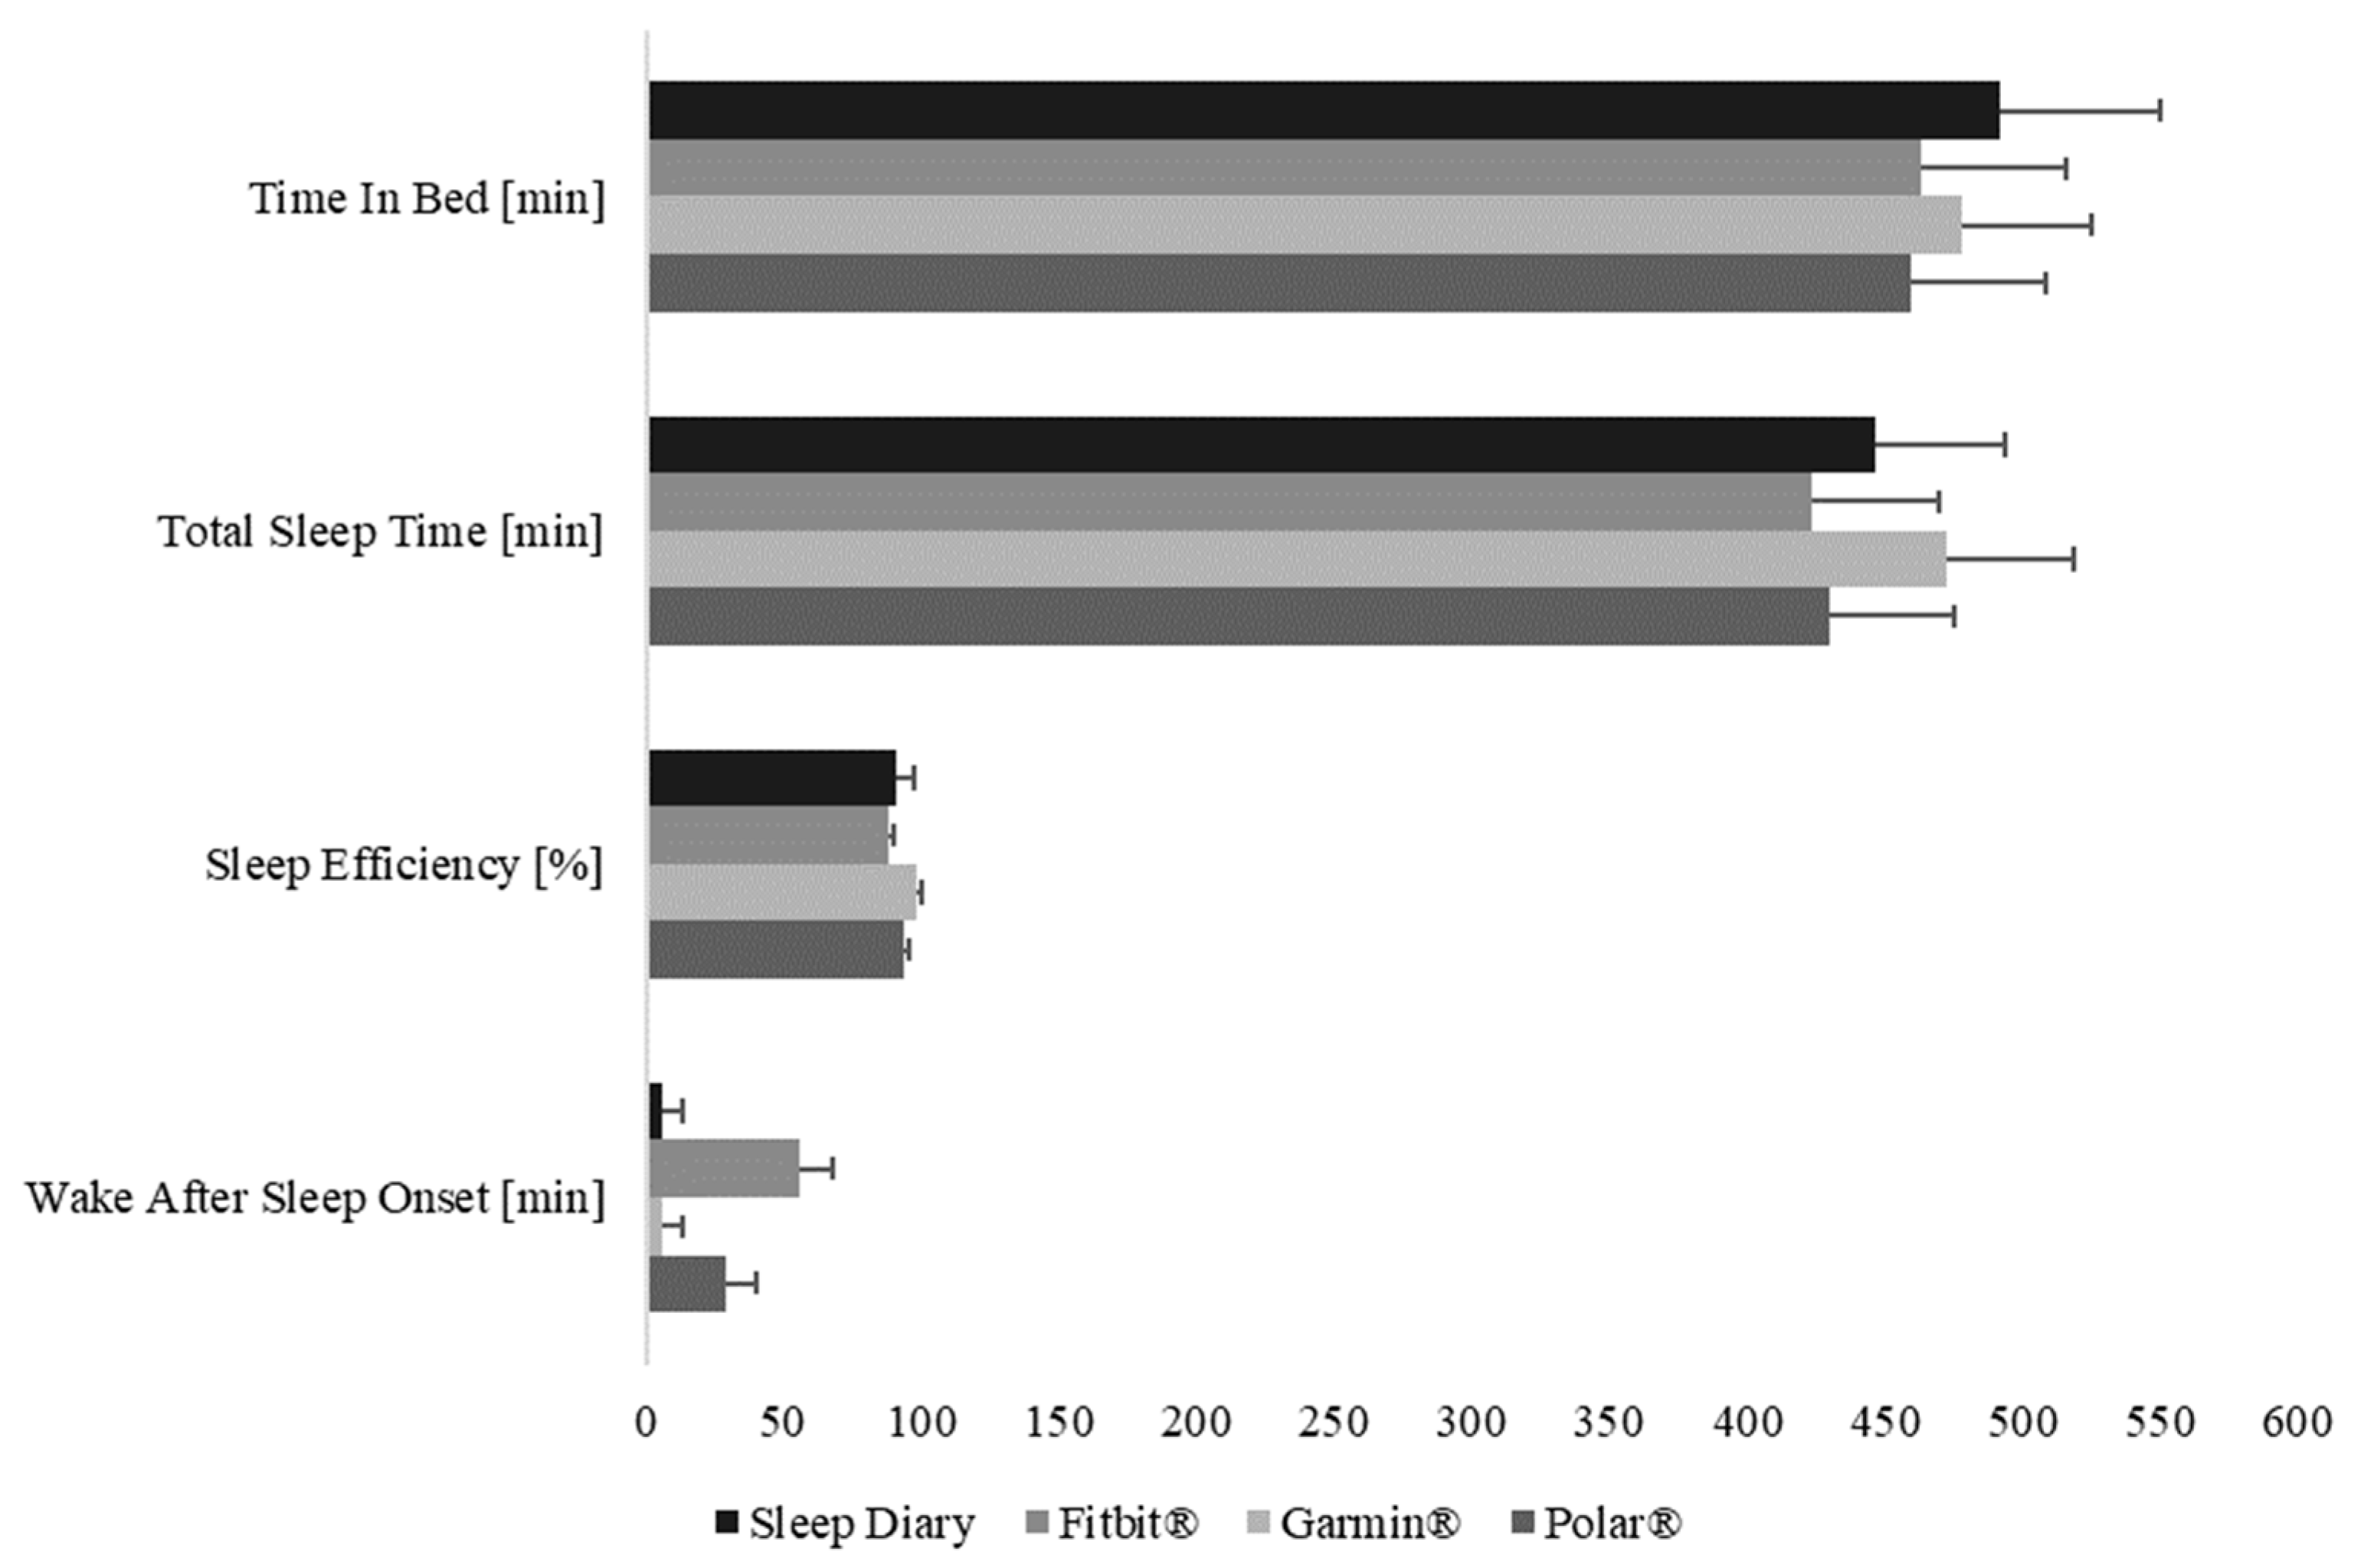
3.1. Descriptives
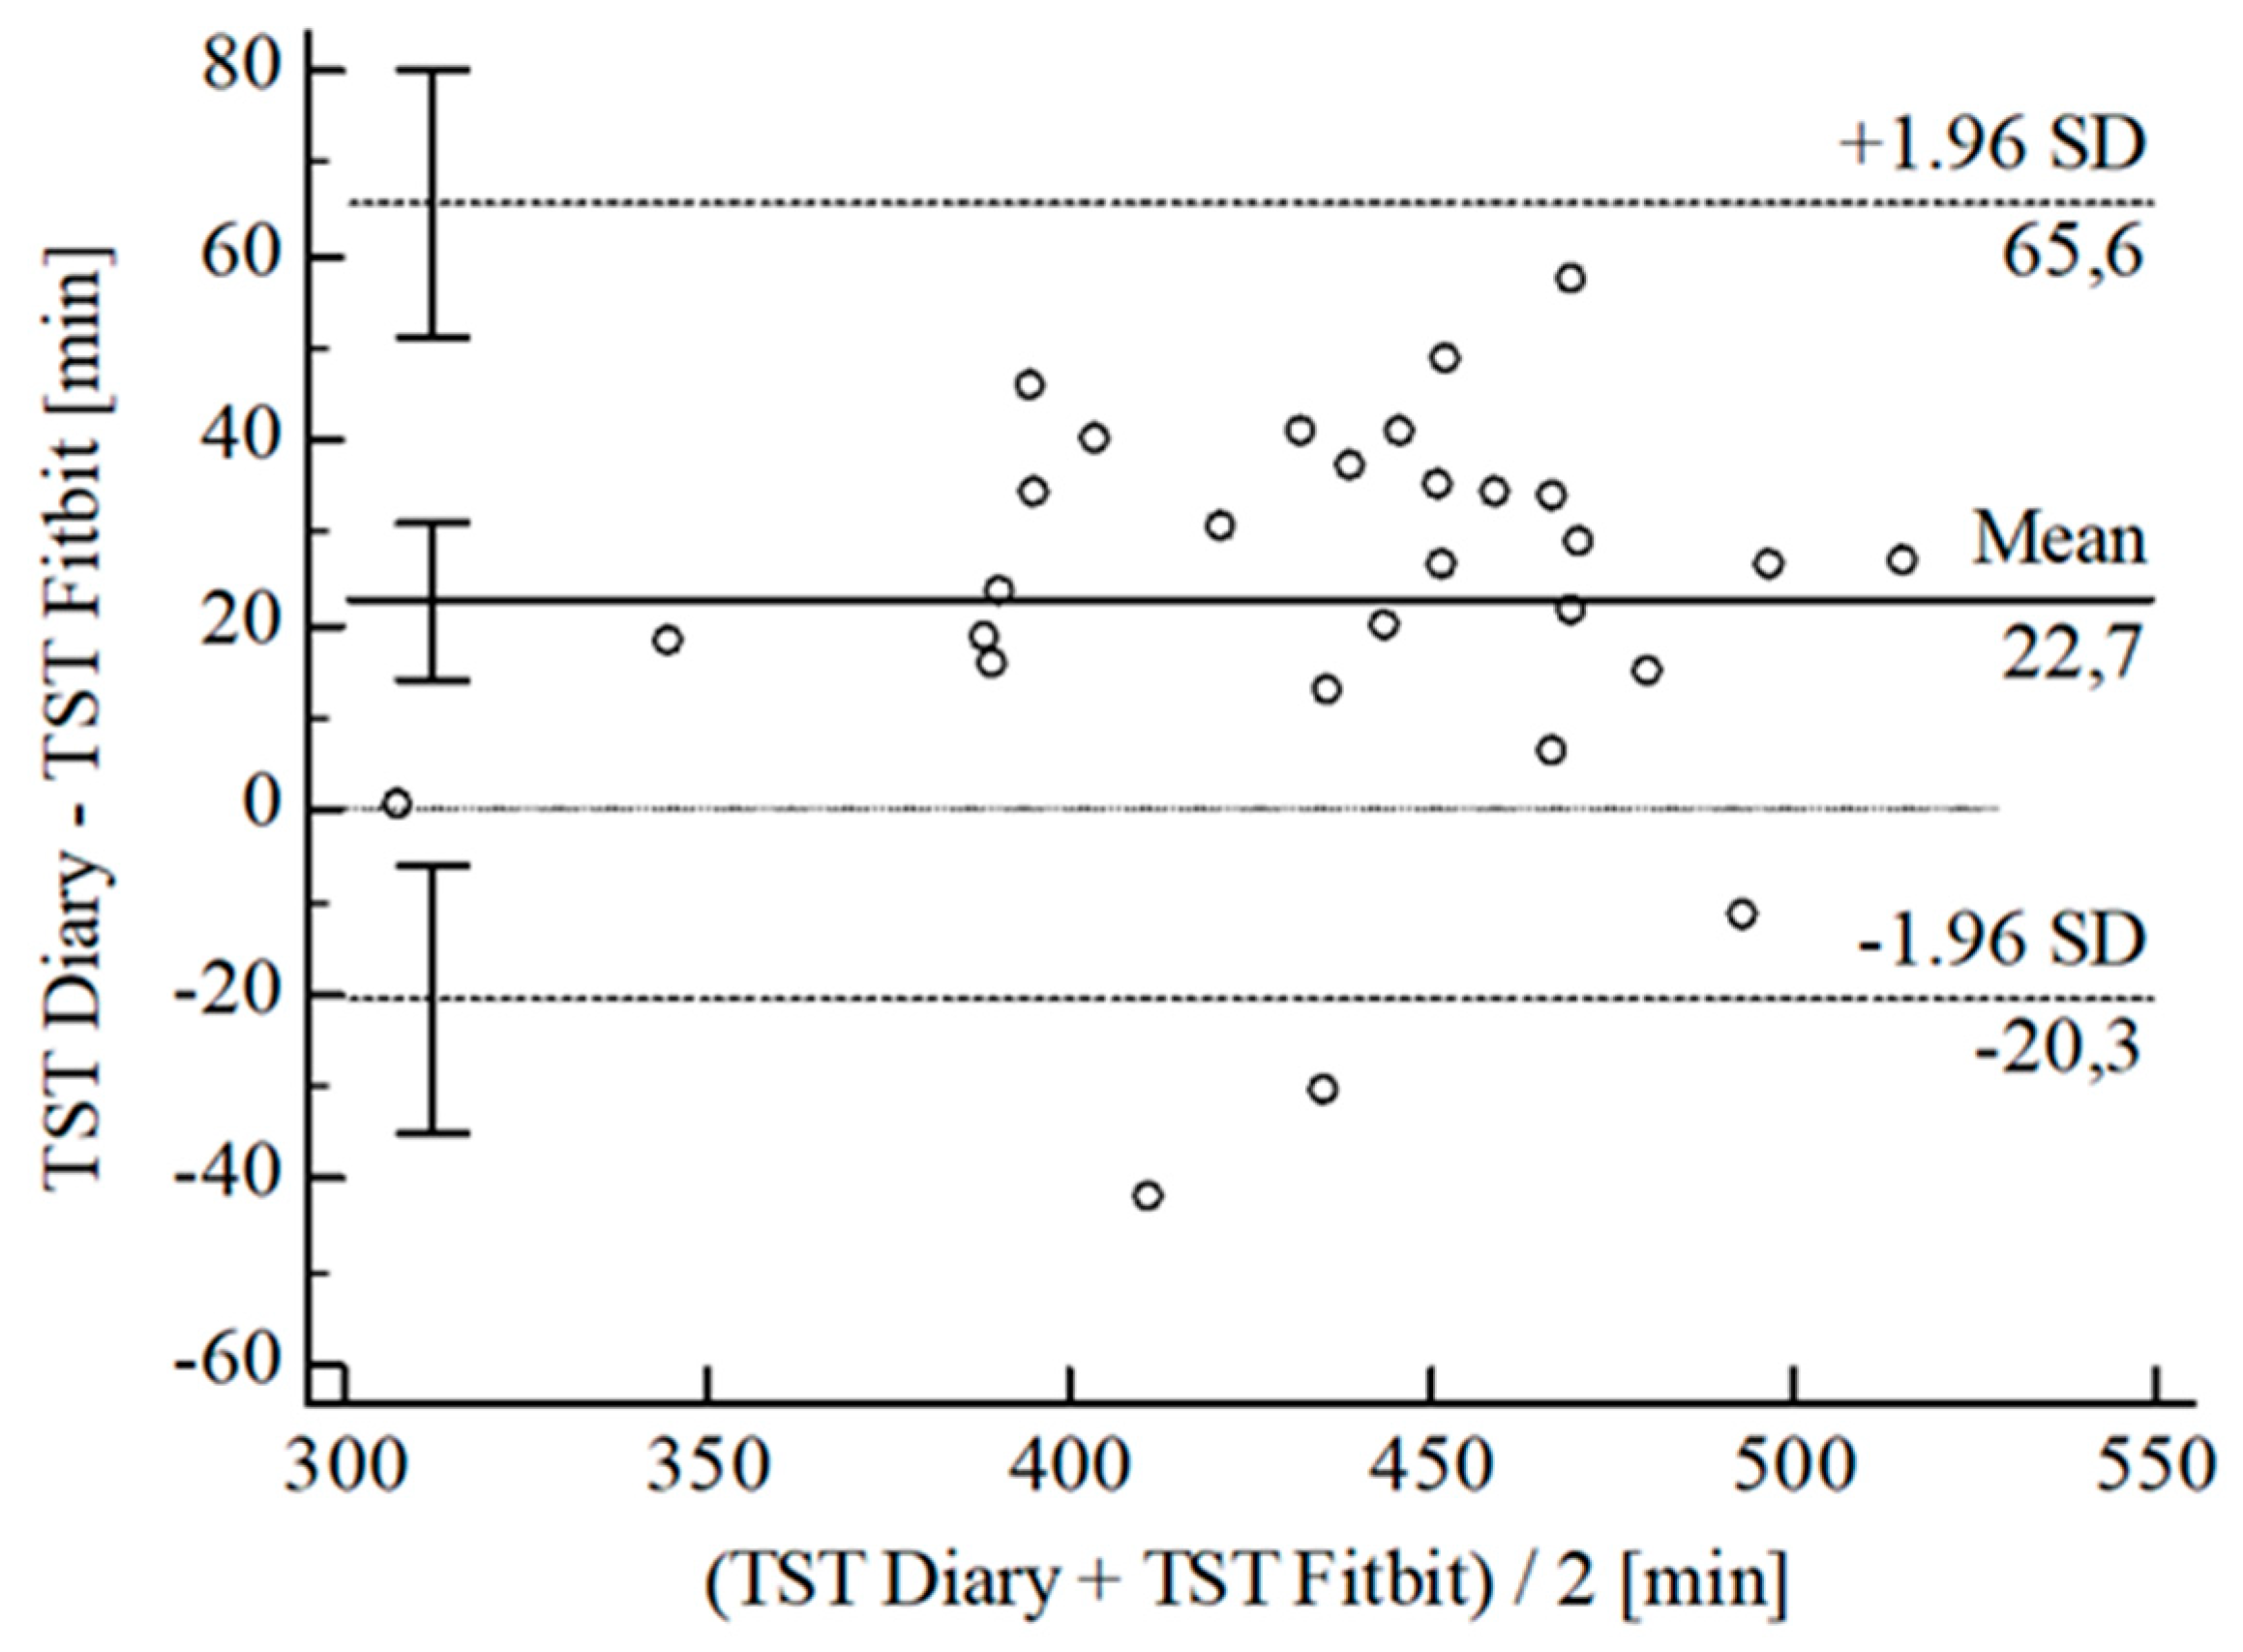
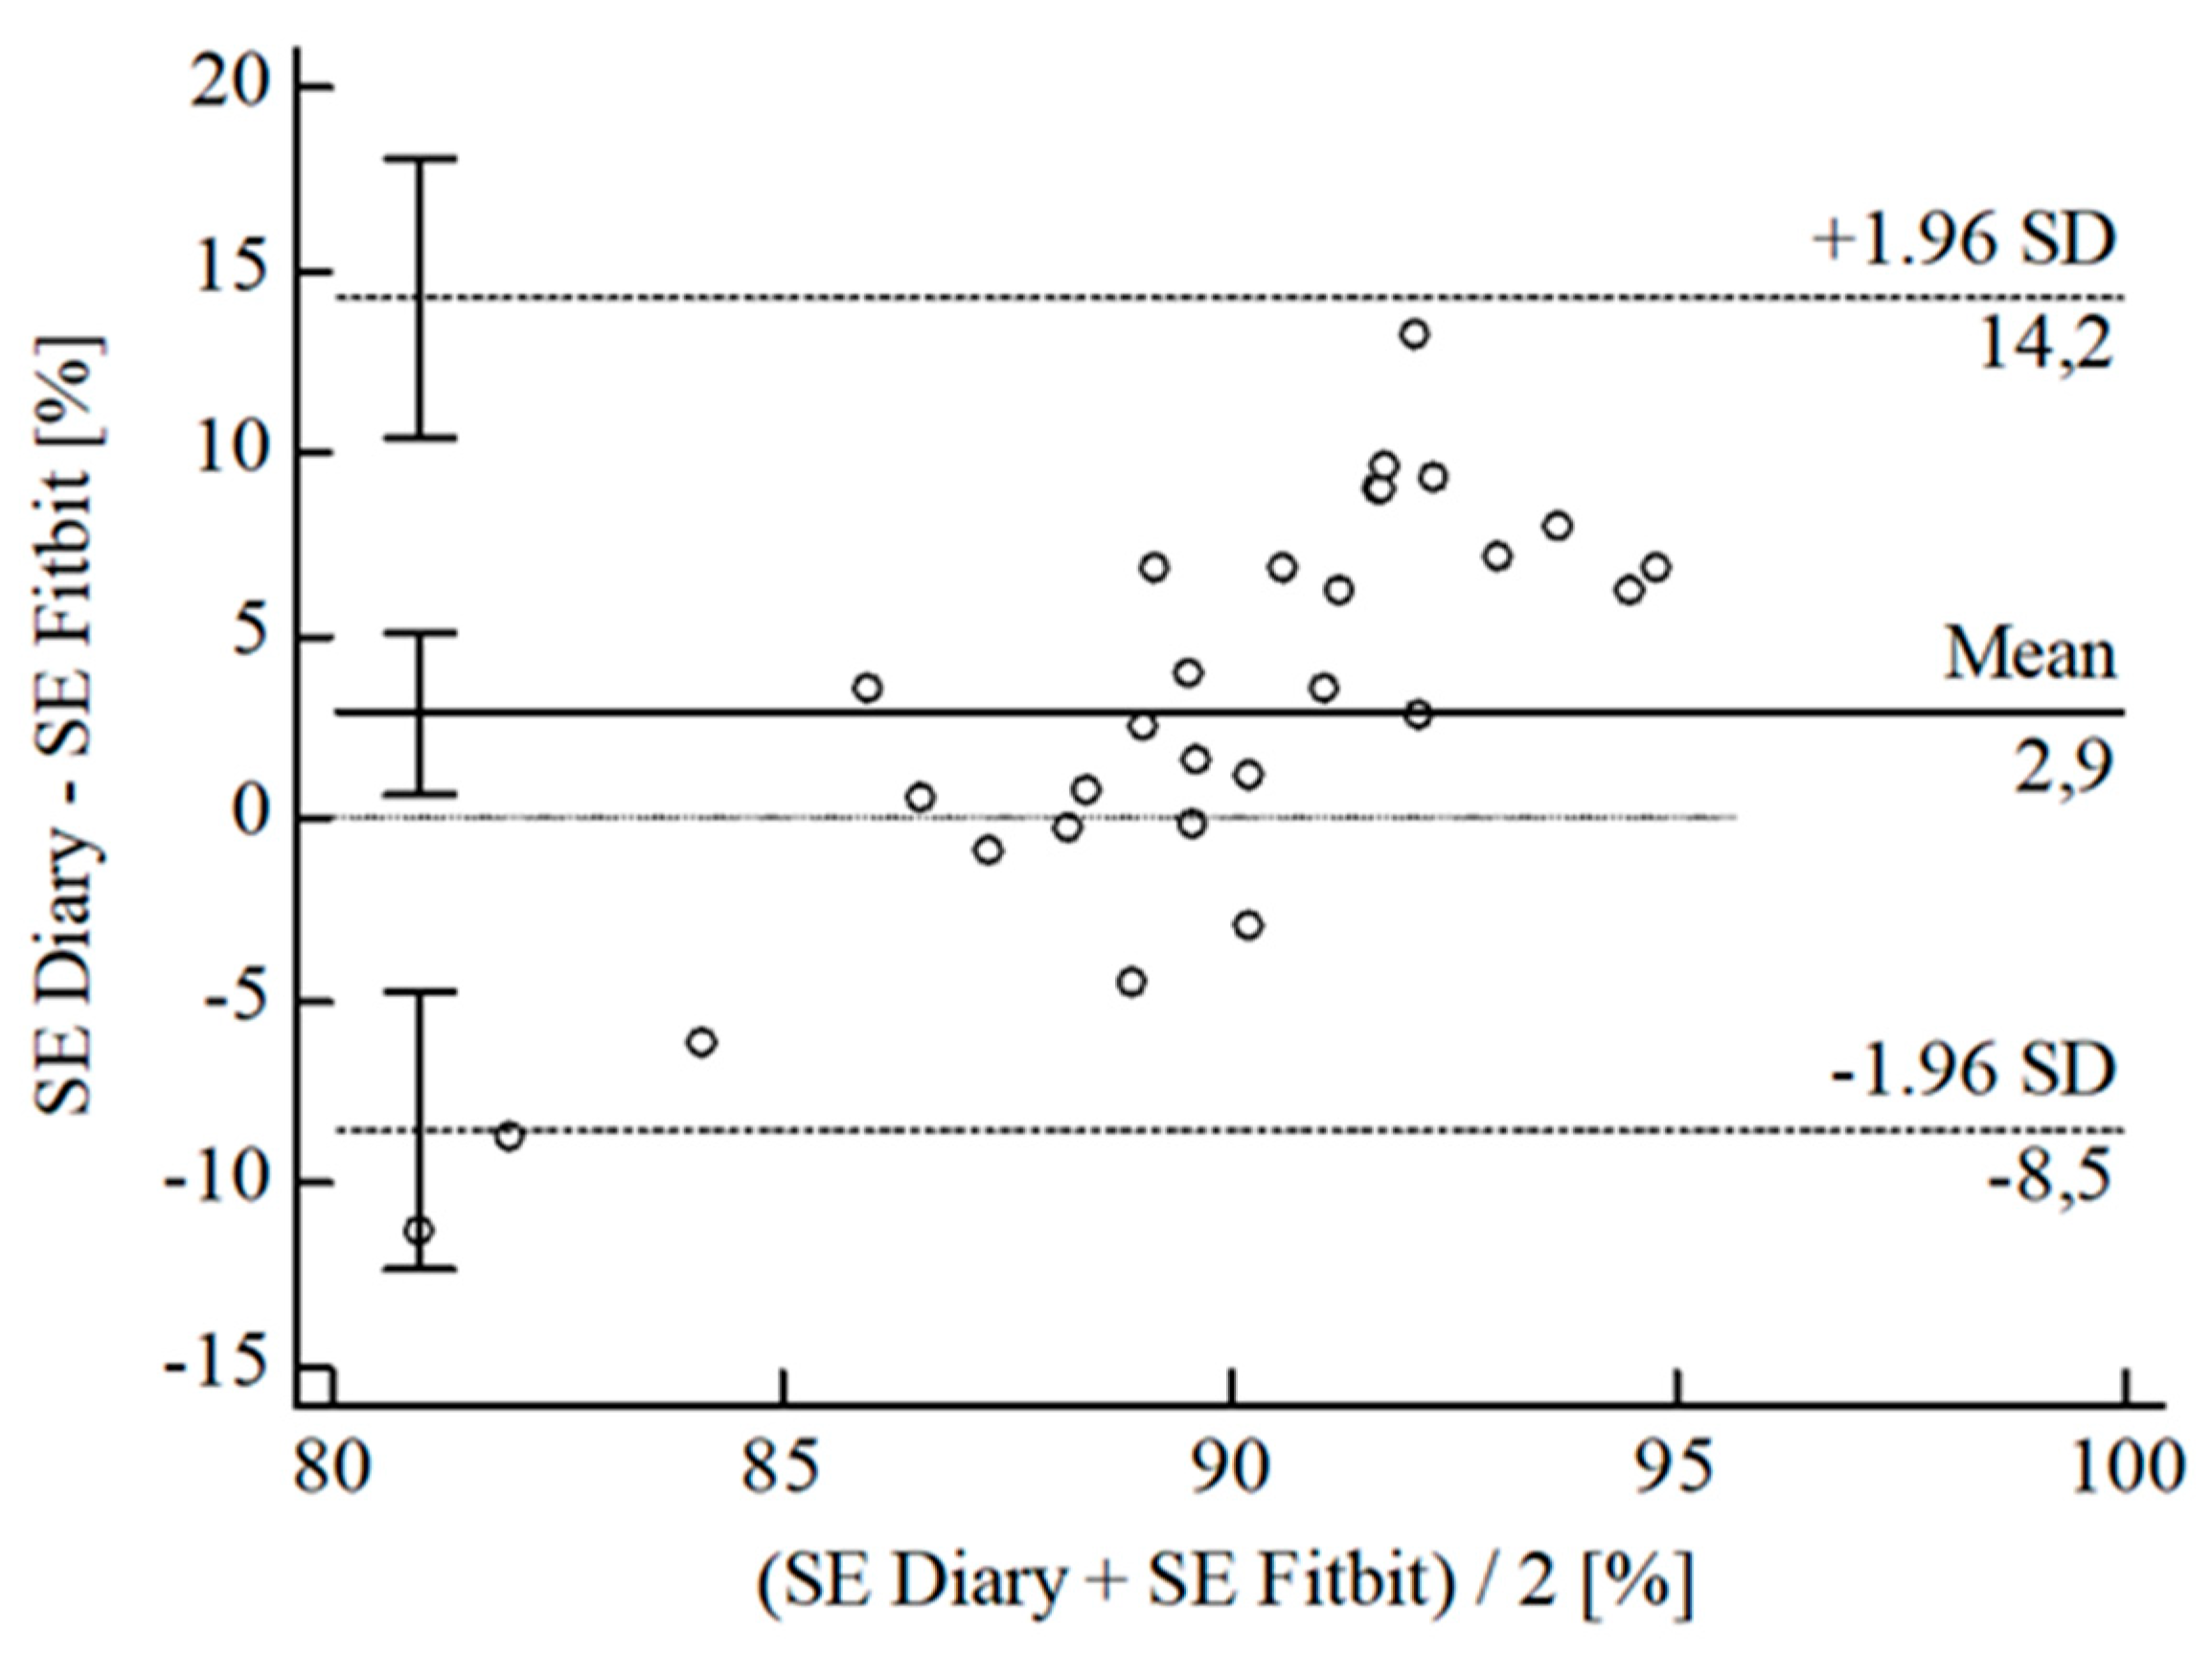
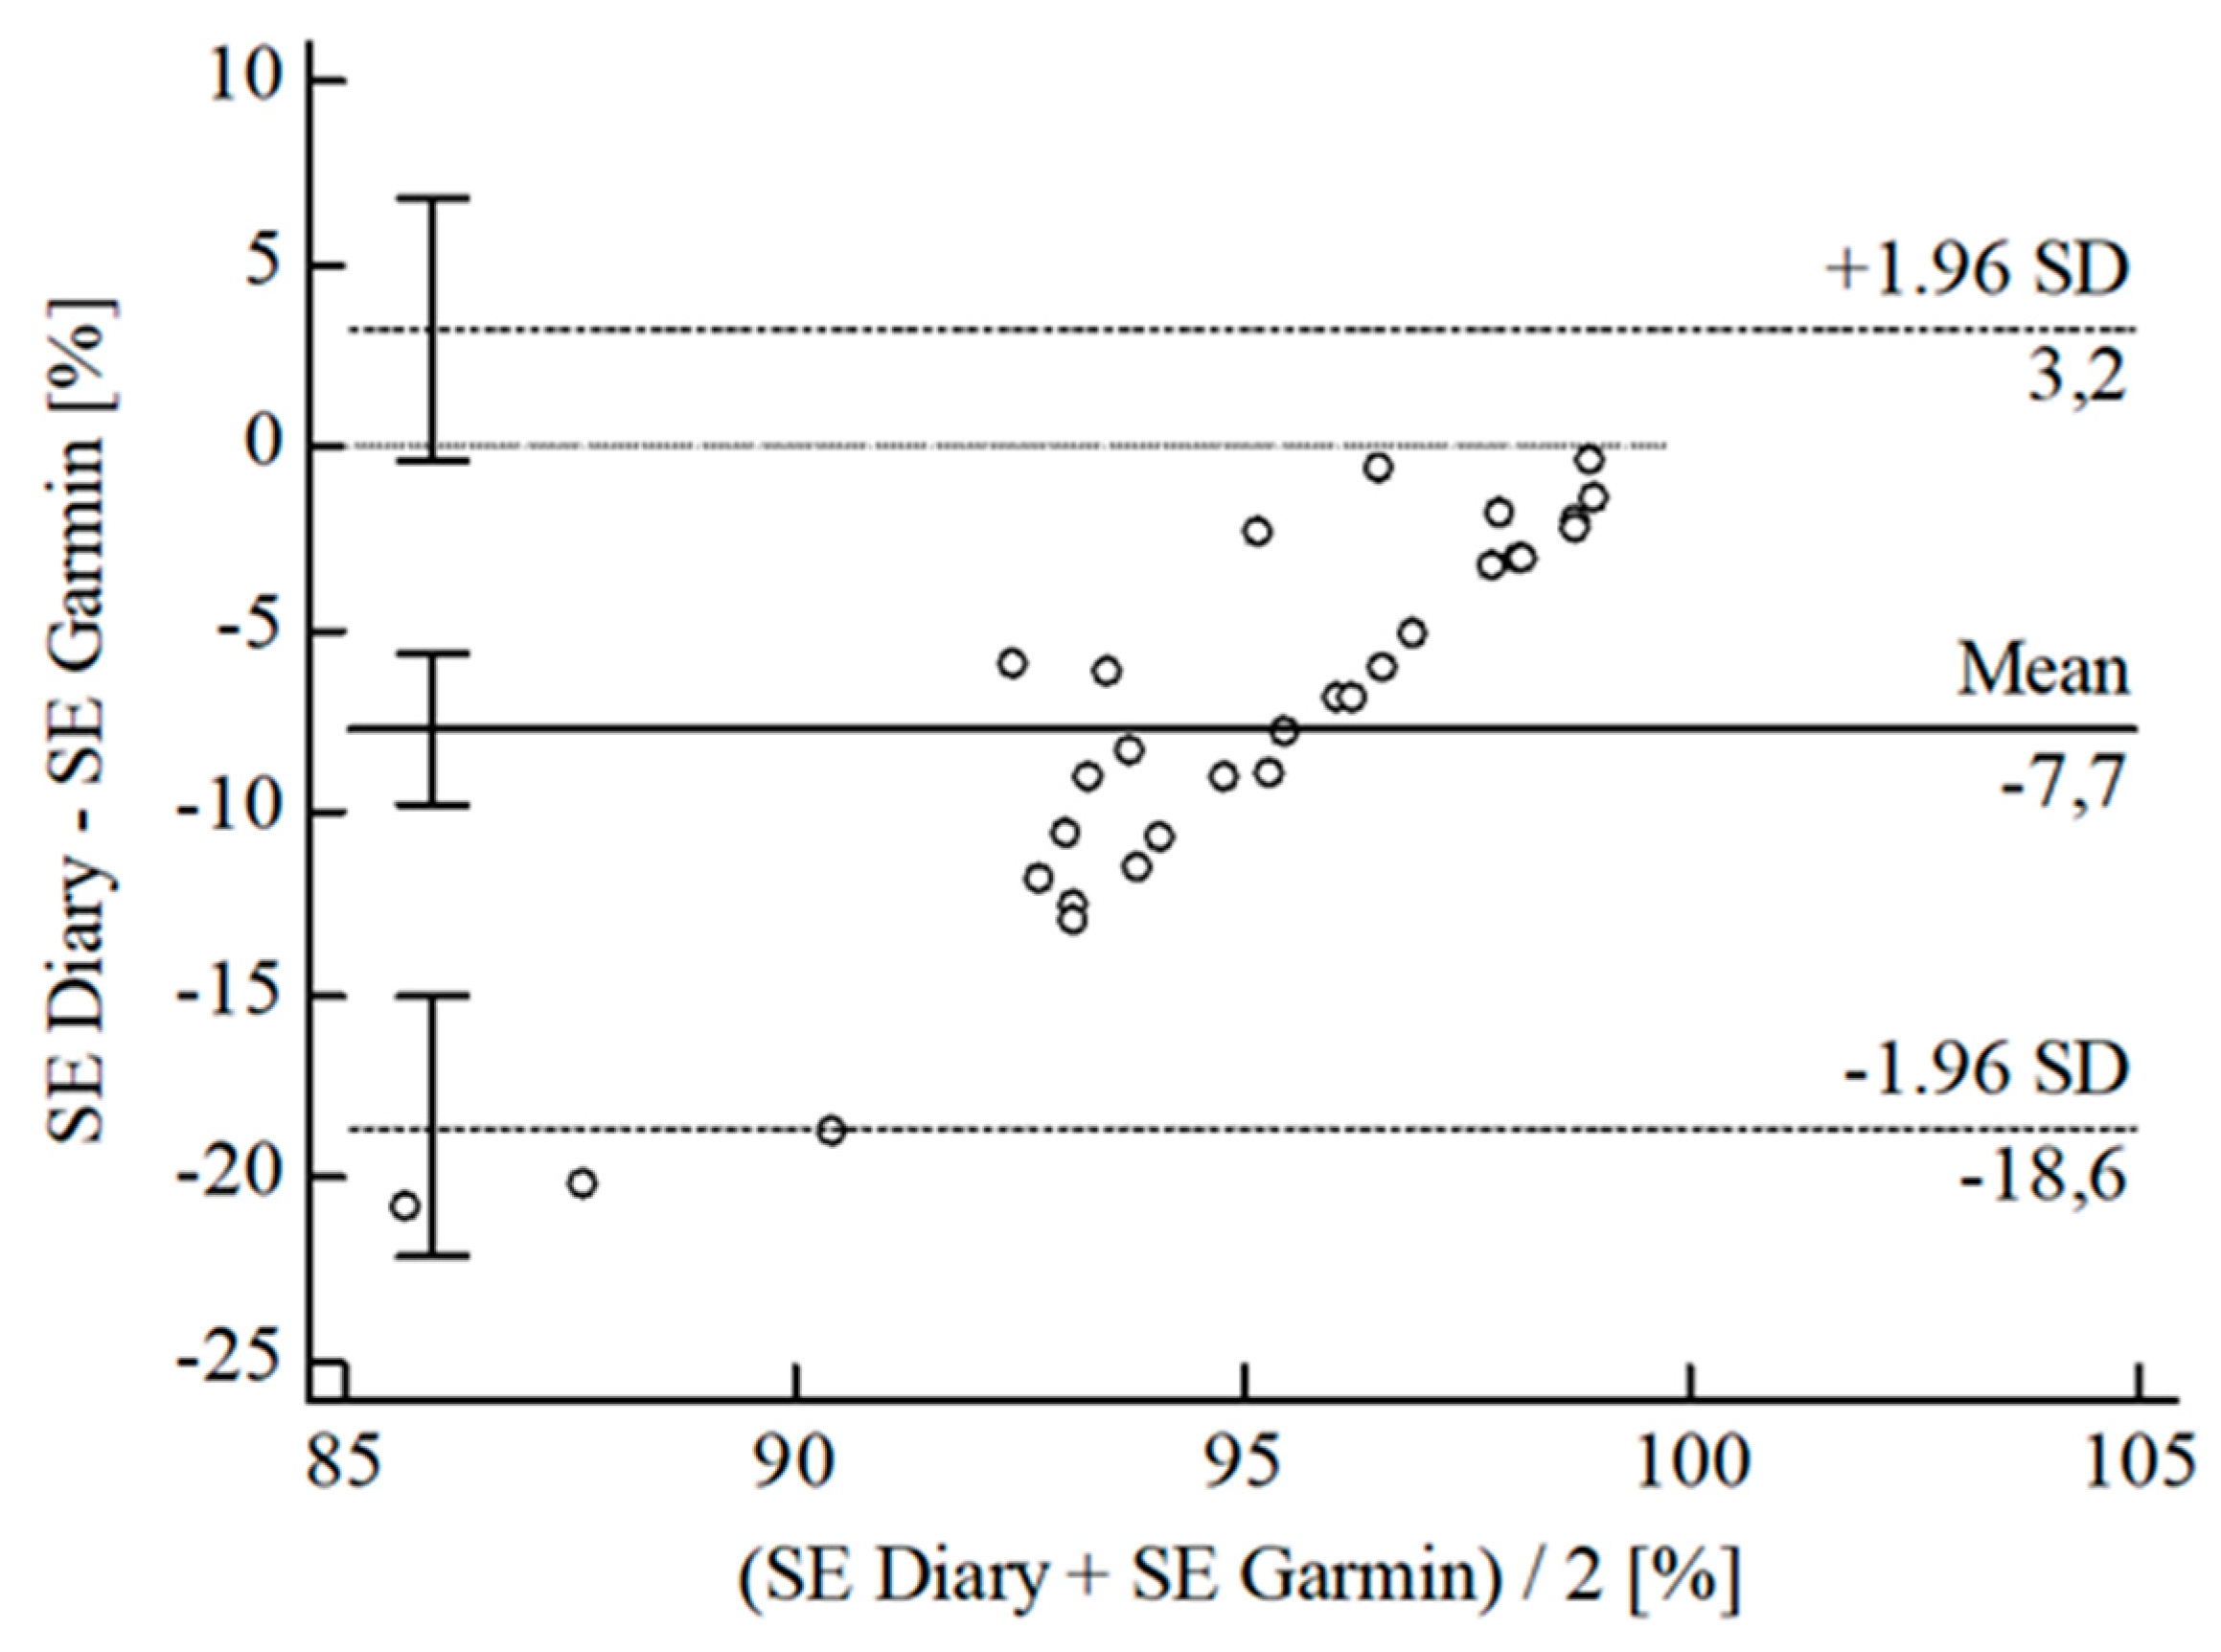
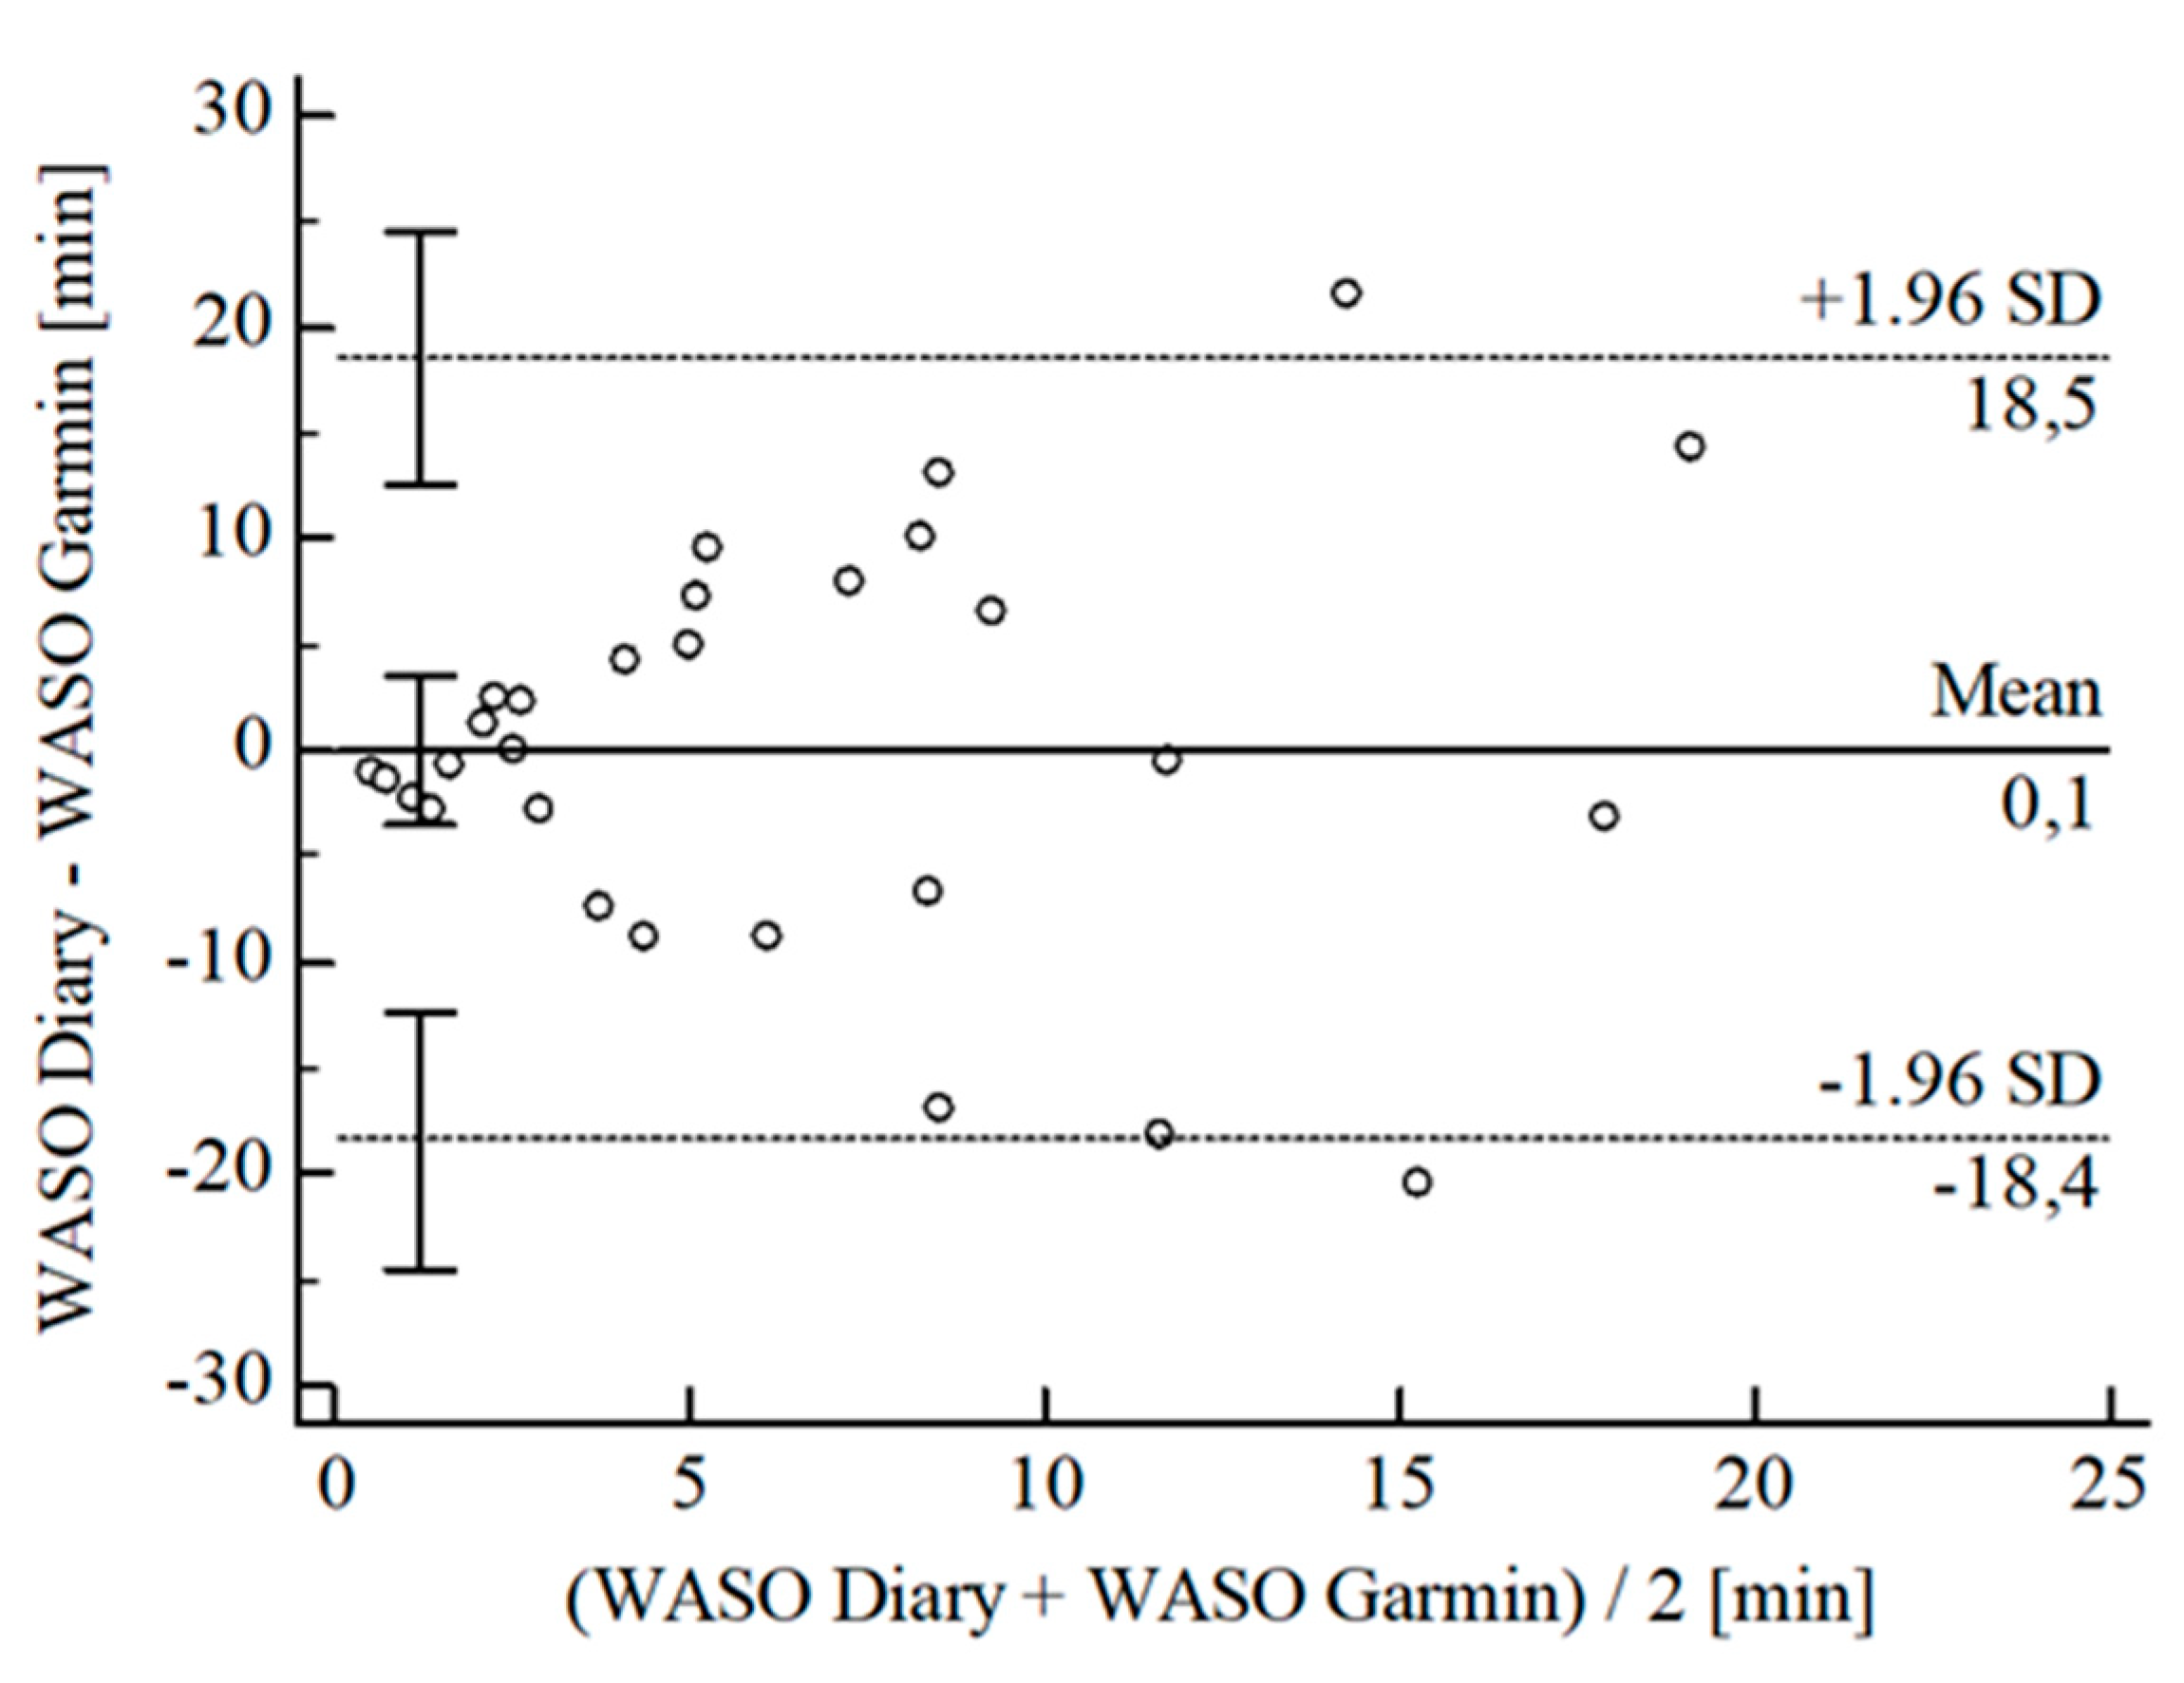
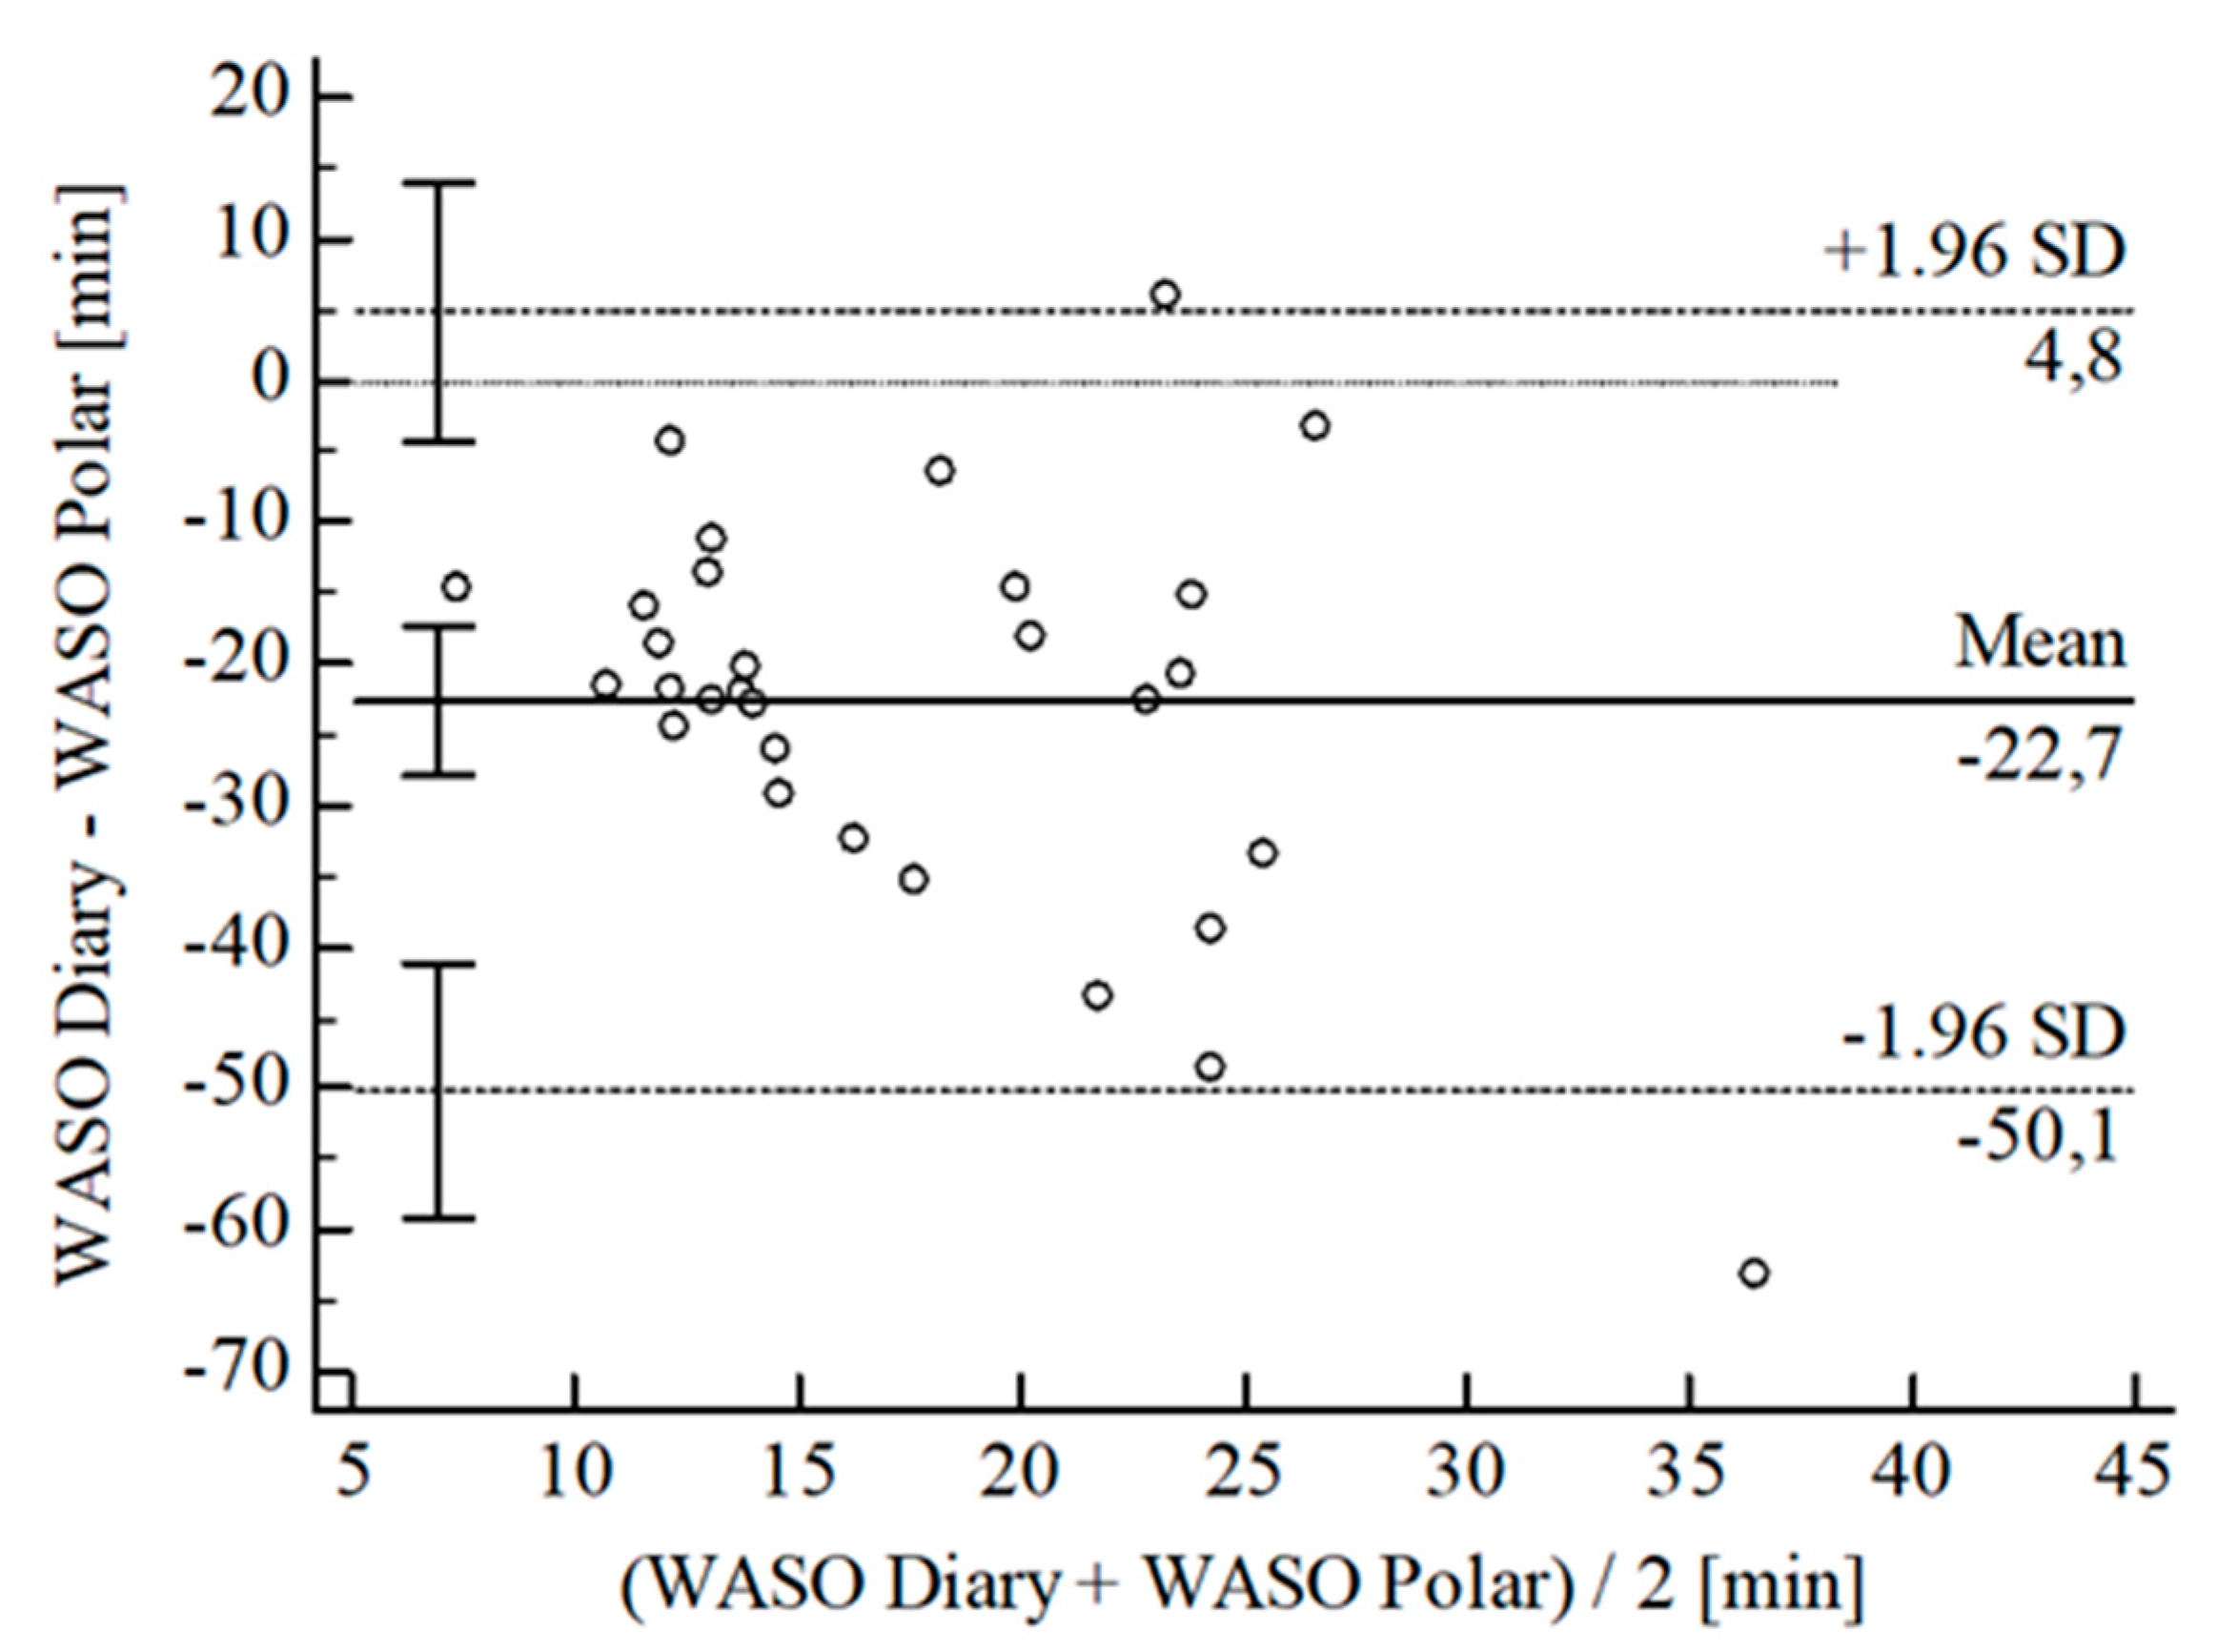
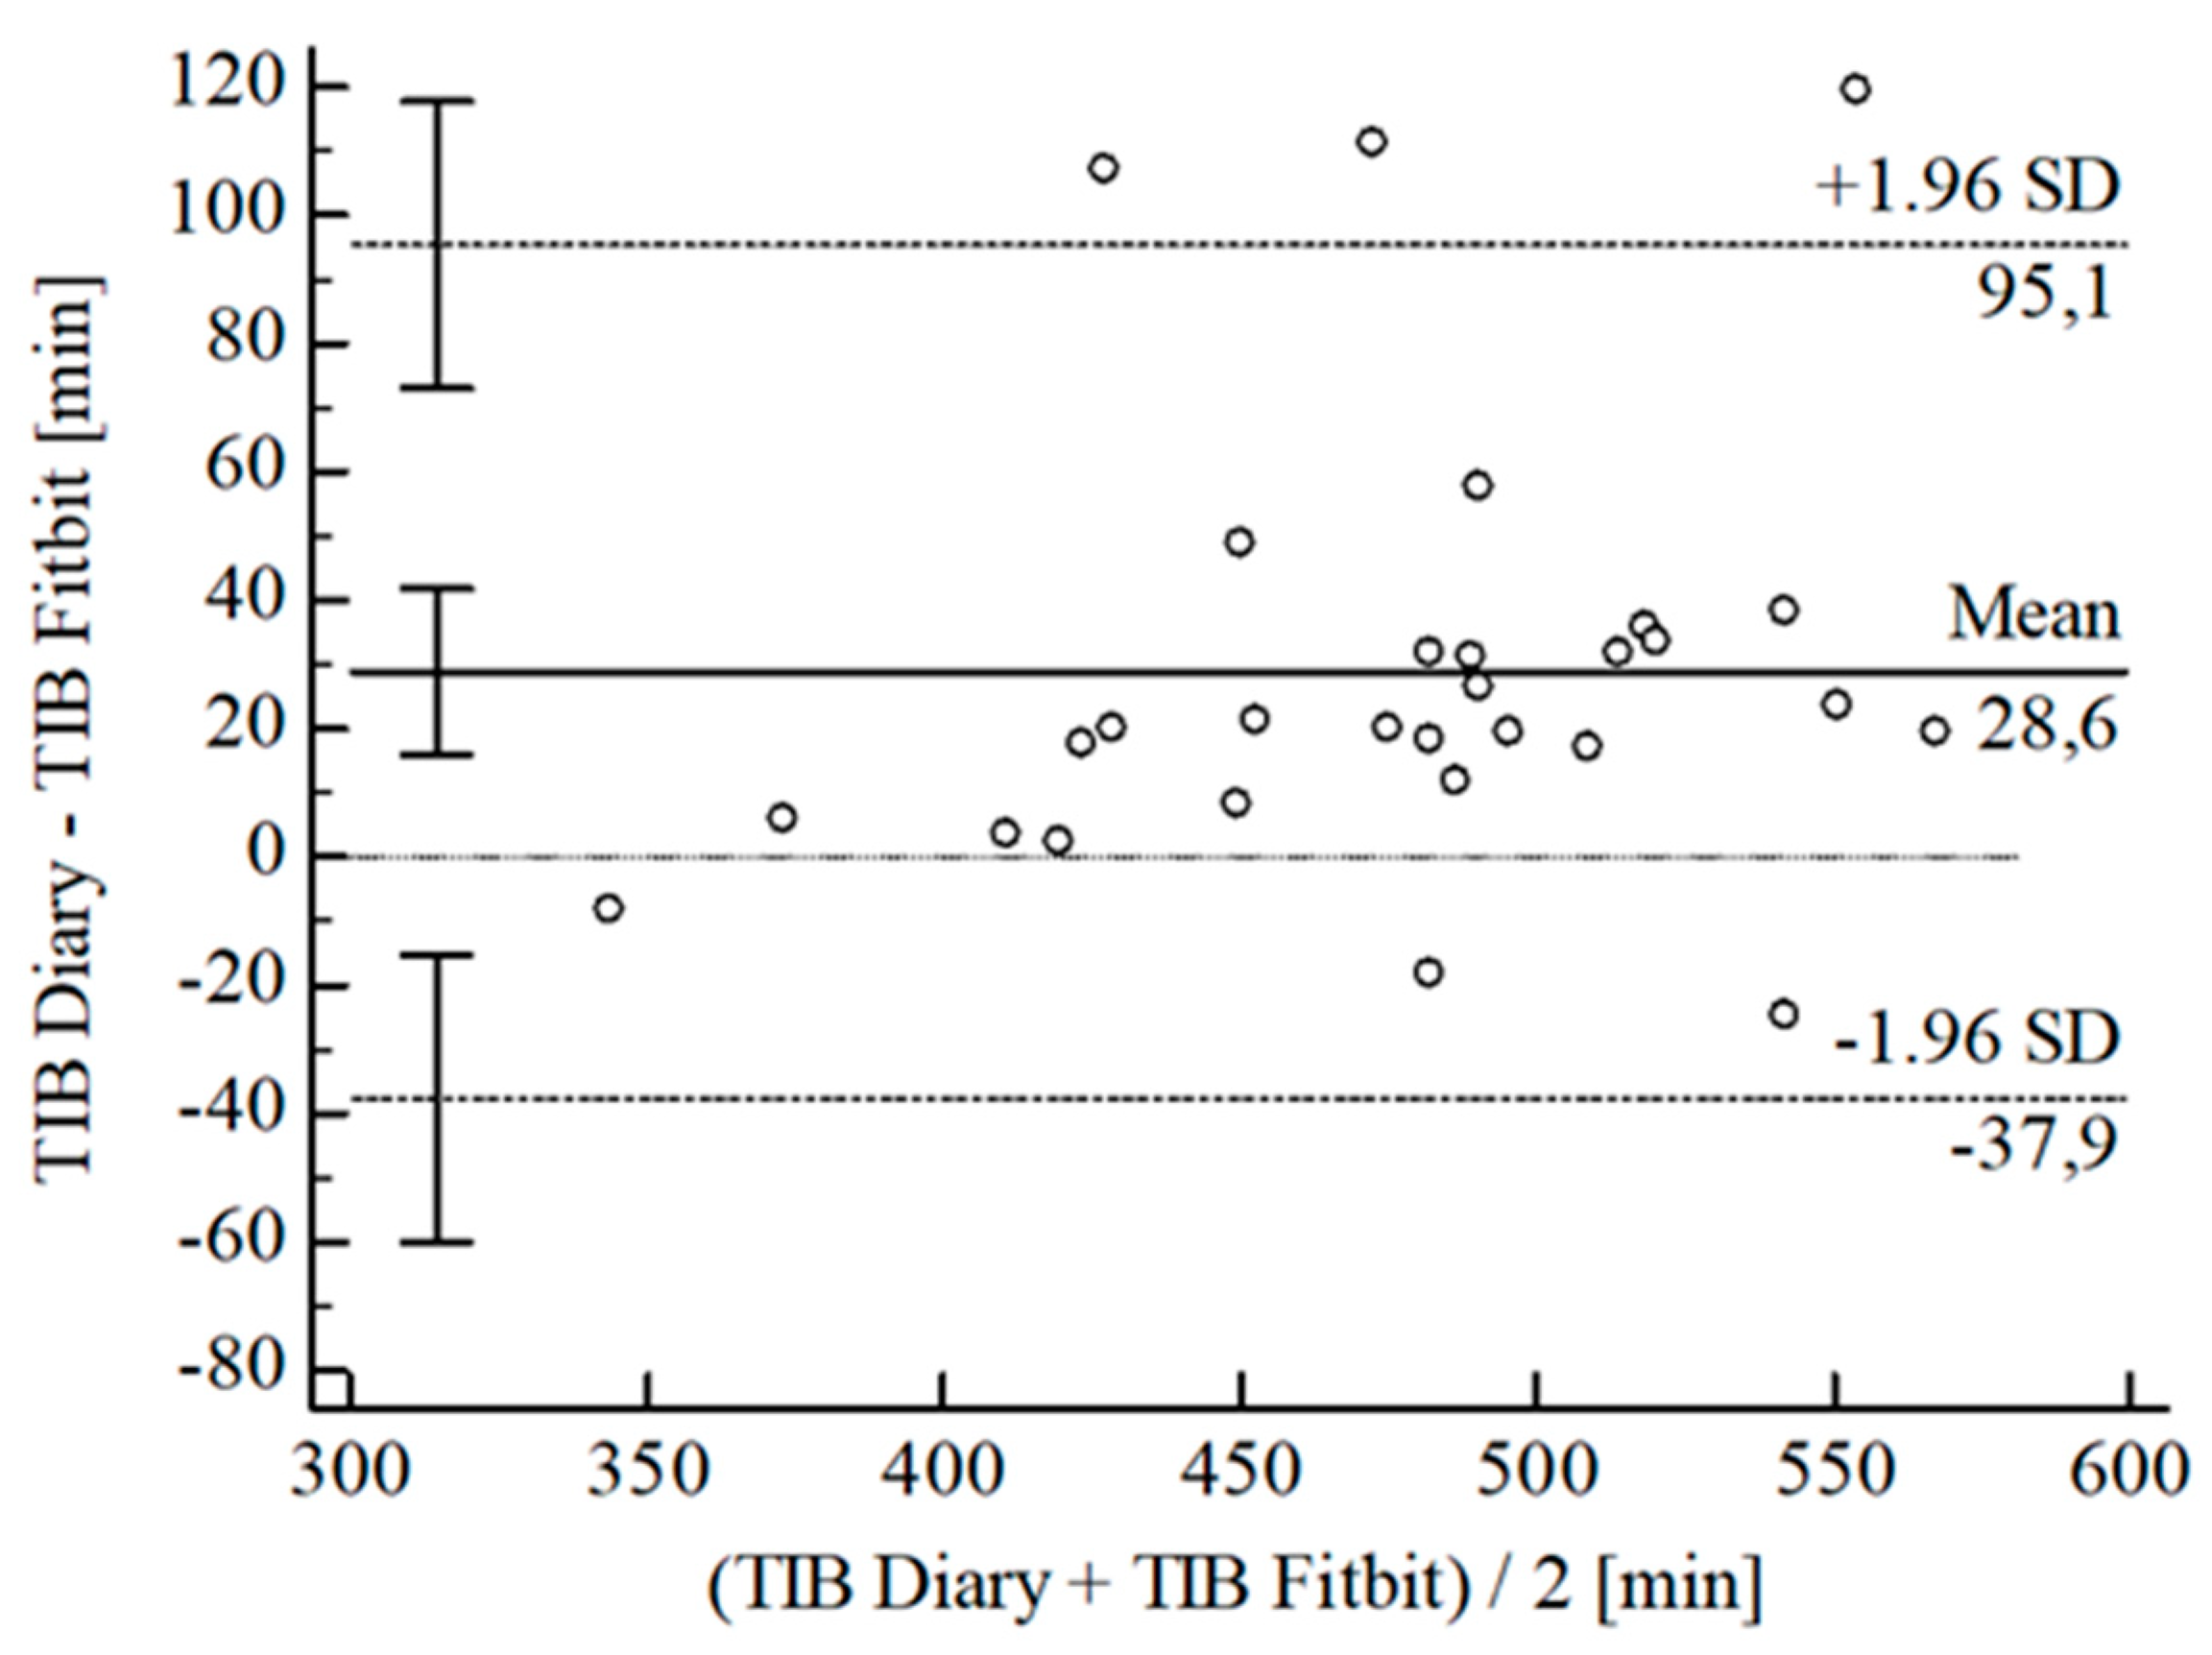
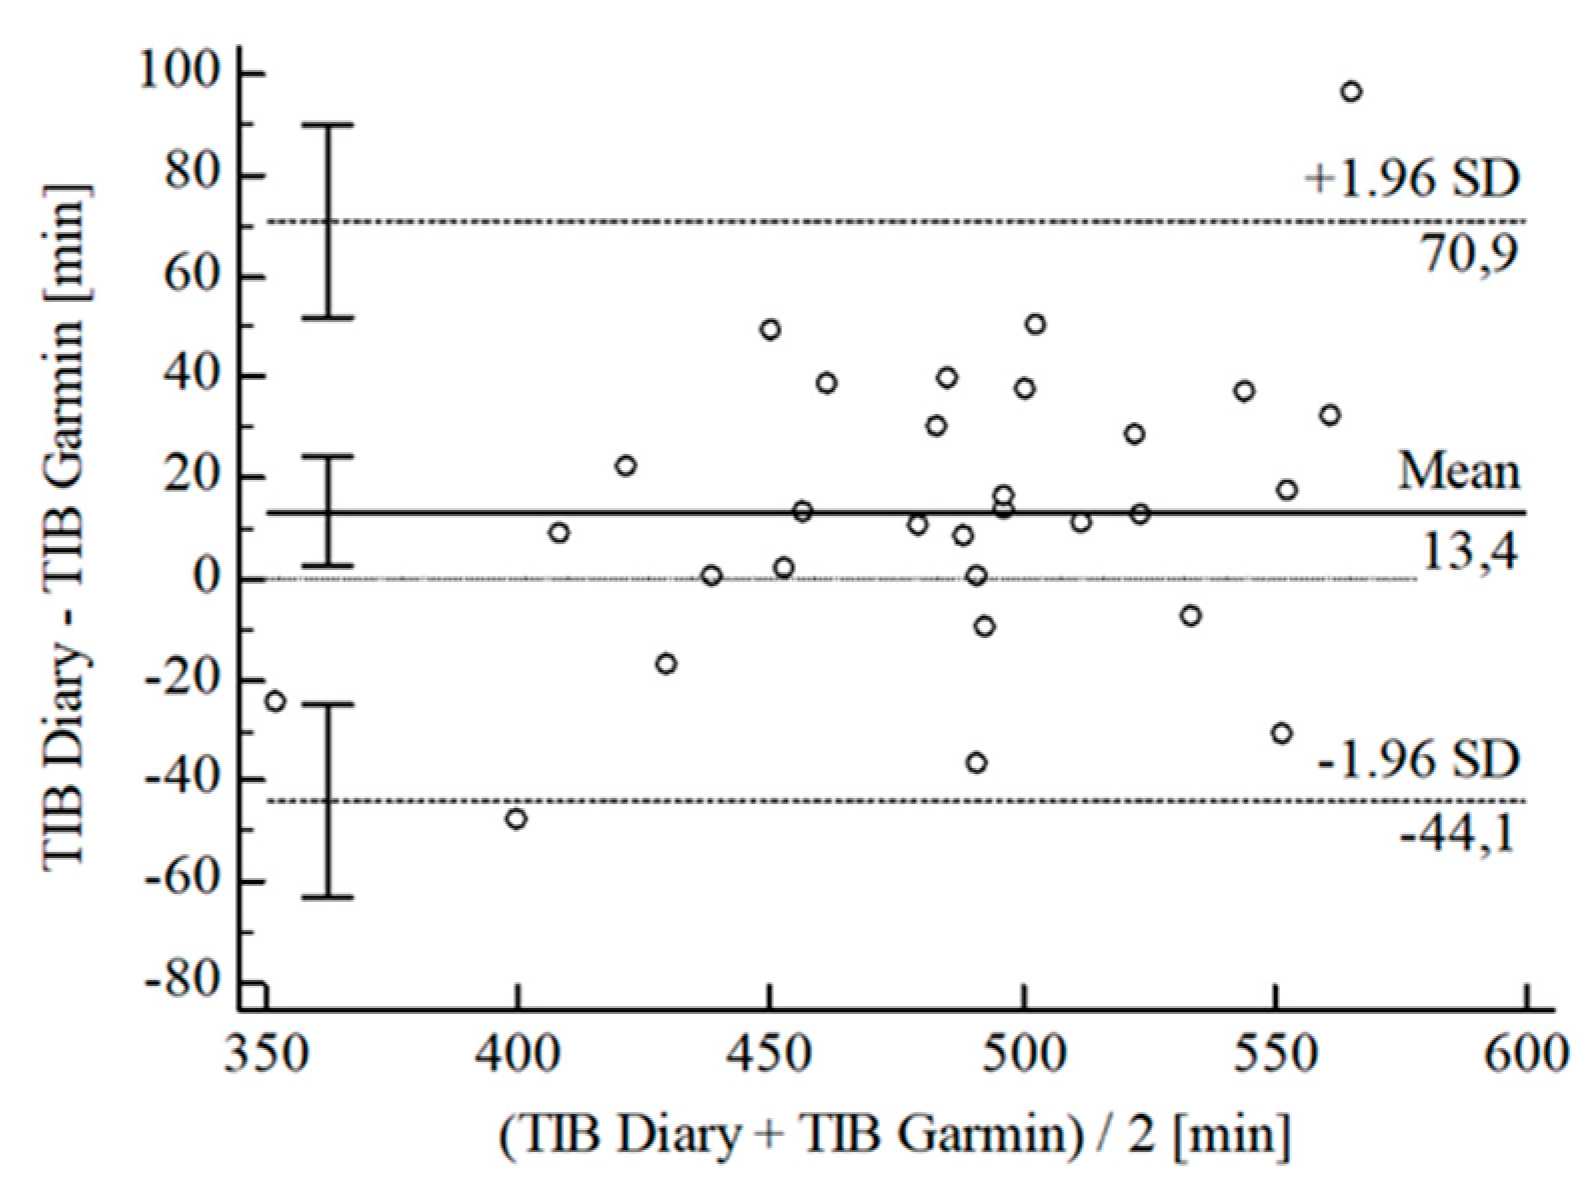
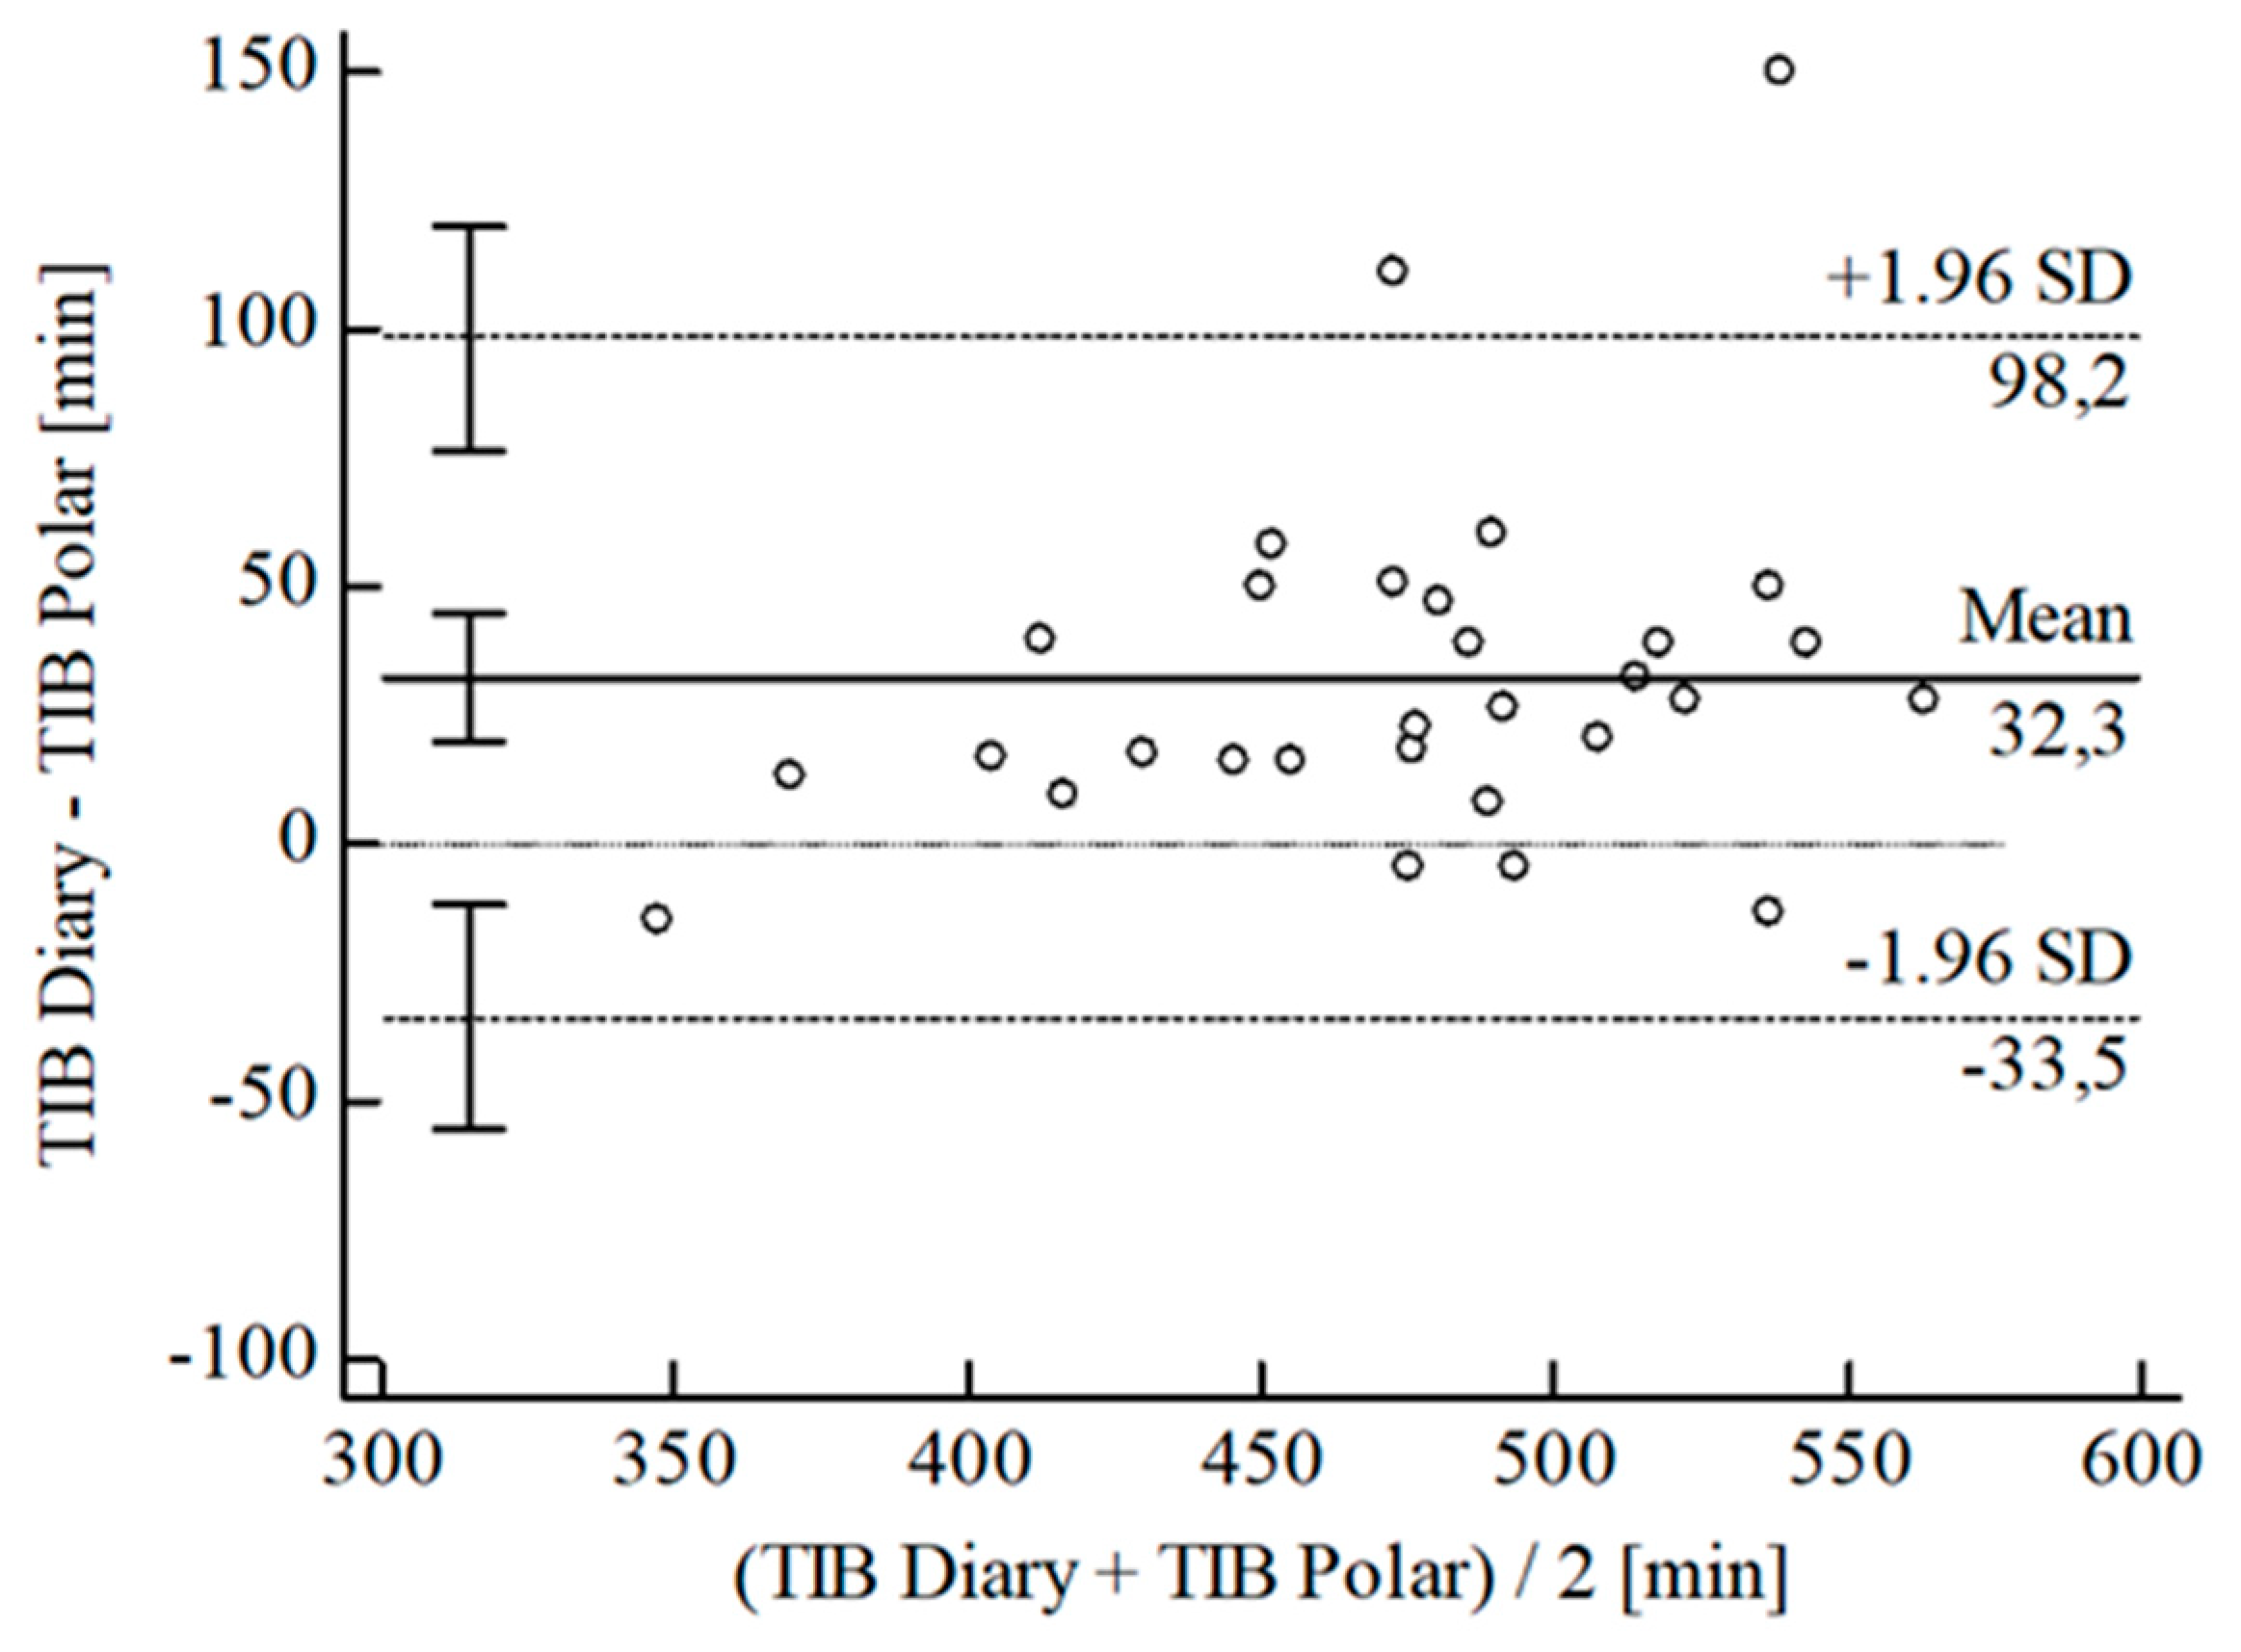
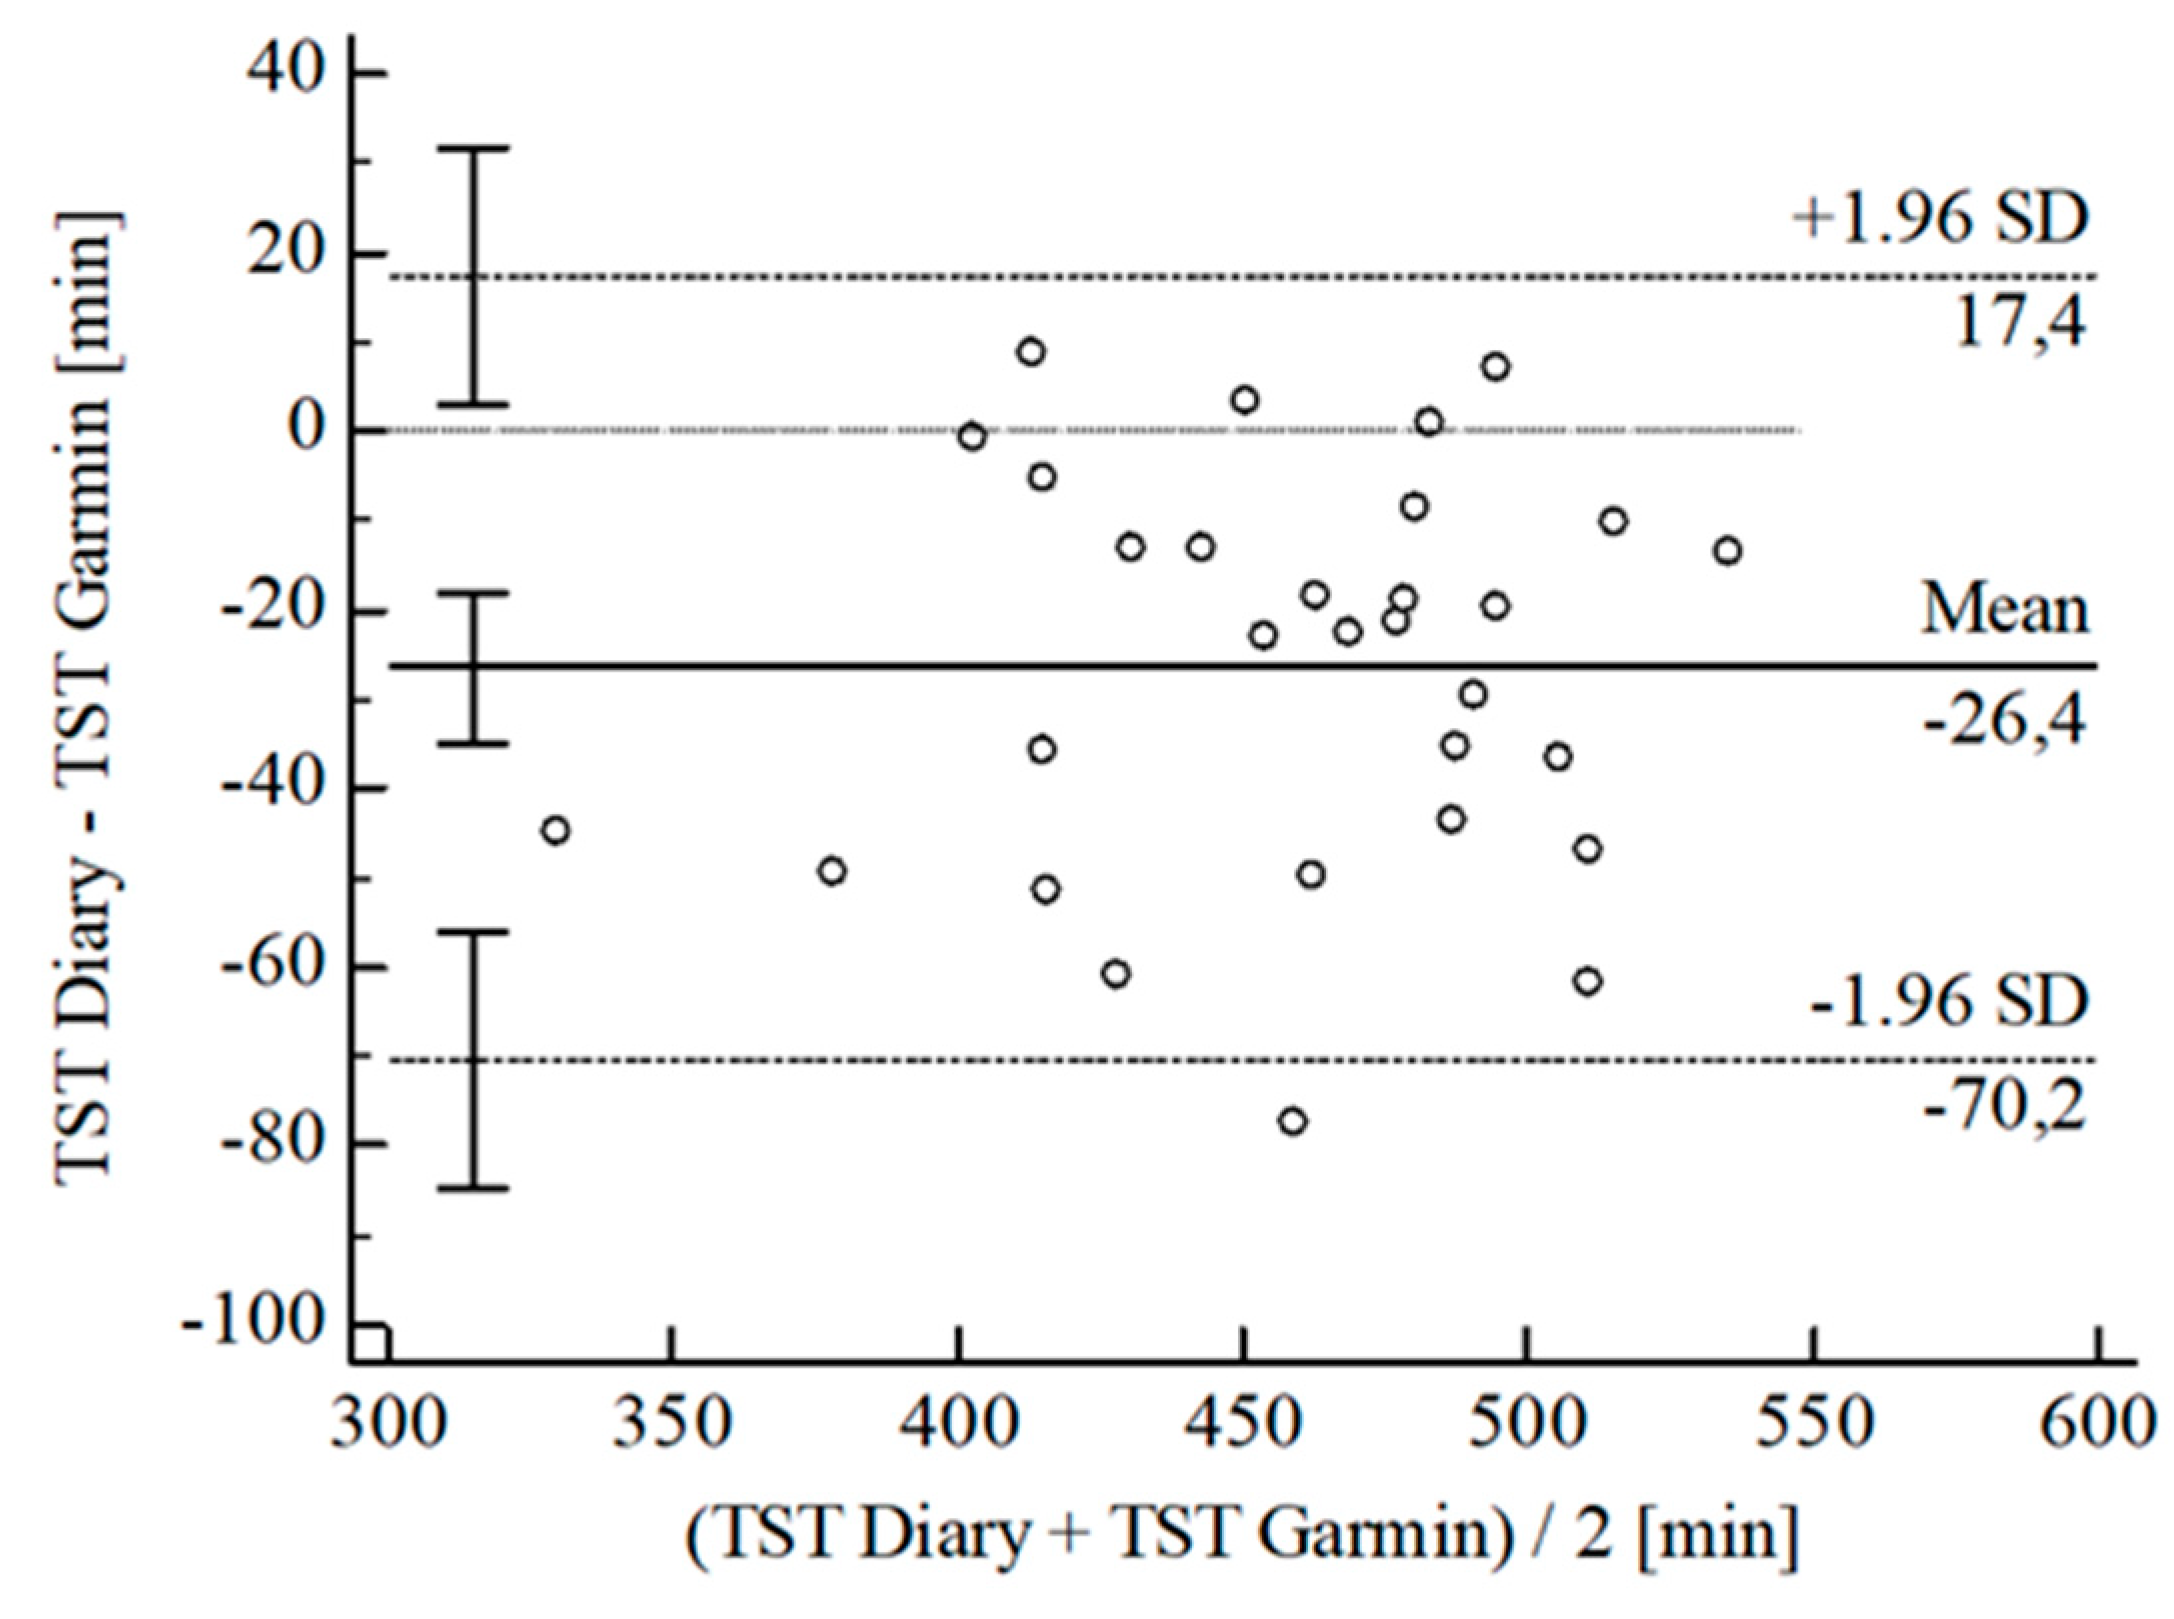
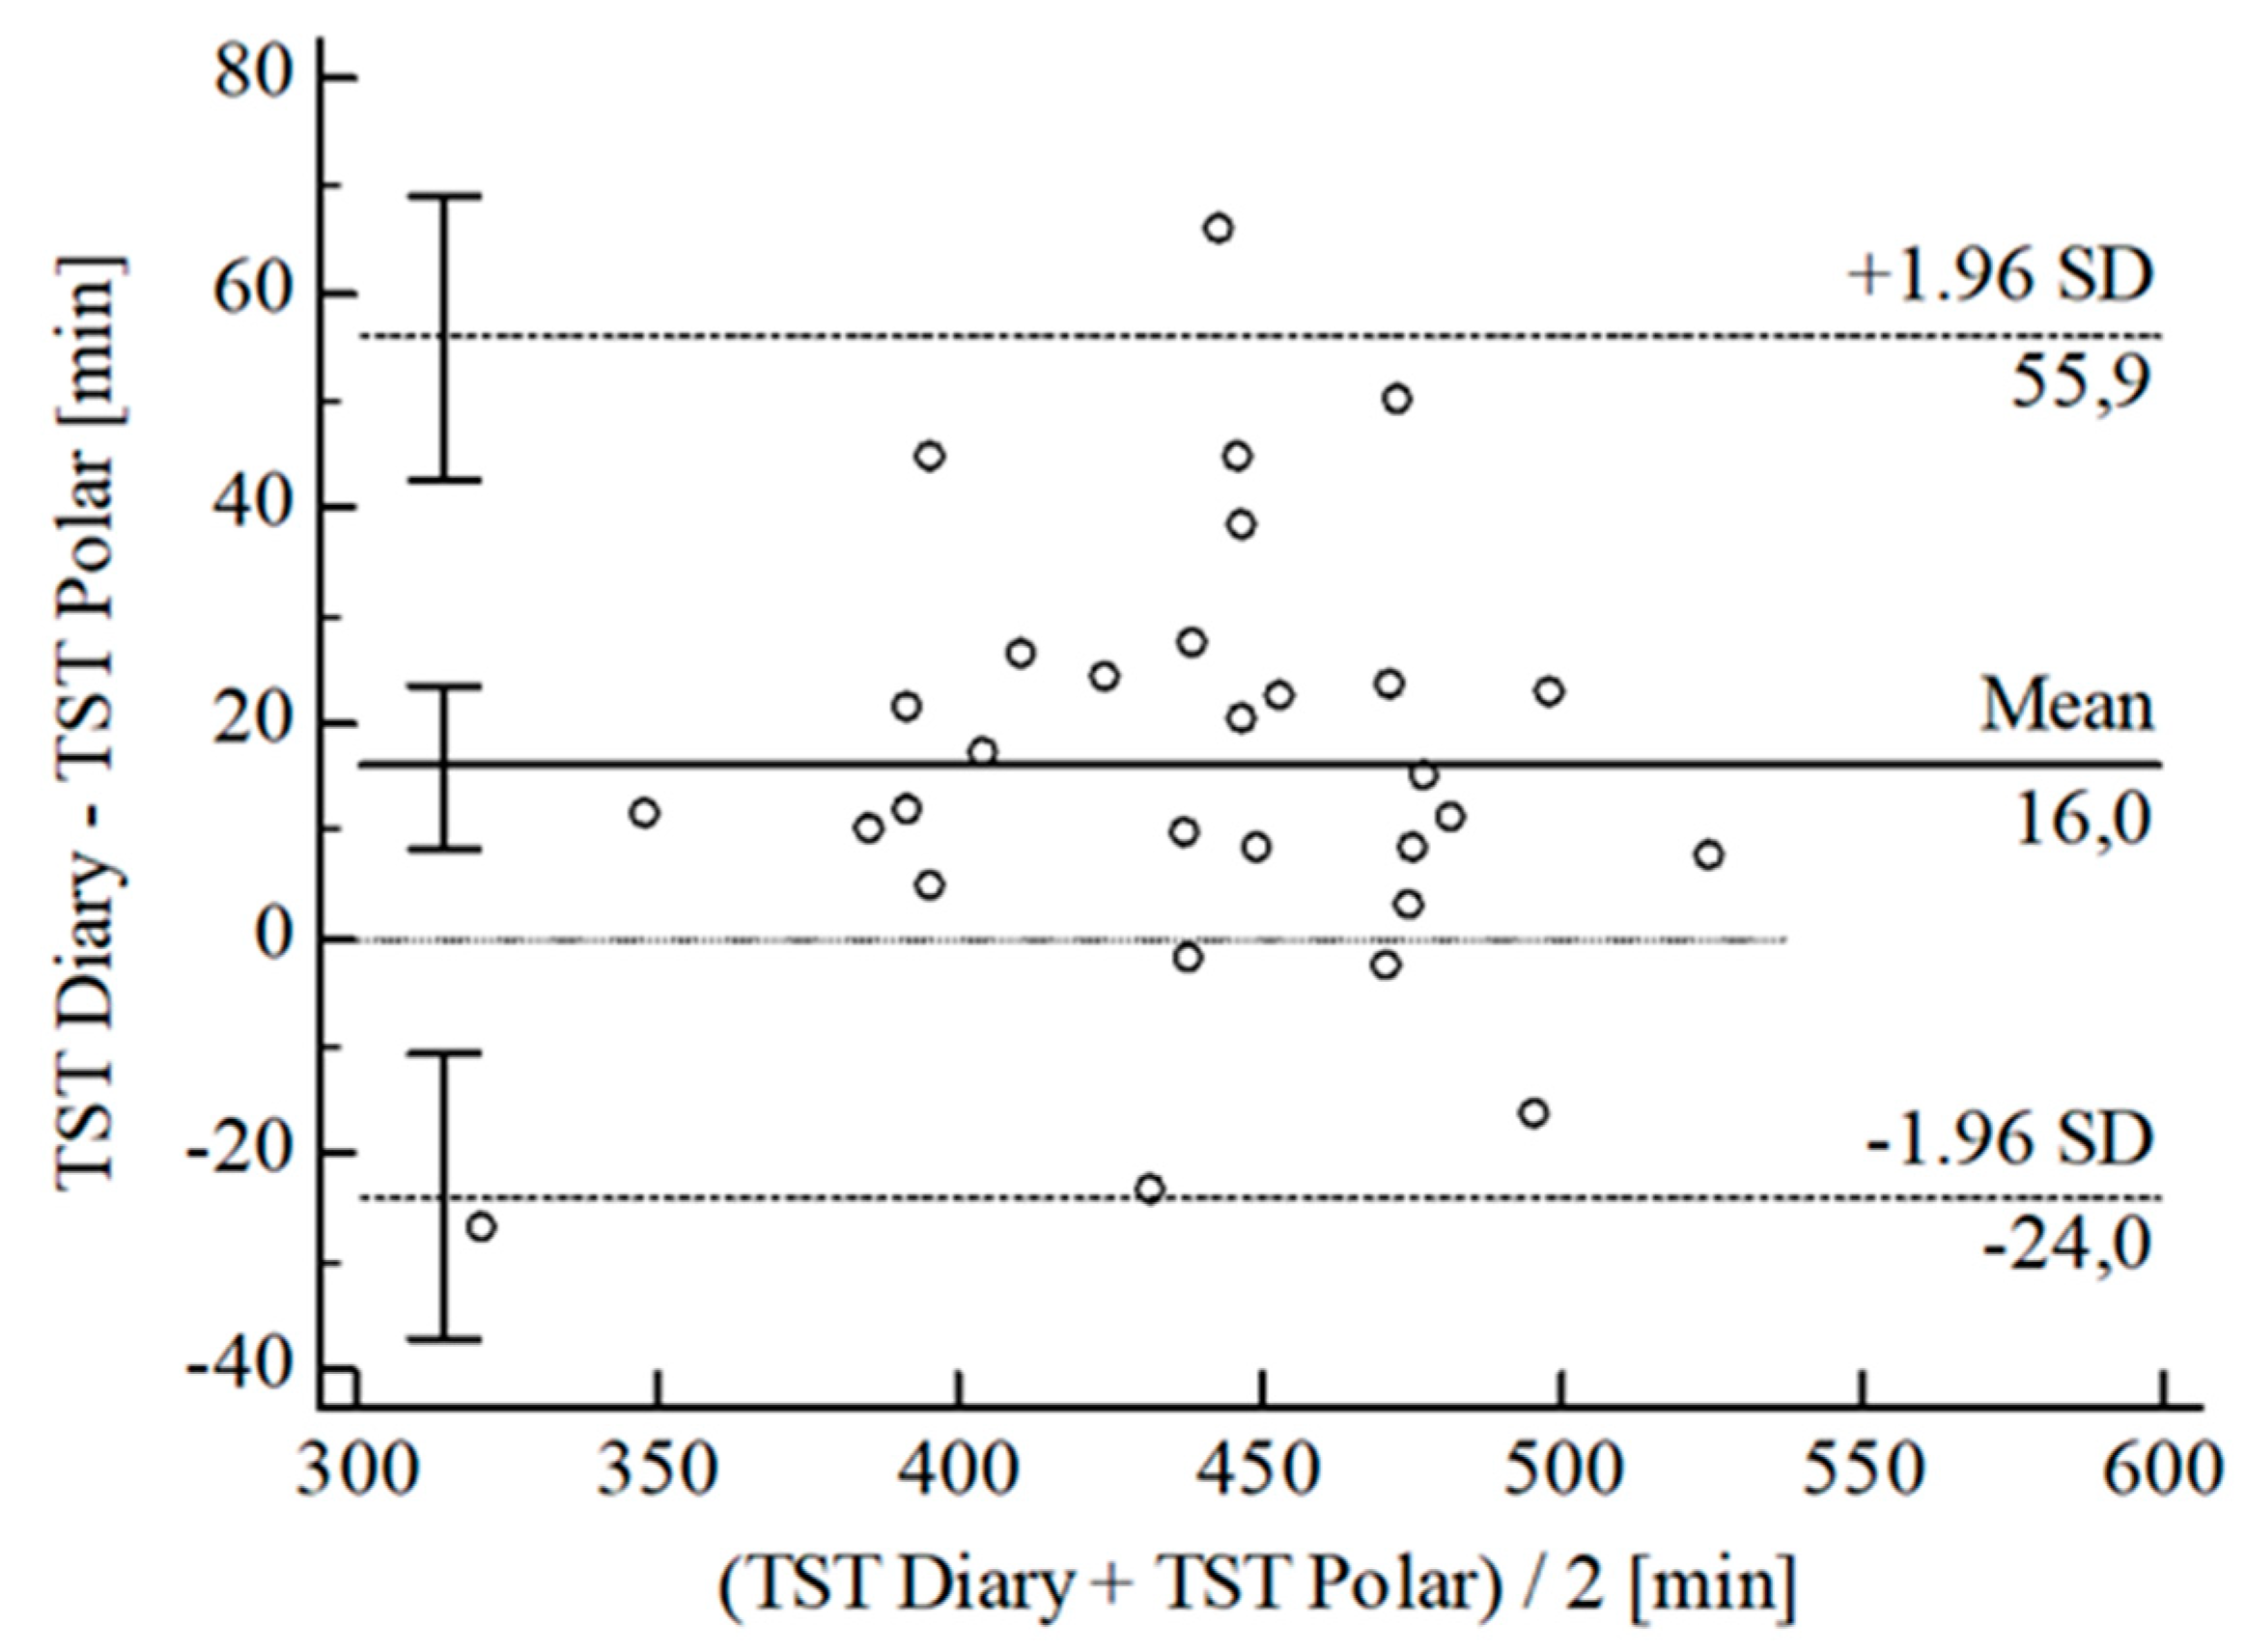
3.2. Agreement between Wearables and Sleep Diary
4. Discussion
5. Conclusions
Author Contributions
Funding
Institutional Review Board Statement
Informed Consent Statement
Data Availability Statement
Conflicts of Interest
Appendix A

| TIB | TST | SE | WASO | ||||||||||
|---|---|---|---|---|---|---|---|---|---|---|---|---|---|
| Fitbit® | Garmin® | Polar® | Fitbit® | Garmin® | Polar® | Fitbit® | Garmin® | Polar® | Fitbit® | Garmin® | Polar® | ||
| N | 28 | 29 | 29 | 28 | 30 | 30 | 29 | 30 | 29 | 29 | 30 | 29 | |
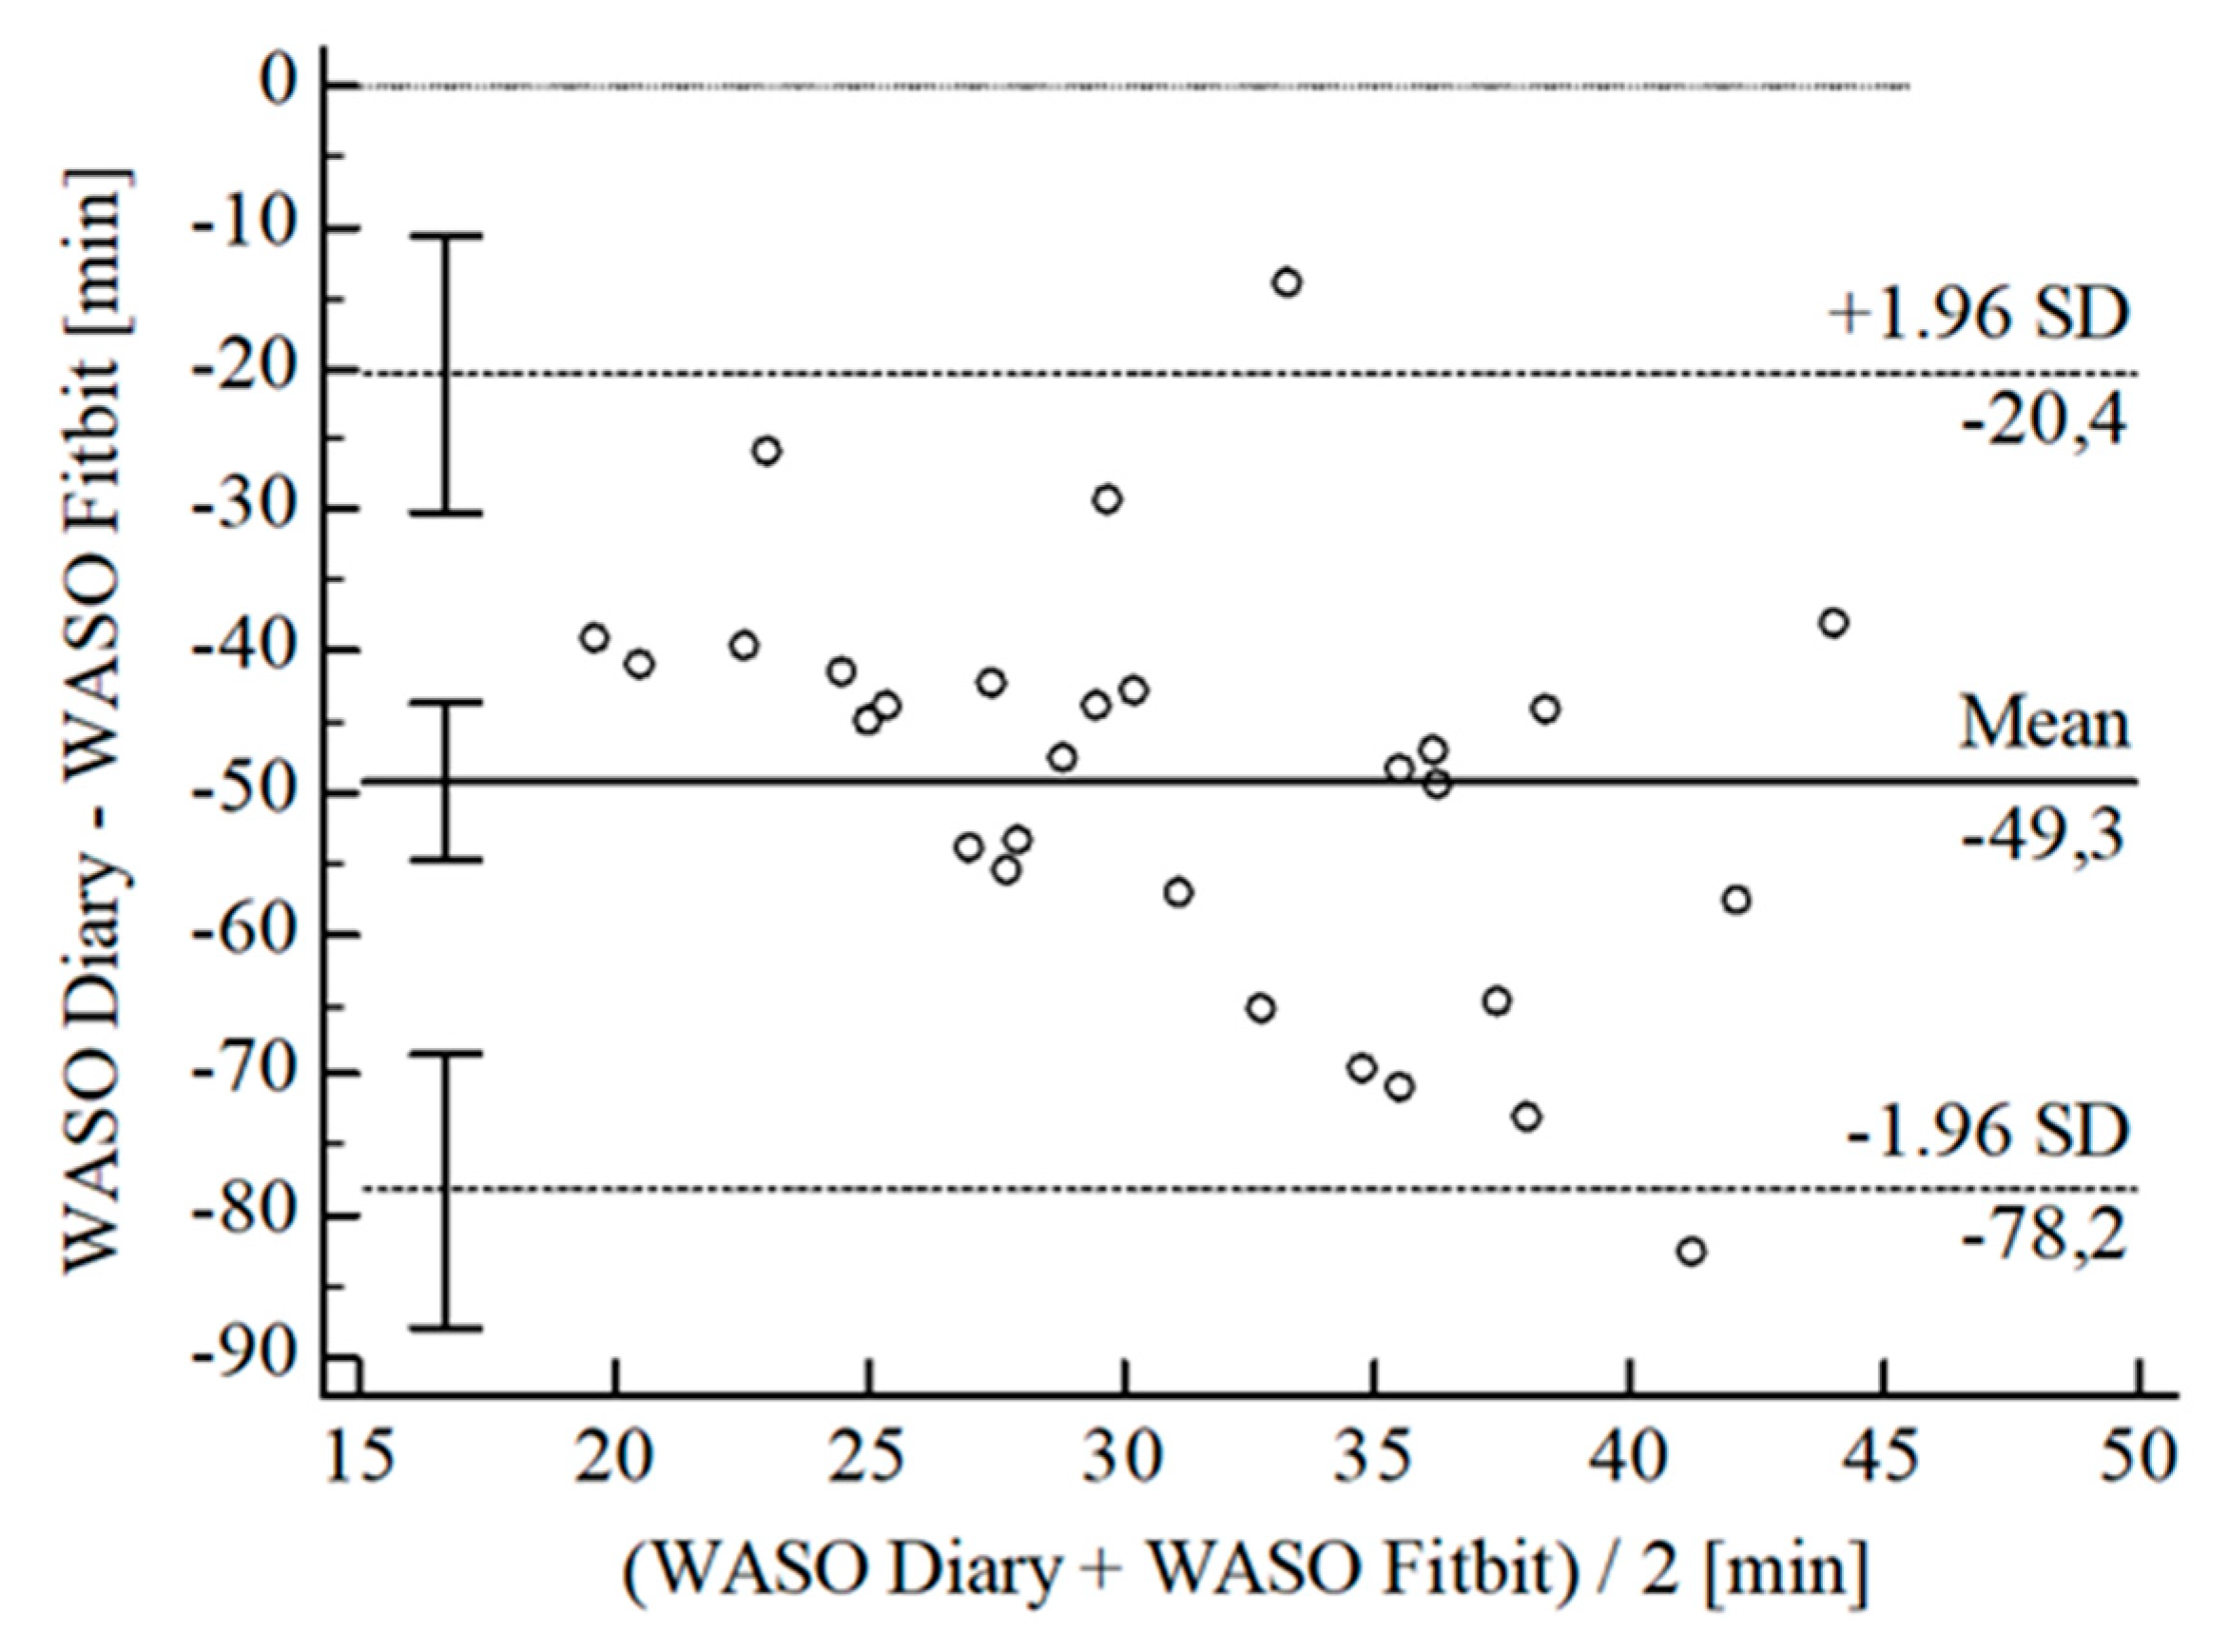
| [min] | ± SD | 10.54 ± 25.24 | 28.30 ± 25.70 | 24.96 ± 18.37 | 26.40 ± 22.36 | 15.95 ± 20.38 | 2.87 ± 5.79 | 2.03 ± 4.30 | |||||
| 95% CI | 0.93; 20.14 | 18.52; 38.08 | 17.84; 32.09 | 34.75; 18.05 | 8.34; 23.56 | 0.67; 5.08 | 3.67; 0.40 | ||||||
| Upper LoA | 60.02 | 78.67 | 60.96 | 17.43 | 55.90 | 14.22 | 6.40 | ||||||
| 95% CI | 43.41; 76.62 | 61.77; 95.58 | 48.64; 73.28 | 3.00; 31.87 | 42.74; 69.05 | 10.41; 18.03 | 3.57; 9.23 | ||||||
| Lower LoA | 38.95 | −22.08 | 11.04 | 70.23 | 24.00 | 8.47 | 10.47 | ||||||
| 95% CI | 55.55; 22.34 | 38.98; 5.17 | 23.36; 1.28 | 84.67; 55.80 | 37.15; 10.84 | 12.28; 4.67 | 13.30; 7.64 | ||||||
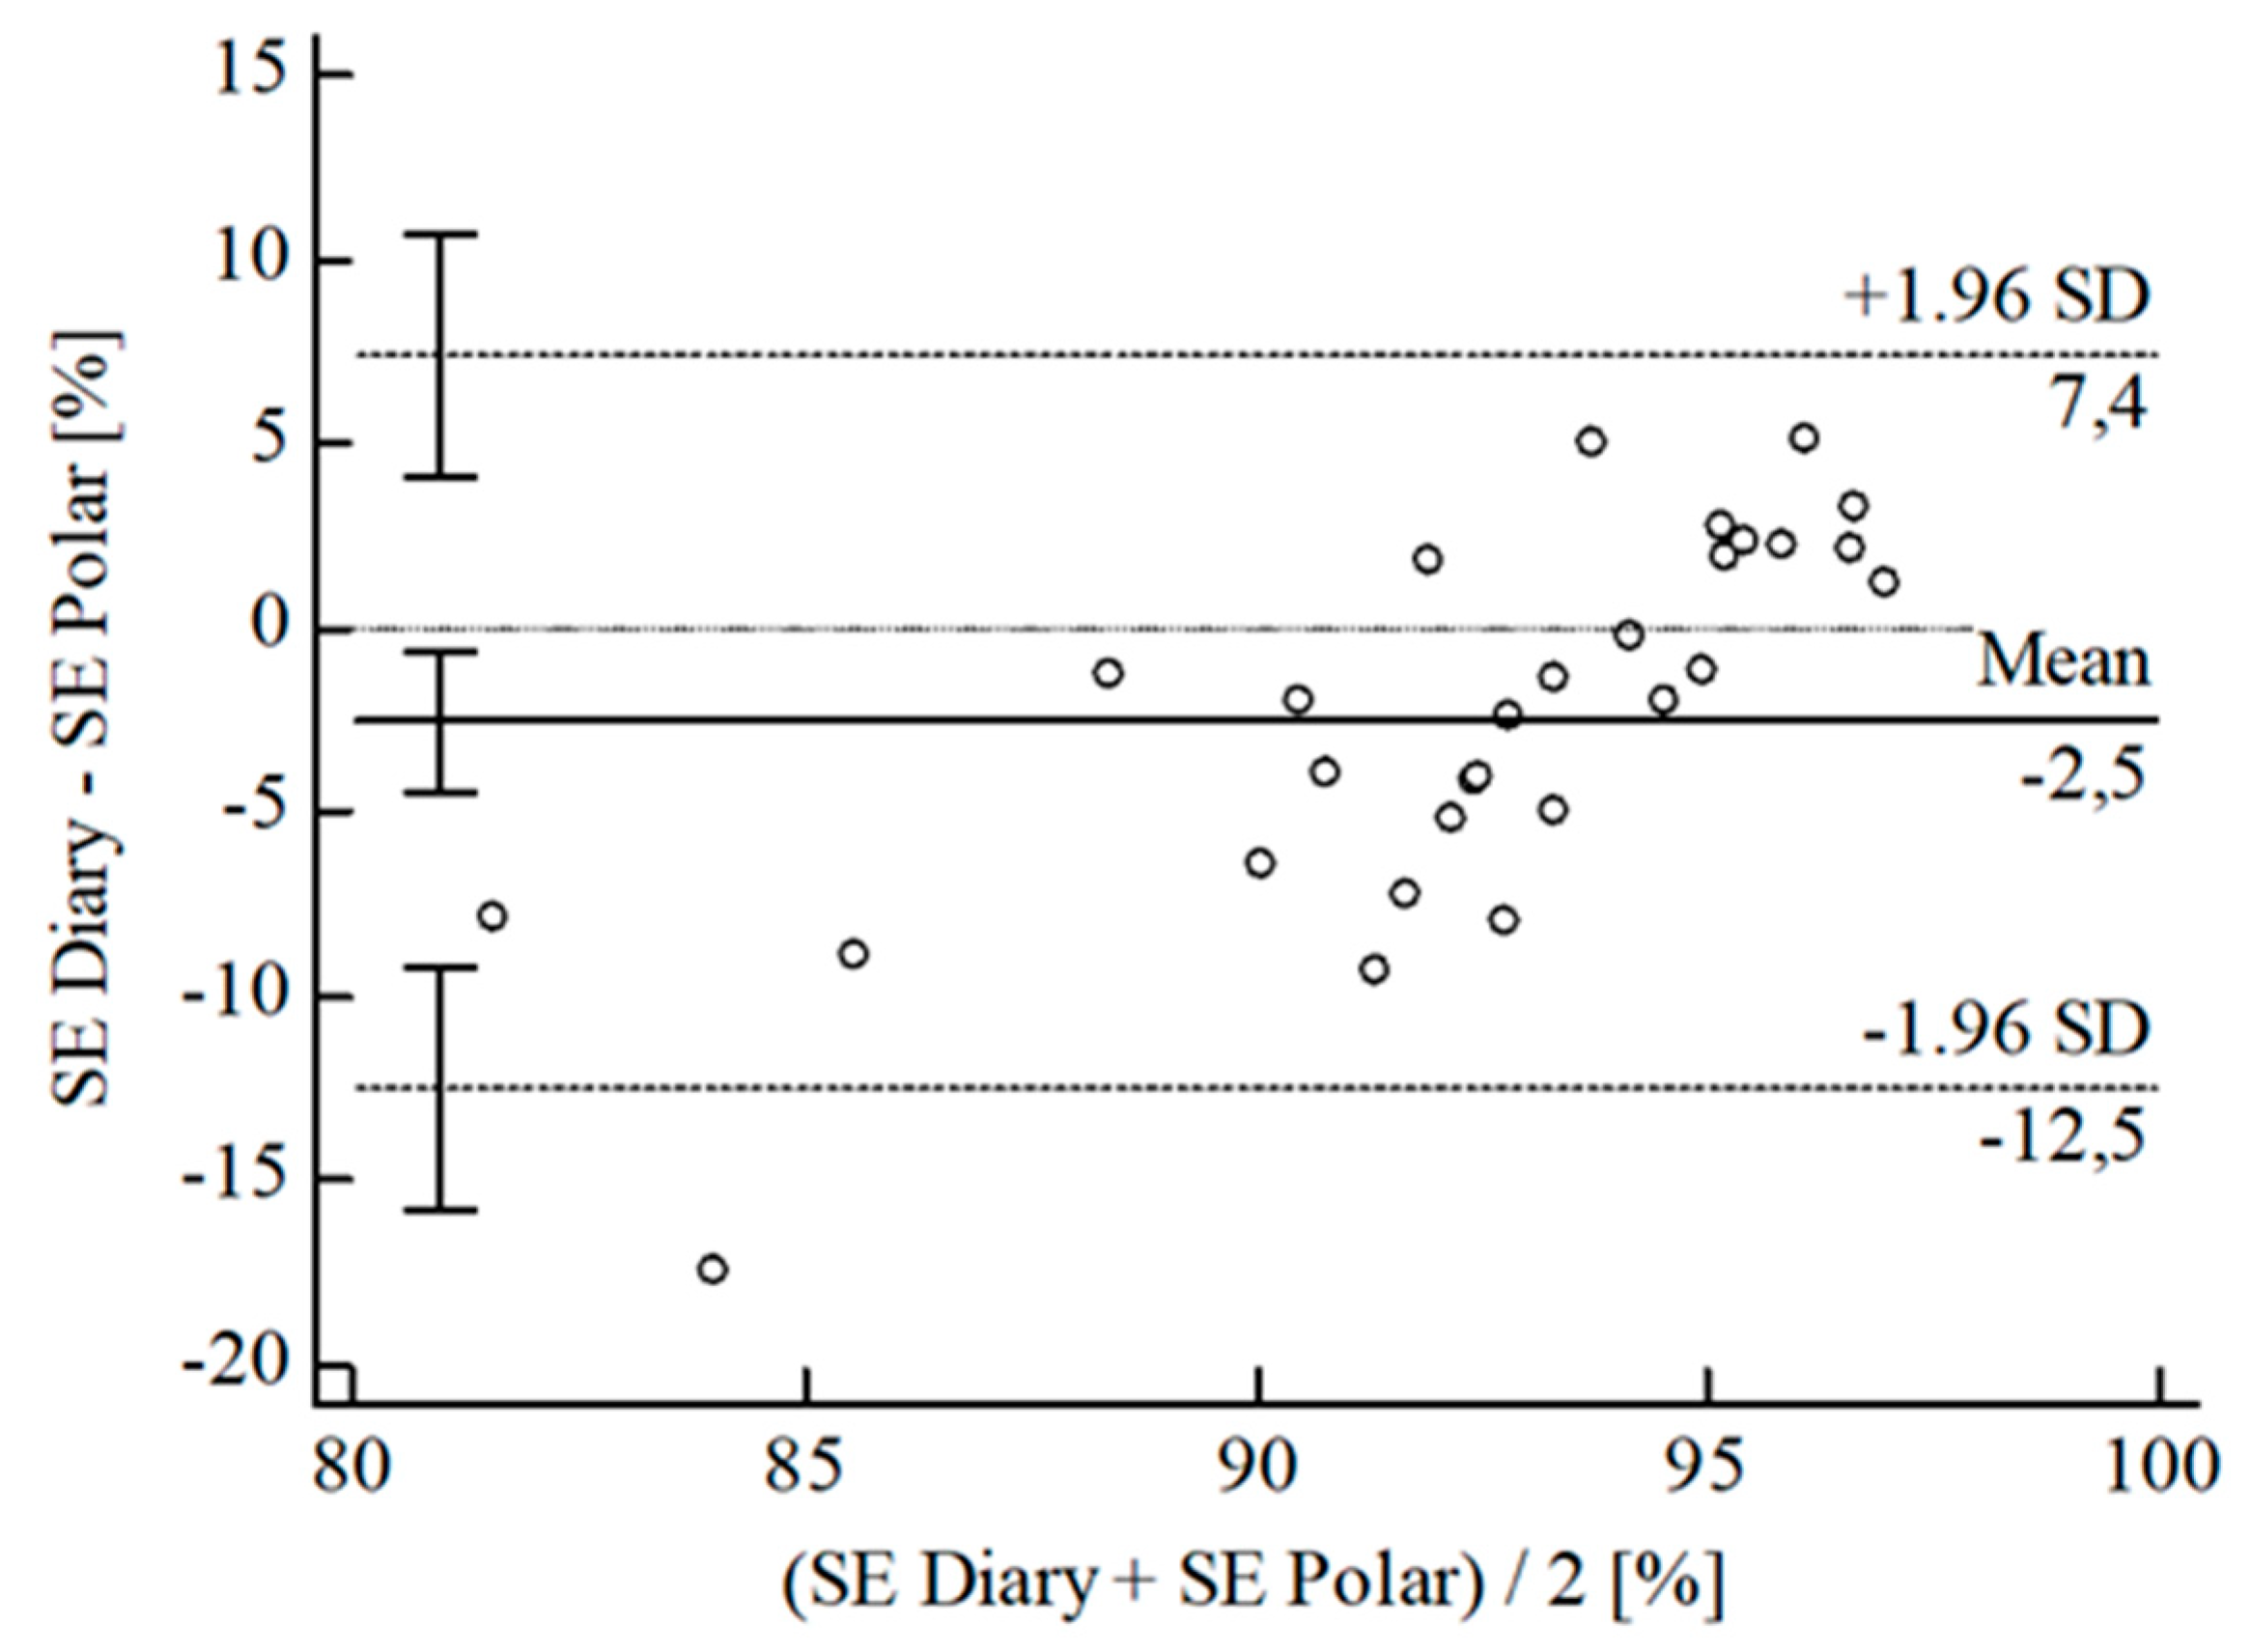
| [%] | ± SD | 5.33 ± 6.47 | 2.01 ± 5.43 | 5.90 ± 5.44 | 5.72 ± 4.18 | 5.86 ± 5.13 | 3.59 ± 4.80 | 3.01 ± 6.57 | 2.32 ± 4.74 | ||||
| 95% CI | 2.82; 7.84 | 0.05; 4.08 | 3.83; 7.97 | 4.11; 7.35 | 7.78; 3.94 | 1.80; 5.38 | 0.51; 5.51 | 4.12; 0.51 | |||||
| Upper LoA | 18.02 | 12.66 | 16.57 | 13.91 | 4.20 | 13.00 | 15.89 | 6.98 | |||||
| 95% CI | 13.67; 22.36 | 9.09; 16.23 | 12.99; 20.15 | 11.11; 16.71 | 0.89; 7.52 | 9.90; 16.10 | 11.57; 20.21 | 3.86; 10.10 | |||||
| Lower LoA | 7.36 | 8.64 | 4.77 | 2.46 | 15.93 | 5.82 | 9.87 | 11.62 | |||||
| 95% CI | 11.71; 3.02 | 12.21; 5.06 | 8.35; 1.19 | 5.26; 0.34 | 19.24; 12.61 | 8.92; 2.72 | 14.19; 5.55 | 14.74; 8.50 | |||||
| over/underestimation | ↓ | ↓ | ↓ | ↓ | ↑ | ↓ | ↓ | ↑ | |||||
| CCCLin | 0.75 | 0.84 | 0.74 | 0.83 | 0.76 | 0.85 | 0.12 | 0.05 | 0.34 | 0.01 | 0.10 | 0.02 | |
| 1 − ß | 1.00 | 1.00 | 1.00 | 1.00 | 1.00 | 1.00 | 0.10 | 0.06 | 0.48 | 0.05 | 0.09 | 0.05 | |
References
- Halson, S.L.; Juliff, L.E. Sleep, sport, and the brain. Prog. Brain Res. 2017, 234, 13–31. [Google Scholar] [CrossRef] [PubMed]
- Goel, N.; Basner, M.; Rao, H.; Dinges, D.F. Circadian rhythms, sleep deprivation, and human performance. Prog. Mol. Biol. Transl. Sci. 2013, 119, 155–190. [Google Scholar] [CrossRef] [PubMed]
- Grandner, M.A. Sleep, Health, and Society. Sleep Med. Clin. 2017, 12, 1–22. [Google Scholar] [CrossRef]
- Buysse, D.J. Sleep health: Can we define it? Does it matter? Sleep 2014, 37, 9–17. [Google Scholar] [CrossRef]
- Mackert, M.; Mabry-Flynn, A.; Champlin, S.; Donovan, E.E.; Pounders, K. Health Literacy and Health Information Technology Adoption: The Potential for a New Digital Divide. J. Med. Internet Res. 2016, 18, e264. [Google Scholar] [CrossRef] [PubMed]
- Kitson, A.; Prpa, M.; Riecke, B.E. Immersive Interactive Technologies for Positive Change: A Scoping Review and Design Considerations. Front. Psychol. 2018, 9, 1354. [Google Scholar] [CrossRef] [PubMed]
- Mansukhani, M.P.; Kolla, B.P. Apps and fitness trackers that measure sleep: Are they useful? Clevel. Clin. J. Med. 2017, 84, 451–456. [Google Scholar] [CrossRef]
- Peake, J.M.; Kerr, G.; Sullivan, J.P. A Critical Review of Consumer Wearables, Mobile Applications, and Equipment for Providing Biofeedback, Monitoring Stress, and Sleep in Physically Active Populations. Front. Physiol. 2018, 9, 743. [Google Scholar] [CrossRef]
- Evenson, K.R.; Goto, M.M.; Furberg, R.D. Systematic review of the validity and reliability of consumer-wearable activity trackers. Int. J. Behav. Nutr. Phys. Act. 2015, 12, 159. [Google Scholar] [CrossRef]
- Fuller, D.; Colwell, E.; Low, J.; Orychock, K.; Tobin, M.A.; Simango, B.; Buote, R.; van Heerden, D.; Luan, H.; Cullen, K.; et al. Reliability and Validity of Commercially Available Wearable Devices for Measuring Steps, Energy Expenditure, and Heart Rate: Systematic Review. JMIR MHealth UHealth 2020, 8, e18694. [Google Scholar] [CrossRef]
- Grifantini, K. How’s my sleep? Personal sleep trackers are gaining in popularity, but their accuracy is still open to debate. IEEE Pulse 2014, 5, 14–18. [Google Scholar] [CrossRef] [PubMed]
- Shin, G.; Jarrahi, M.H.; Fei, Y.; Karami, A.; Gafinowitz, N.; Byun, A.; Lu, X. Wearable activity trackers, accuracy, adoption, acceptance and health impact: A systematic literature review. J. Biomed. Inform. 2019, 93, 103153. [Google Scholar] [CrossRef]
- Grandner, M.A.; Rosenberger, M.E. Actigraphic sleep tracking and wearables: Historical context, scientific applications and guidelines, limitations, and considerations for commercial sleep devices. In Sleep and Health; Grandner, M.A., Allen, S.F., Eds.; Academic Press Elsevier: Amsterdam, The Netherlands, 2019; pp. 147–157. [Google Scholar] [CrossRef]
- Lu, L.; Zhang, J.; Xie, Y.; Gao, F.; Xu, S.; Wu, X.; Ye, Z. Wearable Health Devices in Health Care: Narrative Systematic Review. JMIR MHealth UHealth 2020, 8, e18907. [Google Scholar] [CrossRef] [PubMed]
- Lyons, E.; Lang, M.; Ridgers, N.D.; Timperio, A.; Brown, H.; Ball, K.; Macfarlane, S.; Lai, S.K.; Richards, K.; Mackintosh, K.A.; et al. Wearable Activity Tracker Use Among Australian Adolescents: Usability and Acceptability Study. JMIR MHealth UHealth 2018, 6, e86. [Google Scholar] [CrossRef]
- De Arriba-Pérez, F.; Caeiro-Rodríguez, M.; Santos-Gago, J.M. How do you sleep? Using off the shelf wrist wearables to estimate sleep quality, sleepiness level, chronotype and sleep regularity indicators. J. Ambient Intell. Humaniz. Comput. 2018, 9, 897–917. [Google Scholar] [CrossRef]
- Chinoy, E.D.; Huwa, K.E.; Snider, M.N.; Bessman, S.C.; Cuellar, J.A.; Cooper, A.D.; Hirsch, D.A.; Nardulli, P.J.; Jameson, J.T.; Drummond, S.P.A.; et al. Examination of Wearable and Non-Wearable Consumer Sleep-Tracking Devices Versus Polysomnography. Sleep 2019, 42, A403–A404. [Google Scholar] [CrossRef]
- Crivello, A.; Barsocchi, P.; Girolami, M.; Palumbo, F. The Meaning of Sleep Quality: A Survey of Available Technologies. IEEE Access 2019, 7, 167374–167390. [Google Scholar] [CrossRef]
- Kolla, B.P.; Mansukhani, S.; Mansukhani, M.P. Consumer sleep tracking devices: A review of mechanisms, validity and utility. Expert Rev. Med. Devices 2016, 13, 497–506. [Google Scholar] [CrossRef]
- Liang, Z.; Chapa Martell, M.A. Validity of Consumer Activity Wristbands and Wearable EEG for Measuring Overall Sleep Parameters and Sleep Structure in Free-Living Conditions. J. Healthc. Inform. Res. 2018, 2, 152–178. [Google Scholar] [CrossRef]
- Manuta, J.; Gravel, N.; Spencer, R.M.C. Reliability of Sleep Measures from Four Personal Health Monitoring Devices Compared to Research-Based Actigraphy and Polysomnography. Sensors 2016, 16, 646. [Google Scholar] [CrossRef]
- Menghini, L.; Cellini, N.; Goldstone, A.; Baker, F.C.; de Zambotti, M. A standardized framework for testing the performance of sleep-tracking technology: Step-by-step guidelines and open-source code. Sleep 2020, 44, zsaa170. [Google Scholar] [CrossRef] [PubMed]
- Muzet, A.; Werner, S.; Fuchs, G.; Roth, T.; Saoud, J.B.; Viola, A.U.; Schaffhauser, J.Y.; Luthringer, R. Assessing sleep architecture and continuity measures through the analysis of heart rate and wrist movement recordings in healthy subjects: Comparison with results based on polysomnography. Sleep Med. 2016, 21, 47–56. [Google Scholar] [CrossRef] [PubMed]
- Roomkham, S.; Lovell, D.; Cheung, J.; Perrin, D. Promises and Challenges in the Use of Consumer-Grade Devices for Sleep Monitoring. IEEE Rev. Biomed. Eng. 2018, 11, 53–67. [Google Scholar] [CrossRef] [PubMed]
- Williamson, J.; Liu, Q.; Lu, F.; Mohrman, W.; Li, K.; Dick, R.; Shang, L. Data Sensing and Analysis: Challenges for Wearables. In Proceedings of the 20th Asia and South Pacific Design Automation Conference, Chiba, Japan, 19–22 January 2015; pp. 136–141. [Google Scholar] [CrossRef]
- Baron, K.G.; Duffecy, J.; Berendsen, M.A.; Cheung Mason, I.; Lattie, E.G.; Manalo, N.C. Feeling validated yet? A scoping review of the use of consumer-targeted wearable and mobile technology to measure and improve sleep. Sleep Med. Rev. 2018, 40, 151–159. [Google Scholar] [CrossRef] [PubMed]
- De Zambotti, M.; Cellini, N.; Goldstone, A.; Colrain, I.M.; Baker, F.C. Wearable Sleep Technology in Clinical and Research Settings. Med. Sci. Sports Exerc. 2019, 51, 1538–1557. [Google Scholar] [CrossRef]
- Perez-Pozuelo, I.; Zhai, B.; Palotti, J.; Mall, R.; Aupetit, M.; Garcia-Gomez, J.M.; Taheri, S.; Guan, Y.; Fernandez-Luque, L. The future of sleep health: A data-driven revolution in sleep science and medicine. NPJ Digit. Med. 2020, 3, 42. [Google Scholar] [CrossRef]
- Wiesing, U.; Ehni, H.J. Die Deklaration von Helsinki des Weltärztebundes—Ethische Grundsätze für die Forschung am Menschen. In Handbuch Ethik und Recht der Forschung am Menschen; Lenk, C., Duttge, G., Fangerau, H., Eds.; Springer: Berlin/Heidelberg, Germany, 2014; pp. 517–524. [Google Scholar] [CrossRef]
- Lee, J.M.; Byun, W.; Keill, A.; Dinkel, D.; Seo, Y. Comparison of Wearable Trackers’ Ability to Estimate Sleep. Int. J. Environ. Res. Public Health 2018, 15, 1265. [Google Scholar] [CrossRef]
- Faul, F.; Erdfelder, E.; Buchner, A.; Lang, A.G. Statistical power analyses using G*Power 3.1: Tests for correlation and regression analyses. Behav. Res. Methods 2009, 41, 1149–1160. [Google Scholar] [CrossRef]
- Düking, P.; Giessing, L.; Frenkel, M.O.; Koehler, K.; Holmberg, H.C.; Sperlich, B. Wrist-Worn Wearables for Monitoring Heart Rate and Energy Expenditure While Sitting or Performing Light-to-Vigorous Physical Activity: Validation Study. JMIR Mhealth Uhealth. 2020, 8, e16716. [Google Scholar] [CrossRef]
- Hoffmann, R.M.; Müller, T.; Hajak, G.; Cassel, W. Abend-Morgenprotokolle in Schlafforschung und Schlafmedizin: Ein Standardinstrument für den deutschsprachigen Raum. Somnologie 1997, 1, 103–109. [Google Scholar] [CrossRef]
- Bland, J.M.; Altman, D.G. Statistical methods for assessing agreement between two methods of clinical measurement. Lancet 1986, 1, 307–310. [Google Scholar] [CrossRef]
- Lin, L.I.K. A Concordance Correlation Coefficient to Evaluate Reproducibility. Biometrics 1989, 45, 255. [Google Scholar] [CrossRef] [PubMed]
- Shapiro, S.S.; Wilk, M.B. An analysis of variance test for normality (complete samples). Biometrika 1965, 52, 591. [Google Scholar] [CrossRef]
- Breusch, T.S.; Pagan, A.R. A simple test for heteroscedasticity and random coefficient variation. Econometrica 1979, 47, 1287. [Google Scholar] [CrossRef]
- Bland, J.M.; Altman, D.G. Measuring agreement in method comparison studies. Stat. Methods Med. Res. 1999, 8, 135–160. [Google Scholar] [CrossRef] [PubMed]
- Ohayon, M.; Wickwire, E.M.; Hirshkowitz, M.; Albert, S.M.; Avidan, A.; Daly, F.J.; Dauvilliers, Y.; Ferri, R.; Fung, C.; Gozal, D.; et al. National Sleep Foundation’s sleep quality recommendations: First report. Sleep Health 2017, 3, 6–19. [Google Scholar] [CrossRef]
- Landis, J.R.; Koch, G.G. The measurement of observer agreement for categorical data. Biometrics 1977, 33, 159. [Google Scholar] [CrossRef]
- Johnson, N.L. Systems of frequency curves generated by methods of translation. Biometrika 1949, 36, 149–176. [Google Scholar] [CrossRef]
- Degroote, L.; Hamerlinck, G.; Poels, K.; Maher, C.; Crombez, G.; de Bourdeaudhuij, I.; Vandendriessche, A.; Curtis, R.G.; DeSmet, A. Low-cost consumer-based trackers to measure physical activity and sleep duration among adults in free-living conditions: Validation study. JMIR MHealth UHealth 2020, 8, e16674. [Google Scholar] [CrossRef]
- Jungquist, C.R.; Pender, J.J.; Klingman, K.J.; Mund, J. Validation of Capturing Sleep Diary Data via a Wrist-Worn Device. Sleep Disord. 2015, 2015, 758937. [Google Scholar] [CrossRef]
- Campanini, M.Z.; Lopez-Garcia, E.; Rodríguez-Artalejo, F.; González, A.D.; Andrade, S.M.; Mesas, A.E. Agreement between sleep diary and actigraphy in a highly educated Brazilian population. Sleep Med. 2017, 35, 27–34. [Google Scholar] [CrossRef] [PubMed]
- Thurman, S.M.; Wasylyshyn, N.; Roy, H.; Lieberman, G.; Garcia, J.O.; Asturias, A.; Okafor, G.N.; Elliott, J.C.; Giesbrecht, B.; Grafton, S.T.; et al. Individual differences in compliance and agreement for sleep logs and wrist actigraphy: A longitudinal study of naturalistic sleep in healthy adults. PLoS ONE 2018, 13, e0191883. [Google Scholar] [CrossRef]
- Stone, J.D.; Rentz, L.E.; Forsey, J.; Ramadan, J.; Markwald, R.R.; Finomore, V.S.; Galster, S.M.; Rezai, A.; Hagen, J.A. Evaluations of Commercial Sleep Technologies for Objective Monitoring During Routine Sleeping Conditions. Nat. Sci. Sleep 2020, 12, 821–842. [Google Scholar] [CrossRef] [PubMed]
- Khosla, S.; Deak, M.C.; Gault, D.; Goldstein, C.A.; Hwang, D.; Kwon, Y.; O’Hearn, D.; Schutte-Rodin, S.; Yurcheshen, M.; Rosen, I.M.; et al. Consumer Sleep Technology: An American Academy of Sleep Medicine Position Statement. J. Clin. Sleep Med. Off. Publ. Am. Acad. Sleep Med. 2018, 14, 877–880. [Google Scholar] [CrossRef] [PubMed]
- Ibáñez, V.; Silva, J.; Navarro, E.; Cauli, O. Sleep assessment devices: Types, market analysis, and a critical view on accuracy and validation. Expert Rev. Med. Devices 2019, 16, 1041–1052. [Google Scholar] [CrossRef] [PubMed]
- Berryhill, S.; Morton, C.J.; Dean, A.; Berryhill, A.; Provencio-Dean, N.; Patel, S.I.; Estep, L.; Combs, D.; Mashaqi, S.; Gerald, L.B.; et al. Effect of wearables on sleep in healthy individuals: A randomized crossover trial and validation study. J. Clin. Sleep Med. Off. Publ. Am. Acad. Sleep Med. 2020, 16, 775–783. [Google Scholar] [CrossRef]
- Blume, C.; Schmidt, M.H.; Cajochen, C. Effects of the COVID-19 lockdown on human sleep and rest-activity rhythms. Curr. Biol. 2020, 30, R795–R797. [Google Scholar] [CrossRef]
- Ancoli-Israel, S.; Martin, J.L.; Blackwell, T.; Buenaver, L.; Liu, L.; Meltzer, L.J.; Sadeh, A.; Spira, A.P.; Taylor, D.J. The SBSM Guide to Actigraphy Monitoring: Clinical and Research Applications. Behav. Sleep Med. 2015, 13 (Suppl. 1), S4–S38. [Google Scholar] [CrossRef]


| Device Name | Device Type | Measurement Strategy | PPG Technicalities | Battery Life |
|---|---|---|---|---|
| Fitbit Versa® 2 | Wrist-worn wearable | PPG Accelerometer | Contact PPG Red LED Reflective | 4+ days |
| Garmin Fēnix® 5X Plus | Wrist-worn wearable | PPG Accelerometer Gyroscope | Contact PPG Green LED Reflective | ≤20 days |
| Polar Ignite® | Wrist-worn wearable | PPG Accelerometer | Contact PPG Green LED Reflective | ≤5 days |
| N | TIB (min) | TST (min) | SS (min) | SE (%) | WASO (min) | |||
|---|---|---|---|---|---|---|---|---|
| REM | Deep | Light | ||||||
| Fitbit Versa® 2 | 29 | 463.1 ± 53.0 | 423.8 ± 45.6 | 89.9 ± 29.7 | 77.8 ± 18.0 | 254.6 ± 40.8 | 88.2 ± 1.9 | 55.9 ± 11.8 |
| Garmin Fēnix® 5X Plus | 30 | 478.3 ± 47.0 | 472.6 ± 45.9 | 122.8 ± 43.2 | 65.9 ± 32.6 | 283.2 ± 35.9 | 98.7 ± 1.3 | 6.4 ± 6.8 |
| Polar Ignite® | 30 | 459.3 ± 48.8 | 430.2 ± 45.4 | 102.4 ± 18.8 | 78.0 ± 20.6 | 245.0 ± 37.8 | 93.6 ± 2.4 | 29.1 ± 11.3 |
| Sleep Diary | 30 | 491.6 ± 58.5 | 446.2 ± 47.7 | not available | 91.1 ± 5.9 | 6.4 ± 7.3 | ||
Publisher’s Note: MDPI stays neutral with regard to jurisdictional claims in published maps and institutional affiliations. |
© 2022 by the authors. Licensee MDPI, Basel, Switzerland. This article is an open access article distributed under the terms and conditions of the Creative Commons Attribution (CC BY) license (https://creativecommons.org/licenses/by/4.0/).
Share and Cite
Klier, K.; Wagner, M. Agreement of Sleep Measures—A Comparison between a Sleep Diary and Three Consumer Wearable Devices. Sensors 2022, 22, 6189. https://doi.org/10.3390/s22166189
Klier K, Wagner M. Agreement of Sleep Measures—A Comparison between a Sleep Diary and Three Consumer Wearable Devices. Sensors. 2022; 22(16):6189. https://doi.org/10.3390/s22166189
Chicago/Turabian StyleKlier, Kristina, and Matthias Wagner. 2022. "Agreement of Sleep Measures—A Comparison between a Sleep Diary and Three Consumer Wearable Devices" Sensors 22, no. 16: 6189. https://doi.org/10.3390/s22166189
APA StyleKlier, K., & Wagner, M. (2022). Agreement of Sleep Measures—A Comparison between a Sleep Diary and Three Consumer Wearable Devices. Sensors, 22(16), 6189. https://doi.org/10.3390/s22166189