
A Circular-Based Reference Point Extraction Method for Correcting the Alignment of Round Parts


Abstract
1. Introduction
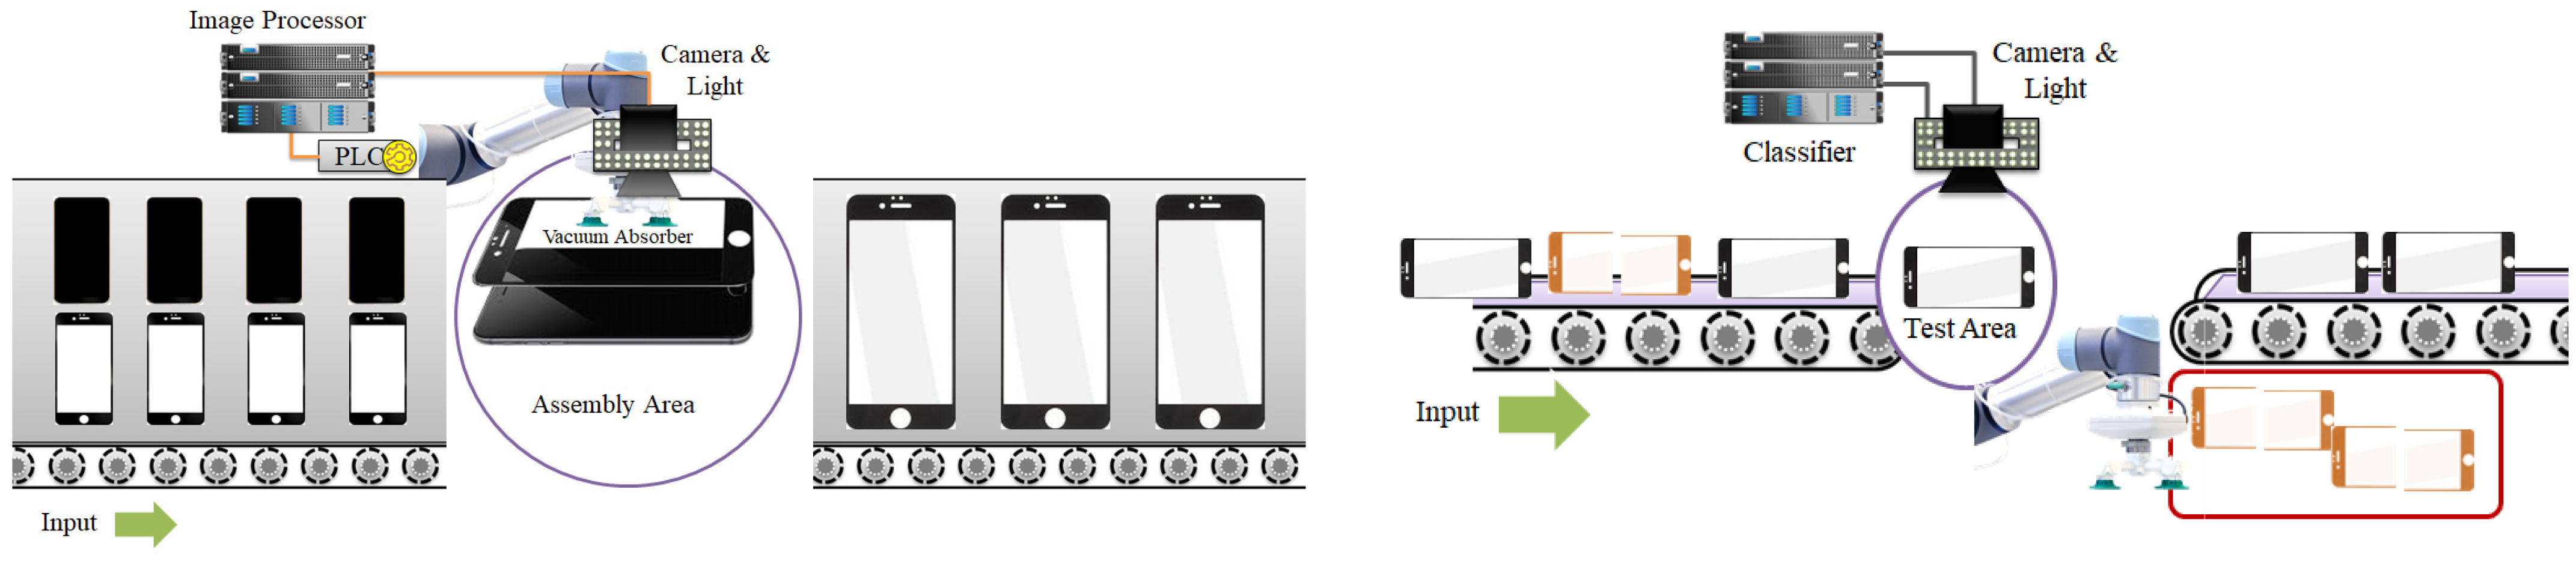
2. Structure of the Assembly and Inspection Process System
- Lighting module: This module adjusts the amount of light. When a product is placed in the shooting area, the module provides the required level of light for shooting and is controlled by the inspector/image processing module.
- Camera module: When a product is placed in the classifier or image processor inspection area, this module captures the product and sends the image to the classifier or image processor module.
- Classifier or image processing module: This module receives an image for reading from the camera module and sends the control information to the PLC after calculating the quality of the product or the alignment correction value using the received image.
- PLC module: This module receives the image reception and image shooting information from the classifier or image processor module and lighting module, and controls the motor on the basis of the information received from the classifier or image processor module.
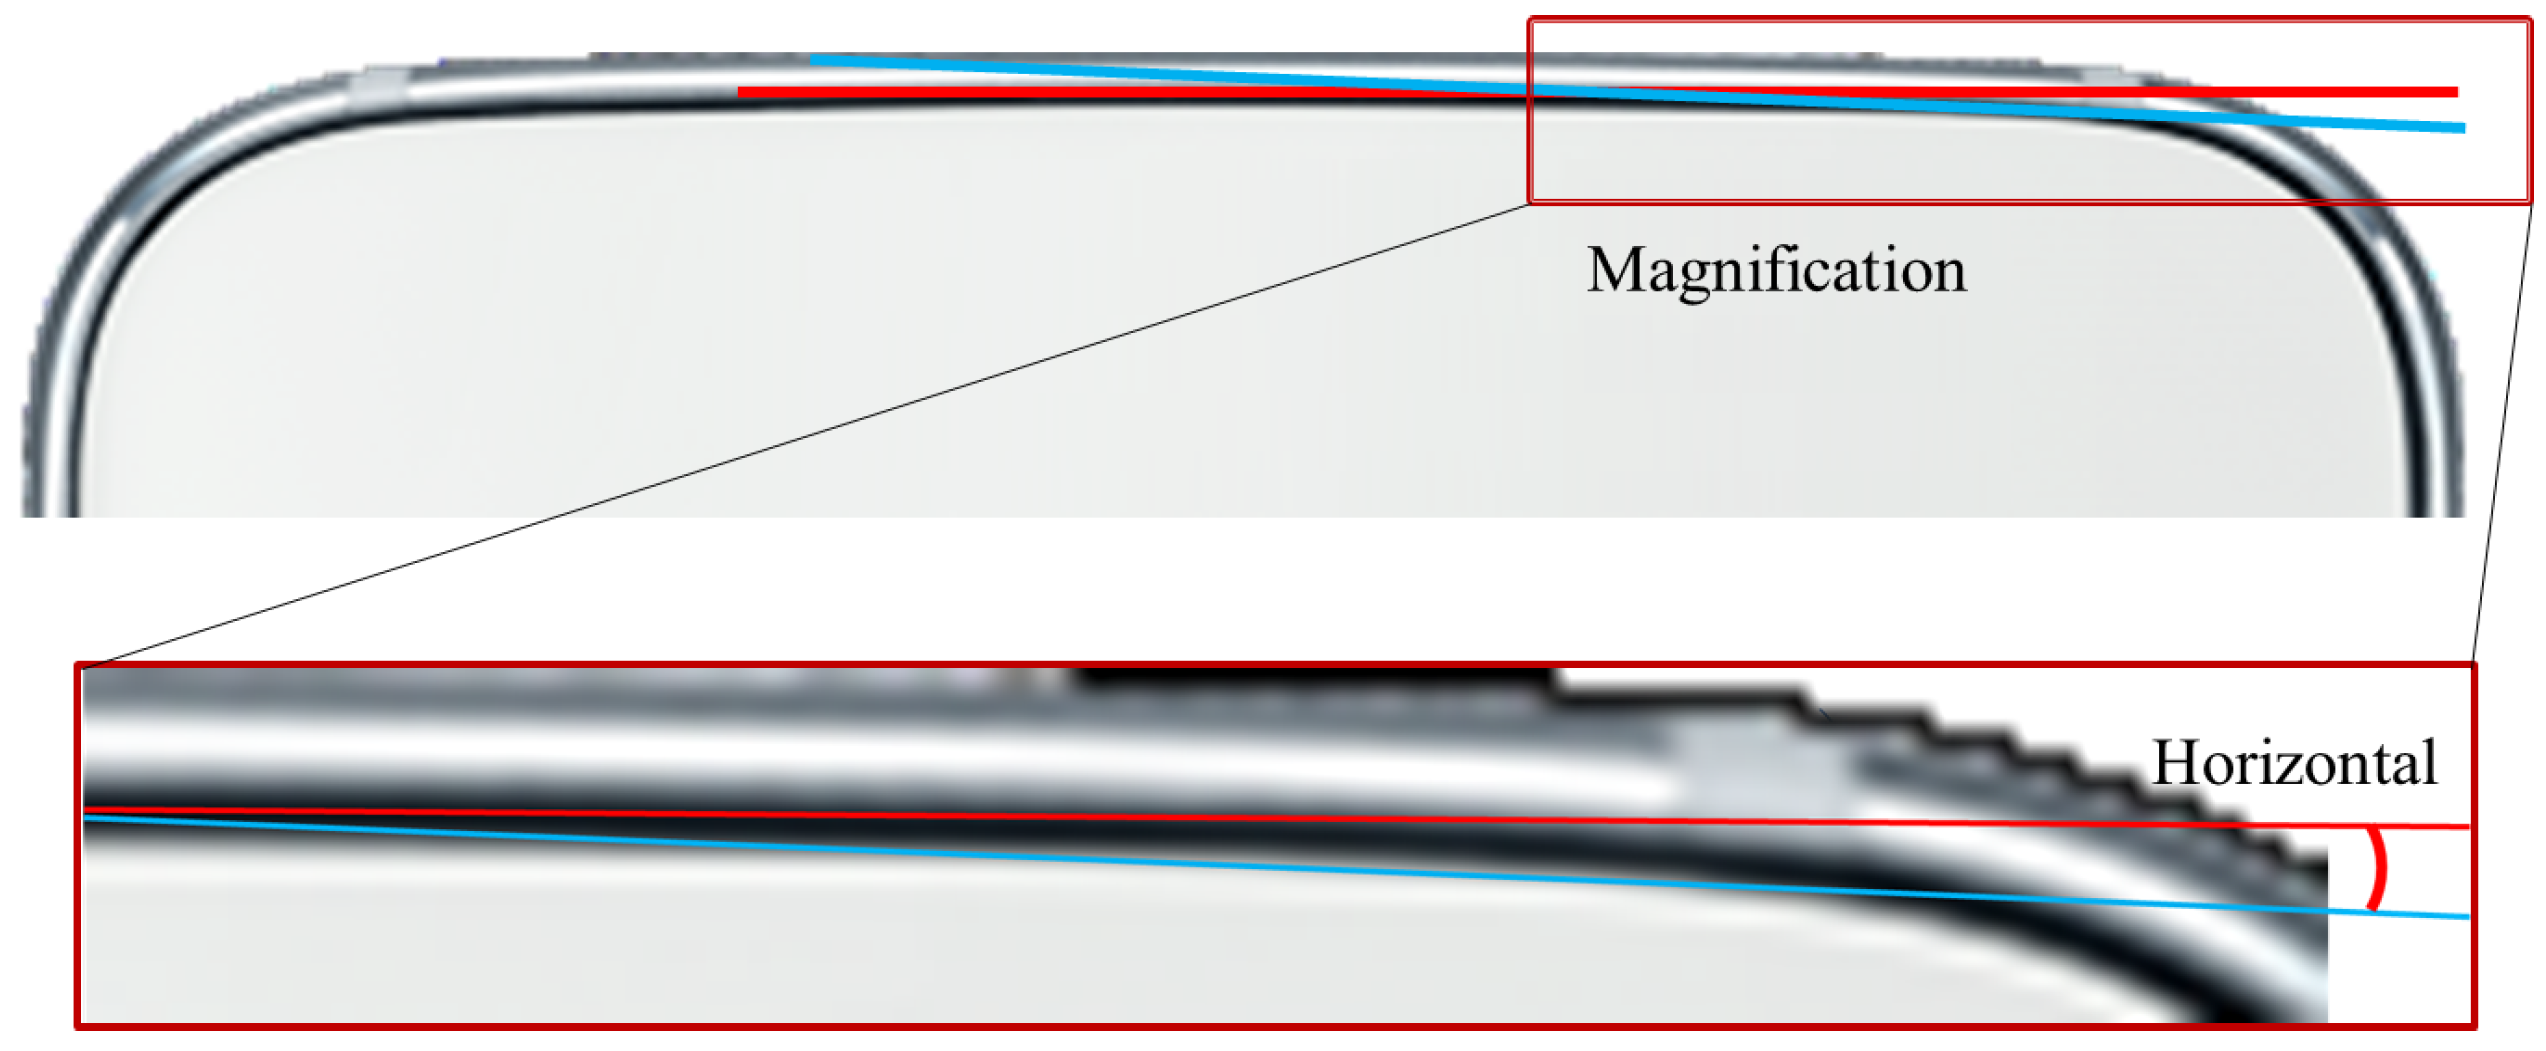
3. Circle-Based Reference Point Extraction Method for the Correcting the Alignment of Round Parts
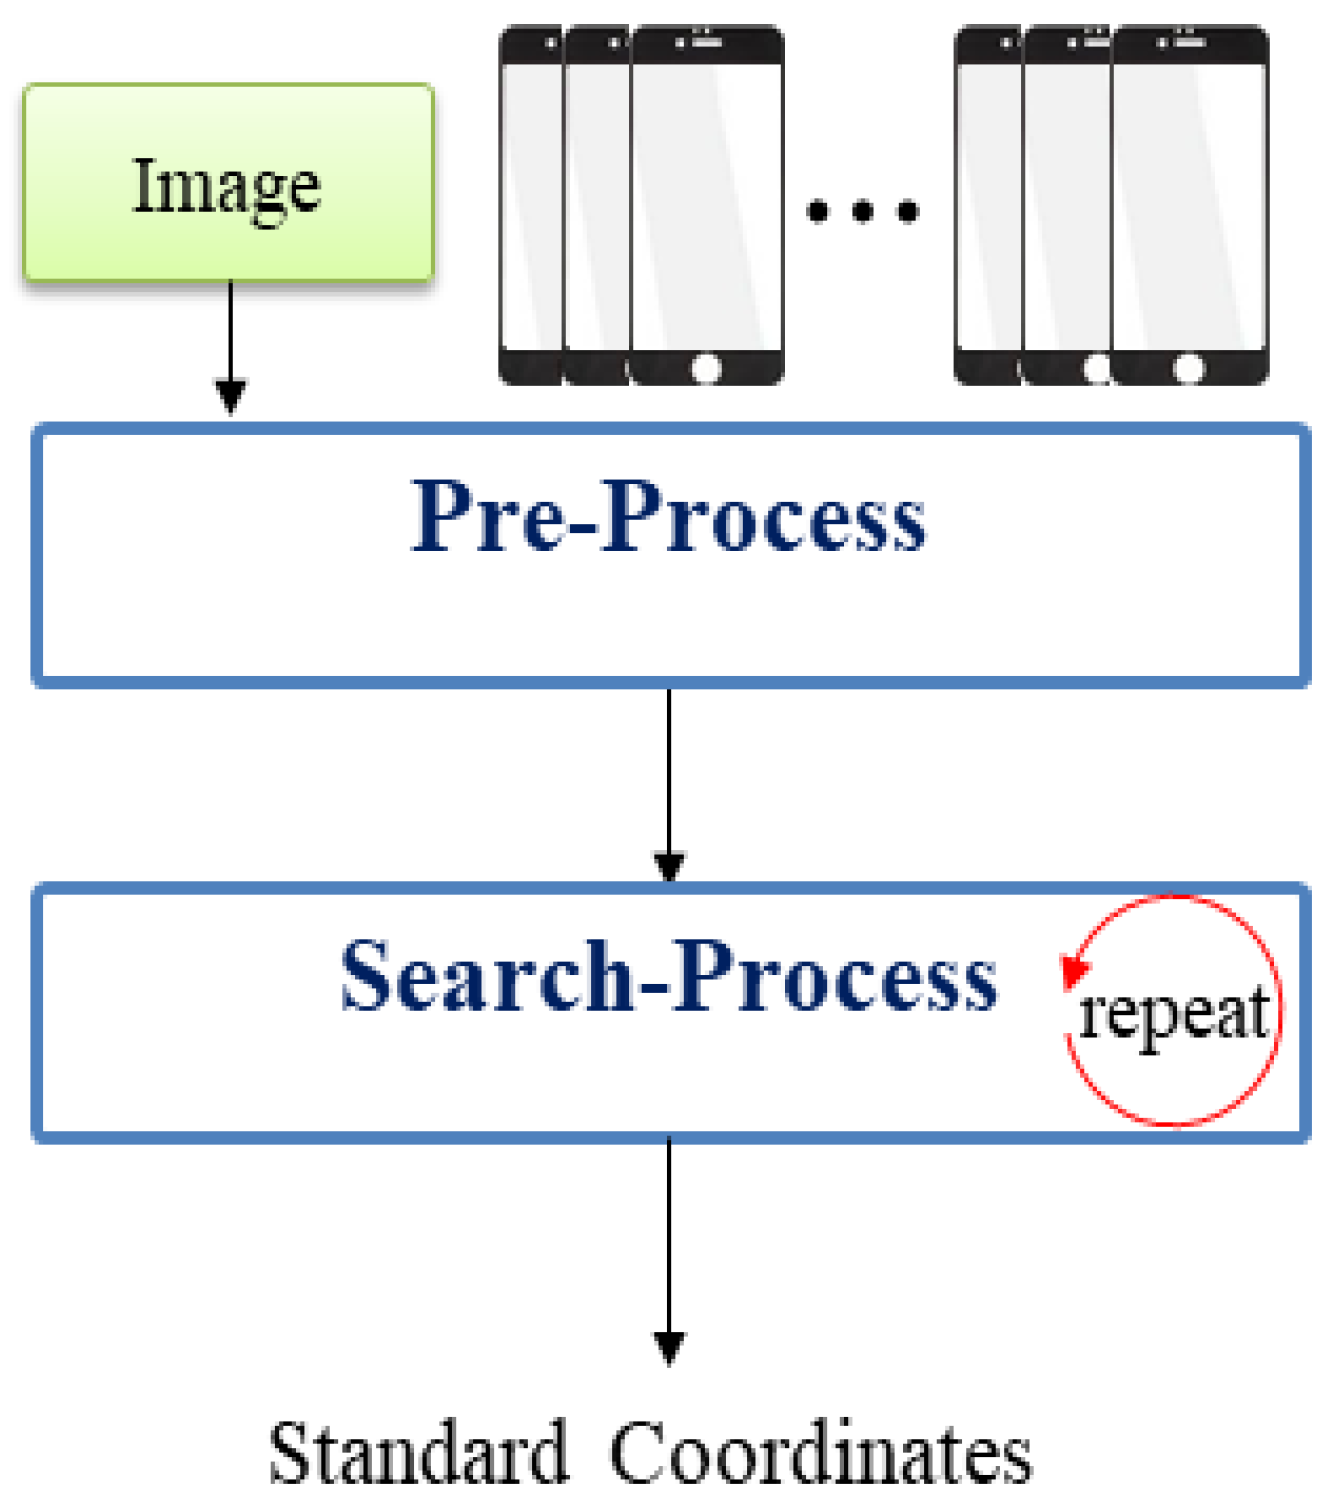
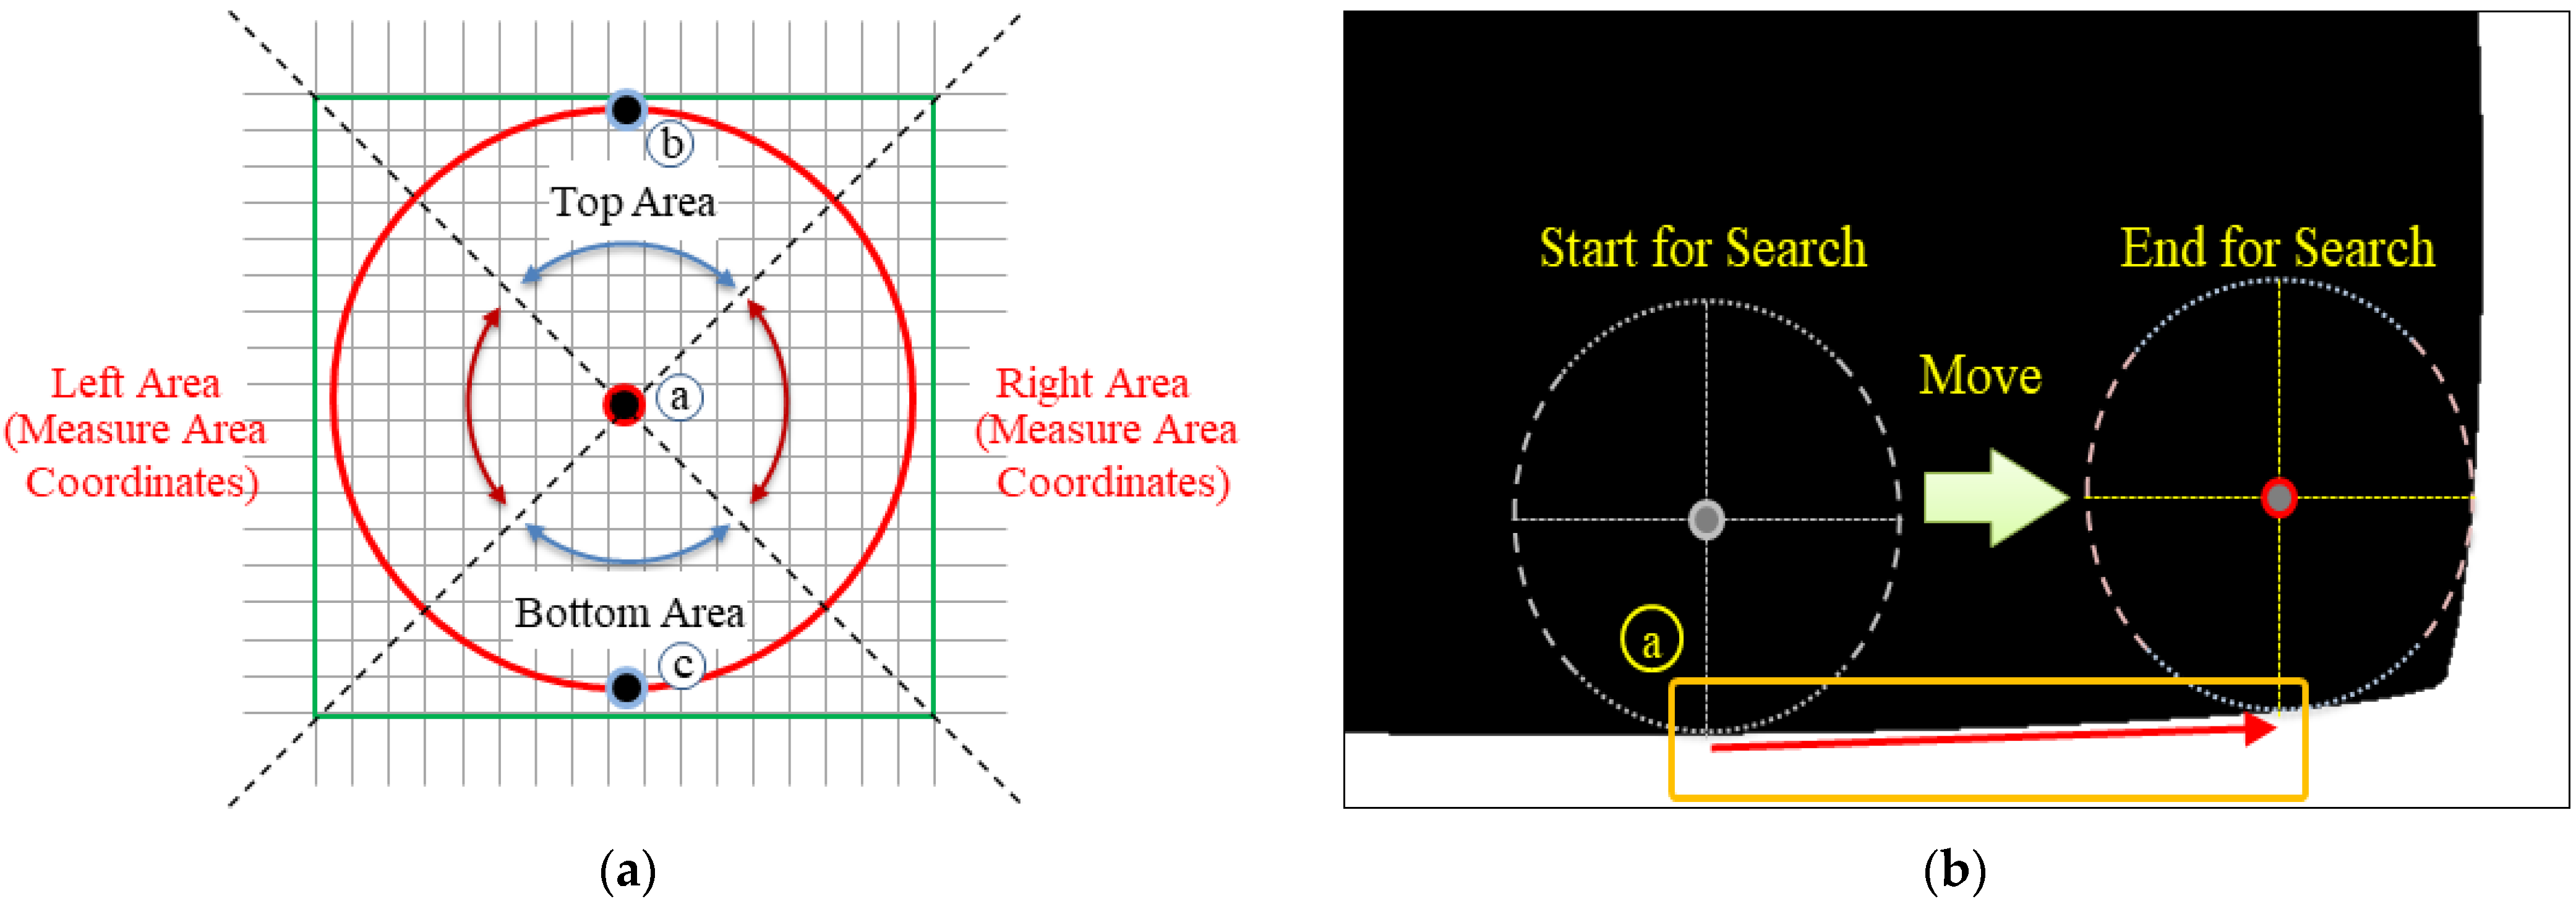
3.1. Concept of the Proposed Algorithm
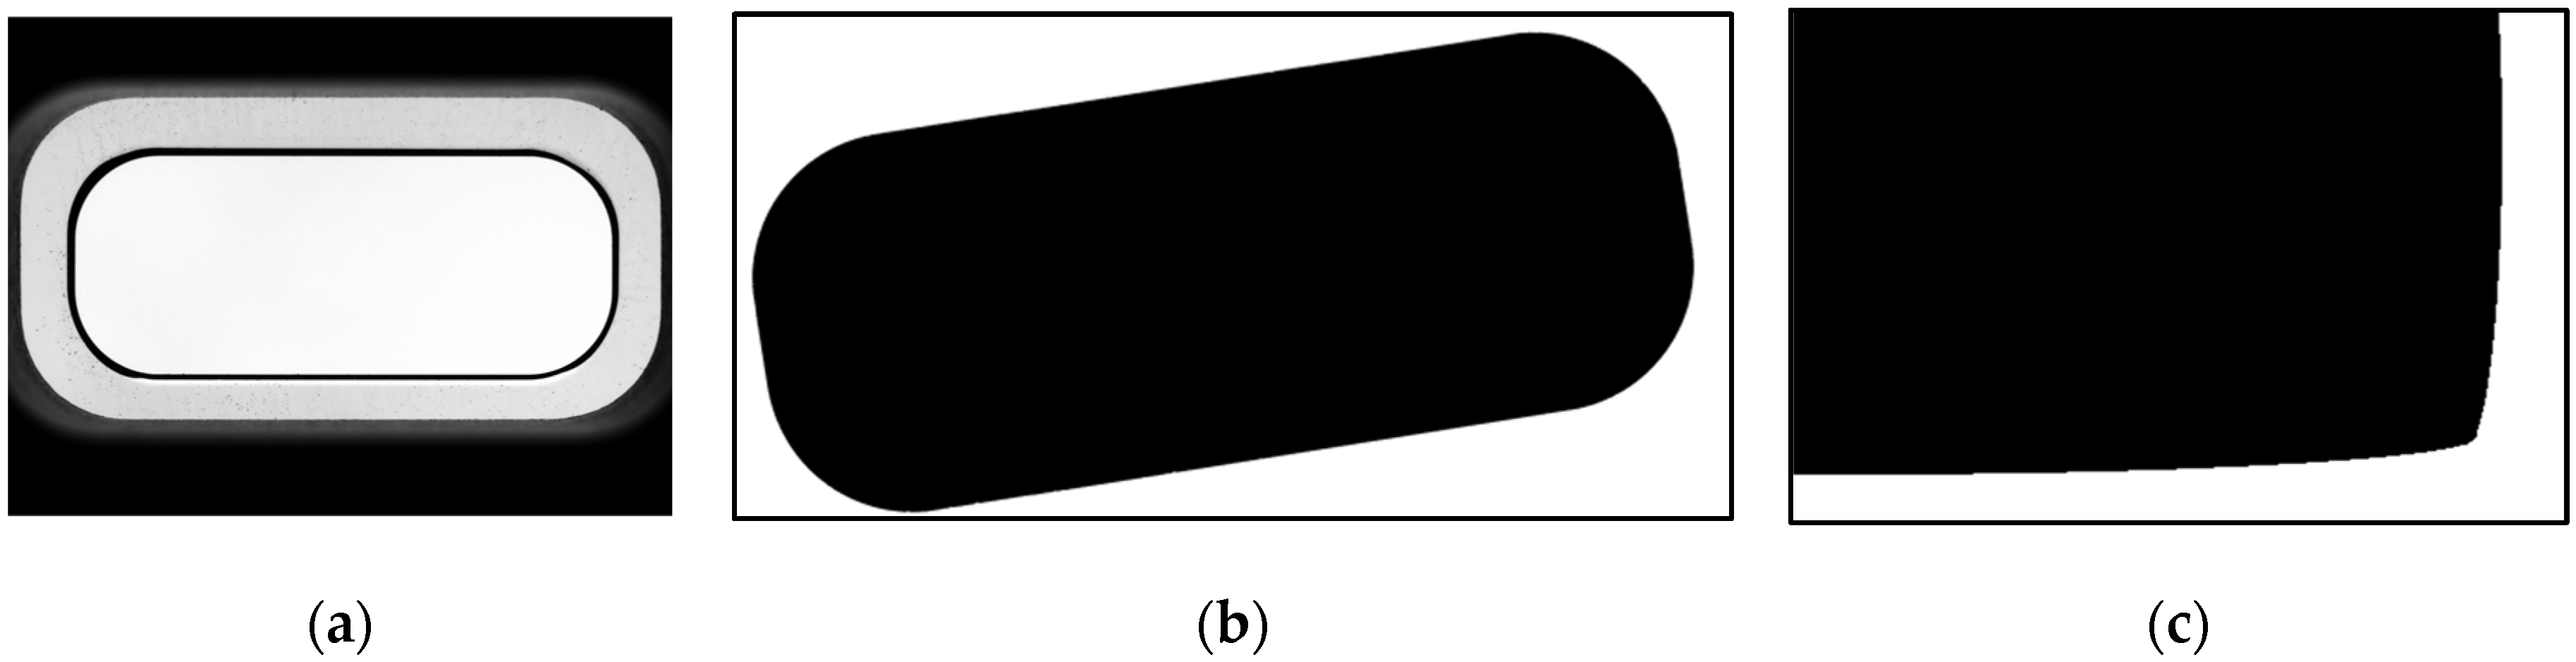
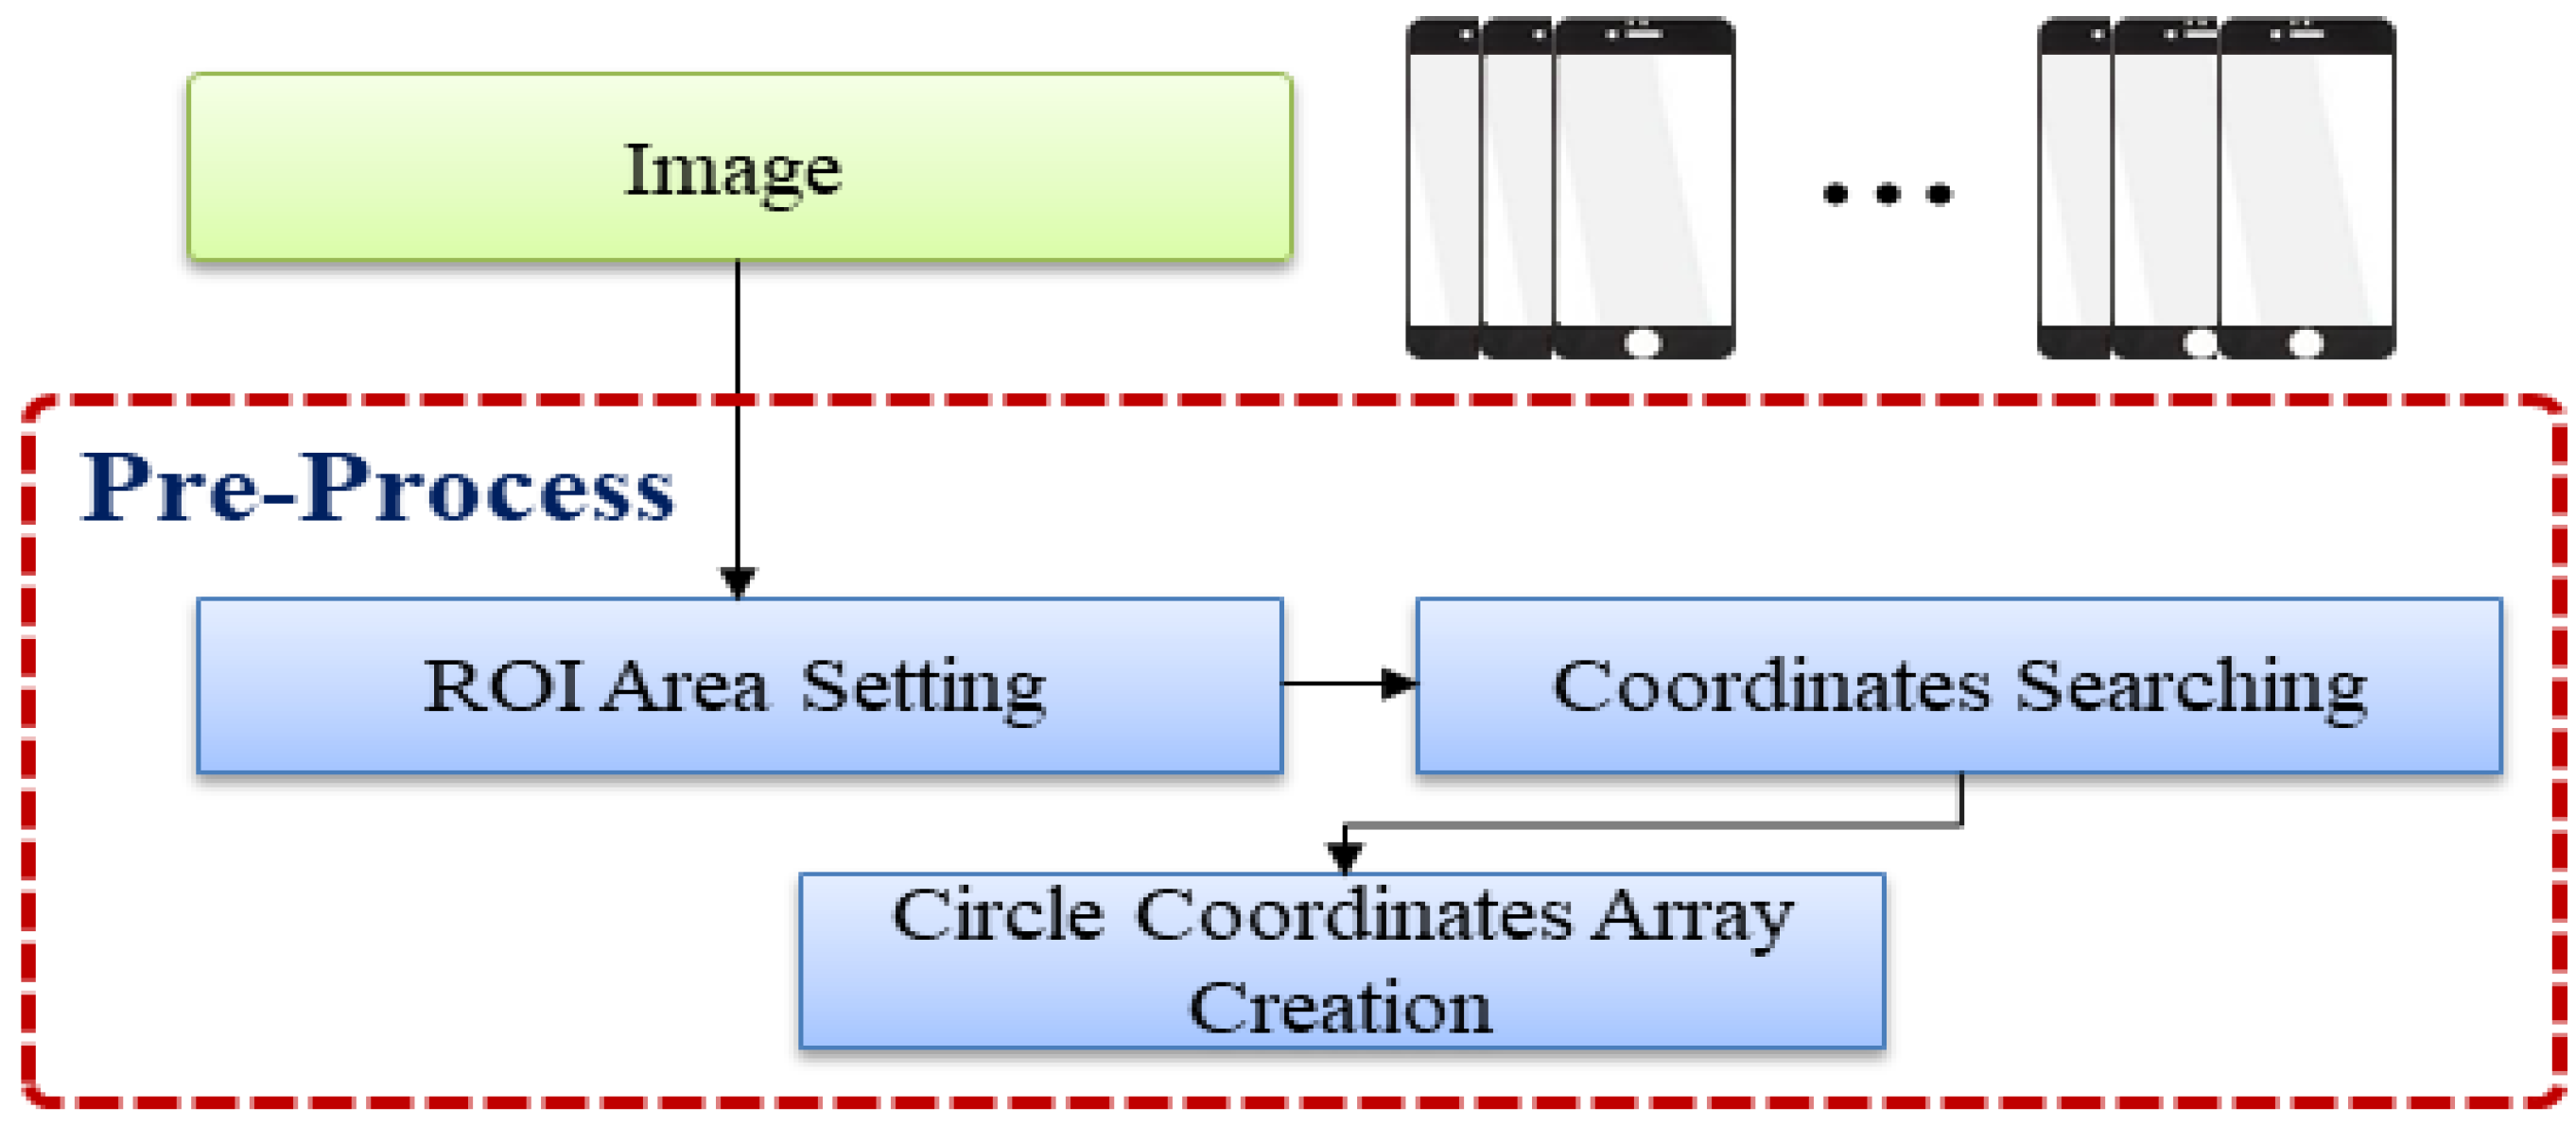
3.2. Preprocessing
- (1)
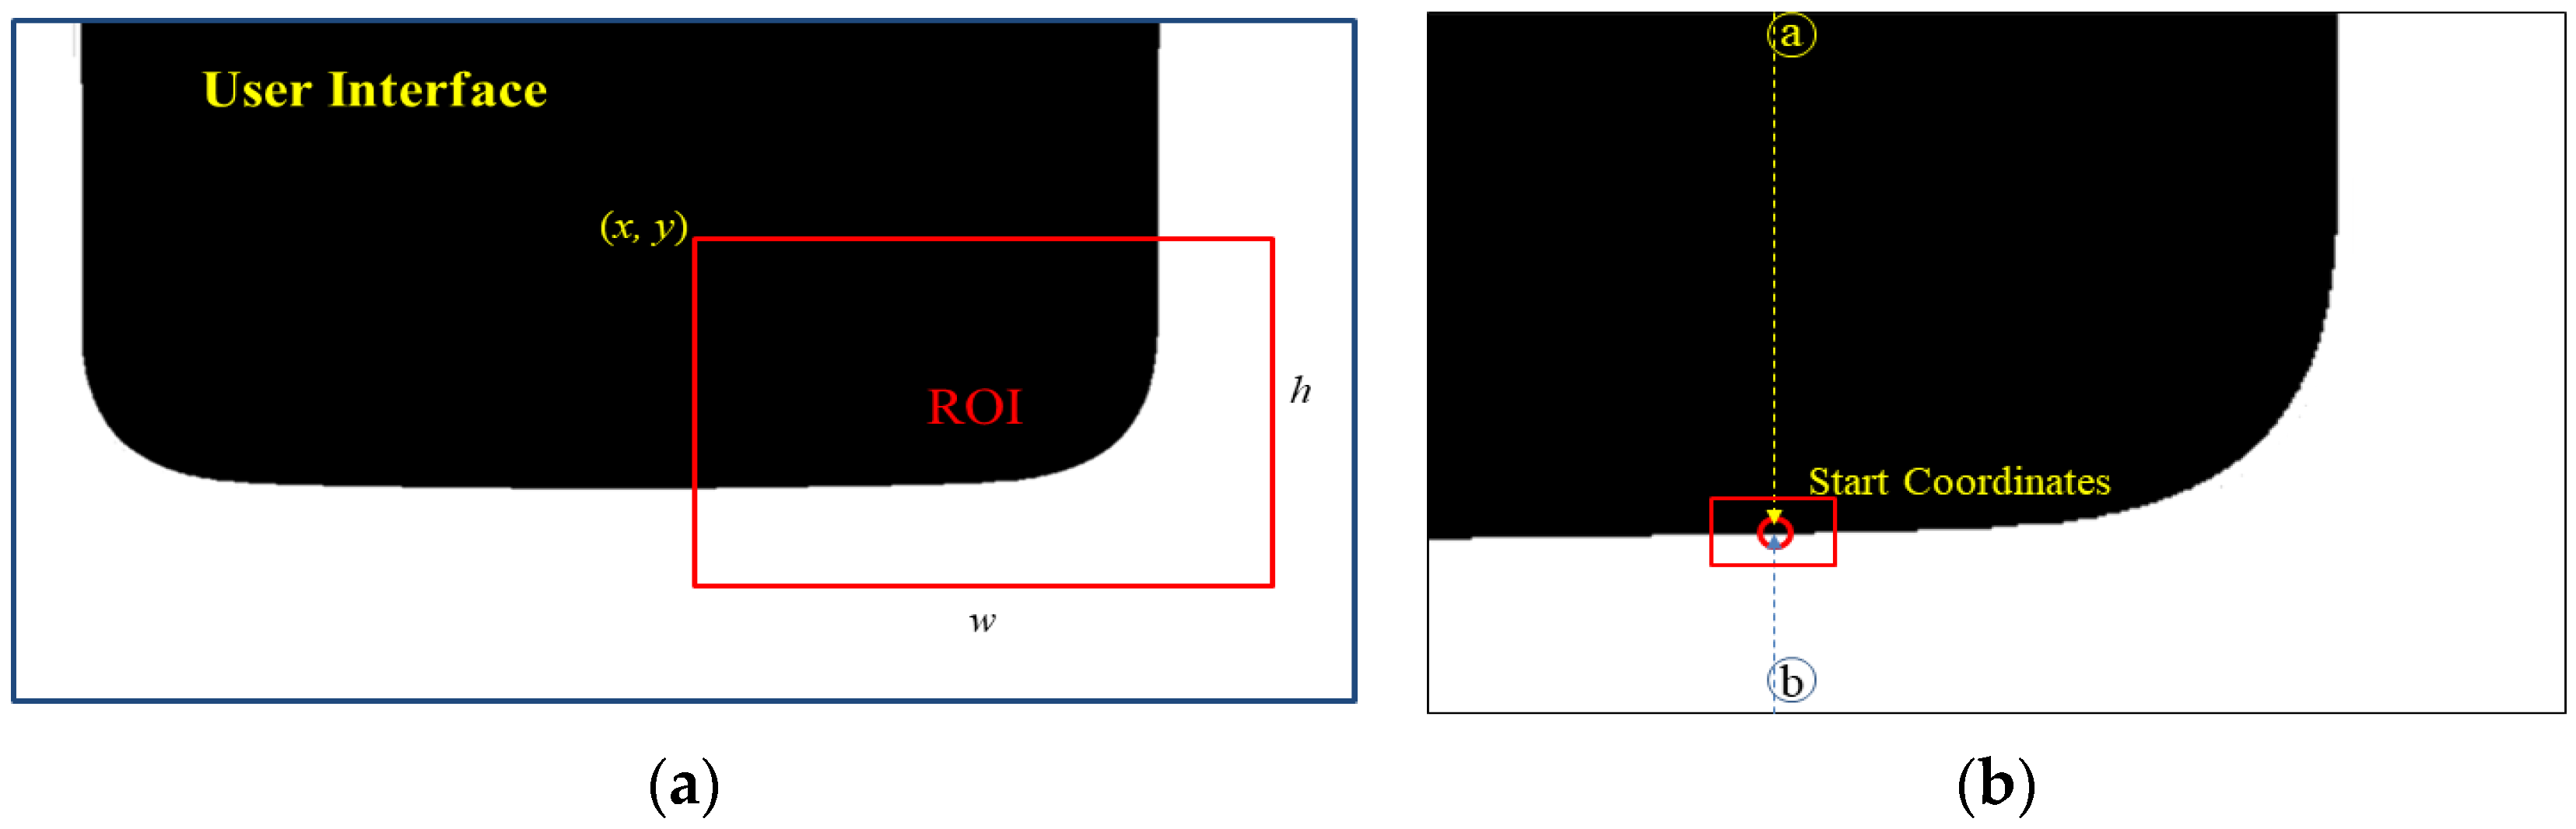
- ROI Area Setting
- (2)
- Starting Point Search
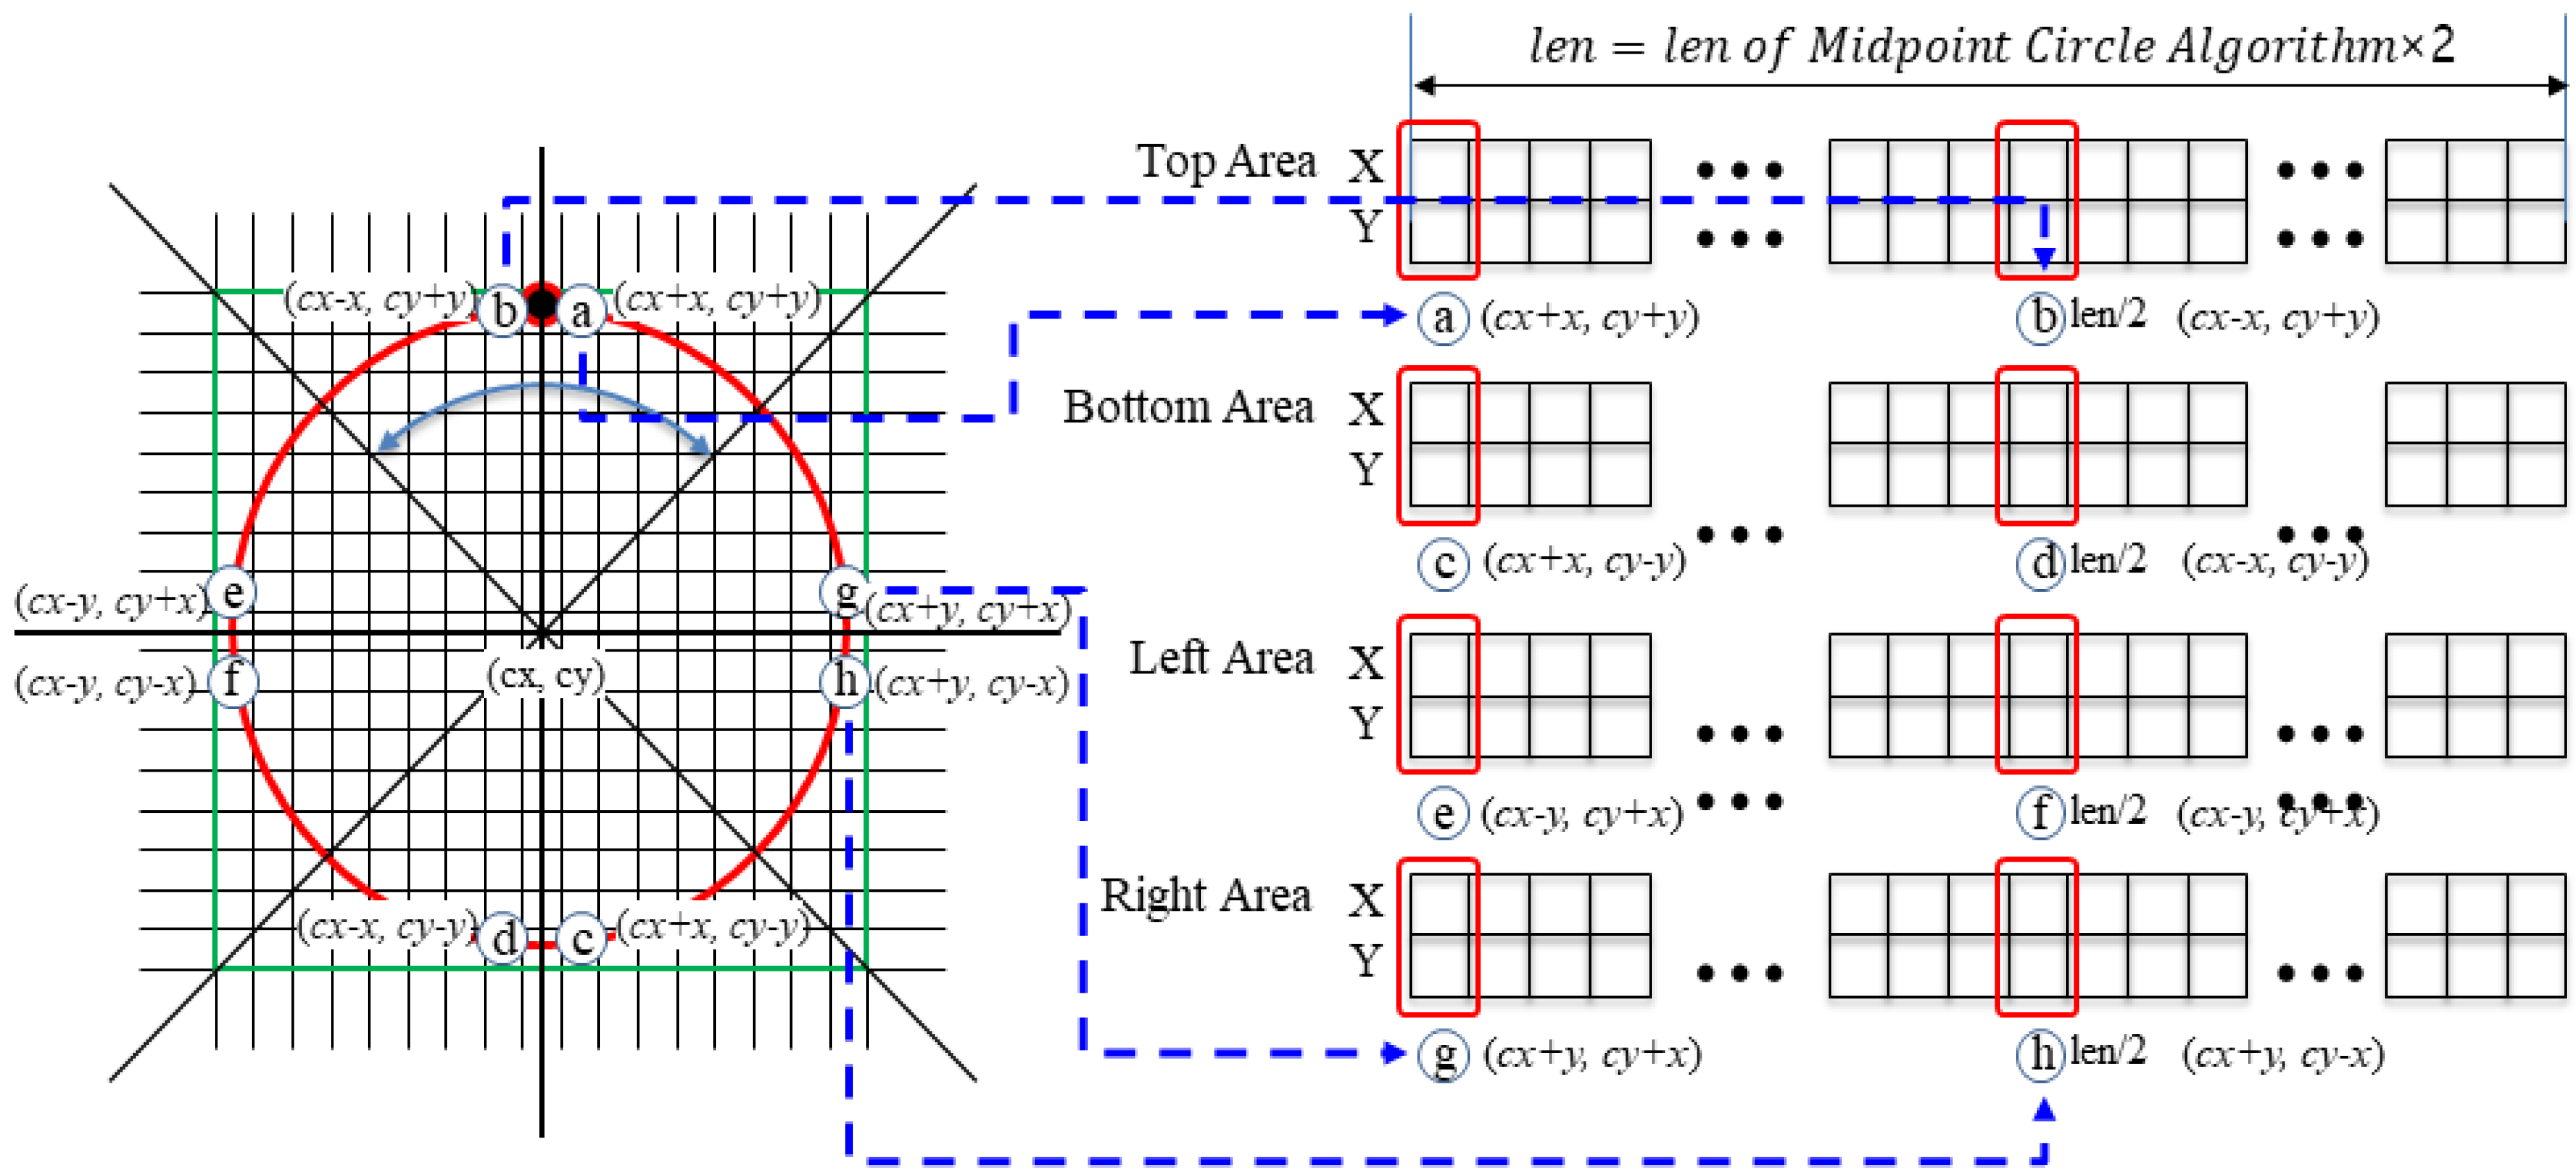
- (3)
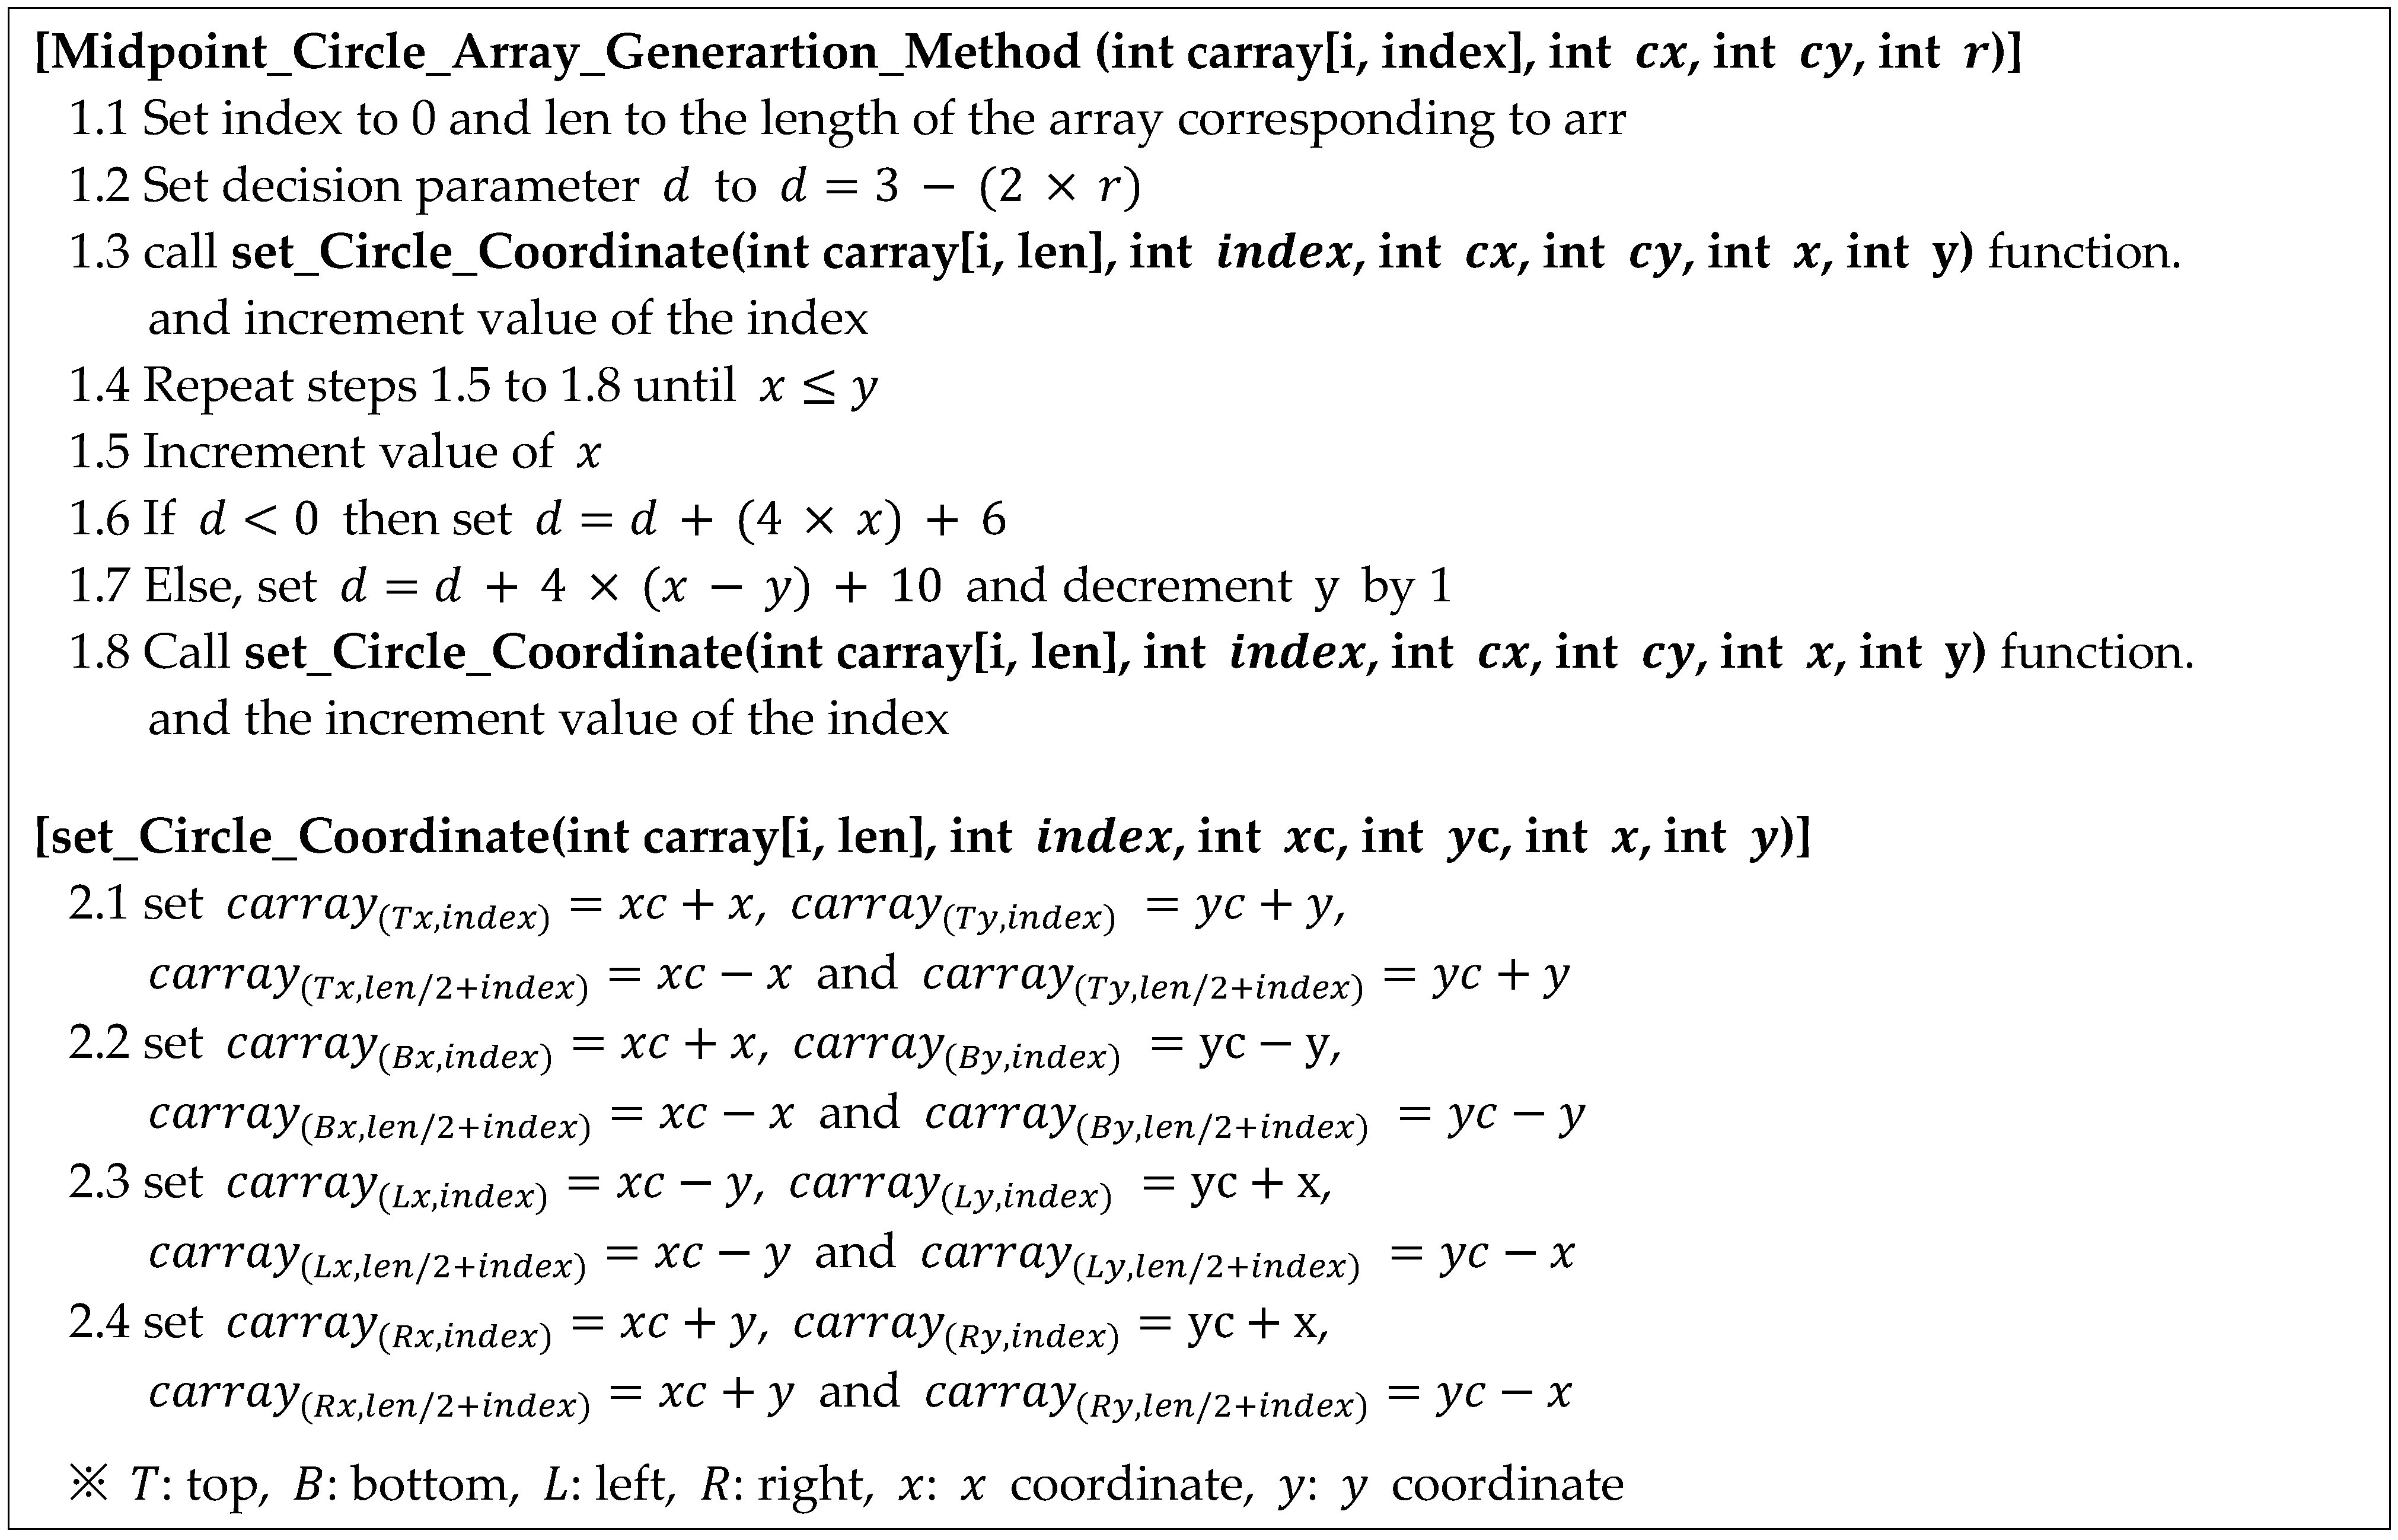
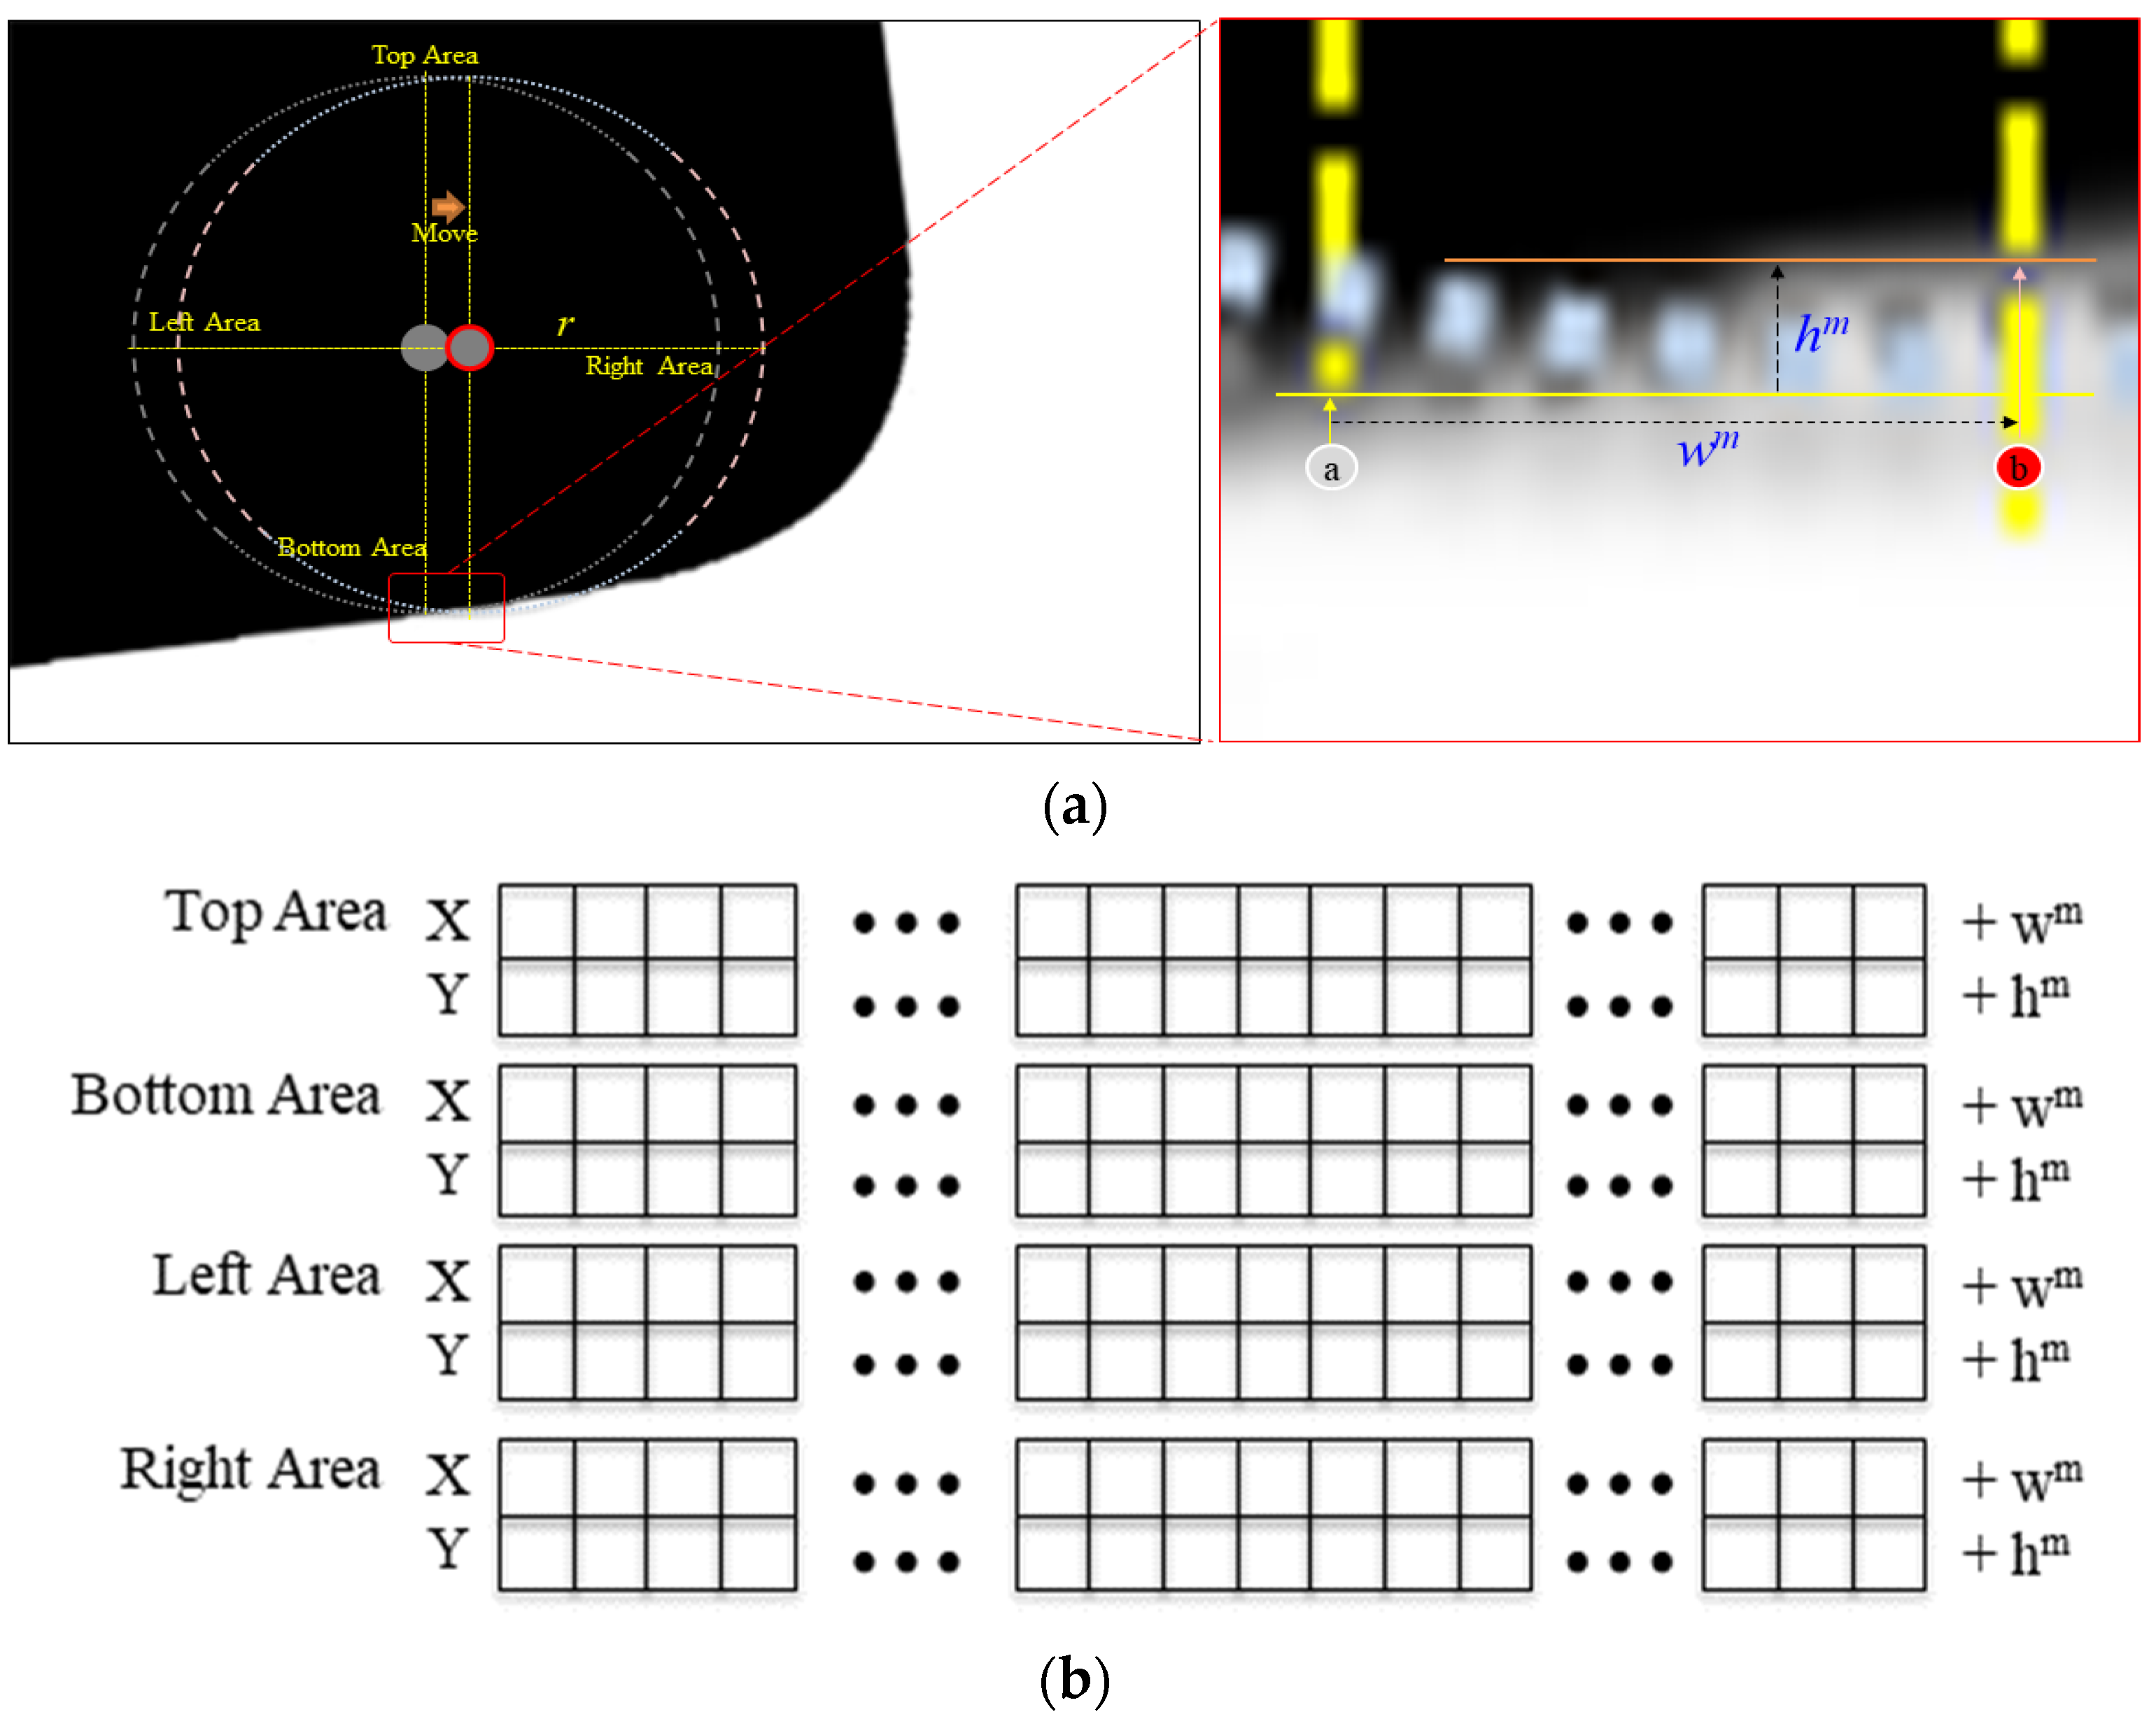
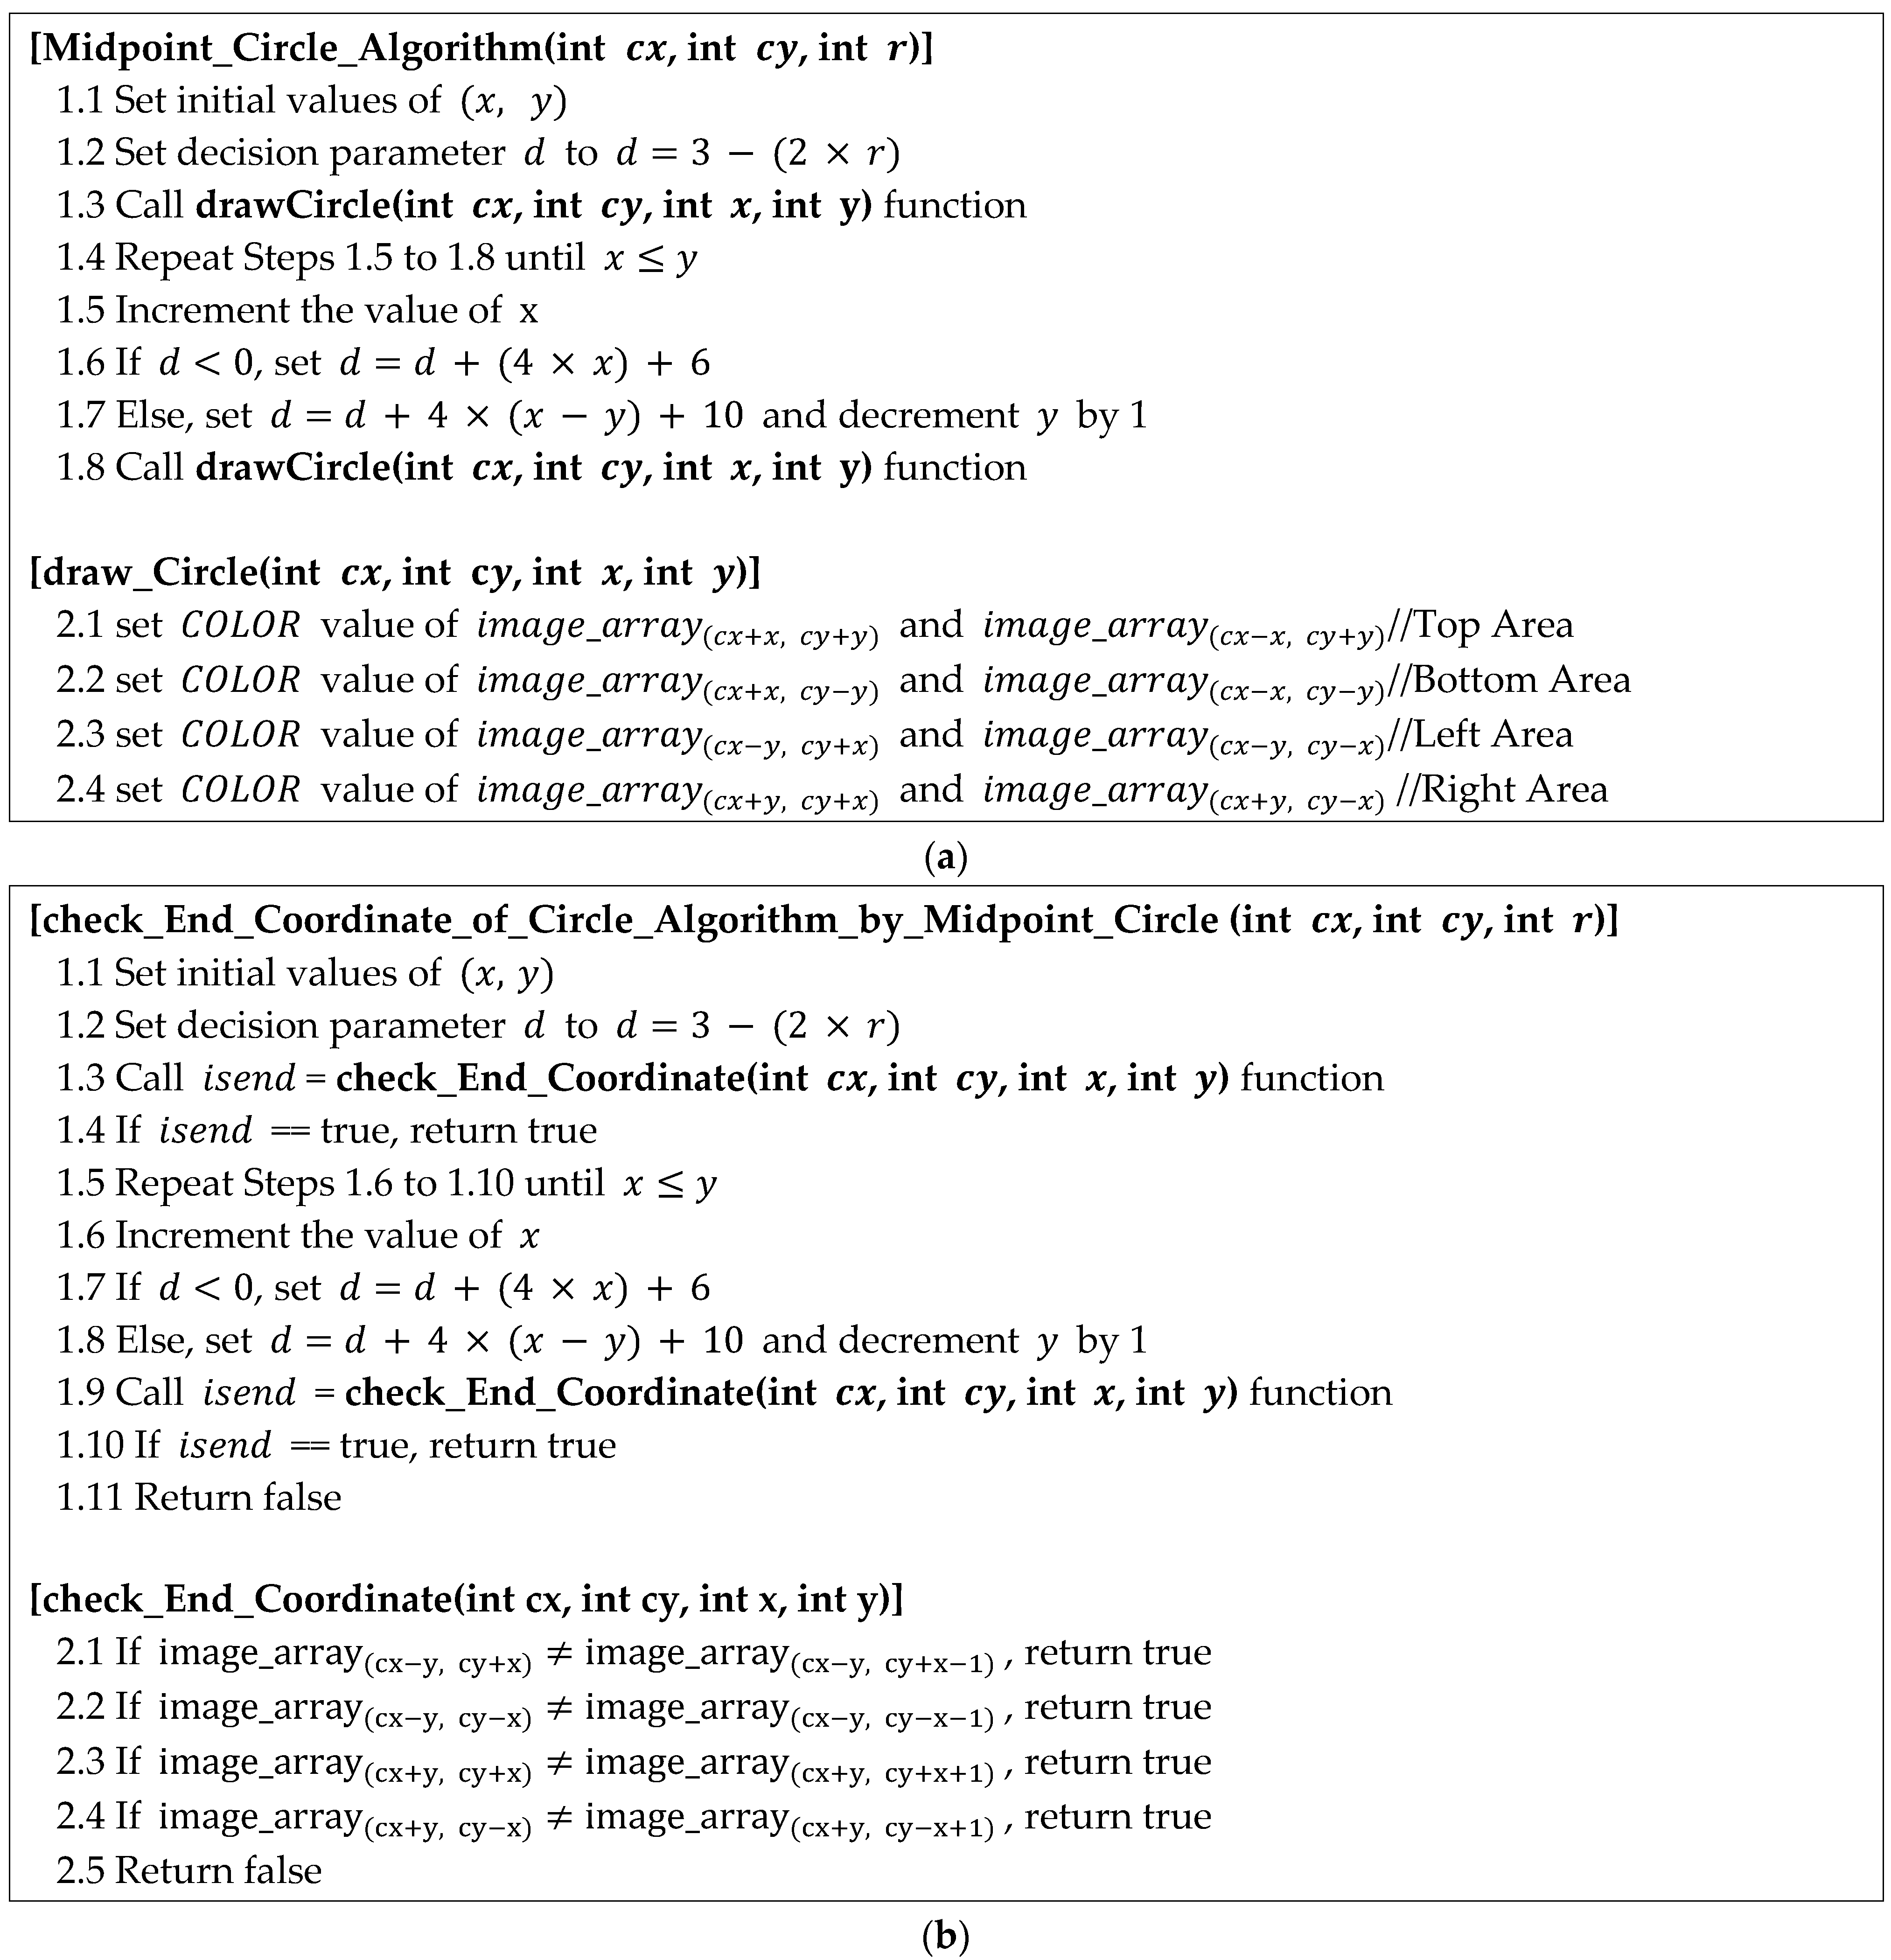
- Circular Coordinate Array Generation
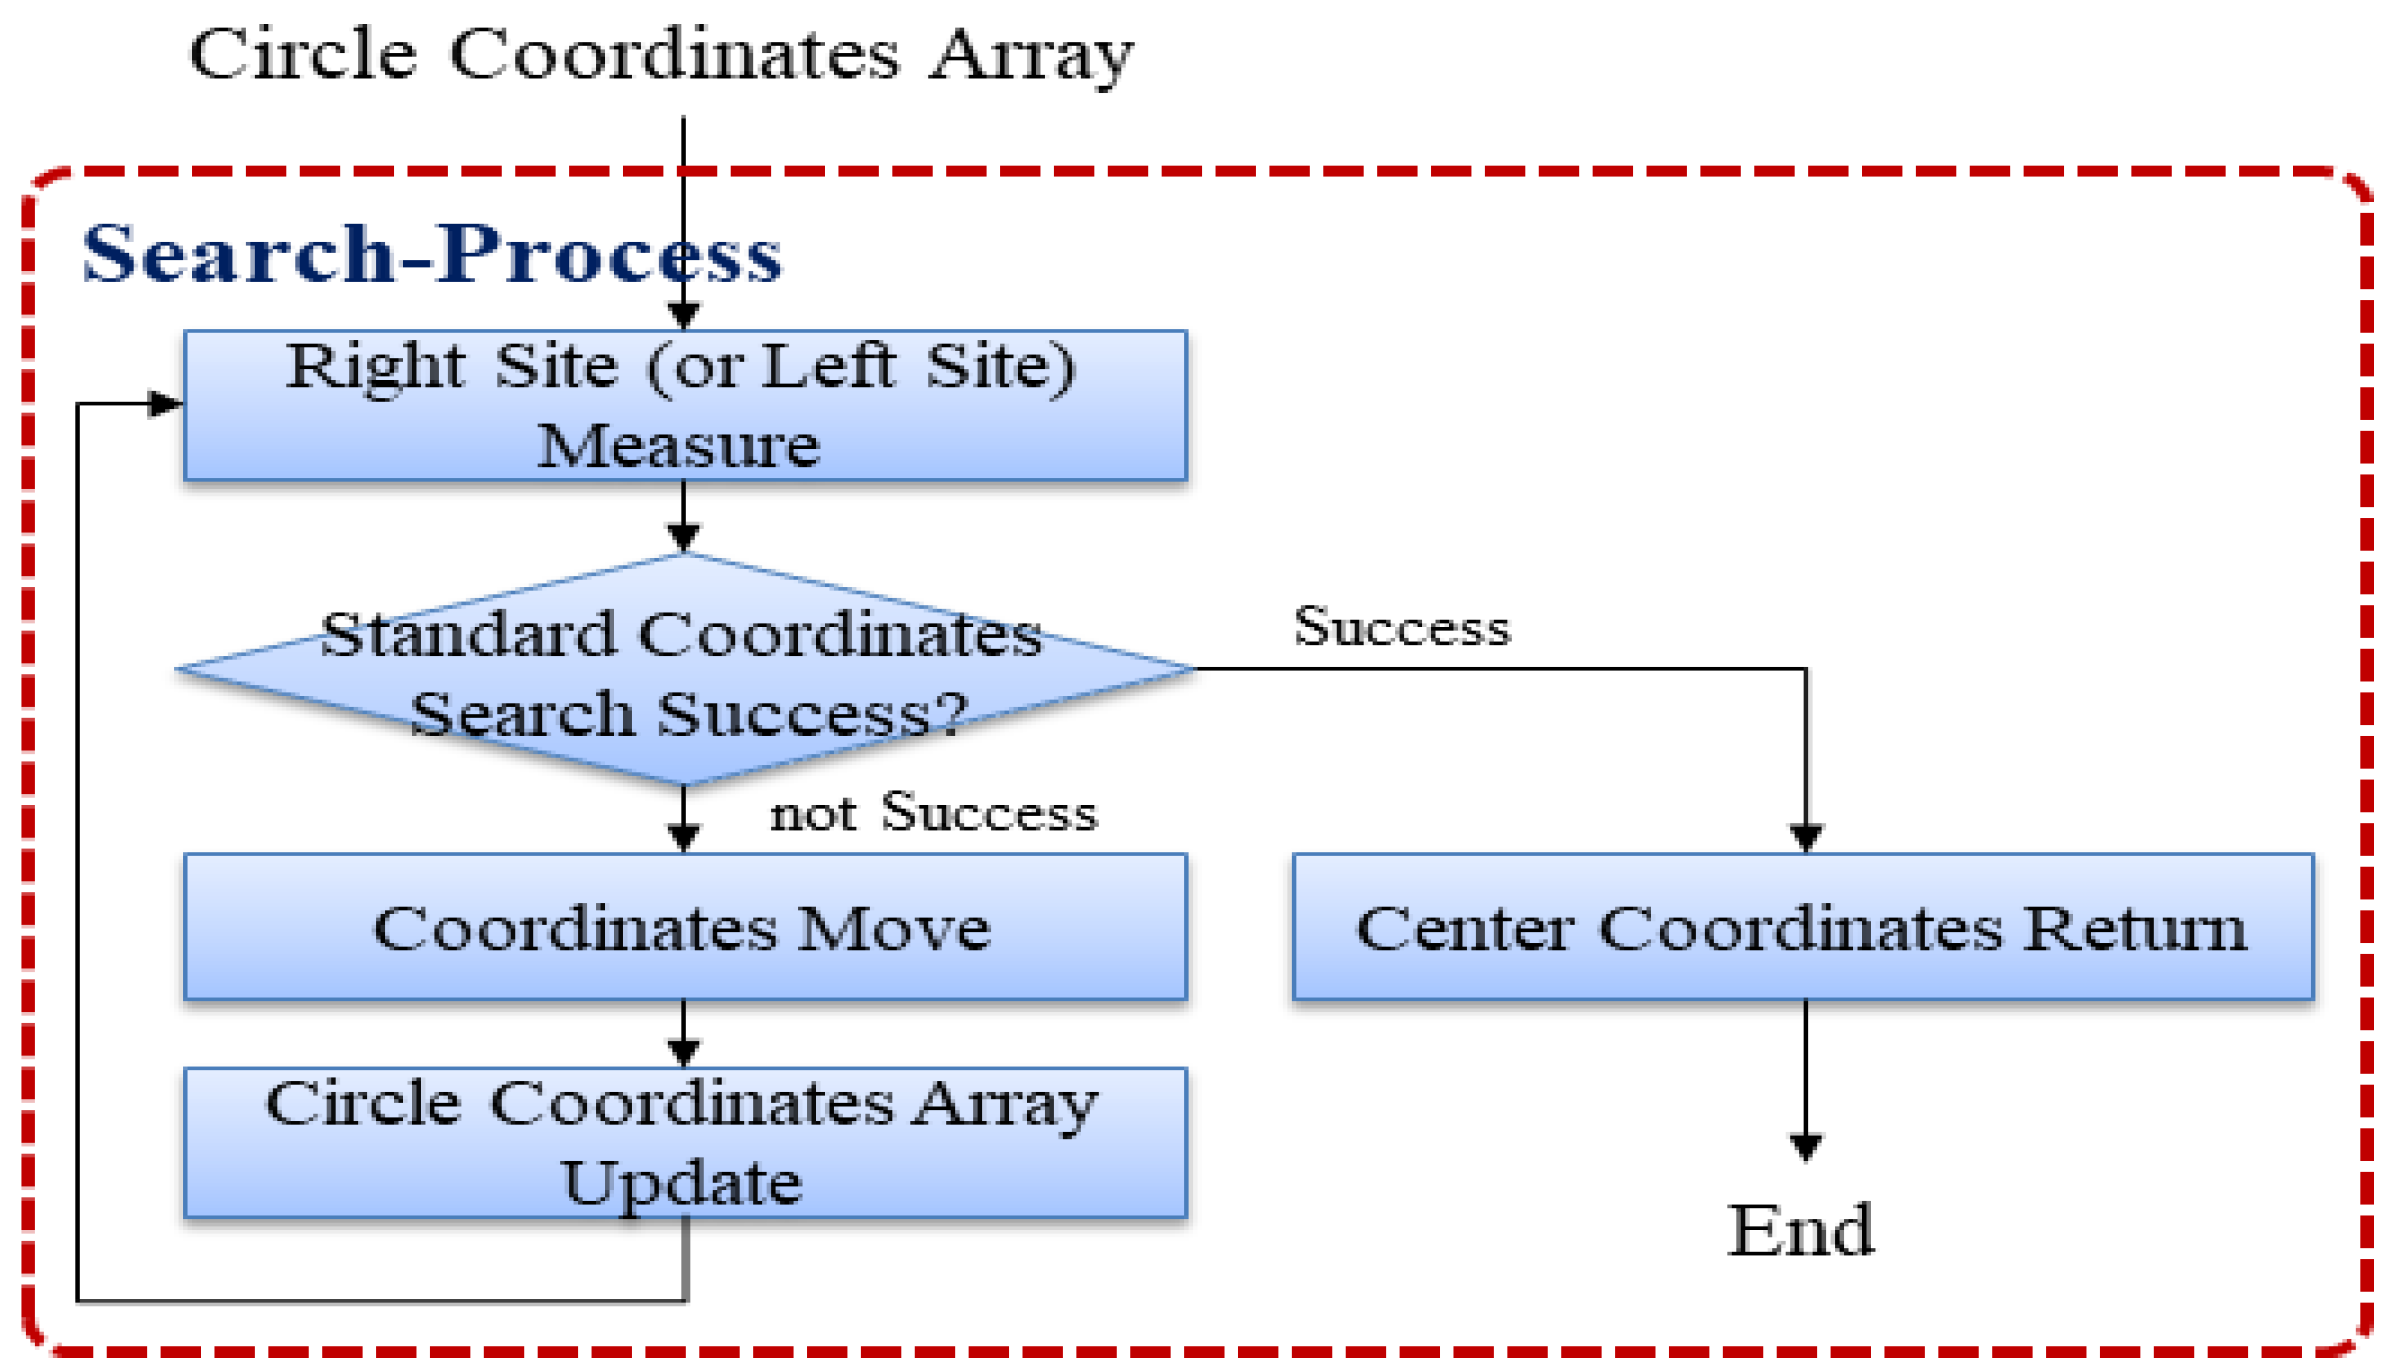
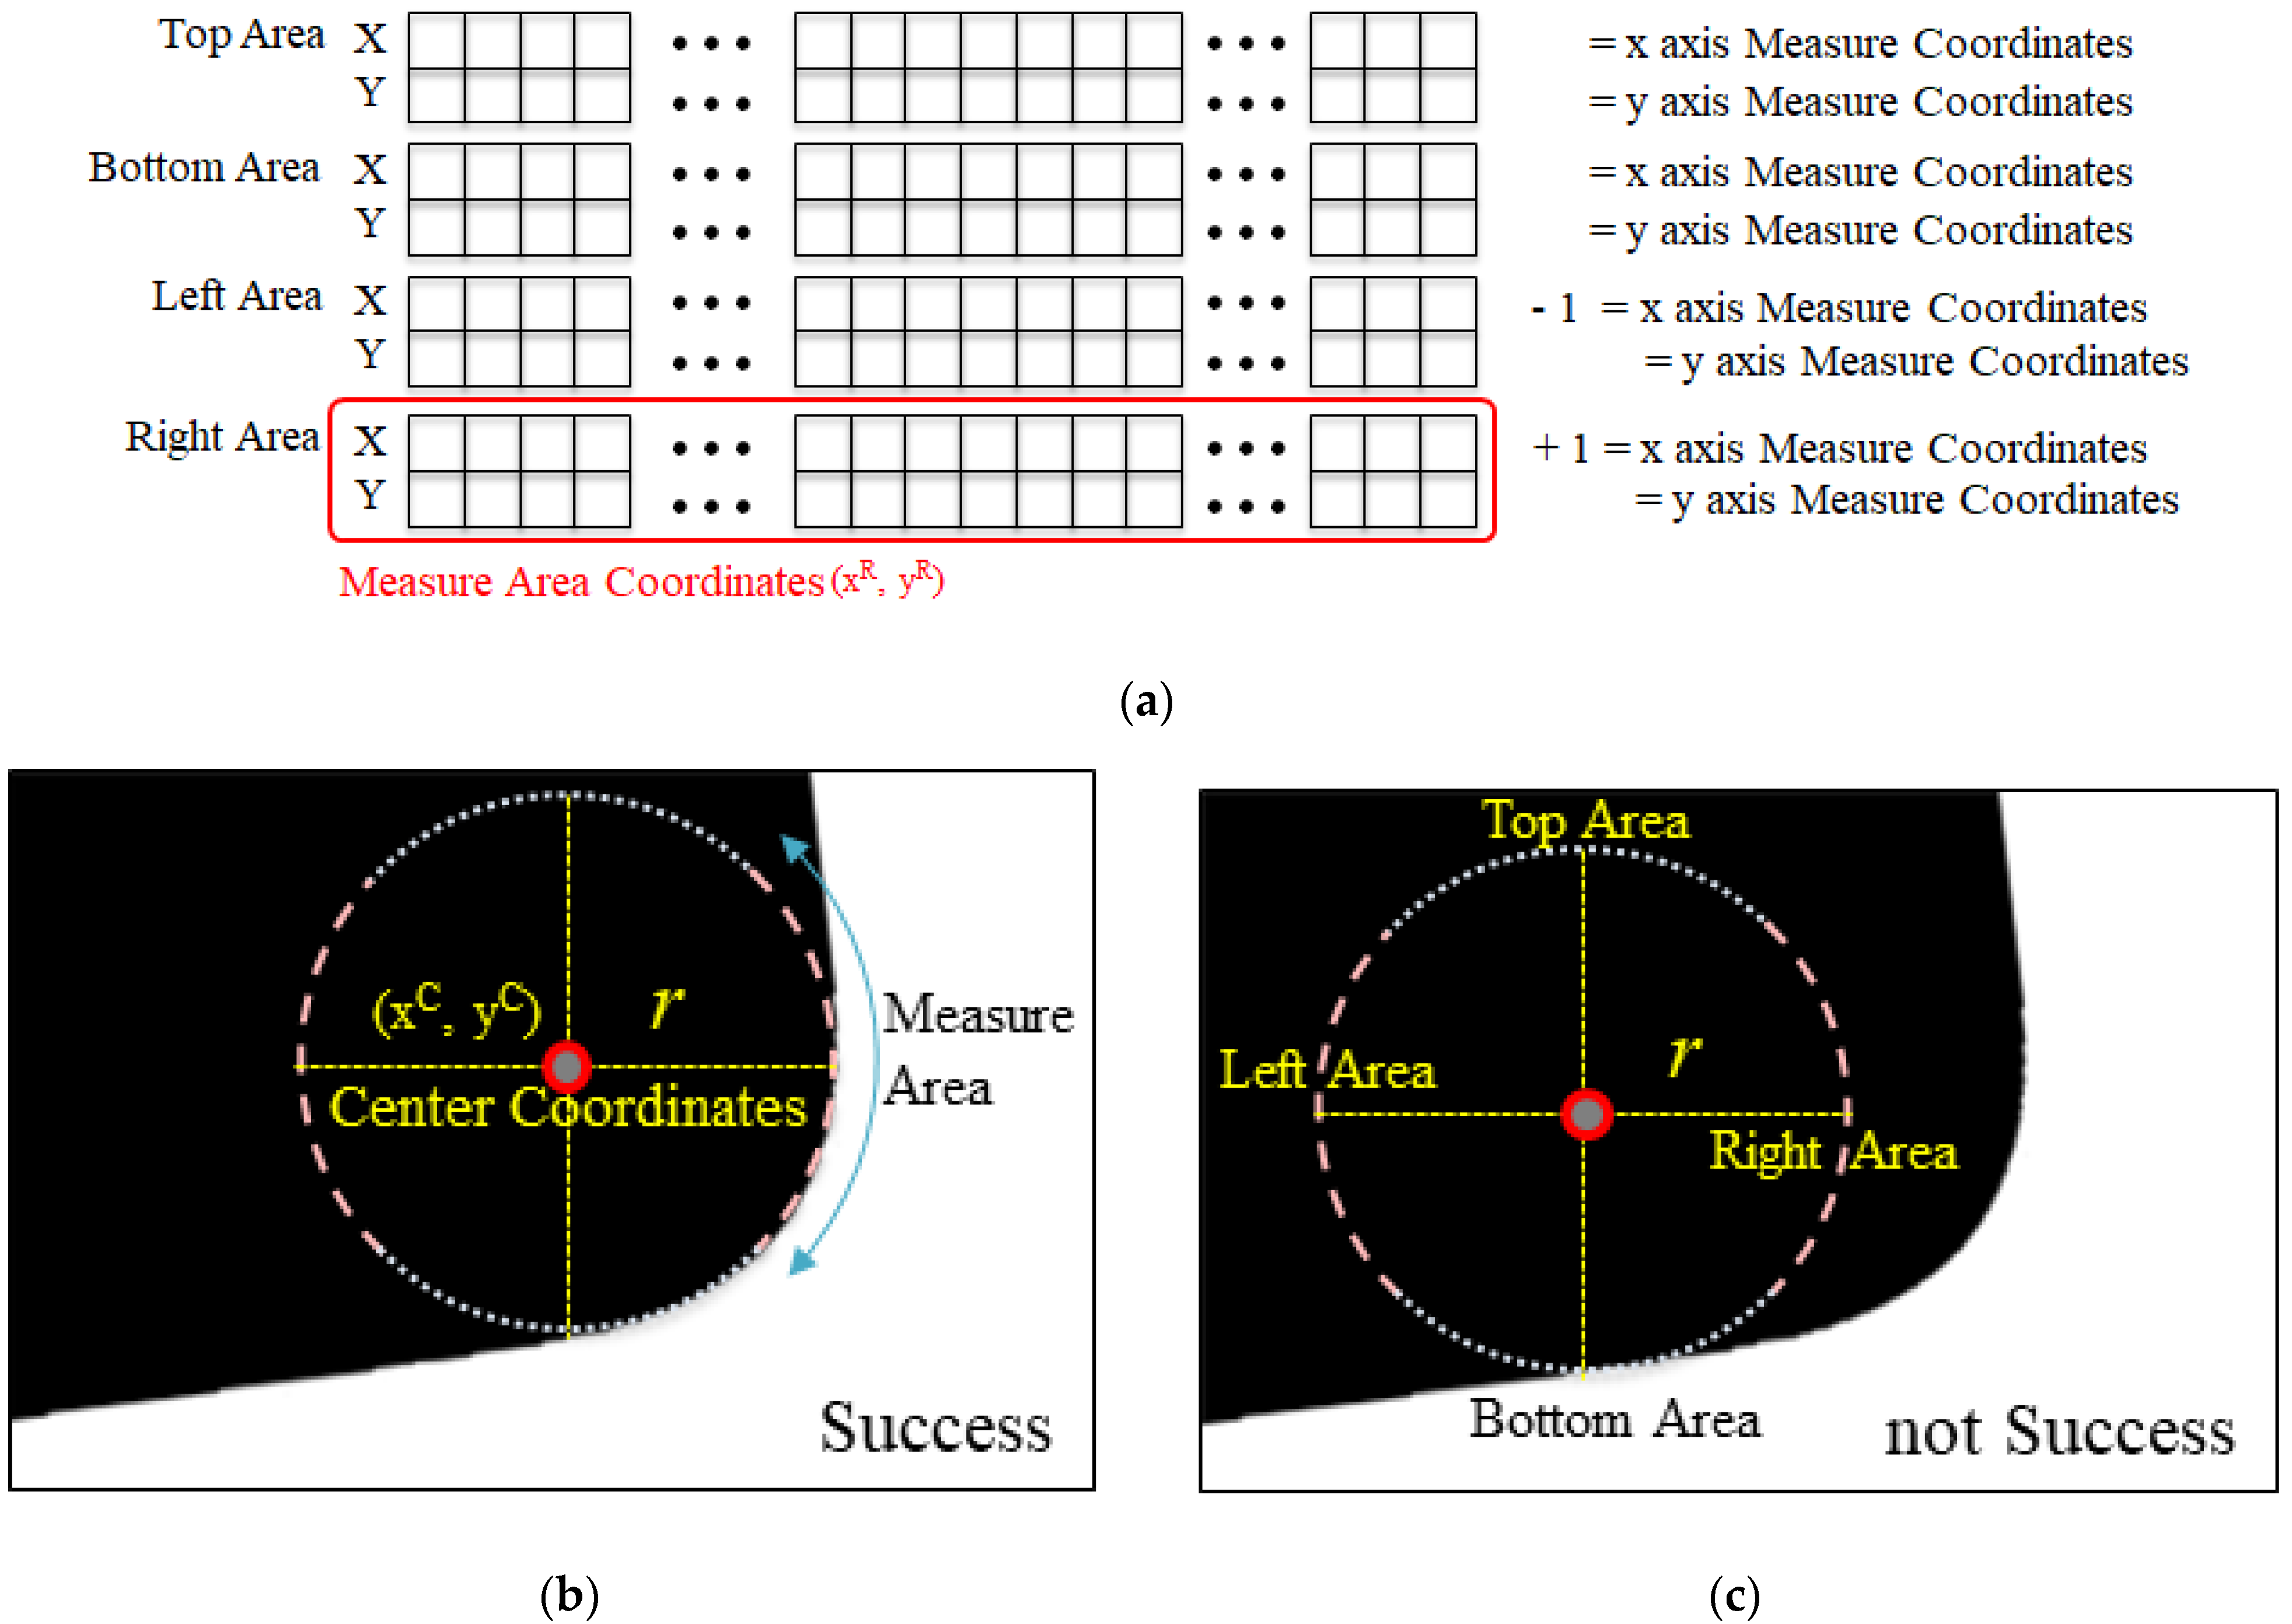
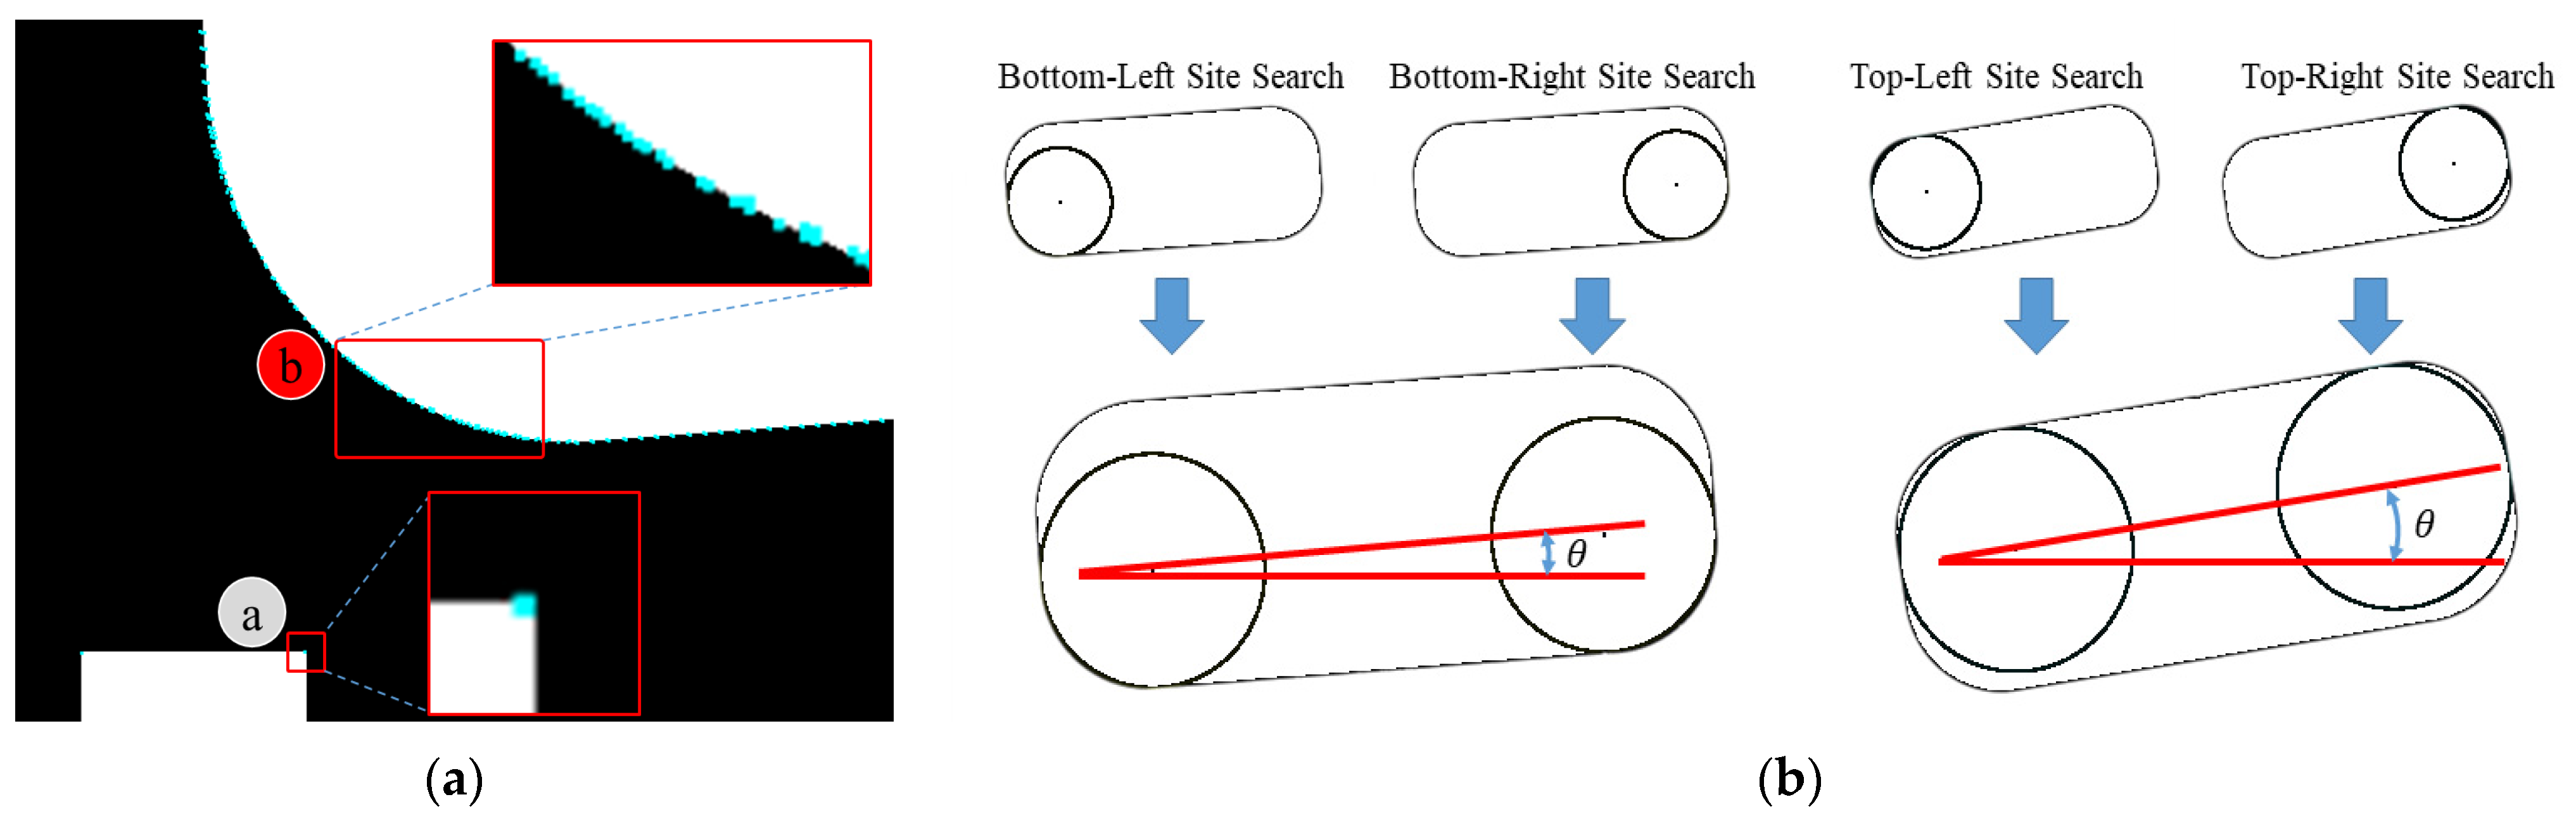
3.3. Reference Point Search
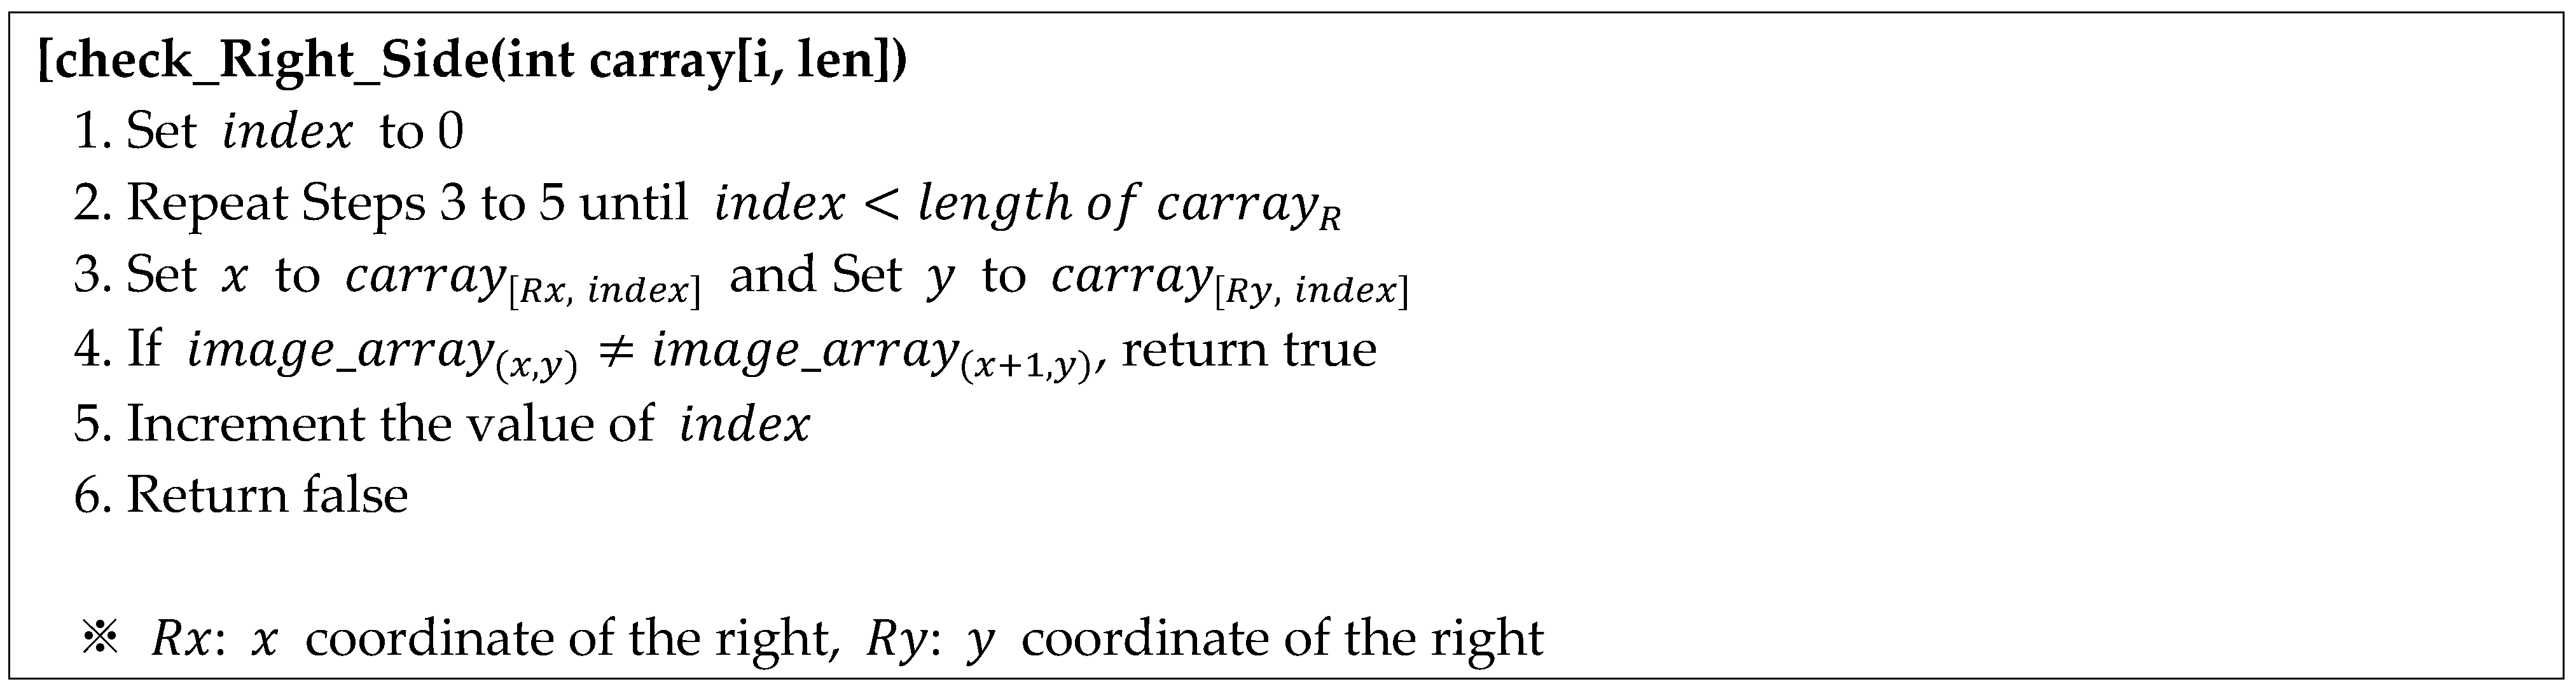
- (i)
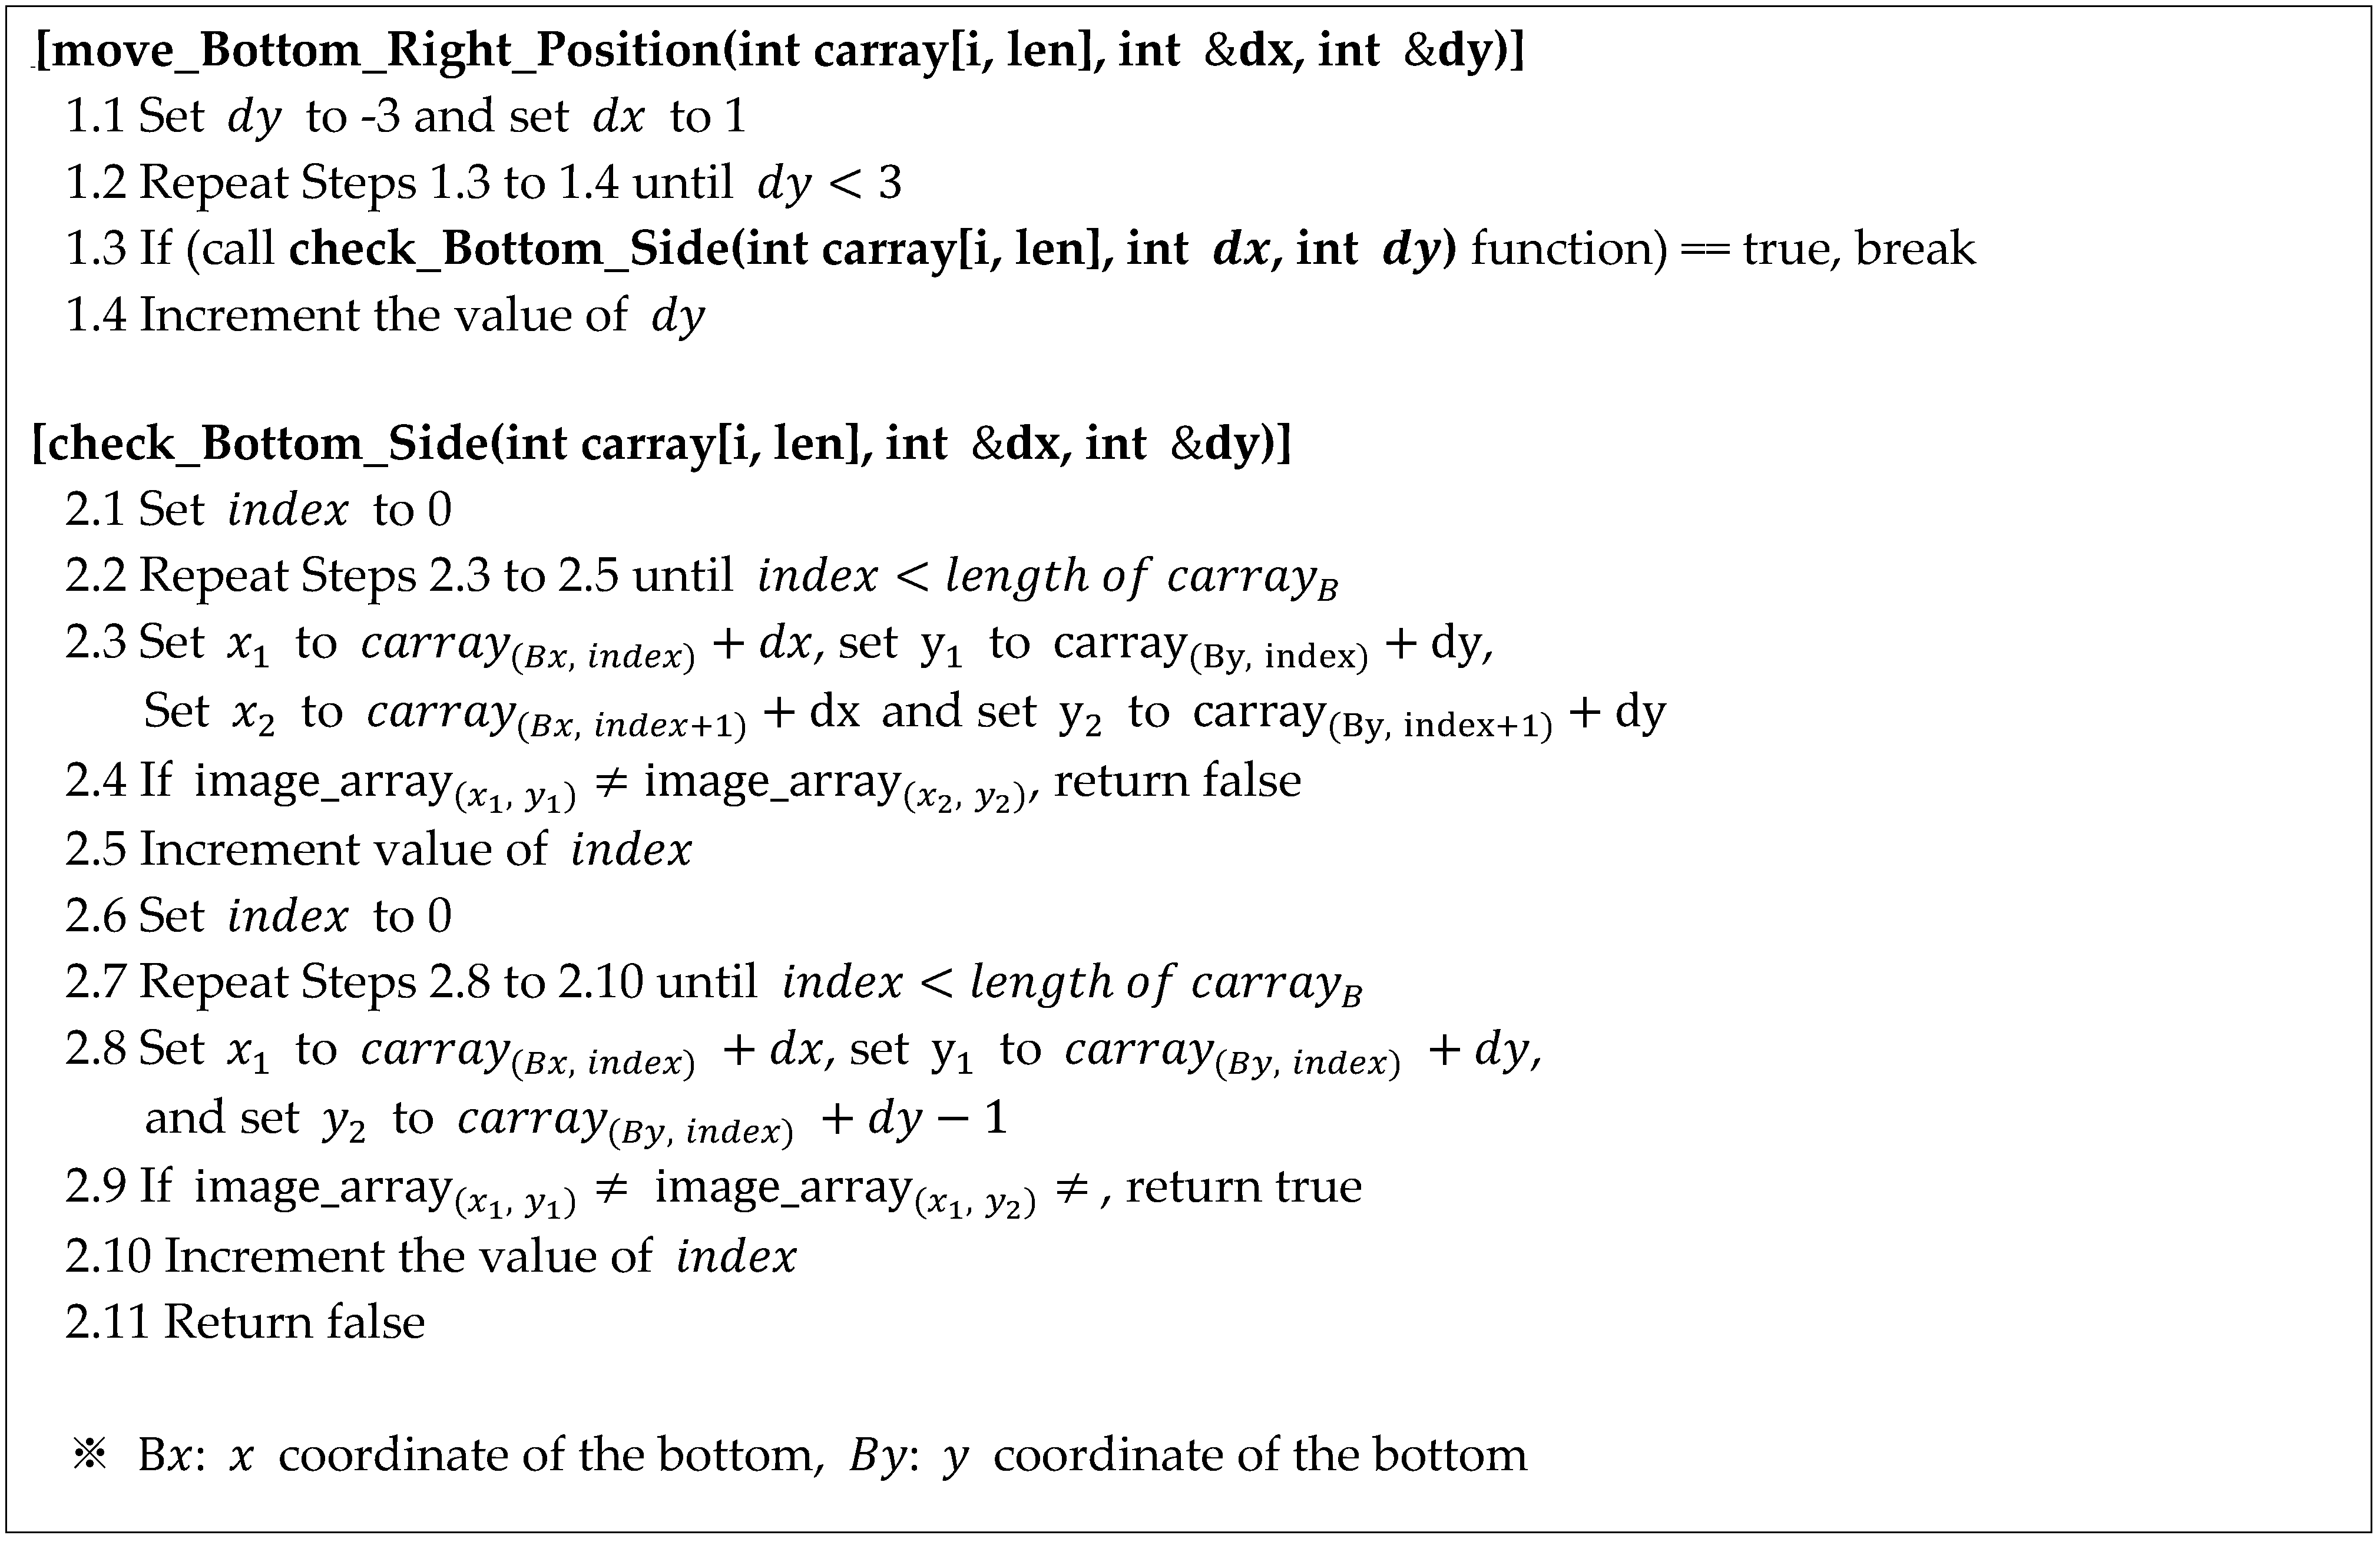
- Checking the right-hand (or left-hand) side of the circular coordinate array and determining whether the search for the reference point has been successful
- (ii)
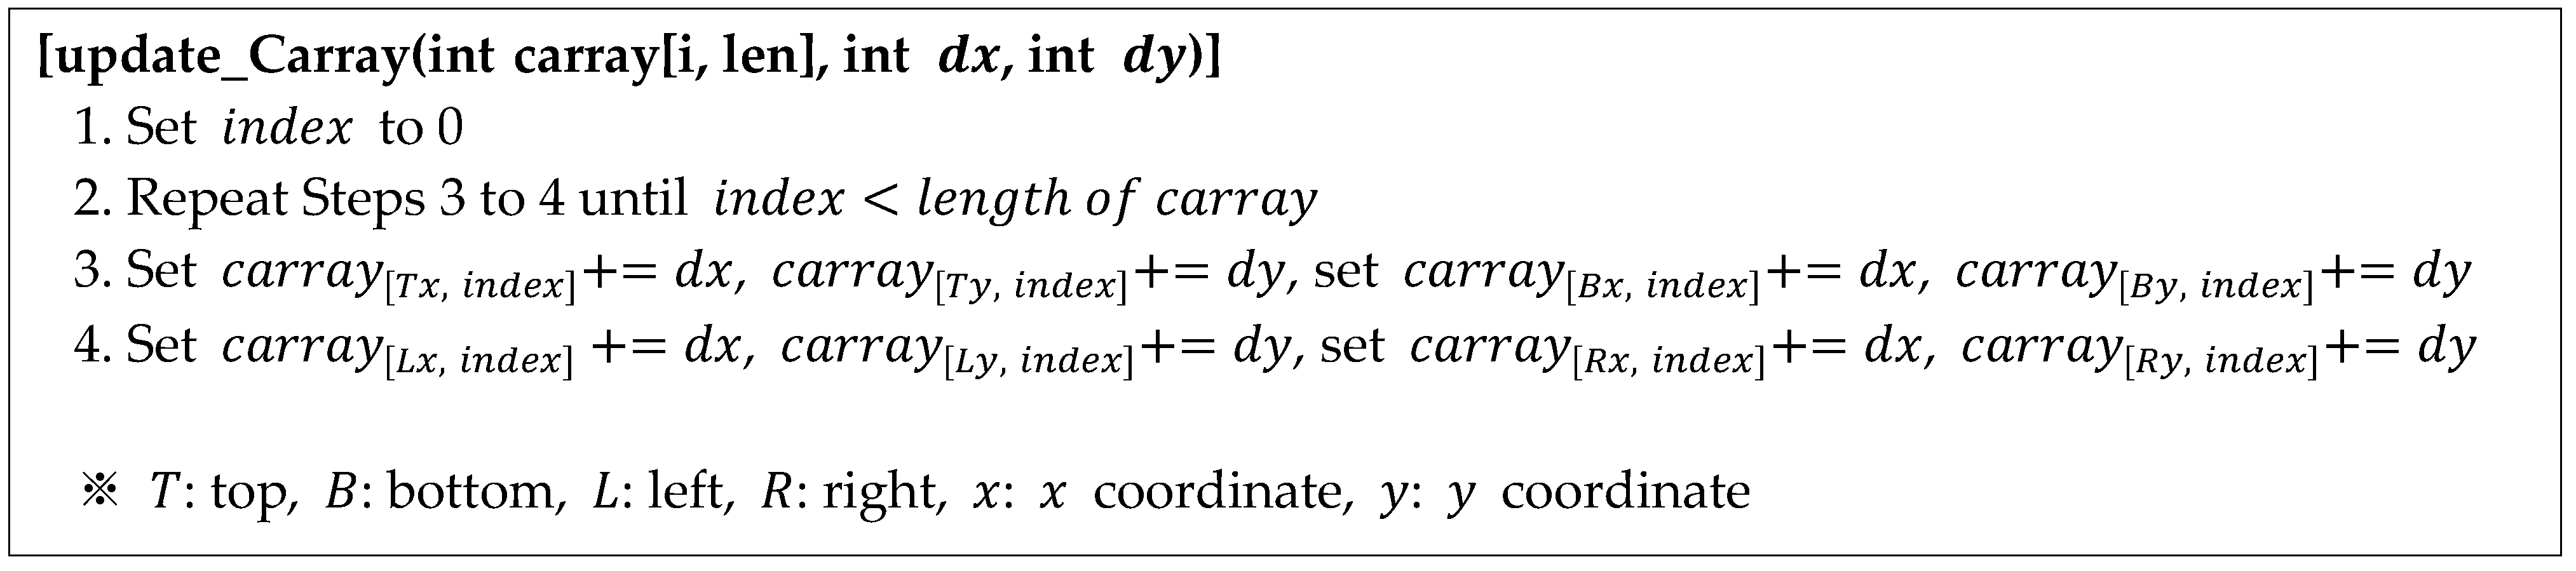
- Moving the pixel coordinates to the right (or left) and updating the circular coordinate array
4. Experiment and Results
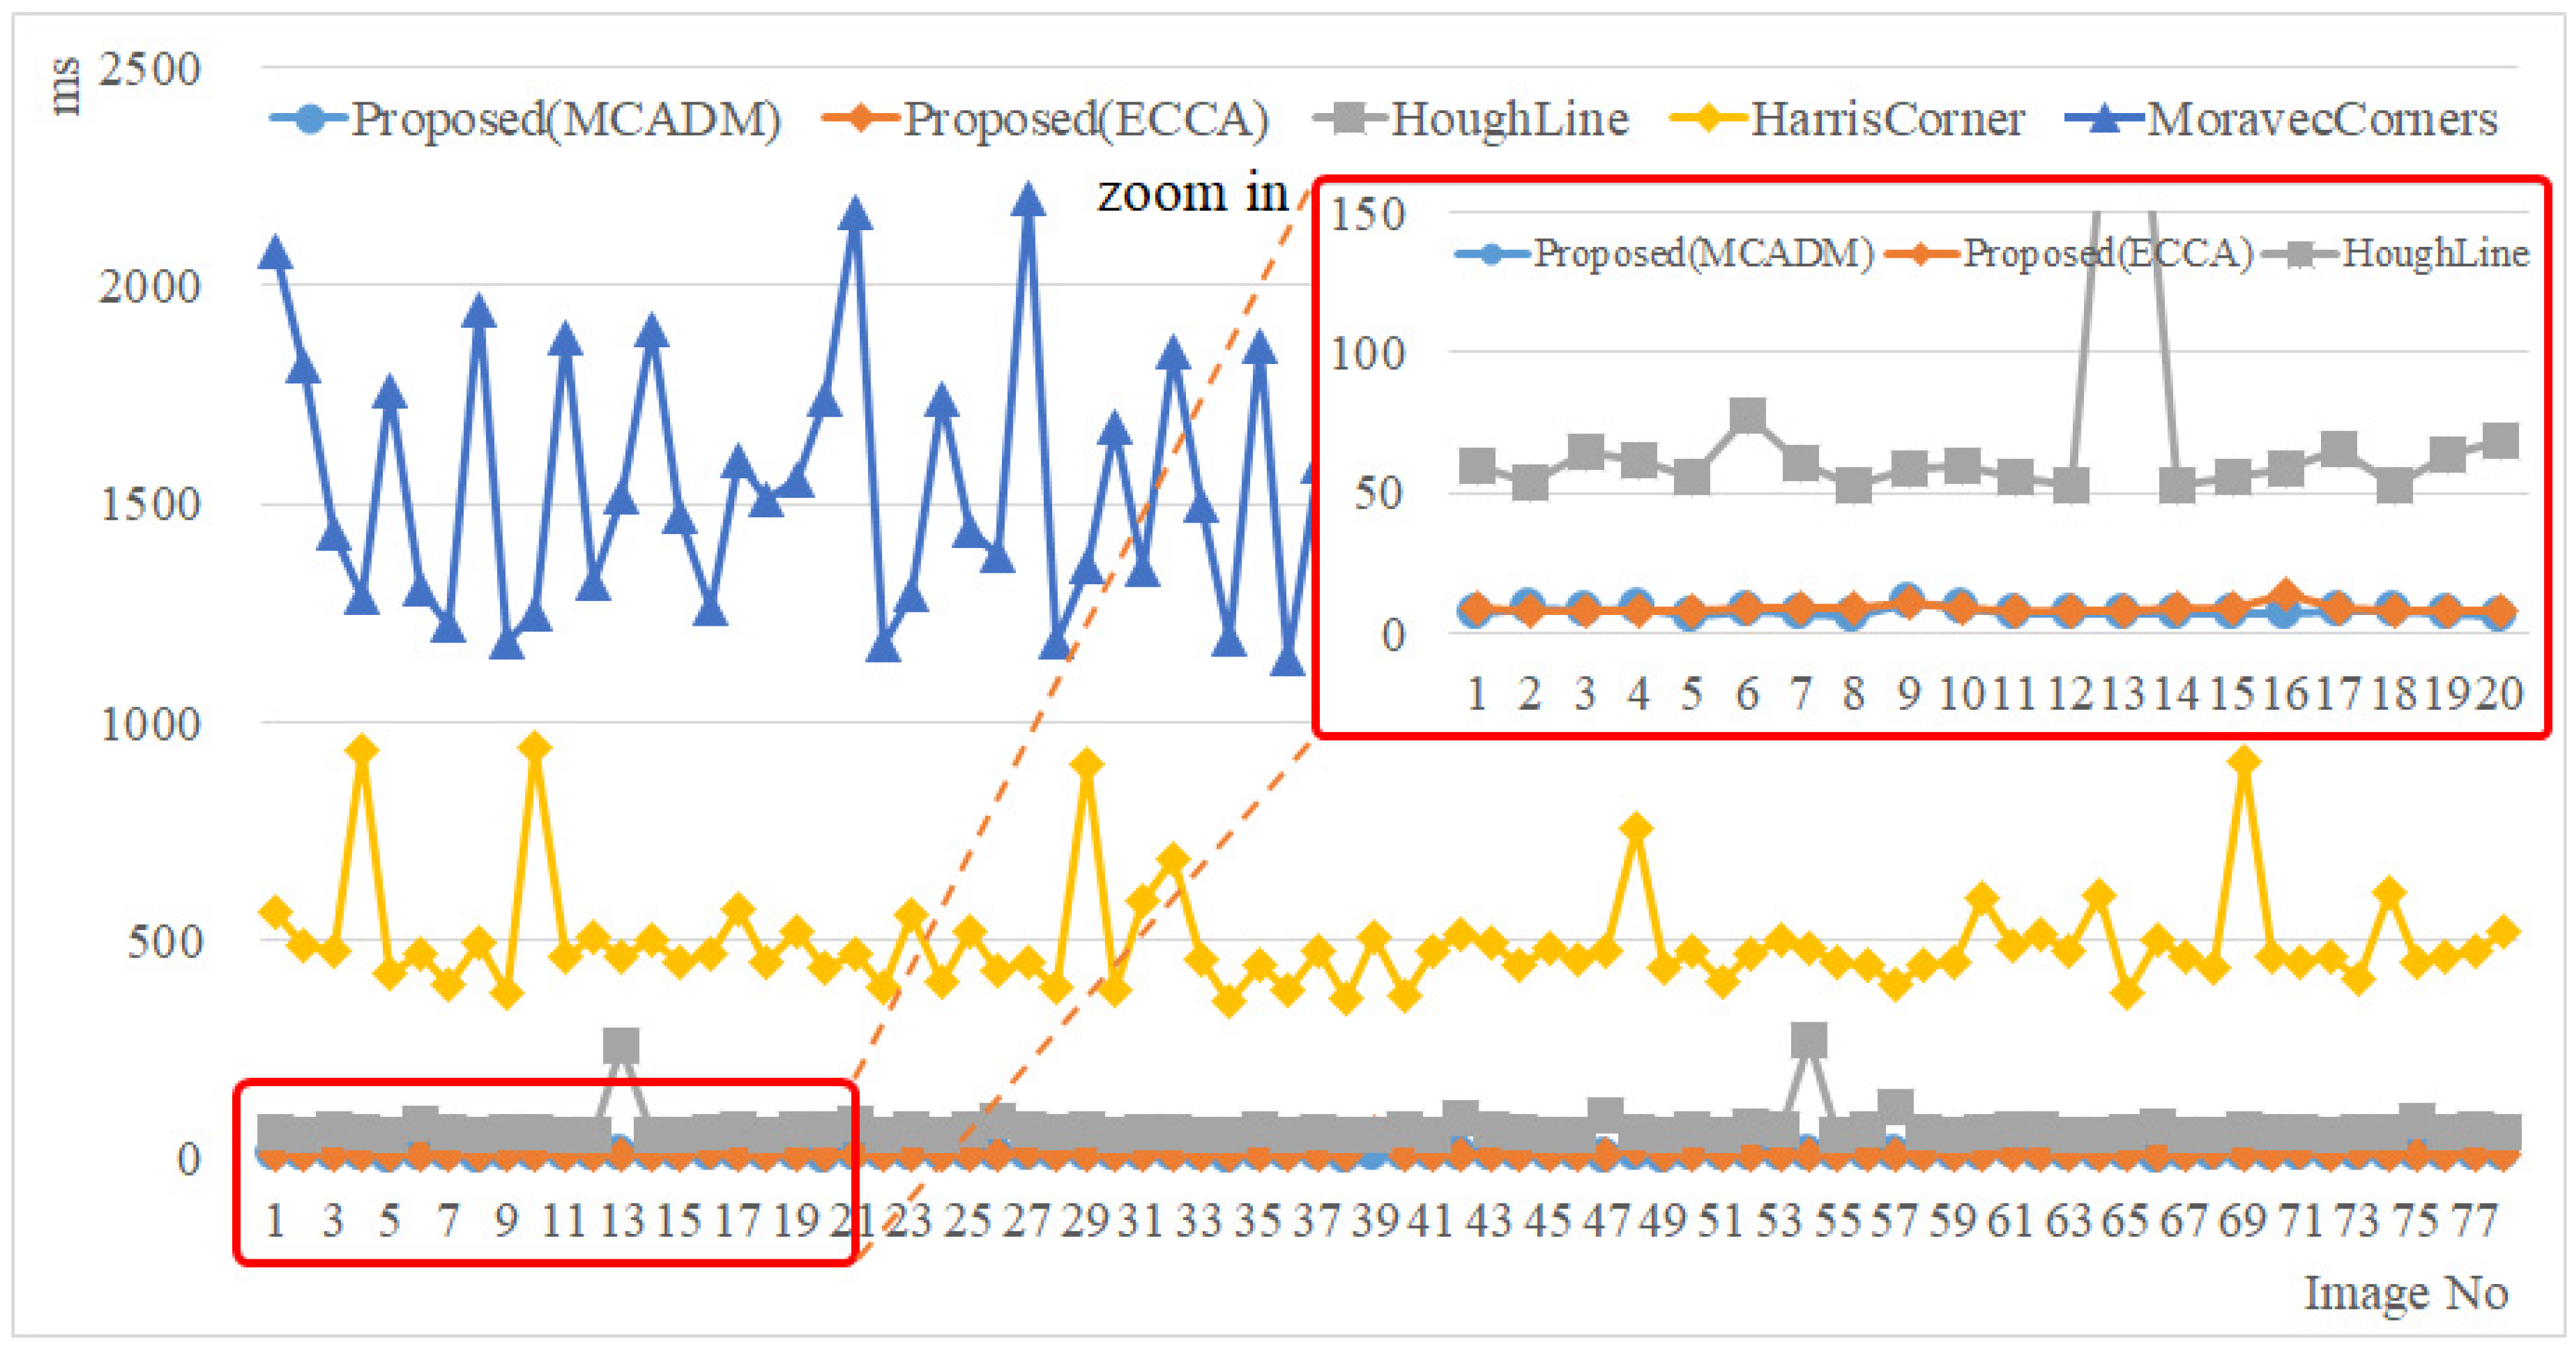
4.1. Experimental Results for Processing Speed
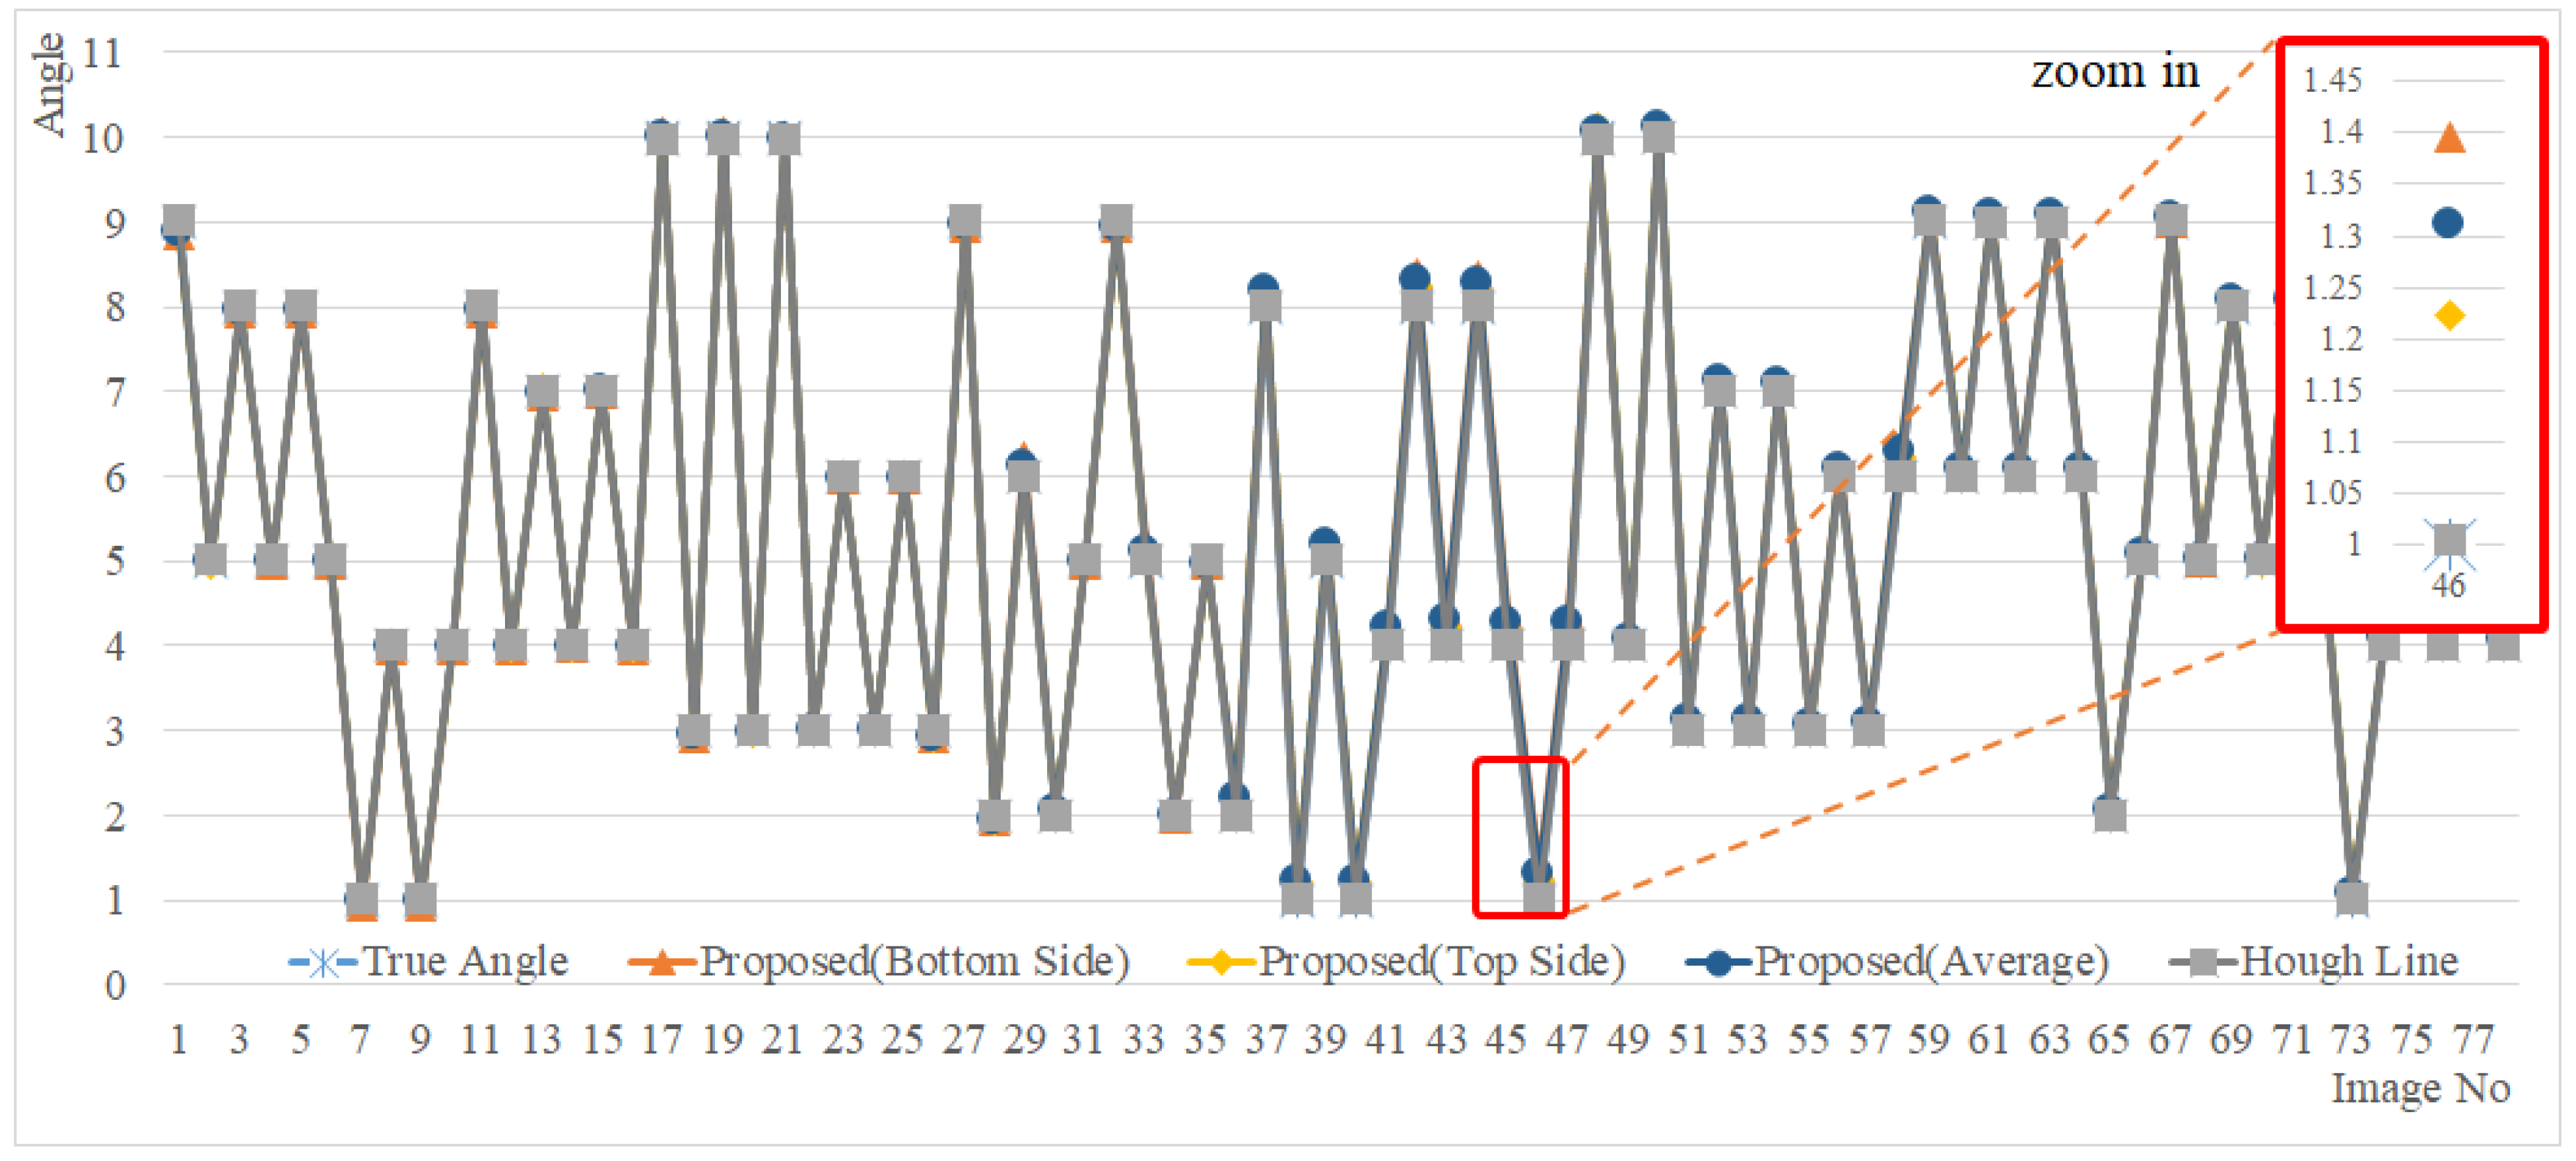
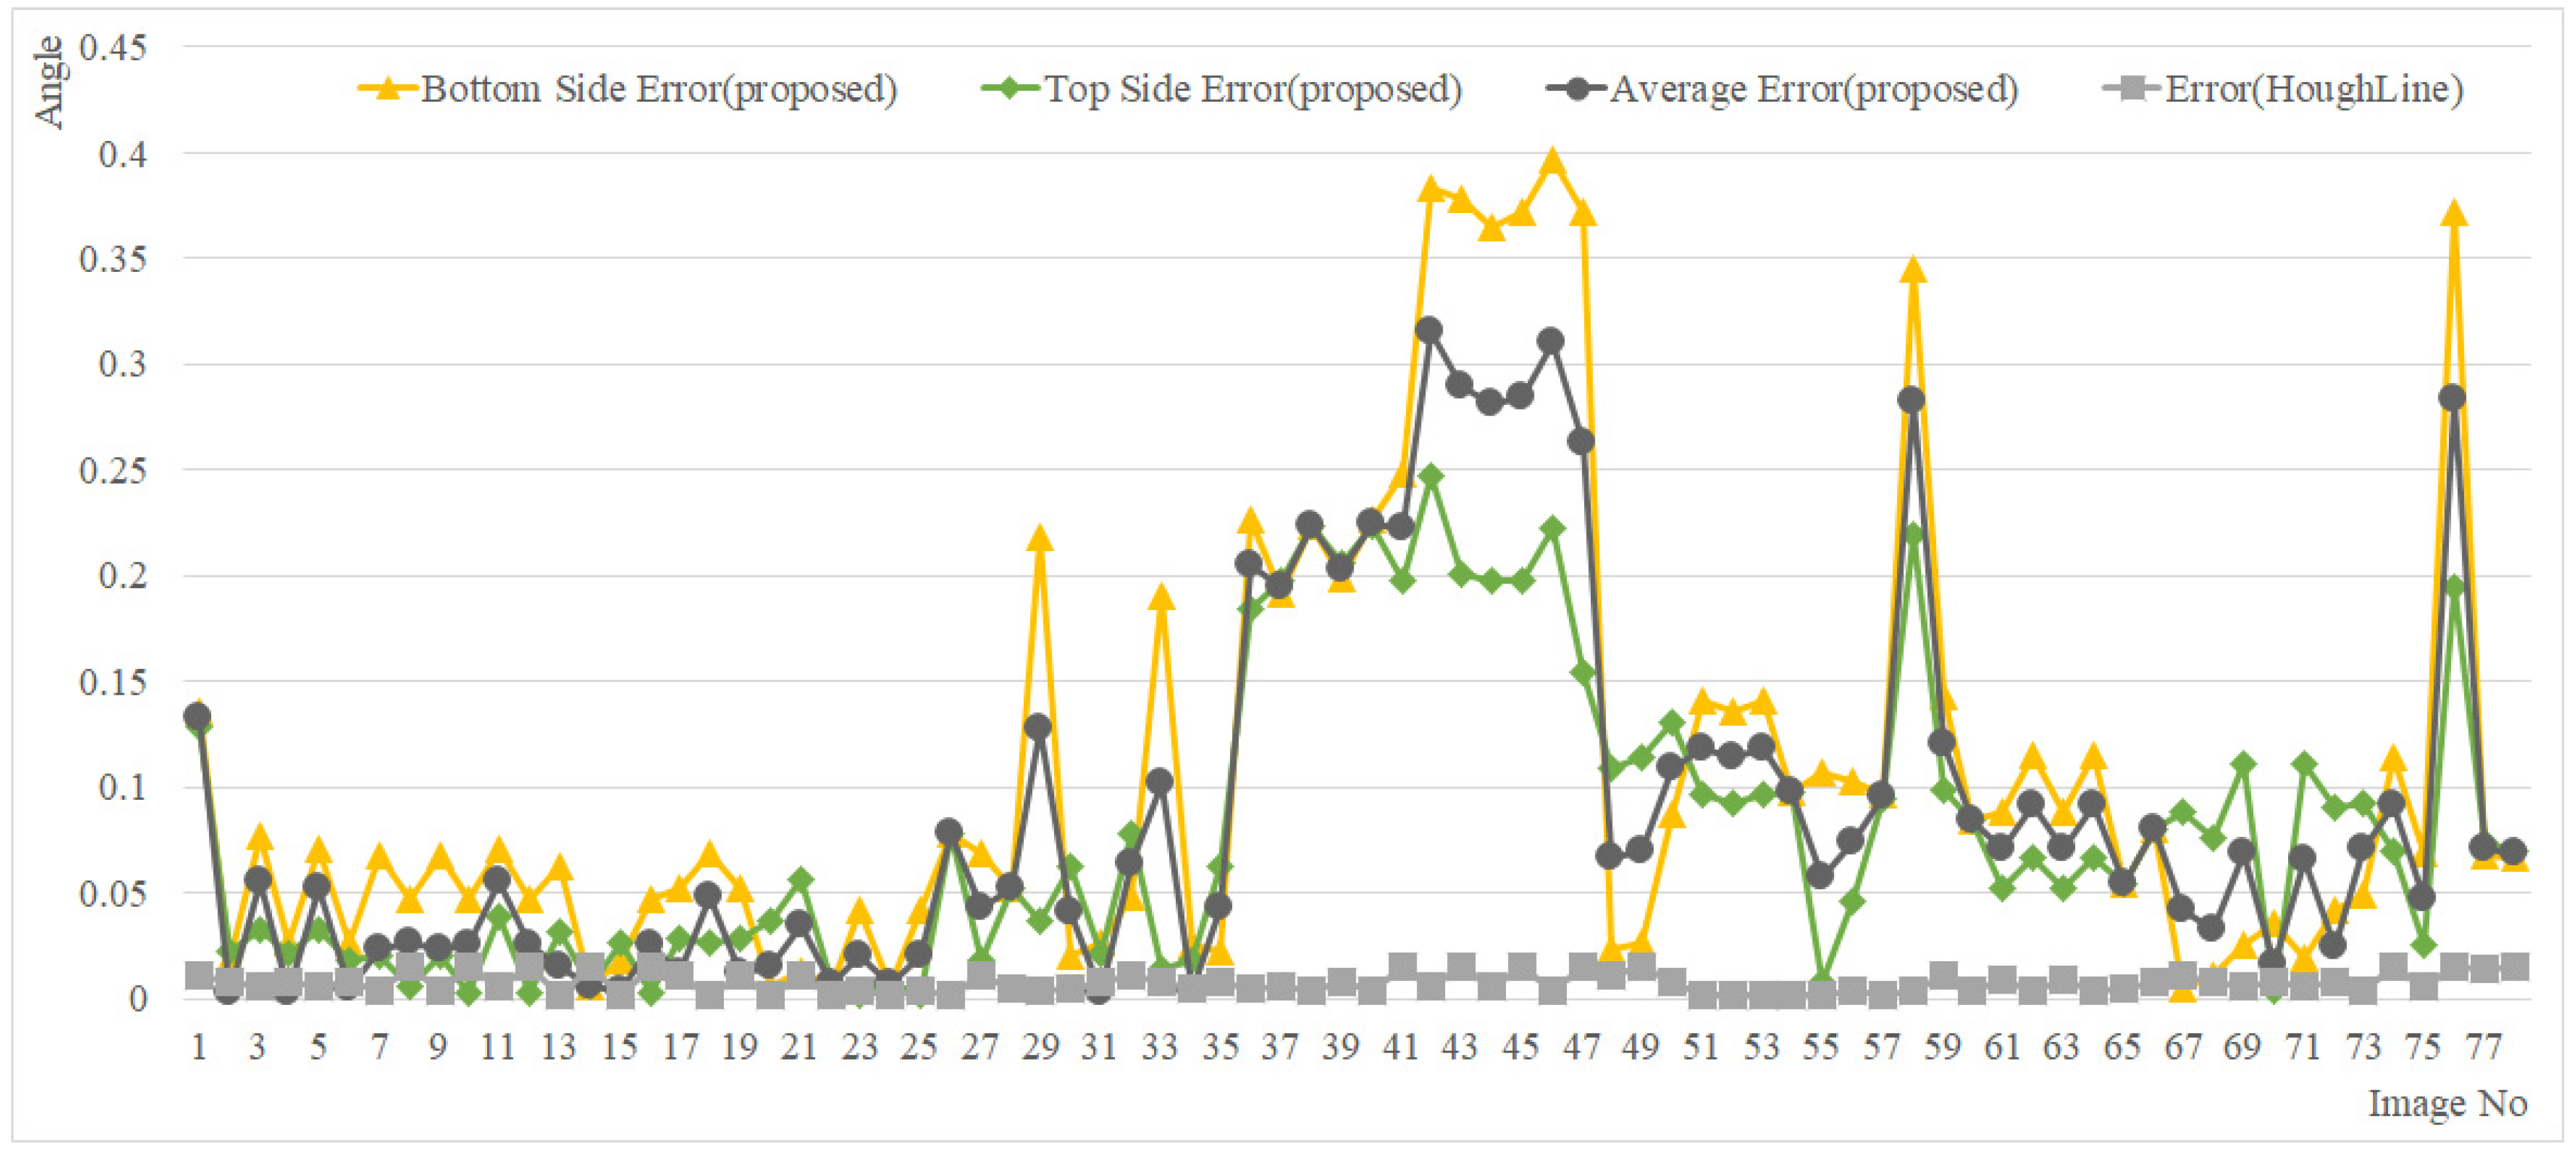
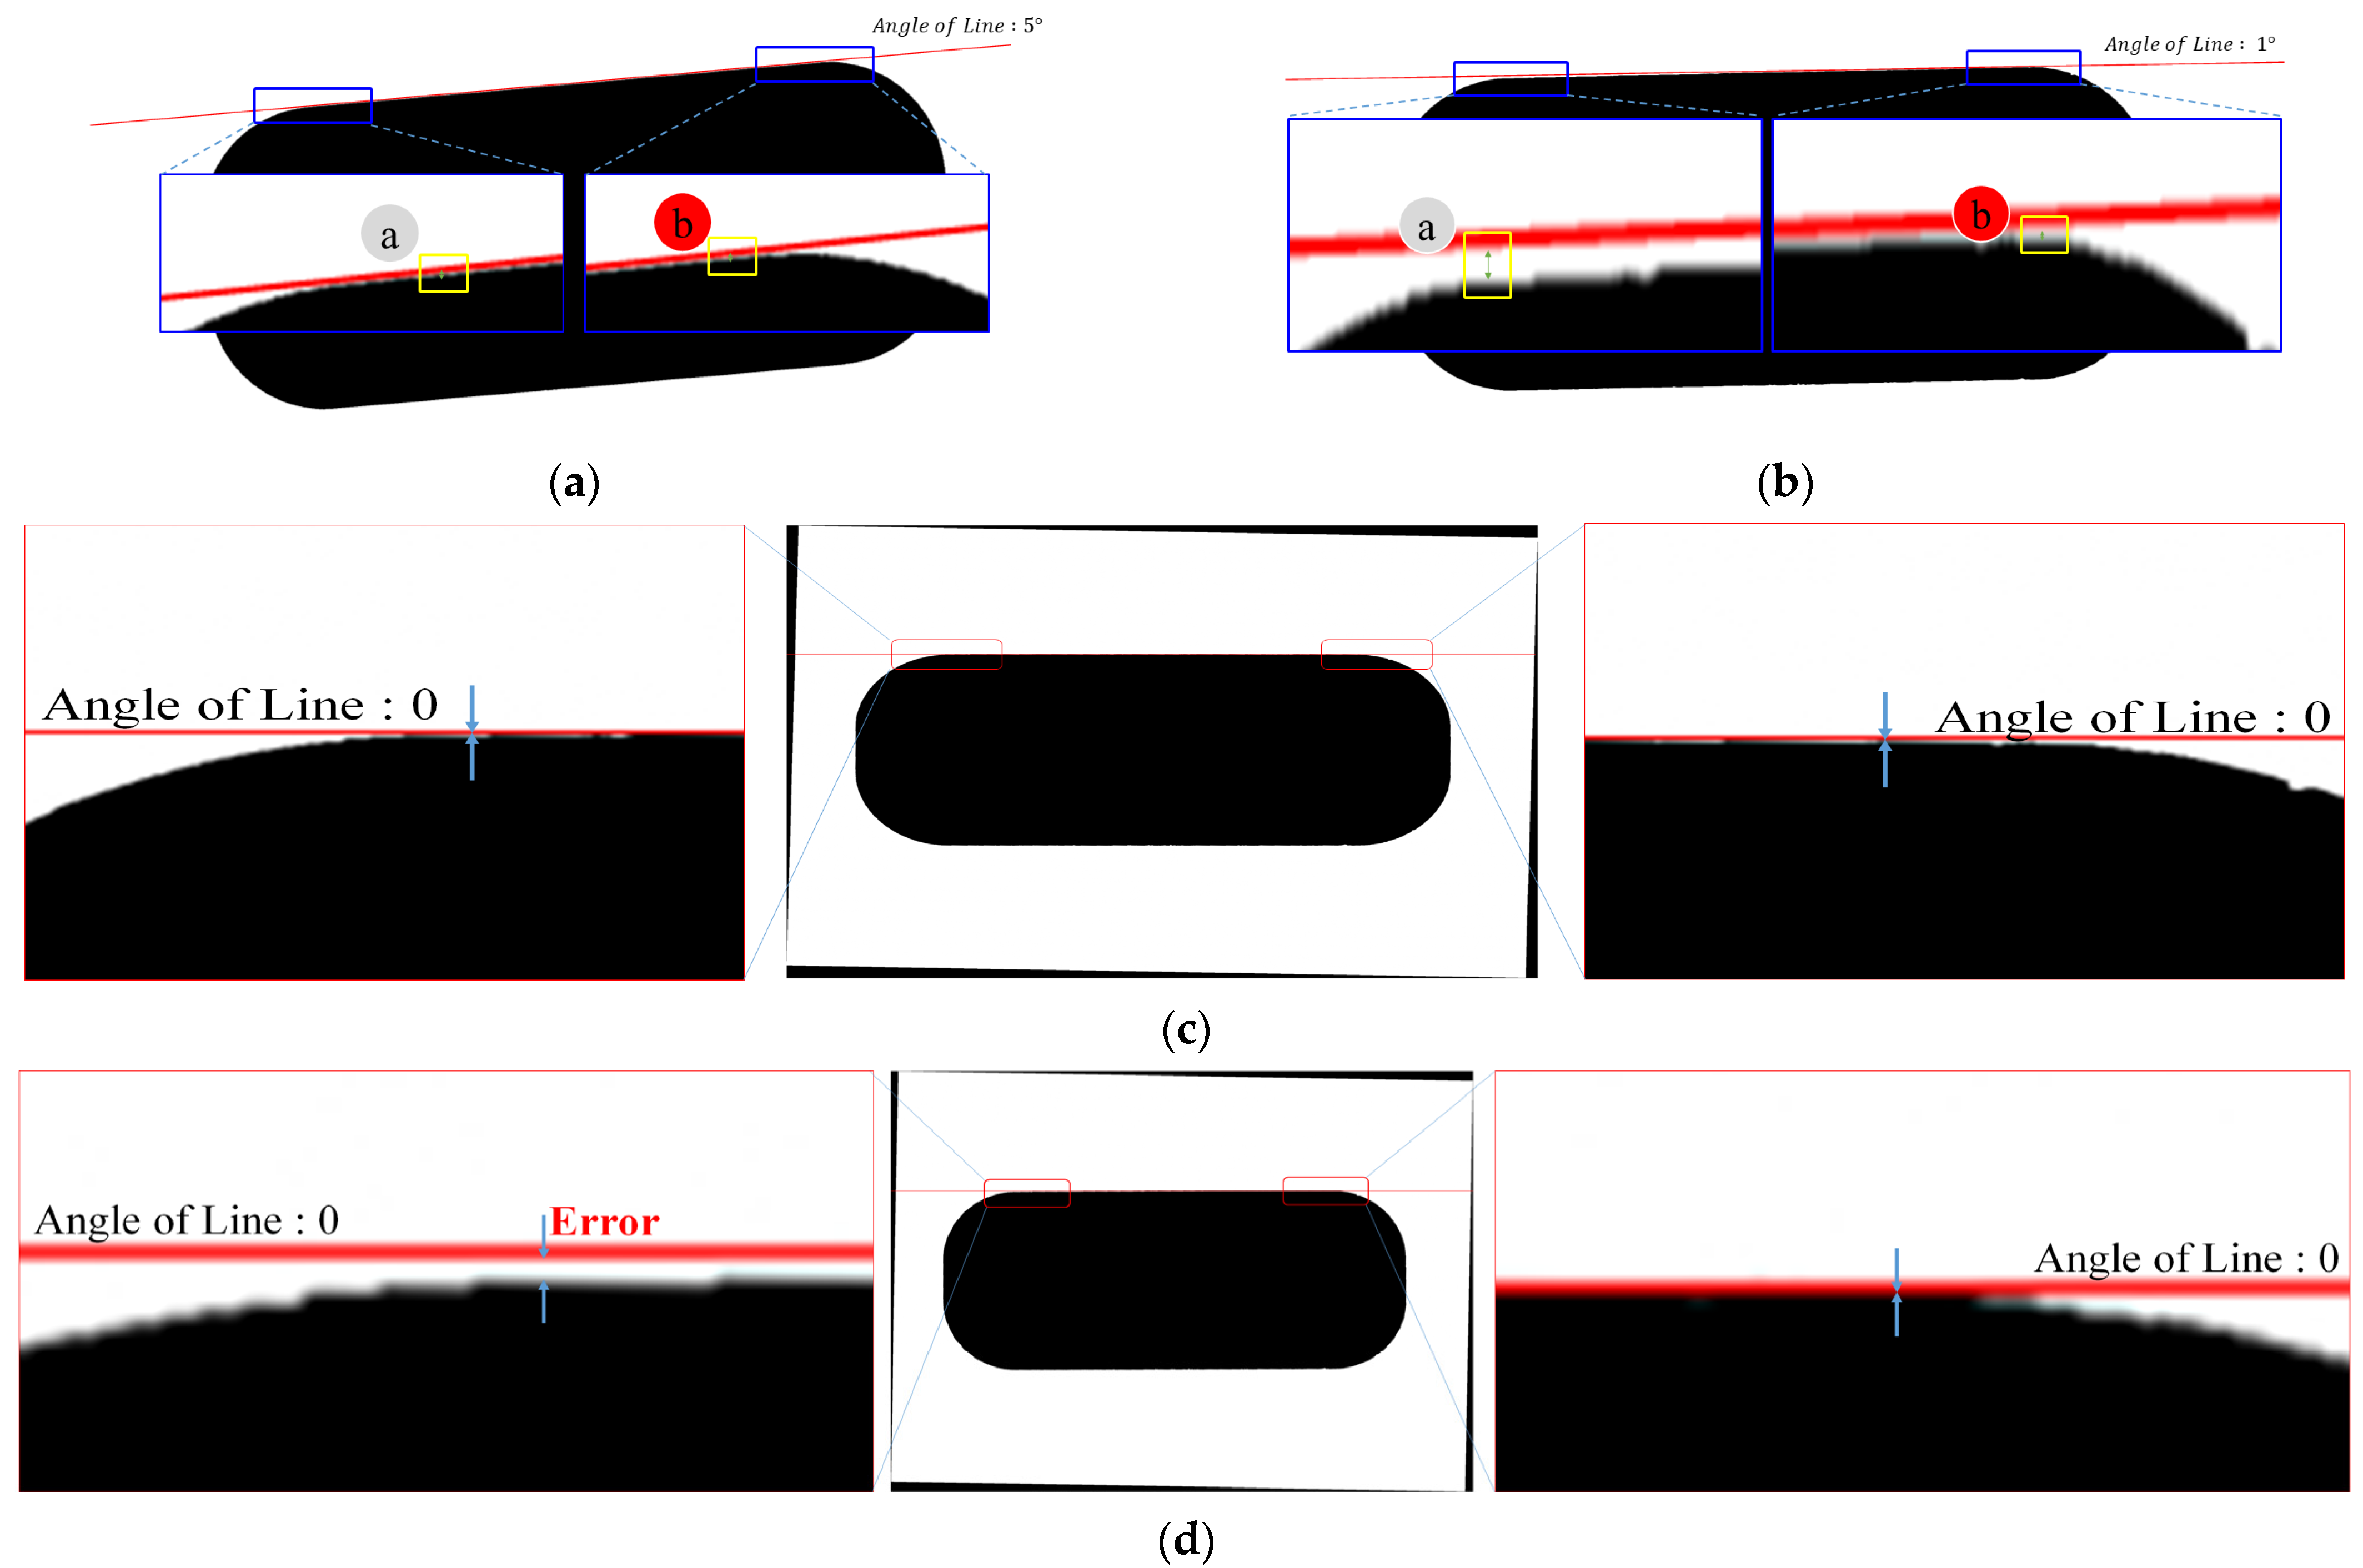
4.2. Experimental Results for the Accuracy
5. Conclusions
Author Contributions
Funding
Institutional Review Board Statement
Informed Consent Statement
Data Availability Statement
Acknowledgments
Conflicts of Interest
References
- Karunarathne, S.; Ganganath, R. A Sovereign Button Detection and Measure the Alignment Using Image Processing. In Proceedings of the 2021 IEEE 16th International Conference on Industrial and Information Systems (ICIIS), Kandy, Sri Lanka, 9–11 December 2021; pp. 359–364. [Google Scholar]
- Le, M.-T.; Tu, C.-T.; Guo, S.-M.; Lien, J.-J.J. A PCB alignment system using RST template matching with CUDA on embedded GPU board. Sensors 2020, 20, 2736. [Google Scholar] [CrossRef] [PubMed]
- Kwon, S.J.; Park, C.S.; Lee, S.M. Kinematics and Control of a Visual Alignment System for Flat Panel Displays. J. Inst. Control Robot. Syst. 2008, 14, 369–375. [Google Scholar]
- Park, C.S.; Kwon, S.J. An Efficient Vision Algorithm for Fast and Fine Mask-Panel Alignment. In Proceedings of the 2006 SICEICASE International Joint Conference (SICE-ICCAS 2006), Busan, Korea, 18–21 October 2006; pp. 1461–1465. [Google Scholar]
- Moon, C.B.; Kim, H.; Kim, H.; Lee, D.; Kim, T.H.; Chung, H.; Kim, B.M. A Fast Way for Alignment Marker Detection and Position Calibration. Korea Inf. Process. Soc. 2016, 5, 35–42. [Google Scholar] [CrossRef][Green Version]
- Moon, C.-B.; Lee, J.-Y.; Kim, D.-S.; Kim, B.-M. Inspection System for Vehicle Headlight Defects Based on Convolutional Neural Network. Appl. Sci. 2021, 11, 4402. [Google Scholar] [CrossRef]
- Mu, Z.; Li, Z. A Novel Shi-Tomasi Corner Detection Algorithm Based on Progressive Probabilistic Hough Transform. In Proceedings of the 2018 Chinese Automation Congress (CAC), Xi’an, China, 30 November–2 December 2018; pp. 2918–2922. [Google Scholar]
- Haggui, O.; Tadonki, C.; Lacassagne, L.; Sayadi, F.; Ouni, B. Harris Corner Detection on a NUMA Manycore. Future Gener. Comput. Syst. 2018, 88, 442–452. [Google Scholar] [CrossRef]
- Yuxi, Z.; Cui, R. The Algorithm Design of Wavelet Image Fusion Based on M interest Operator on The Determined Condition. In Proceedings of the Second International Conference on Mechanic Automation and Control Engineering (MACE), Inner Mongolia, China, 15–17 July 2011; pp. 749–752. [Google Scholar]
- Giap, D.B.; Le, T.N.; Wang, J.-W.; Wang, C.-N. Wavelet Subband-Based Tensor for Smartphone Physical Button Inspection. IEEE Access 2021, 9, 107399–107415. [Google Scholar] [CrossRef]
- Qiu, Y.; Tang, L.; Li, B.; Niu, S.; Niu, T. Uneven Illumination Surface Defects Inspection Based on Saliency Detection and Intrinsic Image Decomposition. IEEE Access 2020, 8, 190663–190676. [Google Scholar] [CrossRef]
- Li, Y.; Zhang, M.; Liu, Y.; Xiong, Z. Fish-Eye Distortion Correction Based on Midpoint Circle Algorithm. In Proceedings of the 2012 IEEE International Conference on Systems, Man, and Cybernetics (SMC), Seoul, Korea, 14–17 October 2012; pp. 2224–2228. [Google Scholar]
- Bresenham’s Circle Drawing Algorithm. Available online: https://www.geeksforgeeks.org/bresenhams-circle-drawing-algorithm/ (accessed on 24 June 2022).
- Suzuki, K.; Inoue, T.; Nagata, T.; Kasai, M.; Nonomura, T.; Matsuda, Y. Markerless Image Alignment Method for Pressure-Sensitive Paint Image. Sensors 2022, 22, 453. [Google Scholar] [CrossRef] [PubMed]
- Wright, W.E. Parallel Algorithm for Line and Circle Drawing that are Based on J. E. Bresenham’s line and circle algorithms. IEEE Comput. Graph. Appl. 1990, 10, 60–67. [Google Scholar] [CrossRef]


| Unit: ms | Proposed 1 (MCAGM) | Proposed 2 (ECCA) | Hough Line | Harris Corner | Moravec Corner |
|---|---|---|---|---|---|
| Average | 7.81 | 9.82 | 67.91 | 496.30 | 1520.69 |
| Min | 6 | 7 | 51 | 361 | 1148 |
| Max | 13 | 59 | 271 | 940 | 2214 |
| Unit: Angle (°) | Bottom-Side Error (Proposed) | Top-Side Error (Proposed) | Average Error (Proposed) | Error (Hough Line) |
|---|---|---|---|---|
| Average | 0.0047 | 0.0020 | 0.0024 | 0.0016 |
| Min | 0.3972 | 0.2476 | 0.3156 | 0.0153 |
| Max | 0.1077 | 0.0792 | 0.0894 | 0.0074 |
Publisher’s Note: MDPI stays neutral with regard to jurisdictional claims in published maps and institutional affiliations. |
© 2022 by the authors. Licensee MDPI, Basel, Switzerland. This article is an open access article distributed under the terms and conditions of the Creative Commons Attribution (CC BY) license (https://creativecommons.org/licenses/by/4.0/).
Share and Cite
Moon, C.B.; Kim, B.M.; Kim, D.-S. A Circular-Based Reference Point Extraction Method for Correcting the Alignment of Round Parts. Sensors 2022, 22, 5859. https://doi.org/10.3390/s22155859
Moon CB, Kim BM, Kim D-S. A Circular-Based Reference Point Extraction Method for Correcting the Alignment of Round Parts. Sensors. 2022; 22(15):5859. https://doi.org/10.3390/s22155859
Chicago/Turabian StyleMoon, Chang Bae, Byeong Man Kim, and Dong-Seong Kim. 2022. "A Circular-Based Reference Point Extraction Method for Correcting the Alignment of Round Parts" Sensors 22, no. 15: 5859. https://doi.org/10.3390/s22155859
APA StyleMoon, C. B., Kim, B. M., & Kim, D.-S. (2022). A Circular-Based Reference Point Extraction Method for Correcting the Alignment of Round Parts. Sensors, 22(15), 5859. https://doi.org/10.3390/s22155859