
WLAN RSS-Based Fingerprinting for Indoor Localization: A Machine Learning Inspired Bag-of-Features Approach

 ,
,  , , ,
, , ,
Abstract
:1. Introduction
2. Related Work
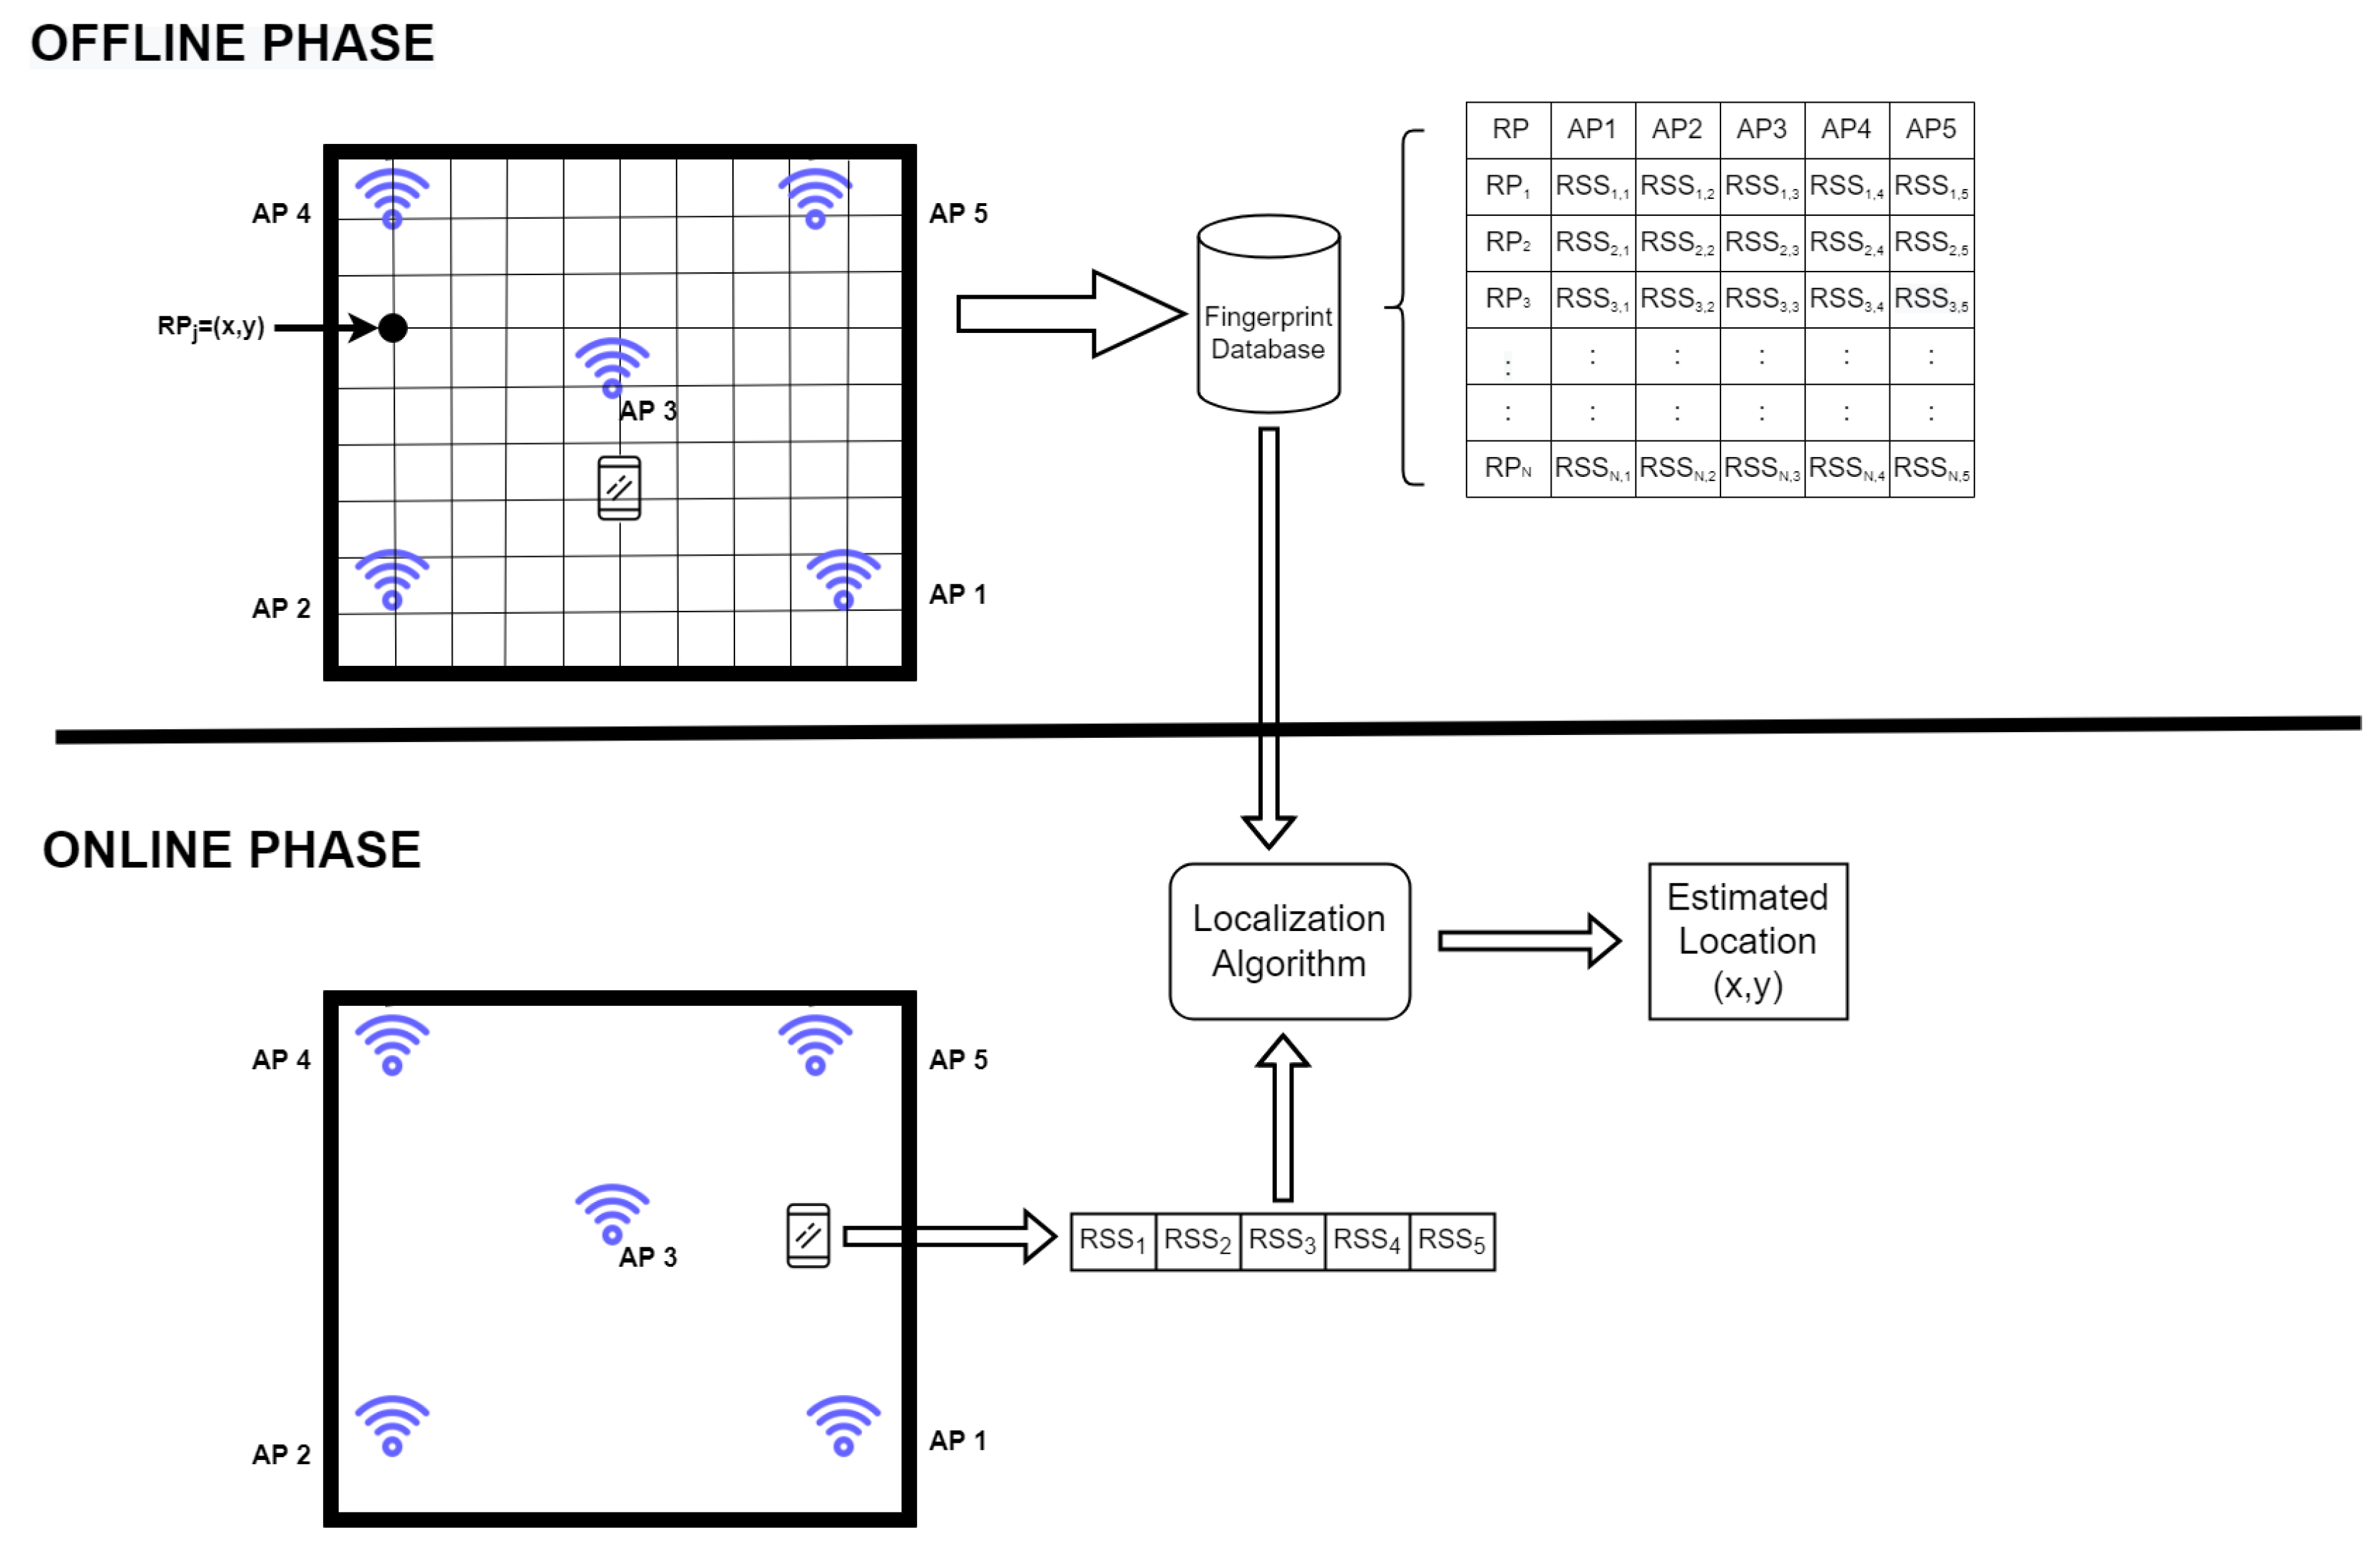
3. System Model
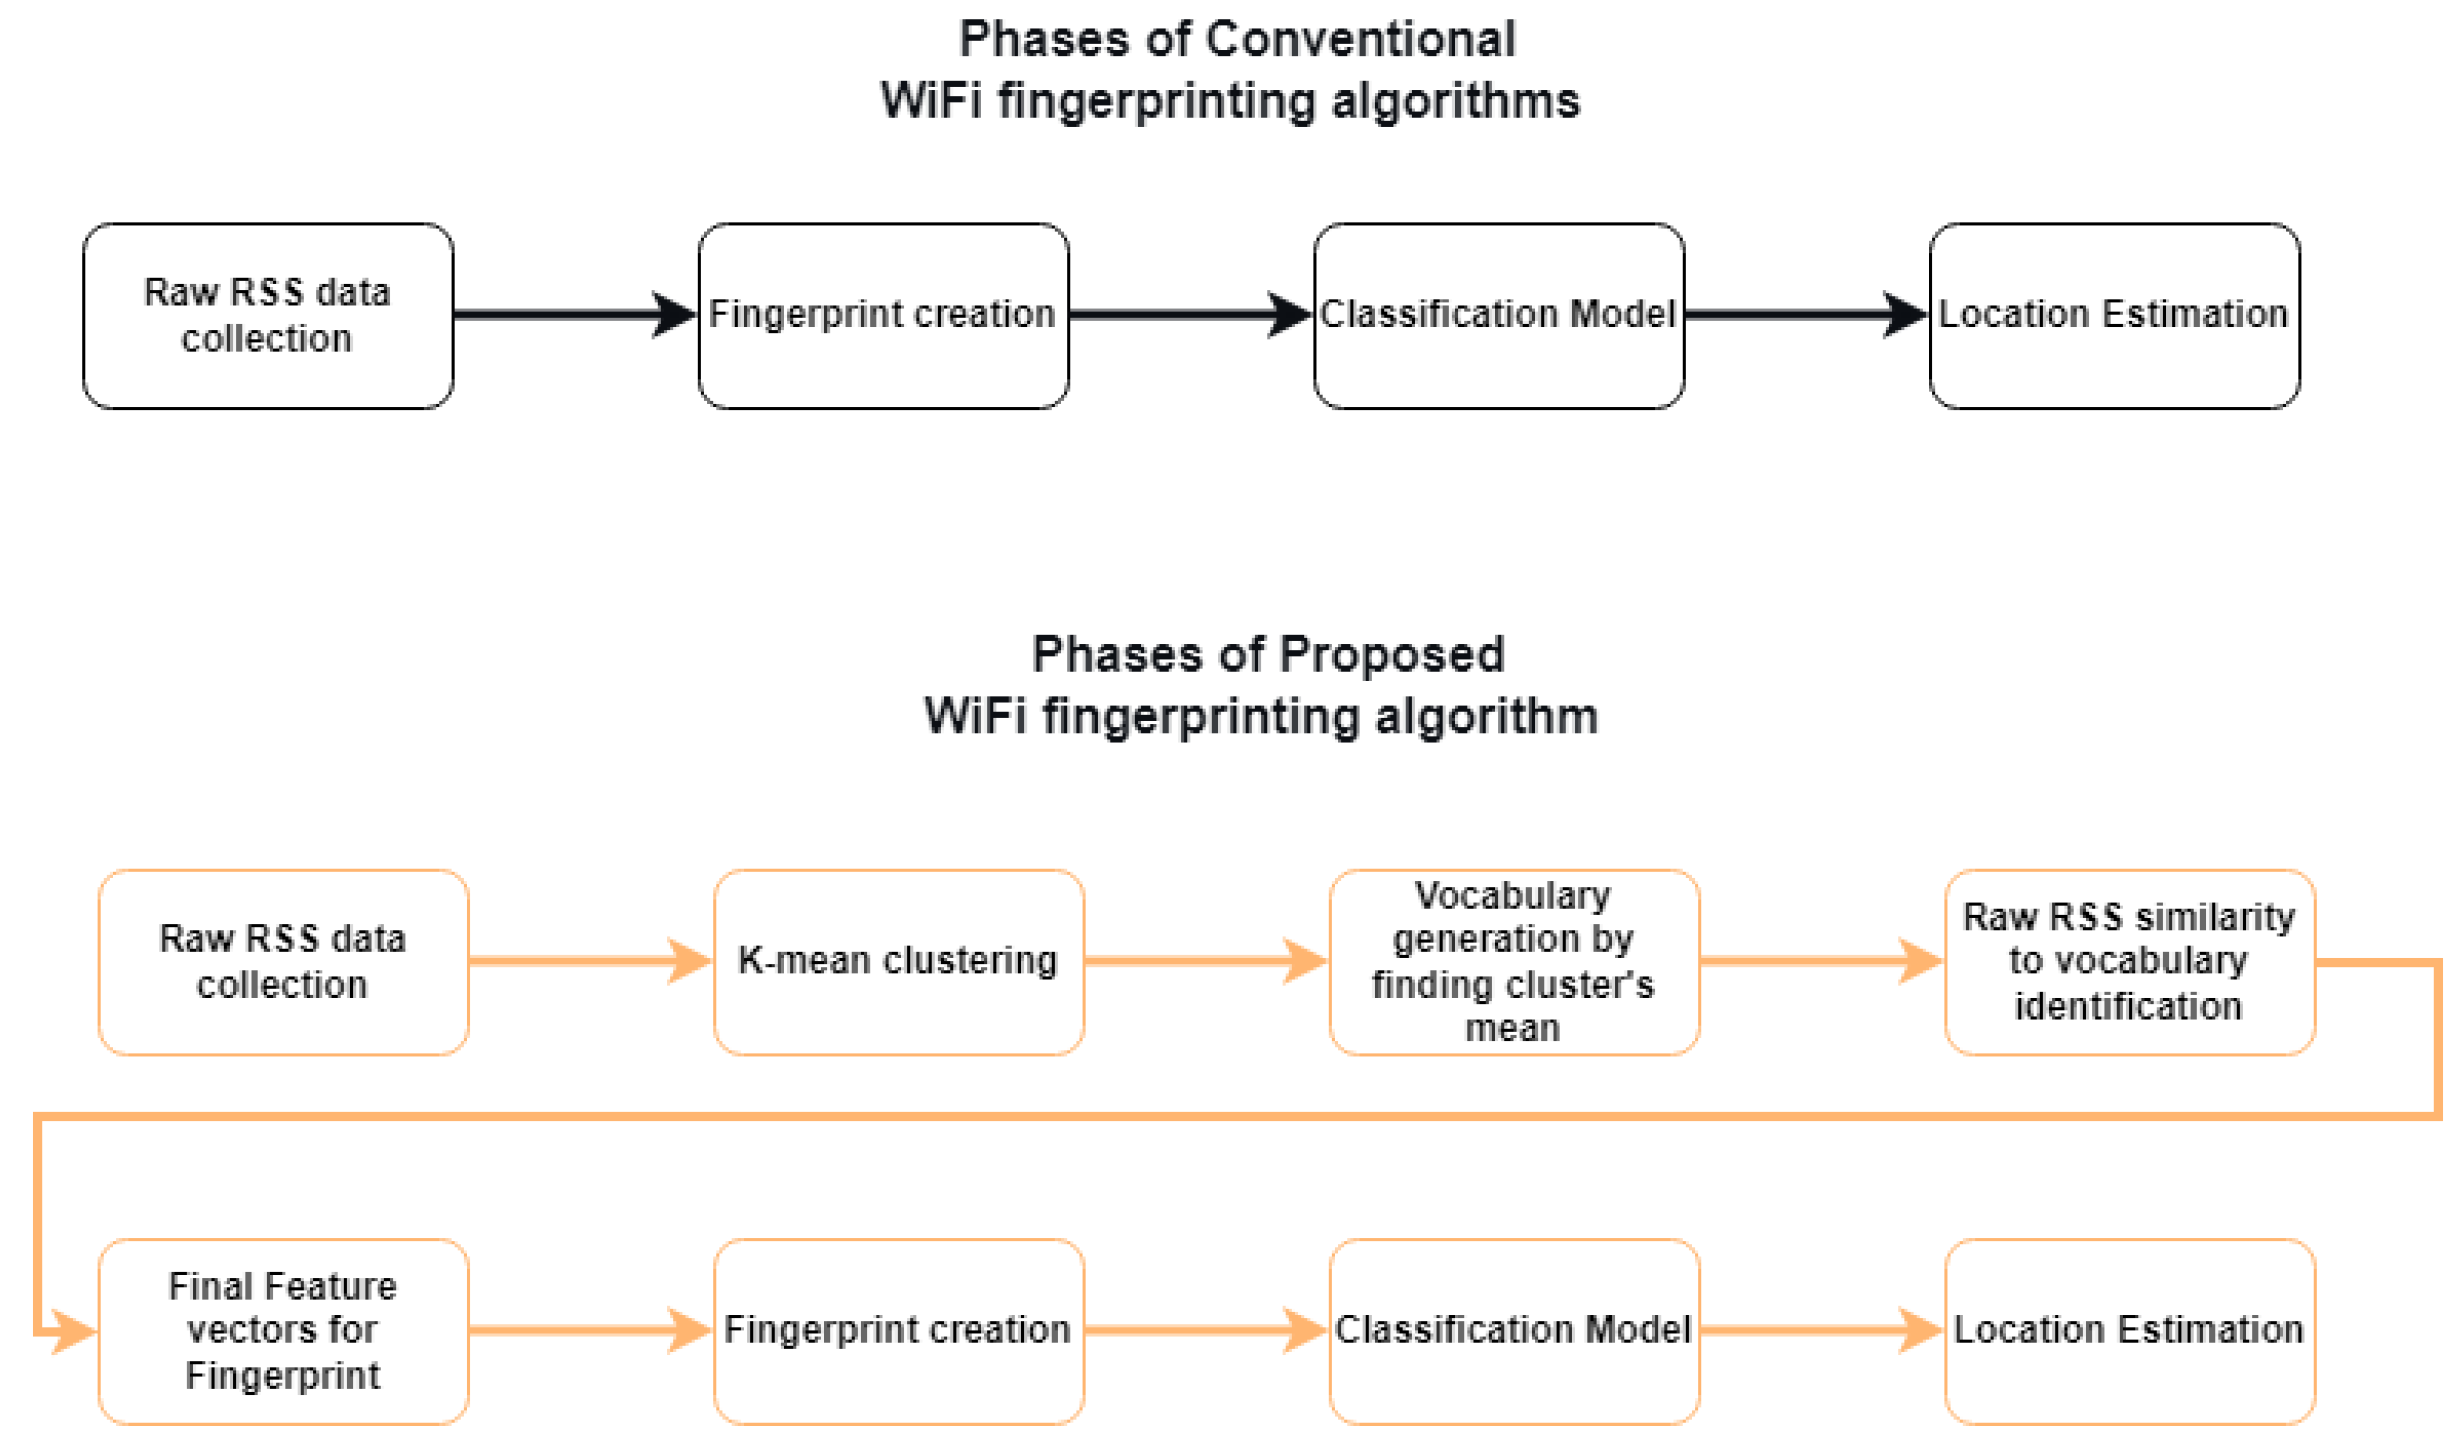
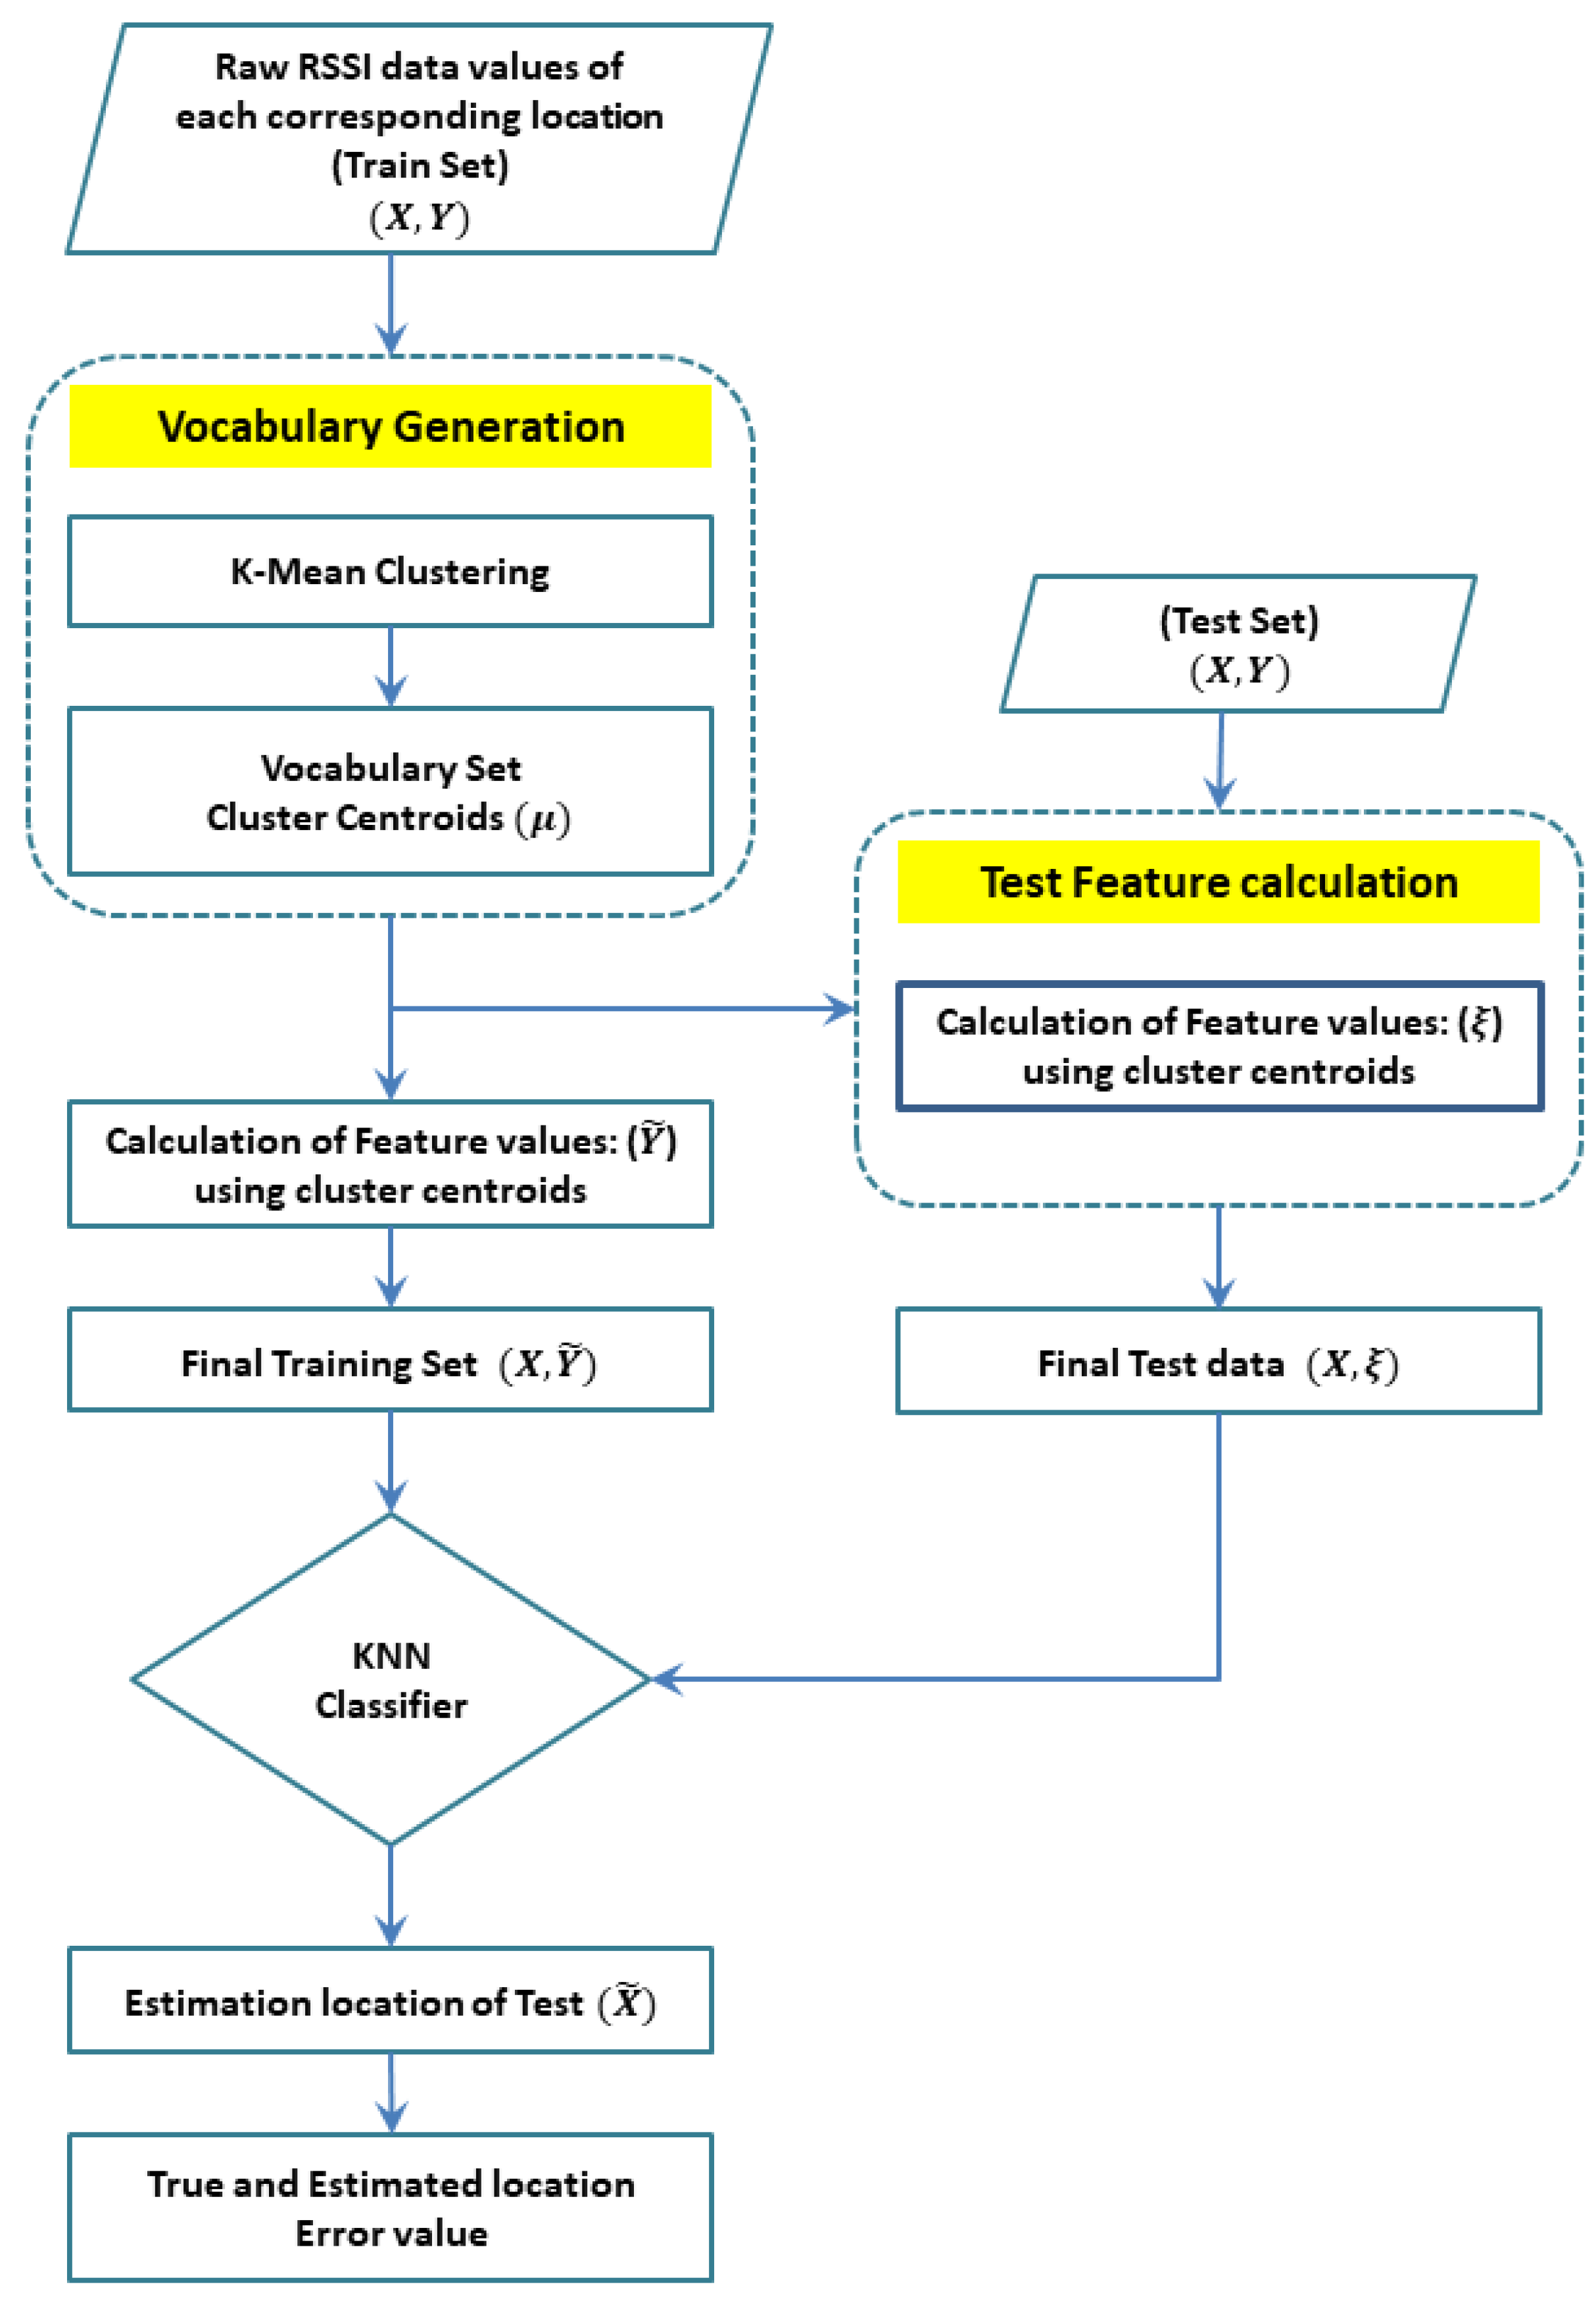
4. Methodology
- (a)
- Initialize to arbitrarily;
- (b)
- Choose the optimal a for a fixed ;
- (c)
- Choose the optimal for a fixed a;
- (d)
- Repeat steps (b) and (c) until convergence.
| Algorithm 1: Syntax of the proposed BoF indoor positioning model. |
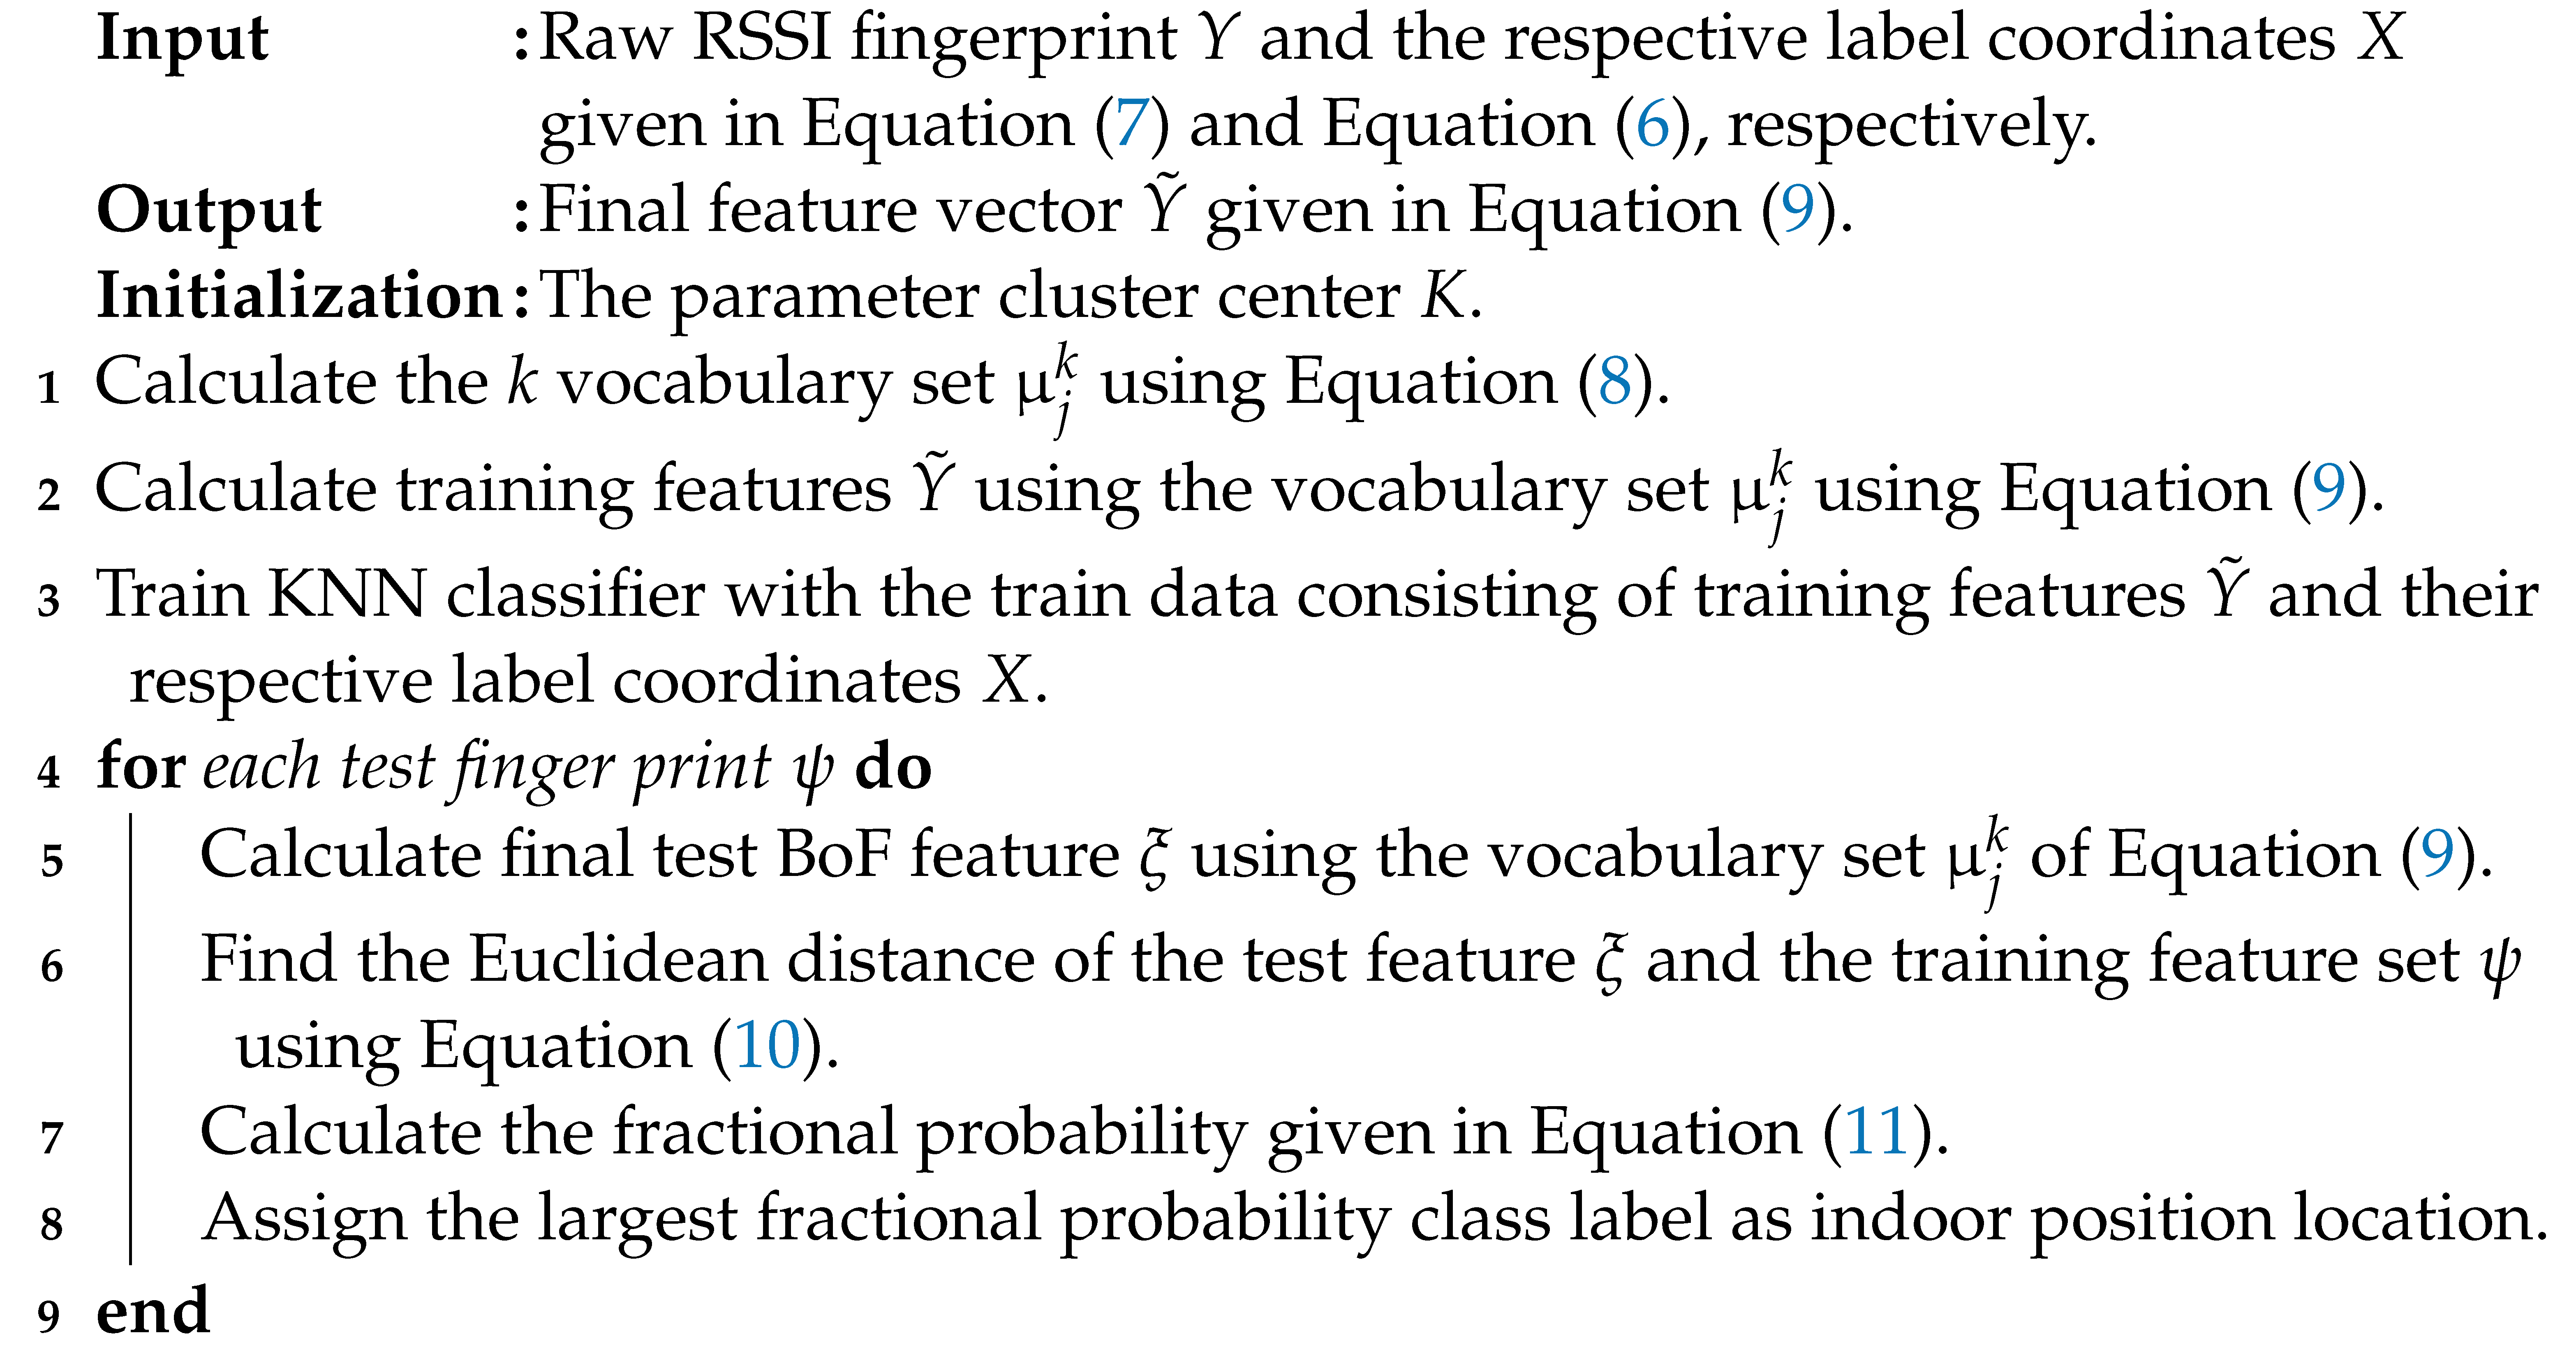 |
5. Performance Evaluation
5.1. Virtual Environments
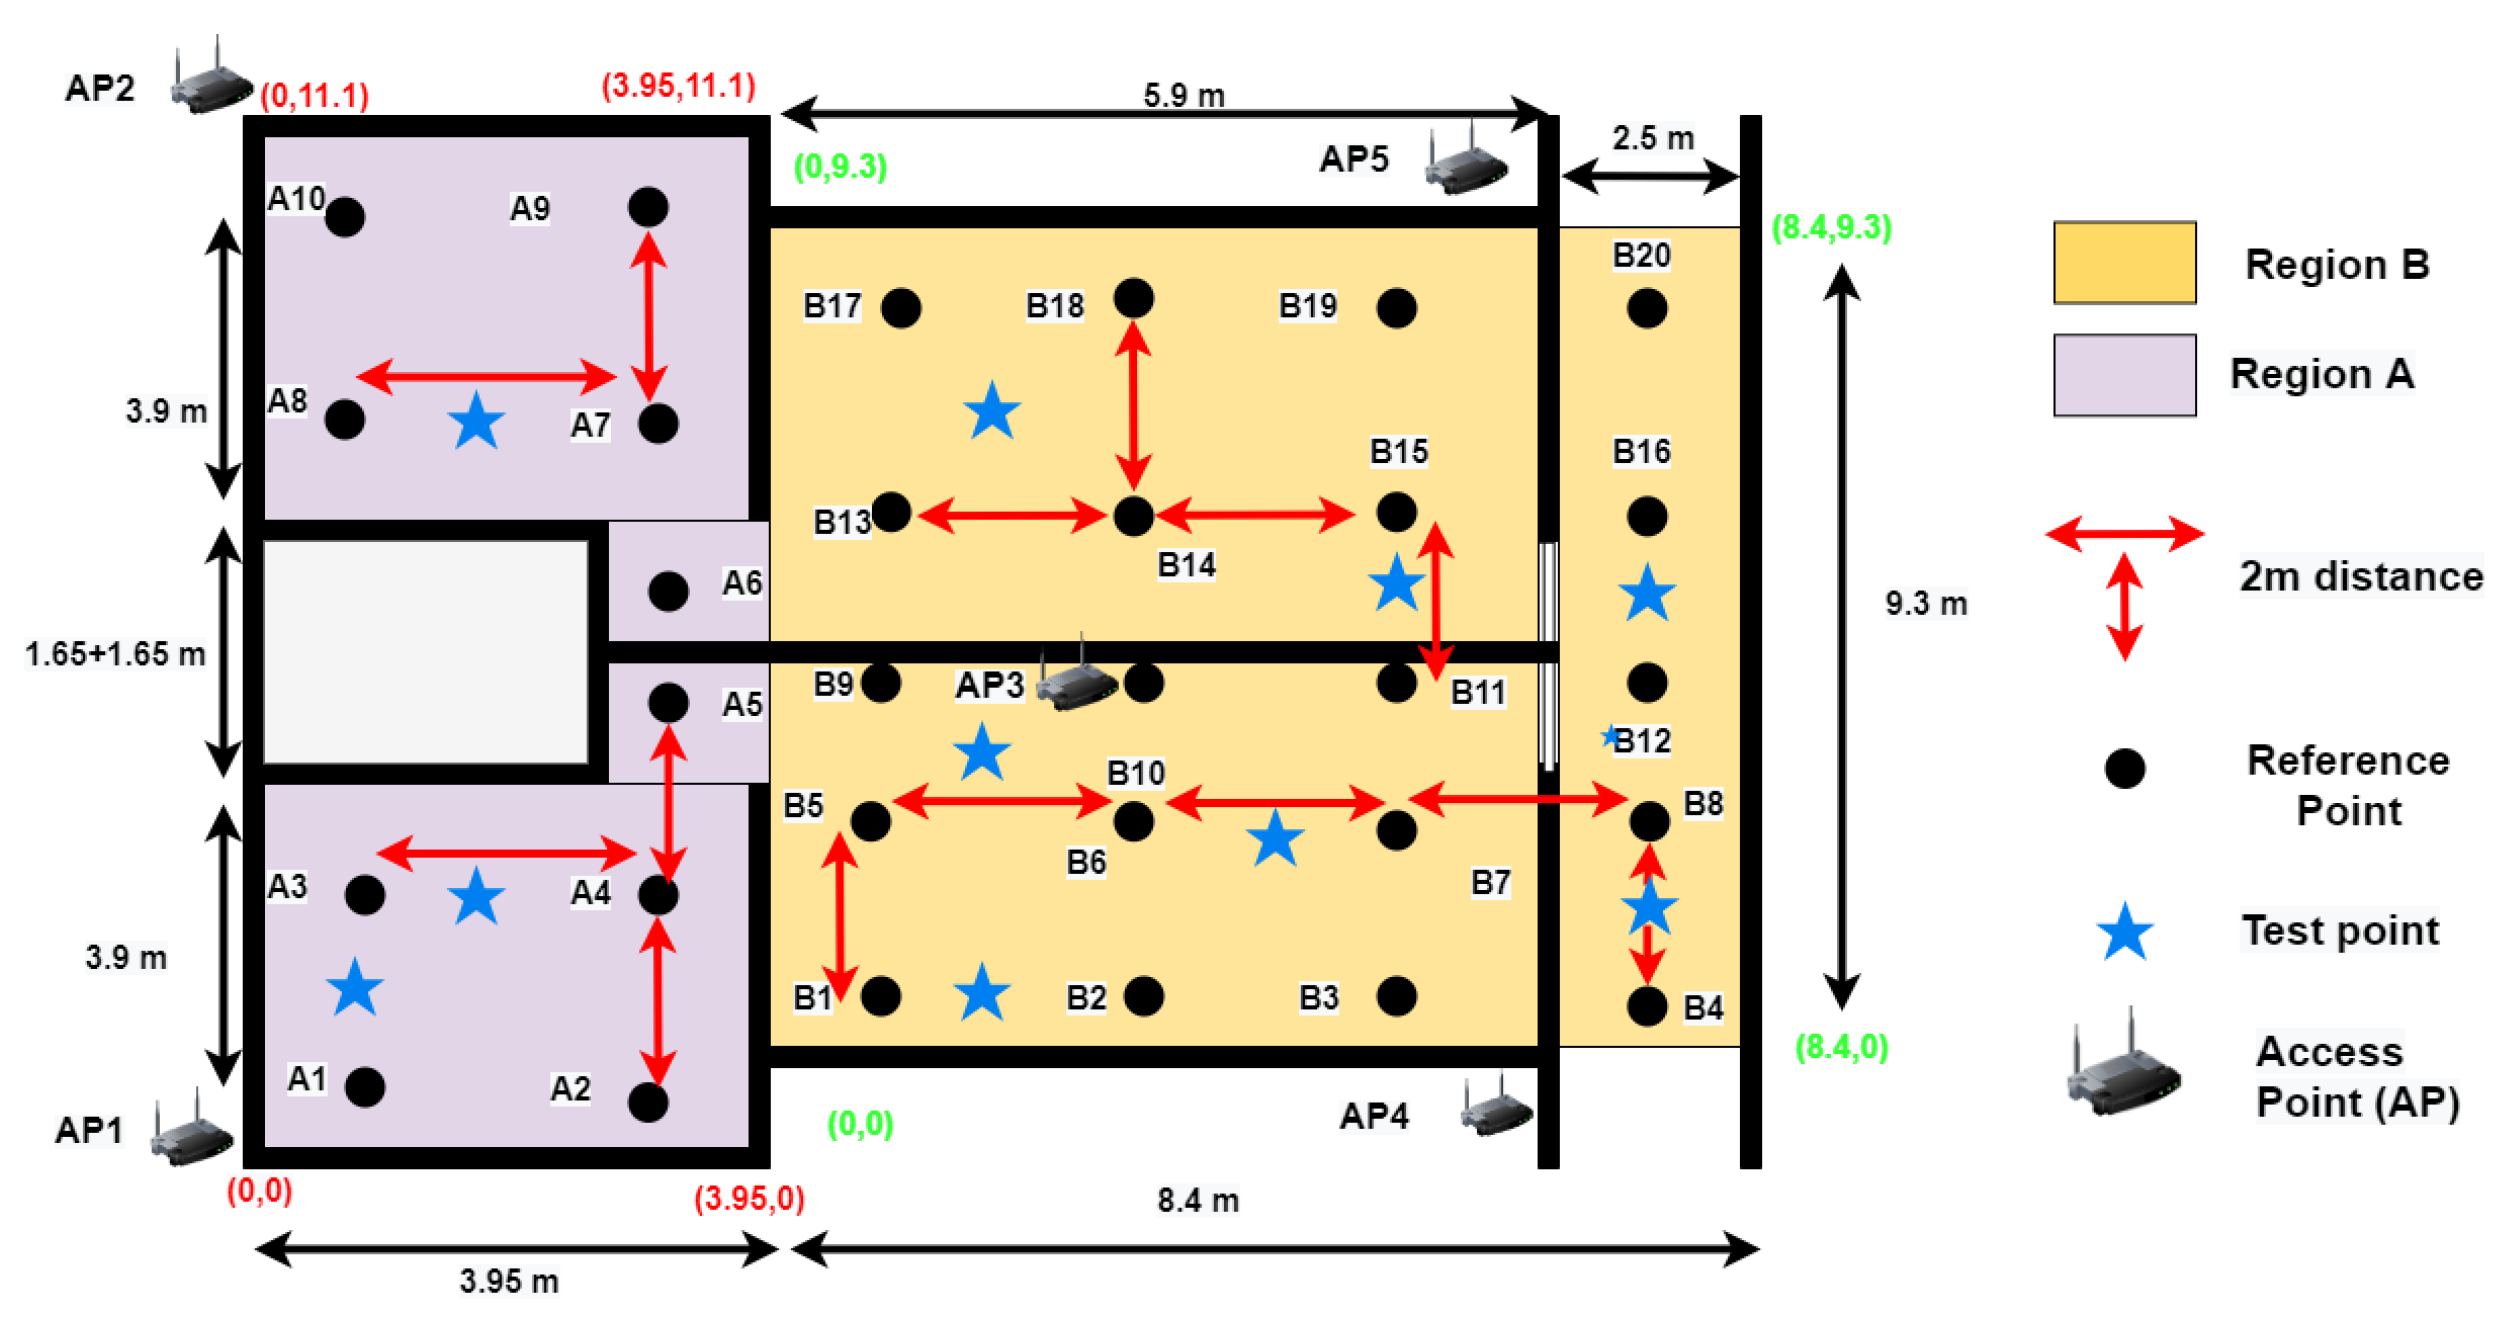
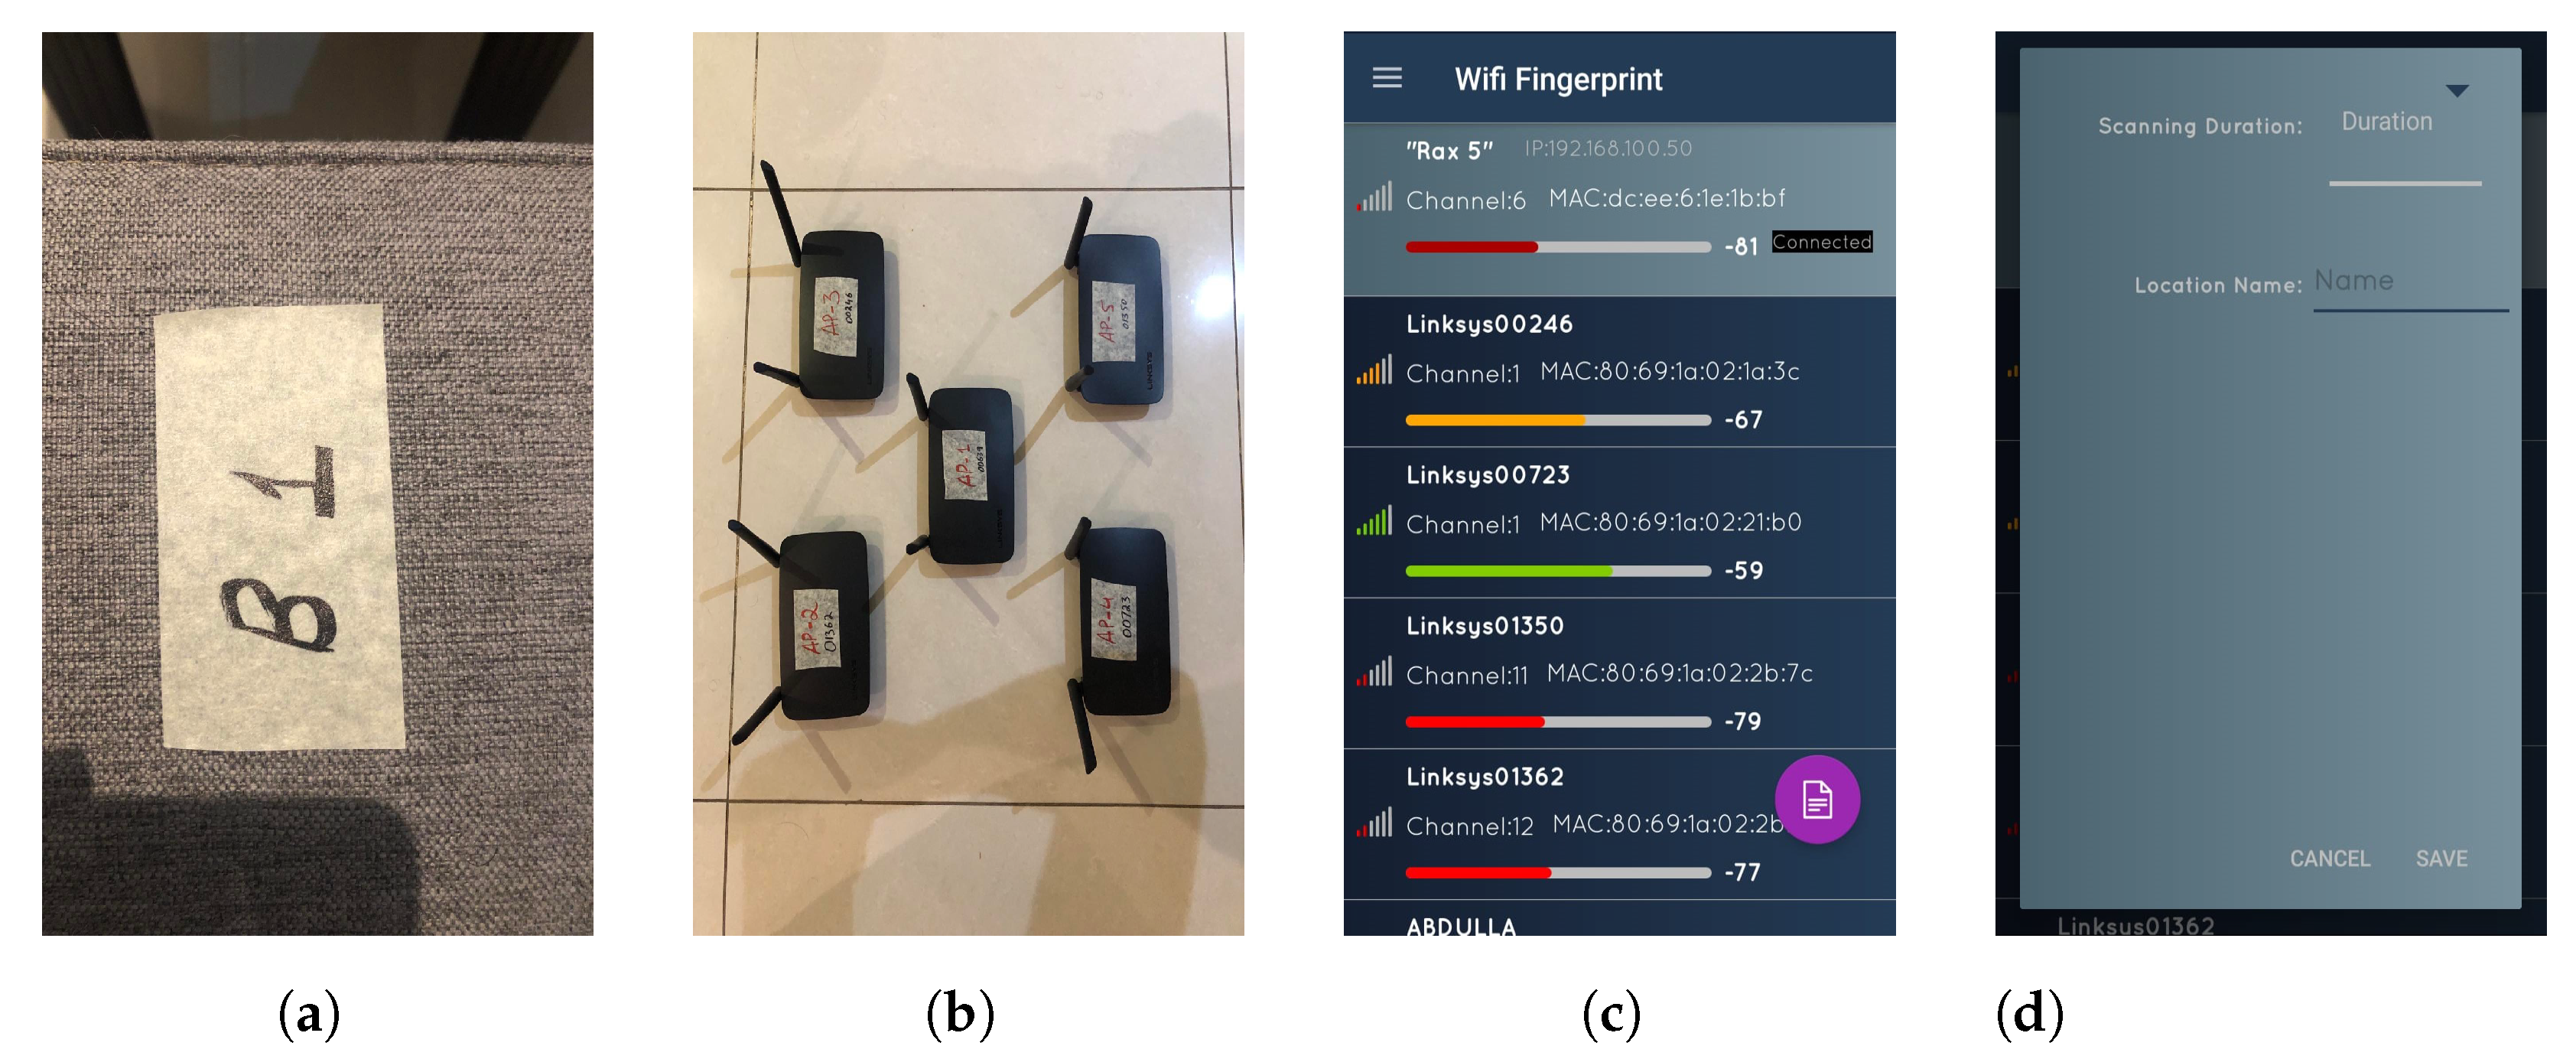
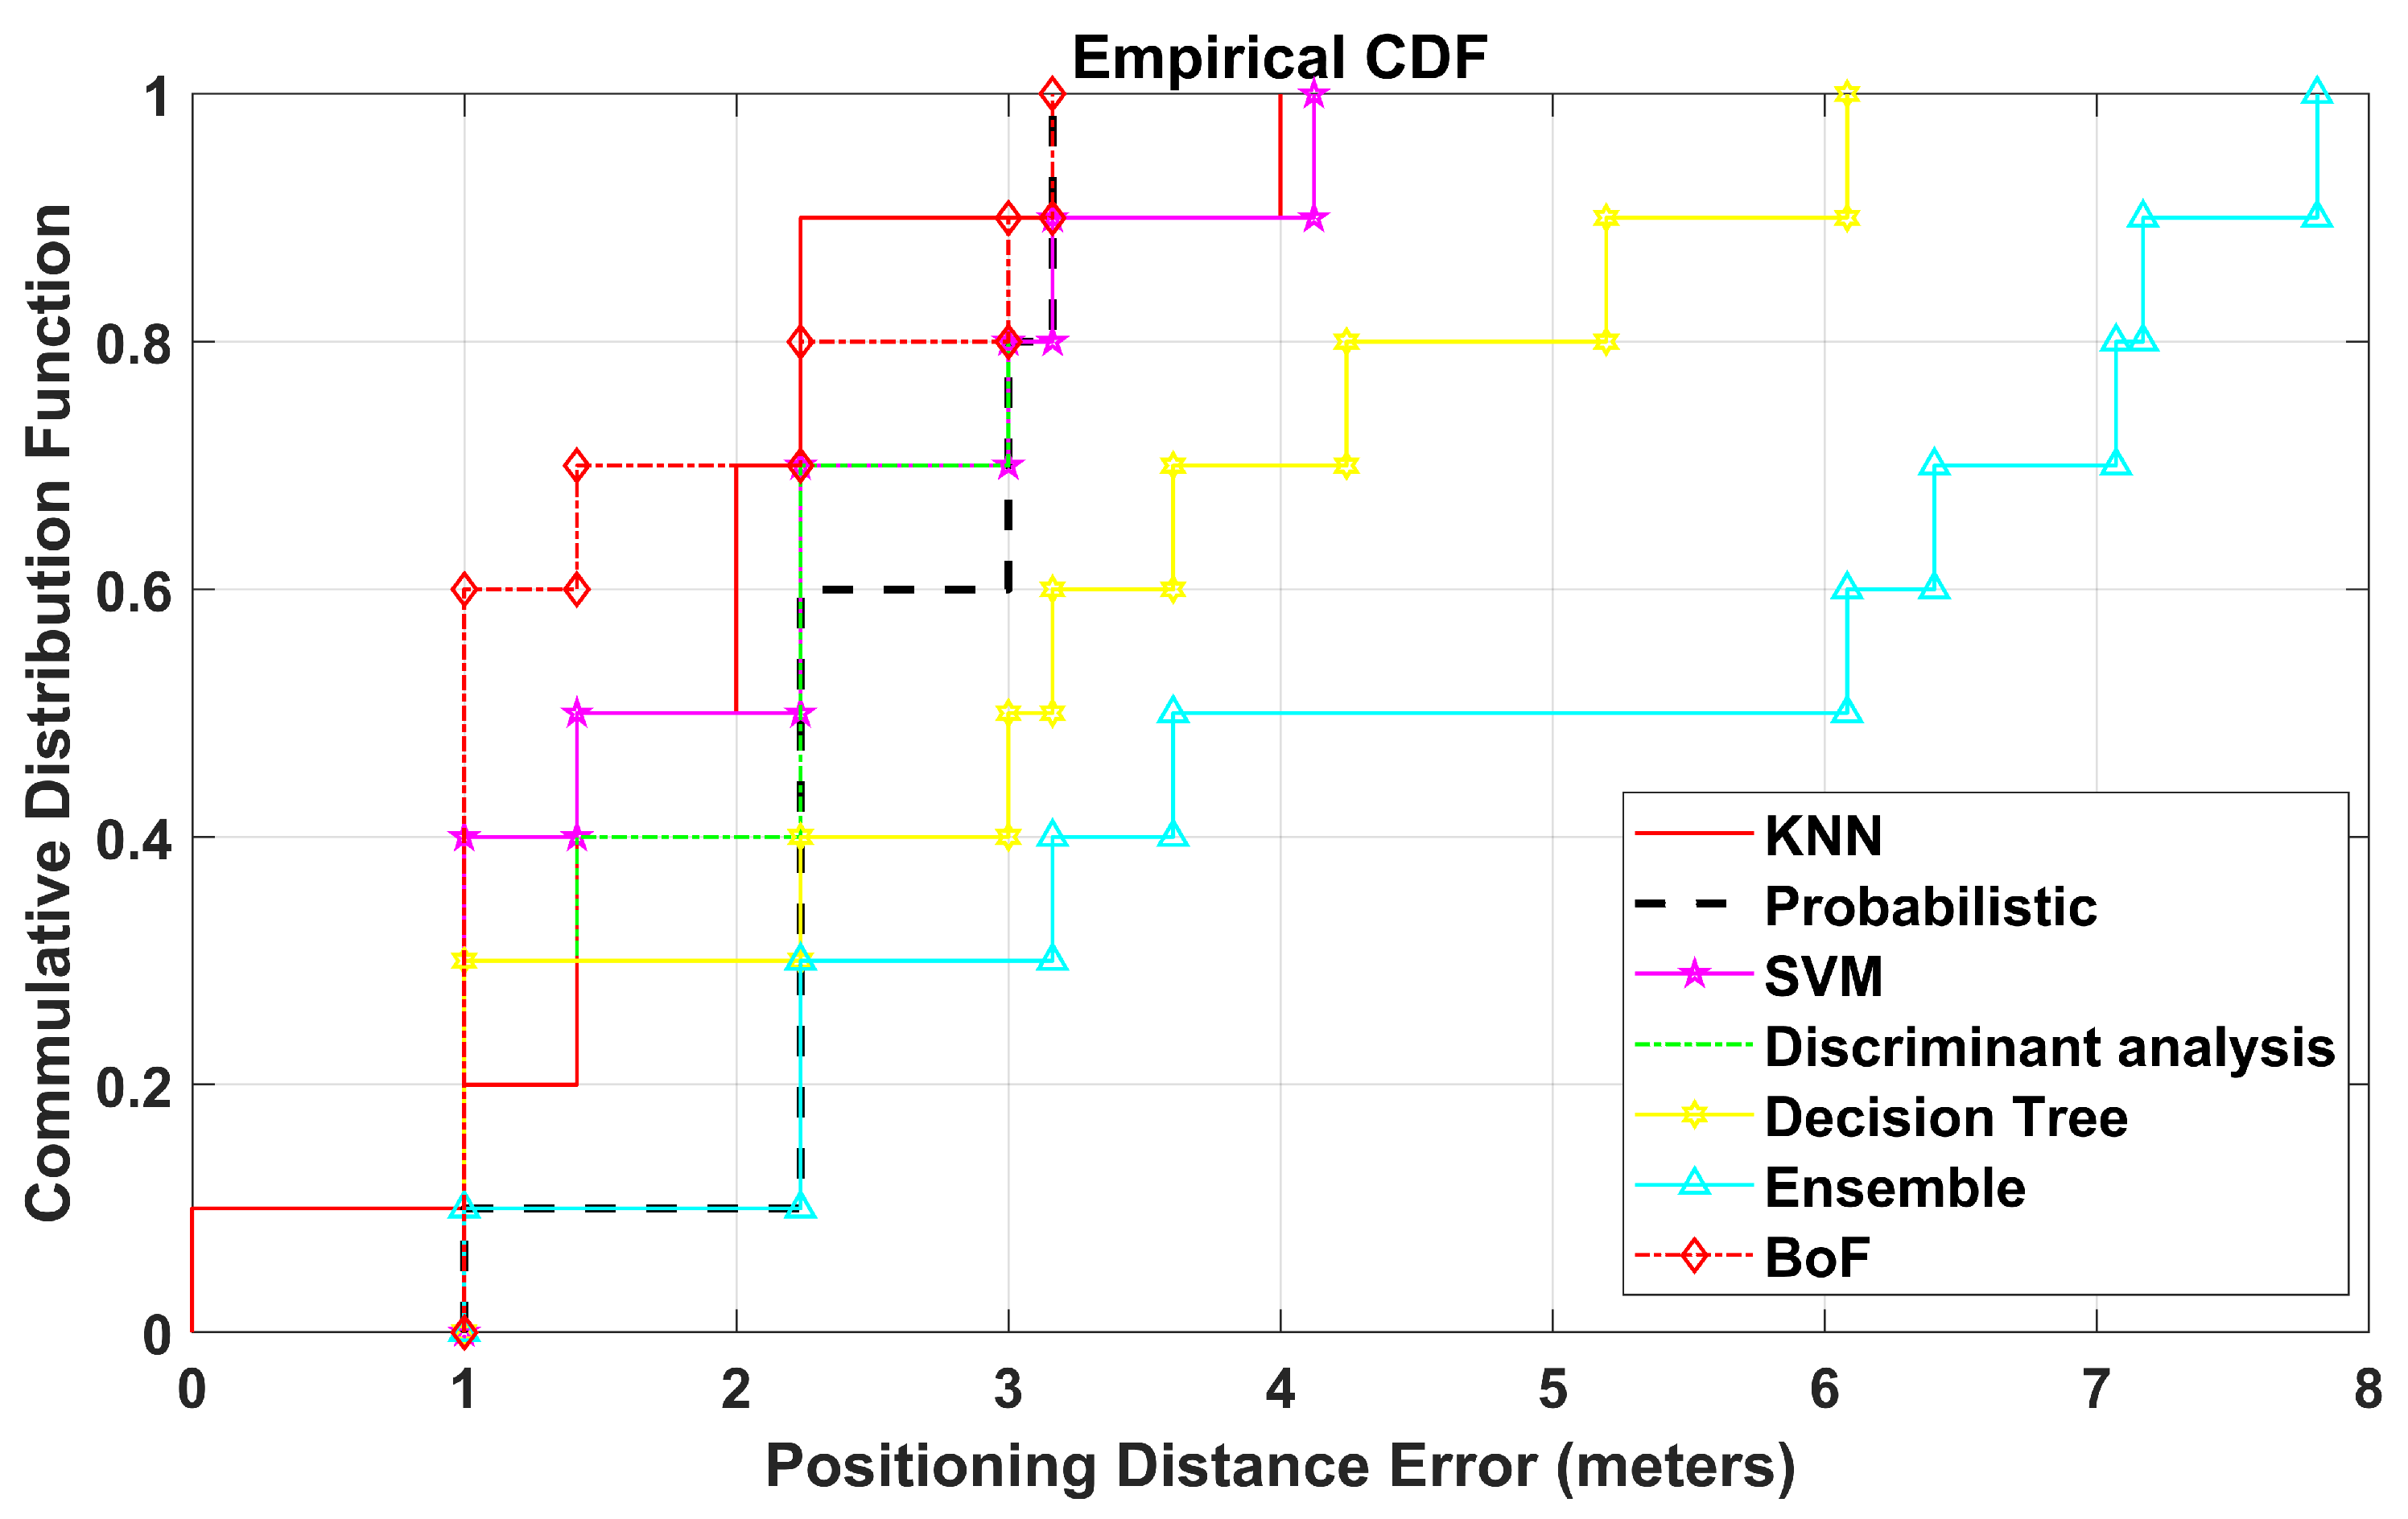
5.2. Real-Time Testbed Experiment
6. Conclusions
Author Contributions
Funding
Institutional Review Board Statement
Informed Consent Statement
Data Availability Statement
Acknowledgments
Conflicts of Interest
References
- Jabbar, W.A.; Wei, C.W.; Azmi, N.A.; Haironnazli, N.A. An IoT Raspberry Pi-based parking management system for smart campus. Internet Things 2021, 14, 100387. [Google Scholar] [CrossRef]
- Li, J.; Shen, Y.; Dai, W.; Fan, B. Design of student management system based on smart campus and wearable devices. In Artificial Intelligence in Education: Emerging Technologies, Models and Applications; Springer: Singapore, 2022; pp. 141–150. [Google Scholar]
- Haq, I.U.; Anwar, A.; Rehman, I.U.; Asif, W.; Sobnath, D.; Sherazi, H.H.; Nasralla, M.M. Dynamic Group Formation With Intelligent Tutor Collaborative Learning: A Novel Approach for Next Generation Collaboration. IEEE Access 2021, 9, 143406–143422. [Google Scholar] [CrossRef]
- Nasralla, M.M.; Al-Shattarat, B.; Almakhles, D.J.; Abdelhadi, A.; Abowardah, E.S. Futuristic Trends and Innovations for Examining the Performance of Course Learning Outcomes Using the Rasch Analytical Model. Electronics 2021, 10, 727. [Google Scholar] [CrossRef]
- Rosy, J.A.; Juliet, S. An enhanced intelligent attendance management system for smart campus. In Proceedings of the 6th International Conference on Computing Methodologies and Communication (ICCMC), Erode, India, 29–31 March 2022; pp. 1587–1591. [Google Scholar]
- Martini, M.G.; Hewage, C.T.; Nasralla, M.M.; Ognenoski, O. QoE control, monitoring, and management strategies. In Multimedia Quality of Experience (QoE); Wiley: Hoboken, NJ, USA, 2016; pp. 149–168. [Google Scholar] [CrossRef]
- Valks, B.; Arkesteijn, M.H.; Koutamanis, A.; den Heijer, A.C. Towards a smart campus: Supporting campus decisions with Internet of Things applications. Build. Res. Inf. 2021, 49, 1–20. [Google Scholar] [CrossRef]
- Aspilcueta Narvaez, A.; Núñez Fernández, D.; Gamarra Quispe, S.; Lazo Ochoa, D. Smart campus IoT guidance system for visitors based on bayesian filters. In Proceedings of the 5th Brazilian Technology Symposium; Springer: Cham, Switzerland, 2021; pp. 463–472. [Google Scholar]
- Petcovici, A.; Stroulia, E. Location-based services on a smart campus: A system and a study. In Proceedings of the 2016 IEEE 3rd World Forum on Internet of Things (WF-IOT), Reston, VA, USA, 12–14 December 2016; pp. 94–99. [Google Scholar]
- Liu, H.; Darabi, H.; Banerjee, P.; Liu, J. Survey of wireless indoor positioning techniques and systems. IEEE Trans. Syst. Man Cybern. Part C Appl. Rev. 2007, 37, 1067–1080. [Google Scholar] [CrossRef]
- Tegou, T.; Kalamaras, I.; Tsipouras, M.; Giannakeas, N.; Votis, K.; Tzovaras, D. A Low-Cost Indoor Activity Monitoring System for Detecting Frailty in Older Adults. Sensors 2019, 19, 452. [Google Scholar] [CrossRef] [Green Version]
- Sobnath, D.; Rehman, I.U.; Nasralla, M.M. Smart cities to improve mobility and quality of life of the visually impaired. In Technological Trends in Improved Mobility of the Visually Impaired; Springer: Cham, Switzerland, 2020; pp. 3–28. [Google Scholar]
- Khattak, S.B.A.; Jia, M.; Marey, M.; Guo, Q.; Gu, X. A Novel Single Anchor Localization Method for Wireless Sensors in 5G Satellite-Terrestrial Network. Alex. Eng. J. 2021, 61, 5595–5606. [Google Scholar] [CrossRef]
- Shit, R.C.; Sharma, S.; Puthal, D.; Zomaya, A.Y. Location of Things (LoT): A review and taxonomy of sensors localization in IoT infrastructure. IEEE Commun. Surv. Tutorials 2018, 20, 2028–2061. [Google Scholar] [CrossRef]
- Nagah Amr, M.; ELAttar, H.M.; Abd El Azeem, M.H.; El Badawy, H. An Enhanced Indoor Positioning Technique Based on a Novel Received Signal Strength Indicator Distance Prediction and Correction Model. Sensors 2021, 21, 719. [Google Scholar] [CrossRef]
- Zafari, F.; Gkelias, A.; Leung, K.K. A survey of indoor localization systems and technologies. IEEE Commun. Surv. Tutorials 2019, 21, 2568–2599. [Google Scholar] [CrossRef] [Green Version]
- Sheikh, S.M.; Asif, H.M.; Raahemifar, K.; Al-Turjman, F. Time difference of arrival based indoor positioning system using visible light communication. IEEE Access 2021, 9, 52113–52124. [Google Scholar] [CrossRef]
- Mazuelas, S.; Bahillo, A.; Lorenzo, R.M.; Fernandez, P.; Lago, F.A.; Garcia, E.; Blas, J.; Abril, E.J. Robust indoor positioning provided by real-time RSSI values in unmodified WLAN networks. IEEE J. Sel. Top. Signal Process. 2009, 3, 821–831. [Google Scholar] [CrossRef]
- Pinto, B.; Barreto, R.; Souto, E.; Oliveira, H. Robust RSSI-Based Indoor Positioning System Using K-Means Clustering and Bayesian Estimation. IEEE Sensors J. 2021, 21, 24462–24470. [Google Scholar] [CrossRef]
- Alhomayani, F.; Mahoor, M.H. Deep learning methods for fingerprint-based indoor positioning: A review. J.-Locat.-Based Serv. 2020, 14, 129–200. [Google Scholar] [CrossRef]
- Zhao, Y. An Improved Indoor Positioning Method Based on Nearest Neighbor Interpolation. Netw. Commun. Technol. 2021, 6, 1. [Google Scholar] [CrossRef]
- Sinha, R.S.; Hwang, S.-H. Comparison of CNN Applications for RSSI-Based Fingerprint Indoor Localization. Electronics 2019, 8, 989. [Google Scholar] [CrossRef] [Green Version]
- Adege, A.B.; Lin, H.-P.; Tarekegn, G.B.; Jeng, S.-S. Applying Deep Neural Network (DNN) for Robust Indoor Localization in Multi-Building Environment. Appl. Sci. 2018, 8, 1062. [Google Scholar] [CrossRef] [Green Version]
- Maduranga, M.W.; Abeysekara, R. Supervised machine learning for RSSI based indoor localization in IoT applications. Int. J. Comput. Appl. 2021, 183, 26–32. [Google Scholar] [CrossRef]
- Song, J.; Patel, M.; Ghaffari, M. Fusing Convolutional Neural Network and Geometric Constraint for Image-based Indoor Localization. IEEE Robot. Autom. Lett. 2022, 7, 1674–1681. [Google Scholar] [CrossRef]
- Fawad; Khan, M.J.; Rahman, M. Person Re-Identification by Discriminative Local Features of Overlapping Stripes. Symmetry 2020, 12, 647. [Google Scholar] [CrossRef] [Green Version]
- Poulose, A.; Han, D.S. Hybrid Deep Learning Model Based Indoor Positioning Using Wi-Fi RSSI Heat Maps for Autonomous Applications. Electronics 2021, 10, 2. [Google Scholar] [CrossRef]
- Sun, W.; Xue, M.; Yu, H.; Tang, H.; Lin, A. Augmentation of fingerprints for indoor WiFi localization based on Gaussian process regression. IEEE Trans. Veh. Technol. 2018, 67, 10896–10905. [Google Scholar] [CrossRef]
- Li, D.; Zhang, B.; Li, C. A feature-scaling-based k-nearest neighbor algorithm for indoor positioning systems. IEEE Internet Things J. 2015, 3, 590–597. [Google Scholar] [CrossRef]
- Ssekidde, P.; Steven Eyobu, O.; Han, D.S.; Oyana, T.J. Augmented CWT Features for Deep Learning-Based Indoor Localization Using WiFi RSSI Data. Appl. Sci. 2021, 11, 1806. [Google Scholar] [CrossRef]
- Yoo, J.; Park, J. Indoor Localization Based on Wi-Fi Received Signal Strength Indicators: Feature Extraction, Mobile Fingerprinting, and Trajectory Learning. Appl. Sci. 2019, 9, 3930. [Google Scholar] [CrossRef] [Green Version]
- Jiang, J.-R.; Subakti, H.; Liang, H.-S. Fingerprint Feature Extraction for Indoor Localization. Sensors 2021, 21, 5434. [Google Scholar] [CrossRef]
- Zhou, M.; Li, Y.; Tahir, M.J.; Geng, X.; Wang, Y.; He, W. Integrated statistical test of signal distributions and access point contributions for Wi-Fi indoor localization. IEEE Trans. Veh. Technol. 2021, 70, 5057–5070. [Google Scholar] [CrossRef]
- Christy Jeba Malar, A.; Deva Priya, M.; Femila, F.; Peter, S.S.; Ravi, V. Wi-Fi fingerprint localization based on multi-output least square support vector regression. In Intelligent Systems; Springer: Singapore, 2021; pp. 561–572. [Google Scholar]
- Guo, X.; Shao, S.; Ansari, N.; Khreishah, A. Indoor localization using visible light via fusion of multiple classifiers. IEEE Photonics J. 2017, 9, 1–6. [Google Scholar] [CrossRef]
- Yuan, T.; Xu, Y.; Wang, Y.; Han, P.; Chen, J. A tilt receiver correction method for visible light positioning using machine learning method. IEEE Photonics J. 2018, 10, 7909312. [Google Scholar] [CrossRef]
- Deselaers, T.; Pimenidis, L.; Ney, H. Bag-of-visual-words models for adult image classification and filtering. In Proceedings of the 19th International Conference on Pattern Recognition, Tampa, FL, USA, 8–11 December 2008; pp. 1–4. [Google Scholar]
- Alshami, I.H.; Ahmad, N.A.; Sahibuddin, S.; Firdaus, F. Adaptive Indoor Positioning Model Based on WLAN-Fingerprinting for Dynamic and Multi-Floor Environments. Sensors 2017, 17, 1789. [Google Scholar] [CrossRef]
- Bahl, P.; Padmanabhan, V.N. RADAR: An in-building RF-based user location and tracking system. In Proceedings of the IEEE 19th Annual Joint Conference of the IEEE Computer and Communications Societies, Tel Aviv, Israel, 26–30 March 2000; Volume 2, pp. 775–784. [Google Scholar]
- Khalajmehrabadi, A.; Gatsis, N.; Akopian, D. Modern WLAN fingerprinting indoor positioning methods and deployment challenges. IEEE Commun. Surv. Tutor. 2017, 19, 1974–2002. [Google Scholar] [CrossRef] [Green Version]
- Khattak, S.B.; Jia, M.; Guo, Q.; Gu, X. Improving Positioning Accuracy Using WLAN Optimization for Location Based Services and Cognitive Radio Networks. In Proceedings of the International Conference on Wireless and Satellite Systems, Online, 31 July–2 August 2021; pp. 607–621. [Google Scholar]
- Jia, M.; Khattak, S.B.; Guo, Q.; Gu, X.; Lin, Y. Access point optimization for reliable indoor localization systems. IEEE Trans. Reliab. 2019, 69, 1424–1436. [Google Scholar] [CrossRef]
- Cover, T.; Hart, P. Nearest neighbor pattern classification. IEEE Trans. Inf. Theory 1967, 13, 21–27. [Google Scholar] [CrossRef] [Green Version]
- Youssef, M.; Agrawala, A. The Horus WLAN location determination system. In Proceedings of the 3rd International Conference on Mobile Systems, Applications, and Services, Seattle, WA, USA, 6–8 June 2005; pp. 205–218. [Google Scholar]
- Cristianini, N.; Shawe-Taylor, J. An Introduction to Support Vector Machines and Other Kernel-Based Learning Methods; Cambridge University Press: Cambridge, UK, 2000. [Google Scholar]
- Breiman, L.; Friedman, J.H.; Olshen, R.A.; Stone, C.J. Classification and Regression Trees; Routledge: London, UK, 2017. [Google Scholar]
- Breiman, L. Random forests. Mach. Learn. 2001, 45, 5–32. [Google Scholar] [CrossRef] [Green Version]
- Huberty, C.J. Discriminant analysis. Rev. Educ. Res. 1975, 45, 543–598. [Google Scholar] [CrossRef]
- Polak, L.; Rozum, S.; Slanina, M.; Bravenec, T.; Fryza, T.; Pikrakis, A. Received Signal Strength Fingerprinting-Based Indoor Location Estimation Employing Machine Learning. Sensors 2021, 21, 4605. [Google Scholar] [CrossRef]
- Alshami, I.H.; Ahmad, N.A.; Sahibuddin, S. People’s Presence effect ON WLAN-based IPS accuracy. J. Teknol. 2015, 77, 173–178. [Google Scholar] [CrossRef]
- Faria, D.B. Modeling Signal Attenuation in IEEE 802.11 Wireless Lans; Computer Science Department, Stanford University: Stanford, CA, USA, 2005; Volume 1. [Google Scholar]
- Wifi Fingerprint. Available online: https://play.google.com/store/apps/details?id=com.elearnna.www.wififingerprint&hl=en&gl=US (accessed on 30 April 2022).


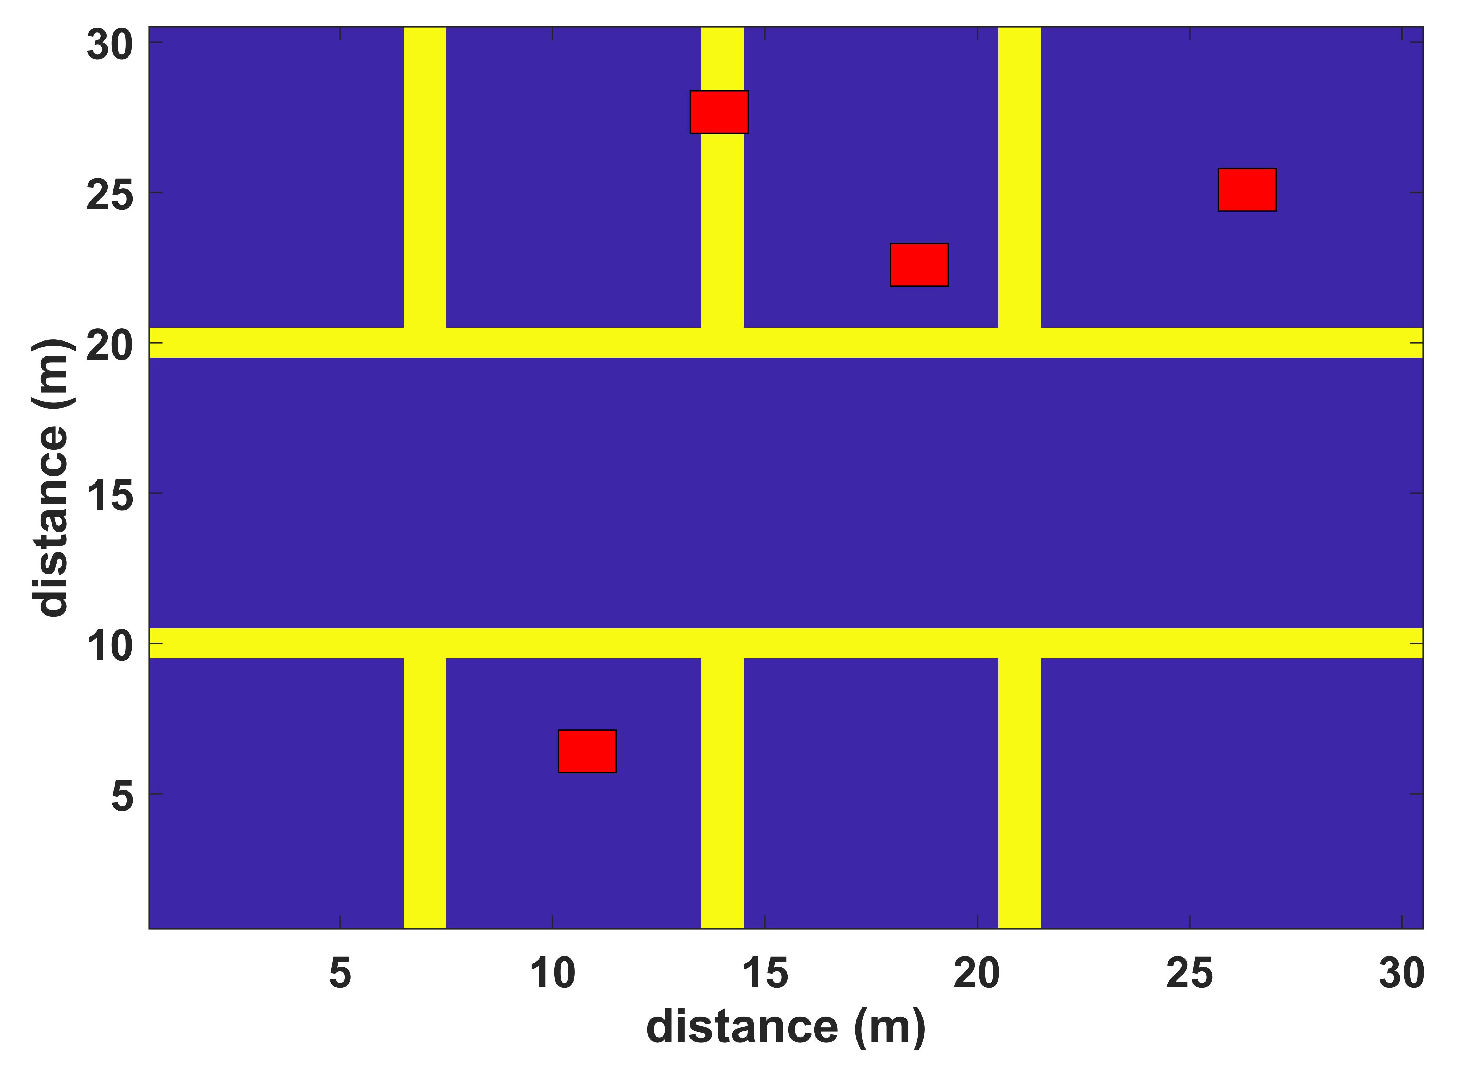
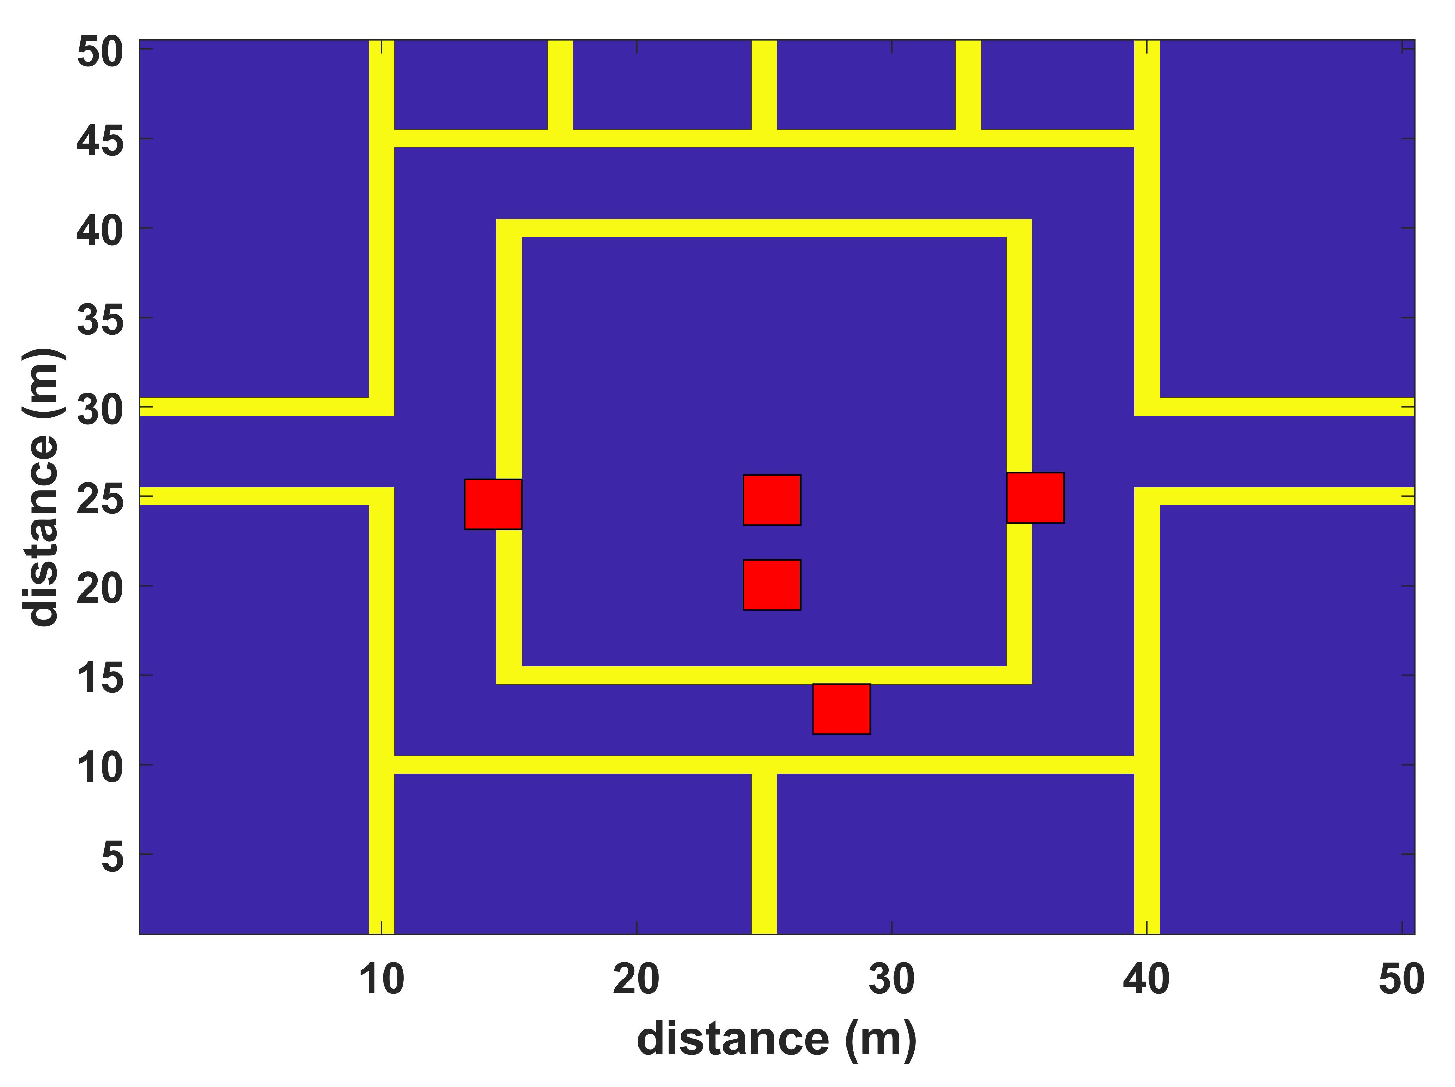
| Scenario | Dimensions | APs | Coordinates of APs |
|---|---|---|---|
| Scenario 1 | 30 m × 30 m | 4 APs | (25, 25) (19, 23) (13, 27) (11, 7) |
| Scenario 2 | 50 m × 50 m | 5 APs | (25, 25) (37, 25) (25, 19) (28, 13) (16, 25) |
| Parameter | Value |
|---|---|
| Path loss exponent n | 3 |
| Number of APs | 4 and 5 |
| Wall attenuation factor | 4 dB |
| People attenuation factor | 3 dB |
| Reference distance | 1 m |
| Power at | −30 dBm |
| Transmission power | 10 dBm |
| RSS samples collected at RP | 20 |
| k in KNN | 4 |
| Grid size | 2 × 2 |
| No. of position queries in virtual environments | 100 |
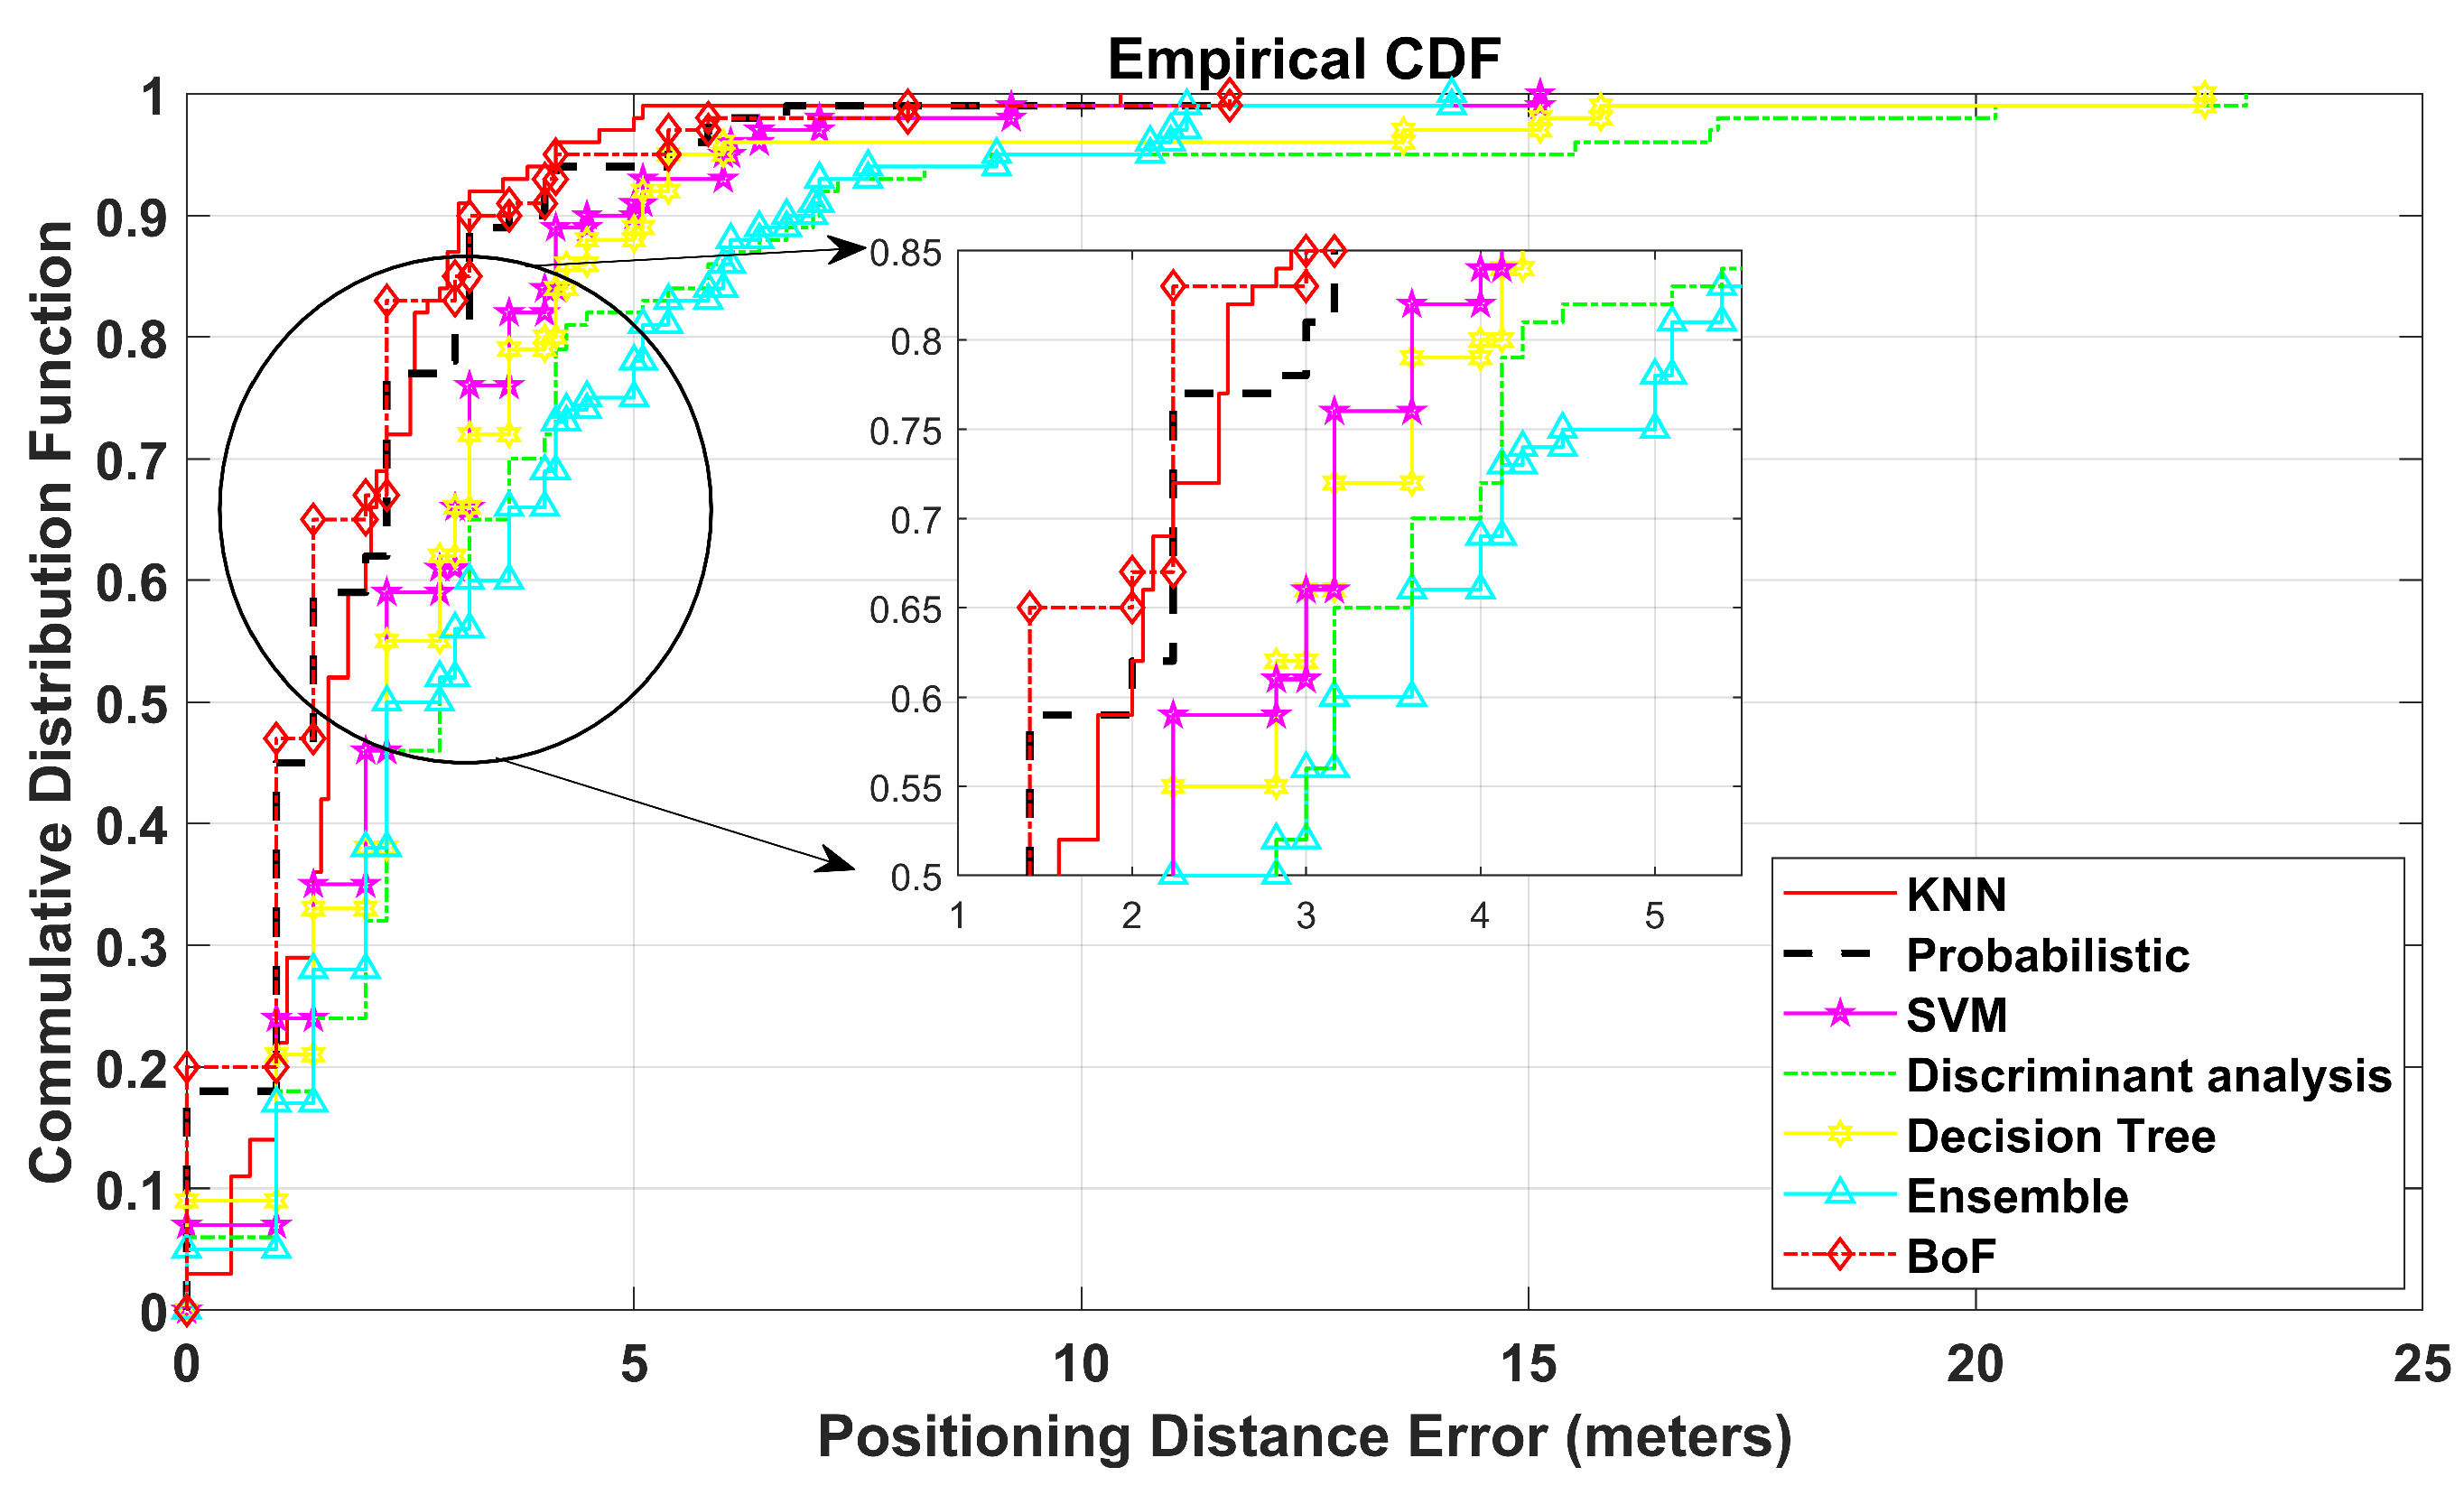
| KNN | Probabilistic | SVM | Discriminant Analysis | Decision Tree | Ensemble Learning | Bag-of-Features |
|---|---|---|---|---|---|---|
| 1.922 | 1.841 | 2.617 | 3.729 | 3.438 | 3.005 | 1.702 |
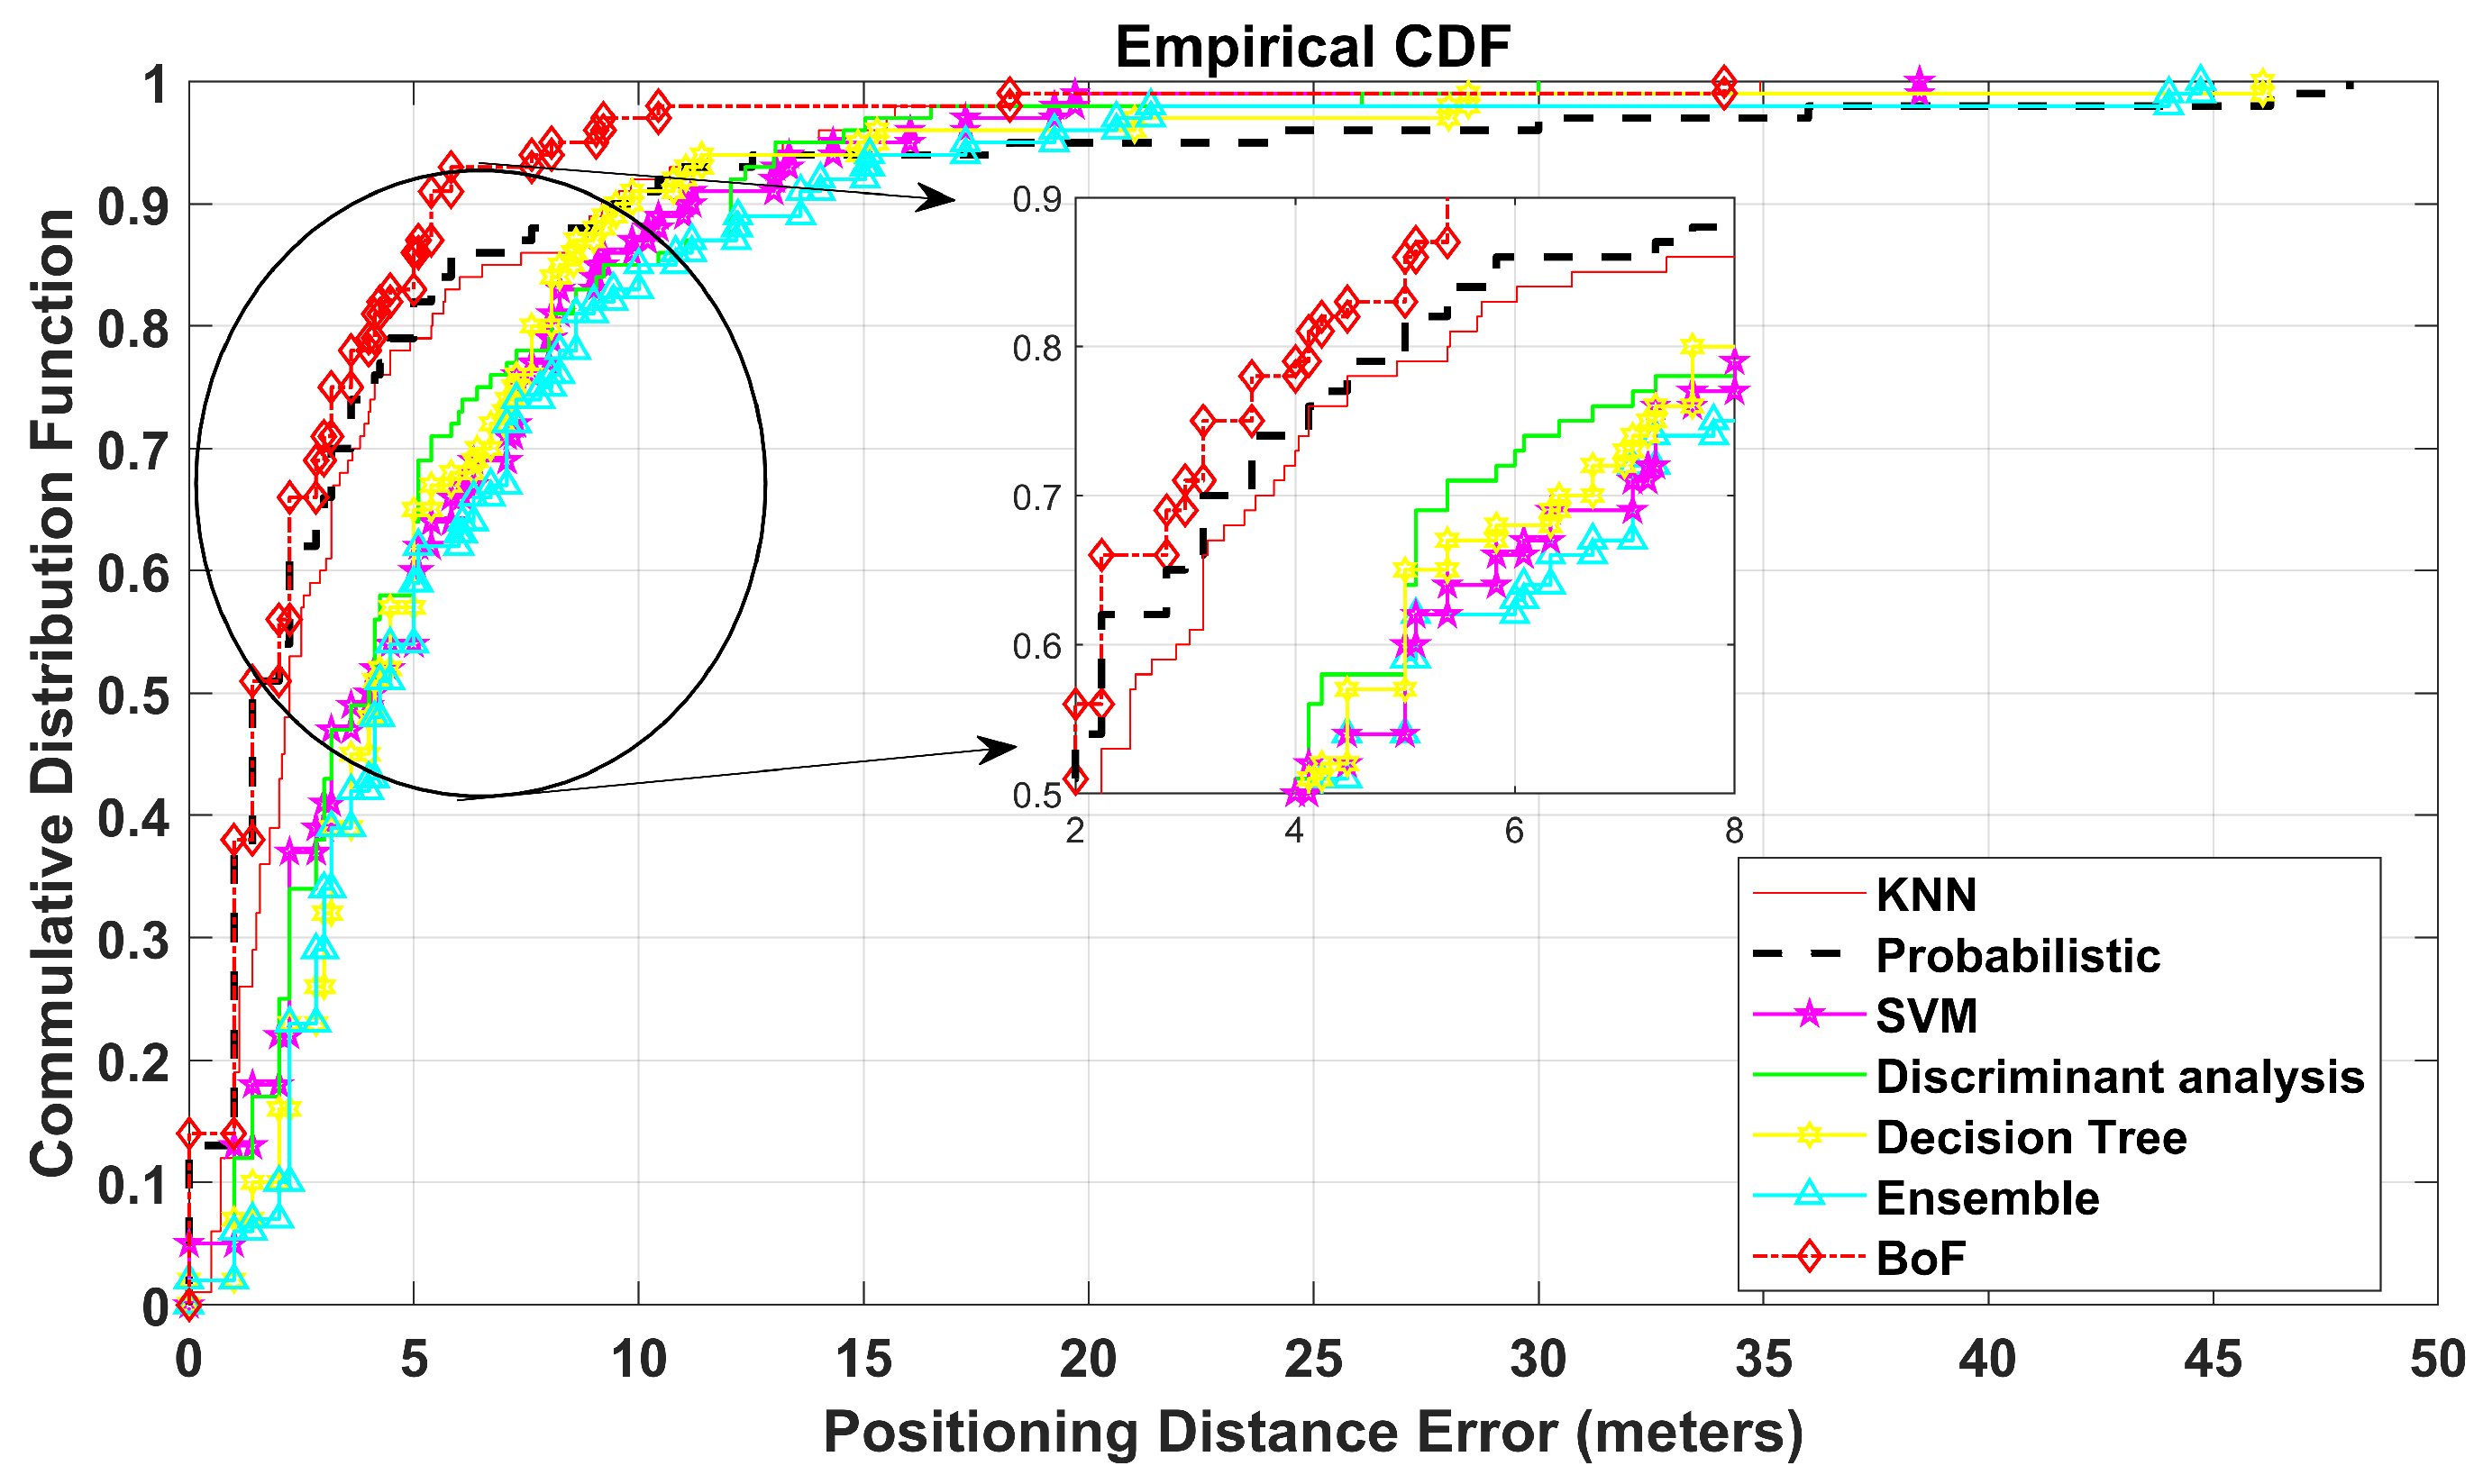
| KNN | Probabilistic | SVM | Discriminant Analysis | Decision Tree | Ensemble Learning | Bag-of-Features |
|---|---|---|---|---|---|---|
| 3.929 | 4.447 | 5.480 | 5.298 | 6.531 | 5.820 | 2.837 |
| KNN | Probabilistic | SVM | Discriminant Analysis | Decision Tree | Ensemble Learning | Bag-of-Features |
|---|---|---|---|---|---|---|
| 1.772 | 2.450 | 2.017 | 2.029 | 3.053 | 4.678 | 1.581 |
Publisher’s Note: MDPI stays neutral with regard to jurisdictional claims in published maps and institutional affiliations. |
© 2022 by the authors. Licensee MDPI, Basel, Switzerland. This article is an open access article distributed under the terms and conditions of the Creative Commons Attribution (CC BY) license (https://creativecommons.org/licenses/by/4.0/).
Share and Cite
Altaf Khattak, S.B.; Fawad; Nasralla, M.M.; Esmail, M.A.; Mostafa, H.; Jia, M. WLAN RSS-Based Fingerprinting for Indoor Localization: A Machine Learning Inspired Bag-of-Features Approach. Sensors 2022, 22, 5236. https://doi.org/10.3390/s22145236
Altaf Khattak SB, Fawad, Nasralla MM, Esmail MA, Mostafa H, Jia M. WLAN RSS-Based Fingerprinting for Indoor Localization: A Machine Learning Inspired Bag-of-Features Approach. Sensors. 2022; 22(14):5236. https://doi.org/10.3390/s22145236
Chicago/Turabian StyleAltaf Khattak, Sohaib Bin, Fawad, Moustafa M. Nasralla, Maged Abdullah Esmail, Hala Mostafa, and Min Jia. 2022. "WLAN RSS-Based Fingerprinting for Indoor Localization: A Machine Learning Inspired Bag-of-Features Approach" Sensors 22, no. 14: 5236. https://doi.org/10.3390/s22145236
APA StyleAltaf Khattak, S. B., Fawad, Nasralla, M. M., Esmail, M. A., Mostafa, H., & Jia, M. (2022). WLAN RSS-Based Fingerprinting for Indoor Localization: A Machine Learning Inspired Bag-of-Features Approach. Sensors, 22(14), 5236. https://doi.org/10.3390/s22145236