
Low-Altitude Infrared Slow-Moving Small Target Detection via Spatial-Temporal Features Measure


Abstract
:1. Introduction
- (1)
- A local grayscale difference (LGD) measure based on a circular kernel is proposed to exploit the spatial feature of the small target;
- (2)
- A short-term energy aggregation (SEA) mechanism is proposed to enhance the dim target and suppress the stationary background. Furthermore, a long-term trajectory continuity (LTC) measurement is designed to confirm the real target and eliminate random noises. They fully excavate the temporal features of the slow-moving target.
- (3)
- A low-altitude infrared slow-moving small target detection method, namely STFM, is proposed. Experiments were conducted on six real image sequences—the proposed method can achieve a detection probability of 97% at a false alarm rate of 0.01% and performs better than the state-of-the-art methods.
2. Related Work
2.1. Single-Frame Detection Methods
2.2. Sequential Detection Methods
3. Methodology
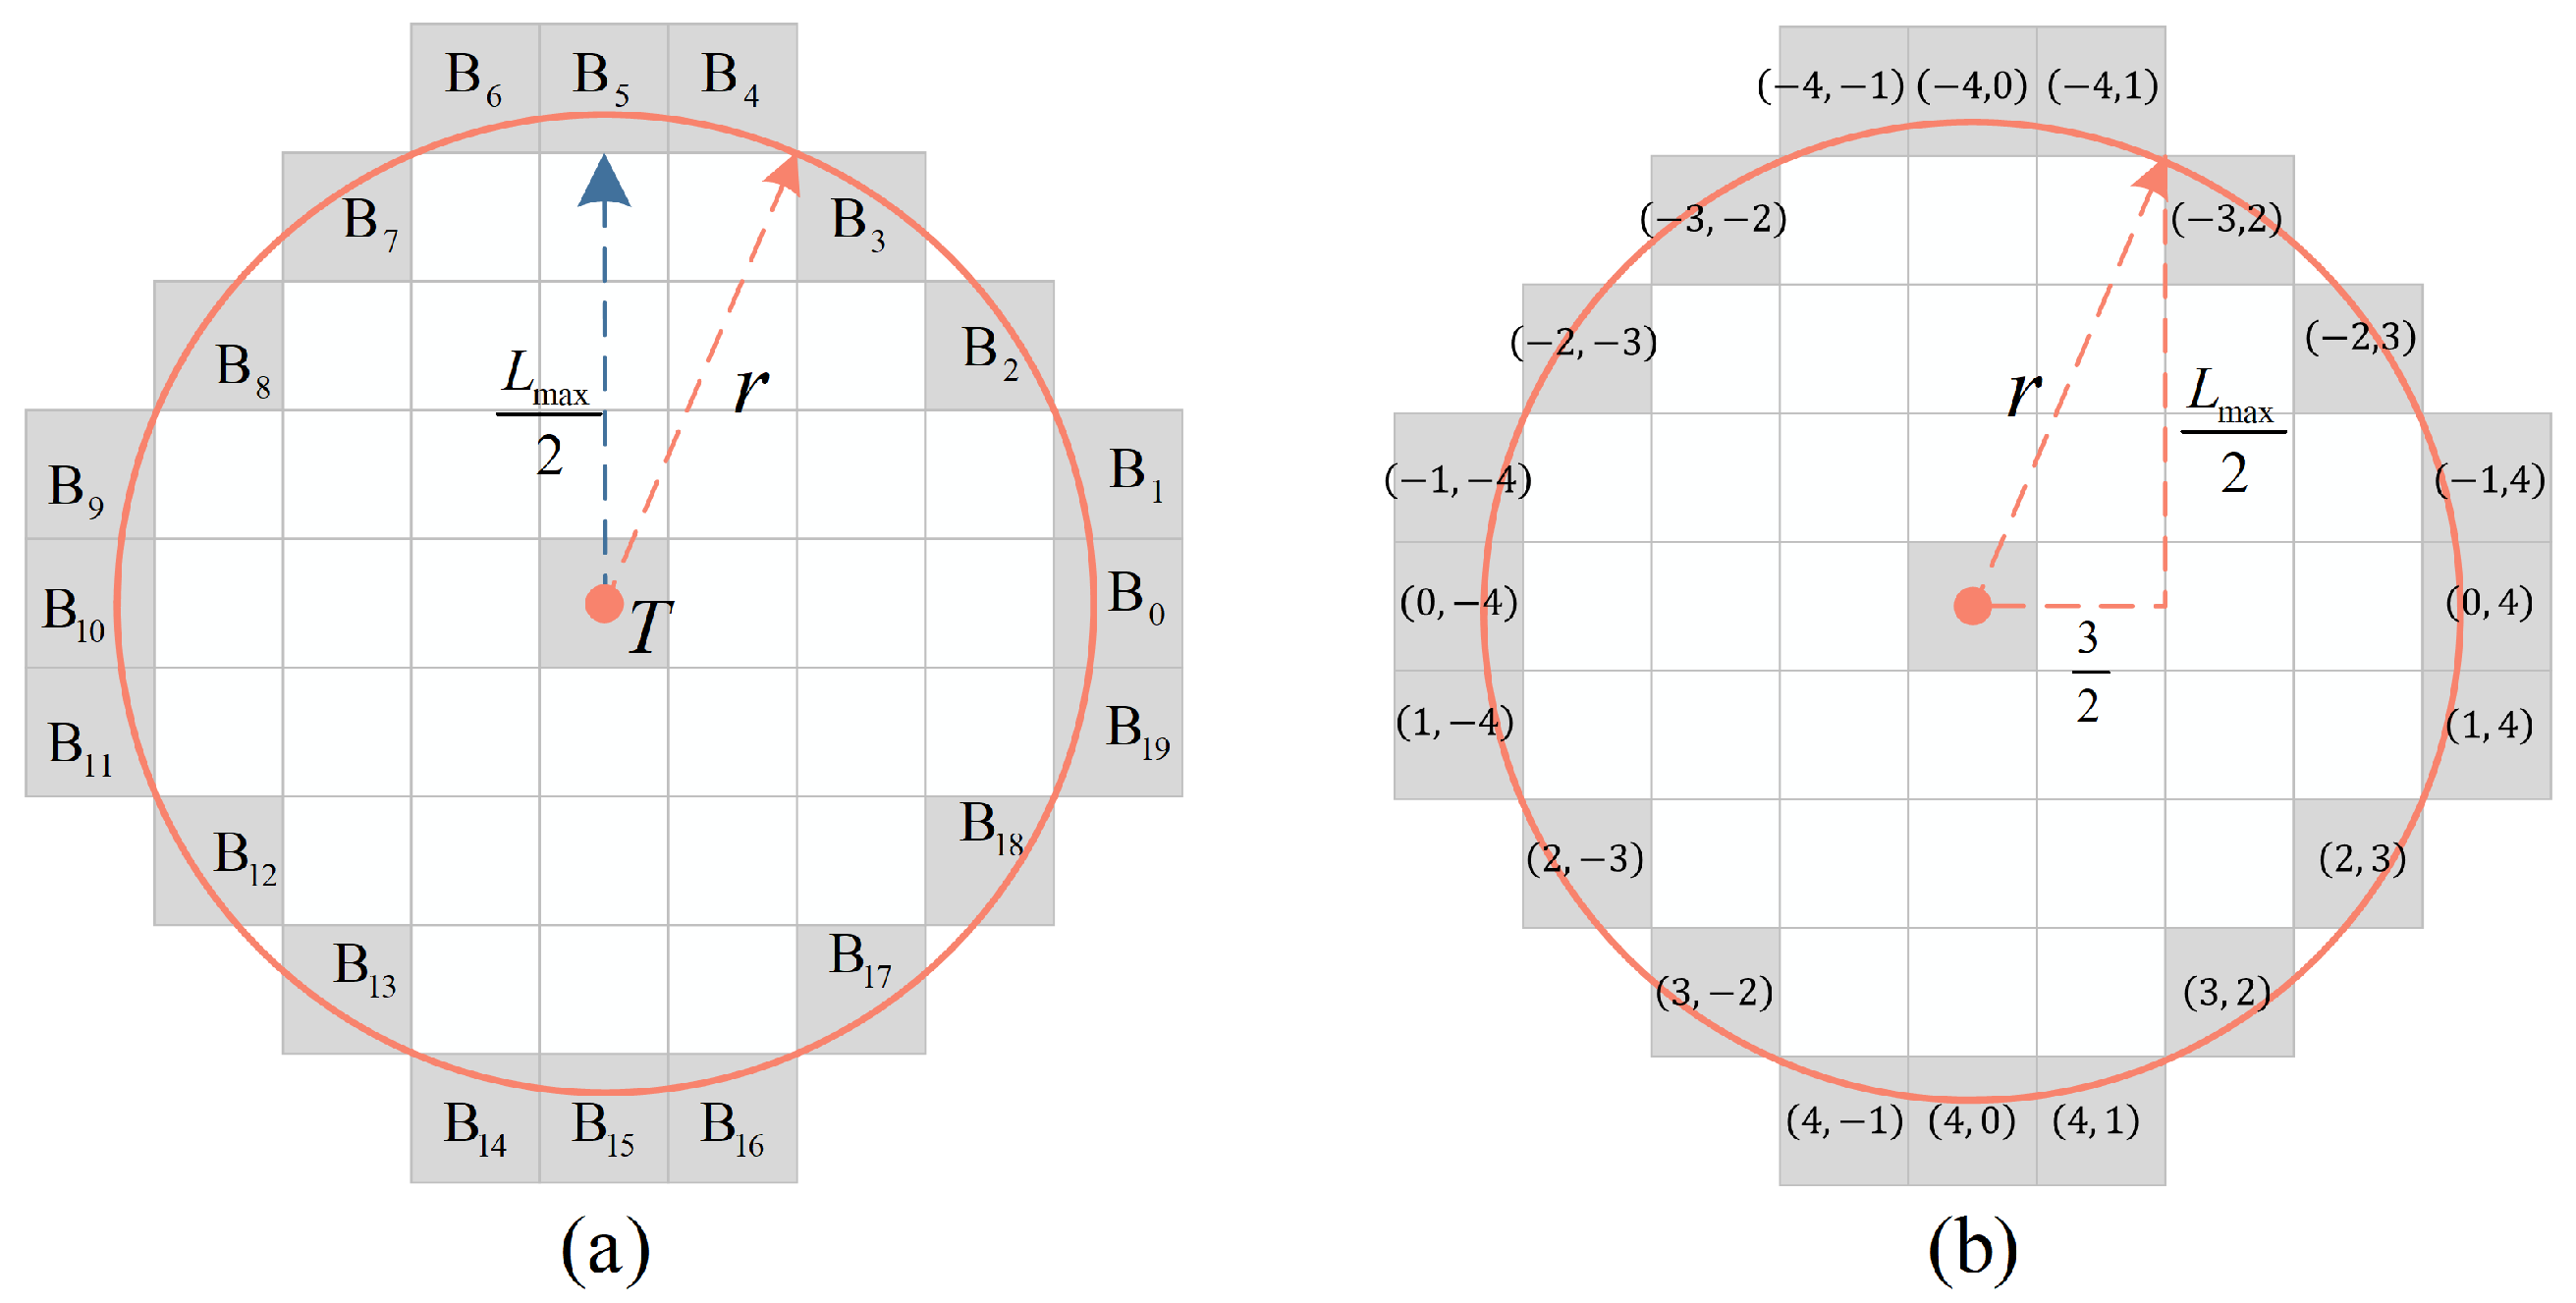
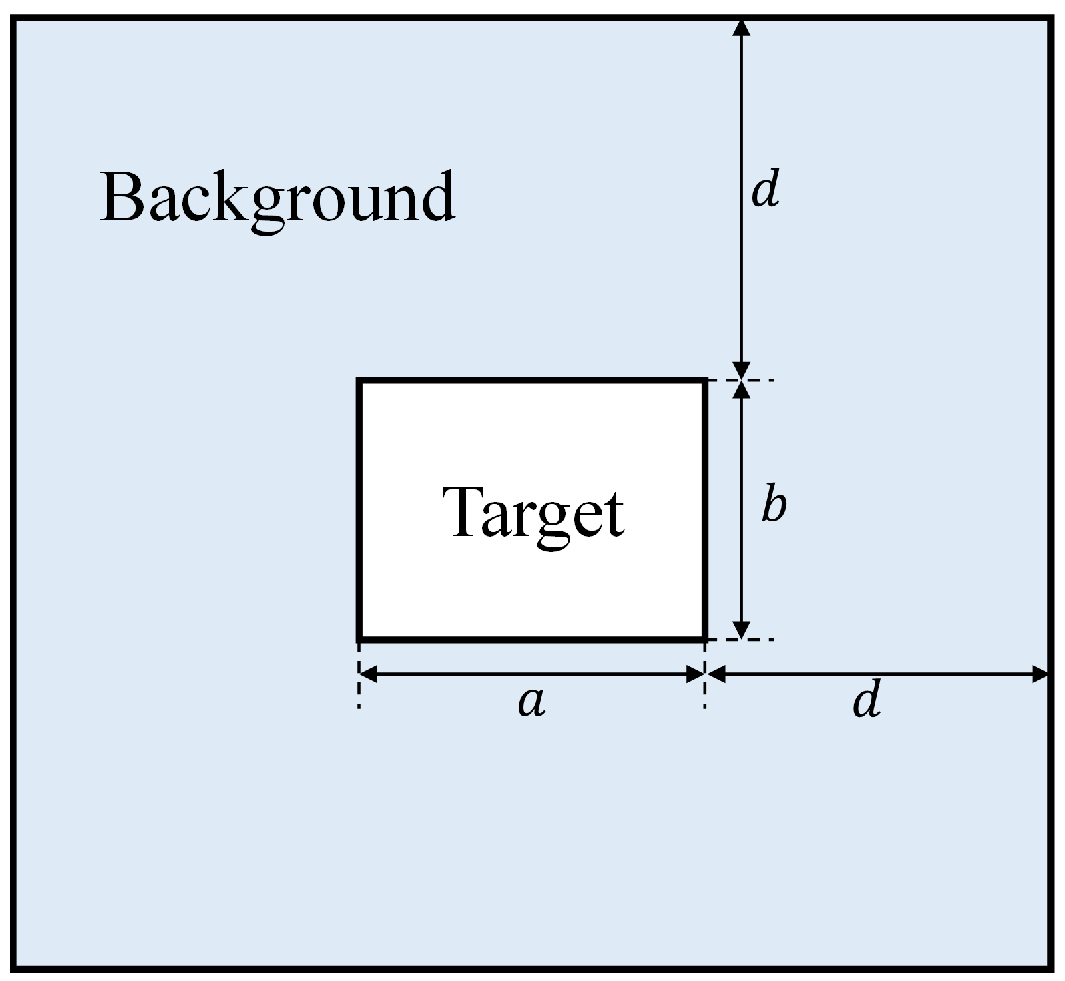
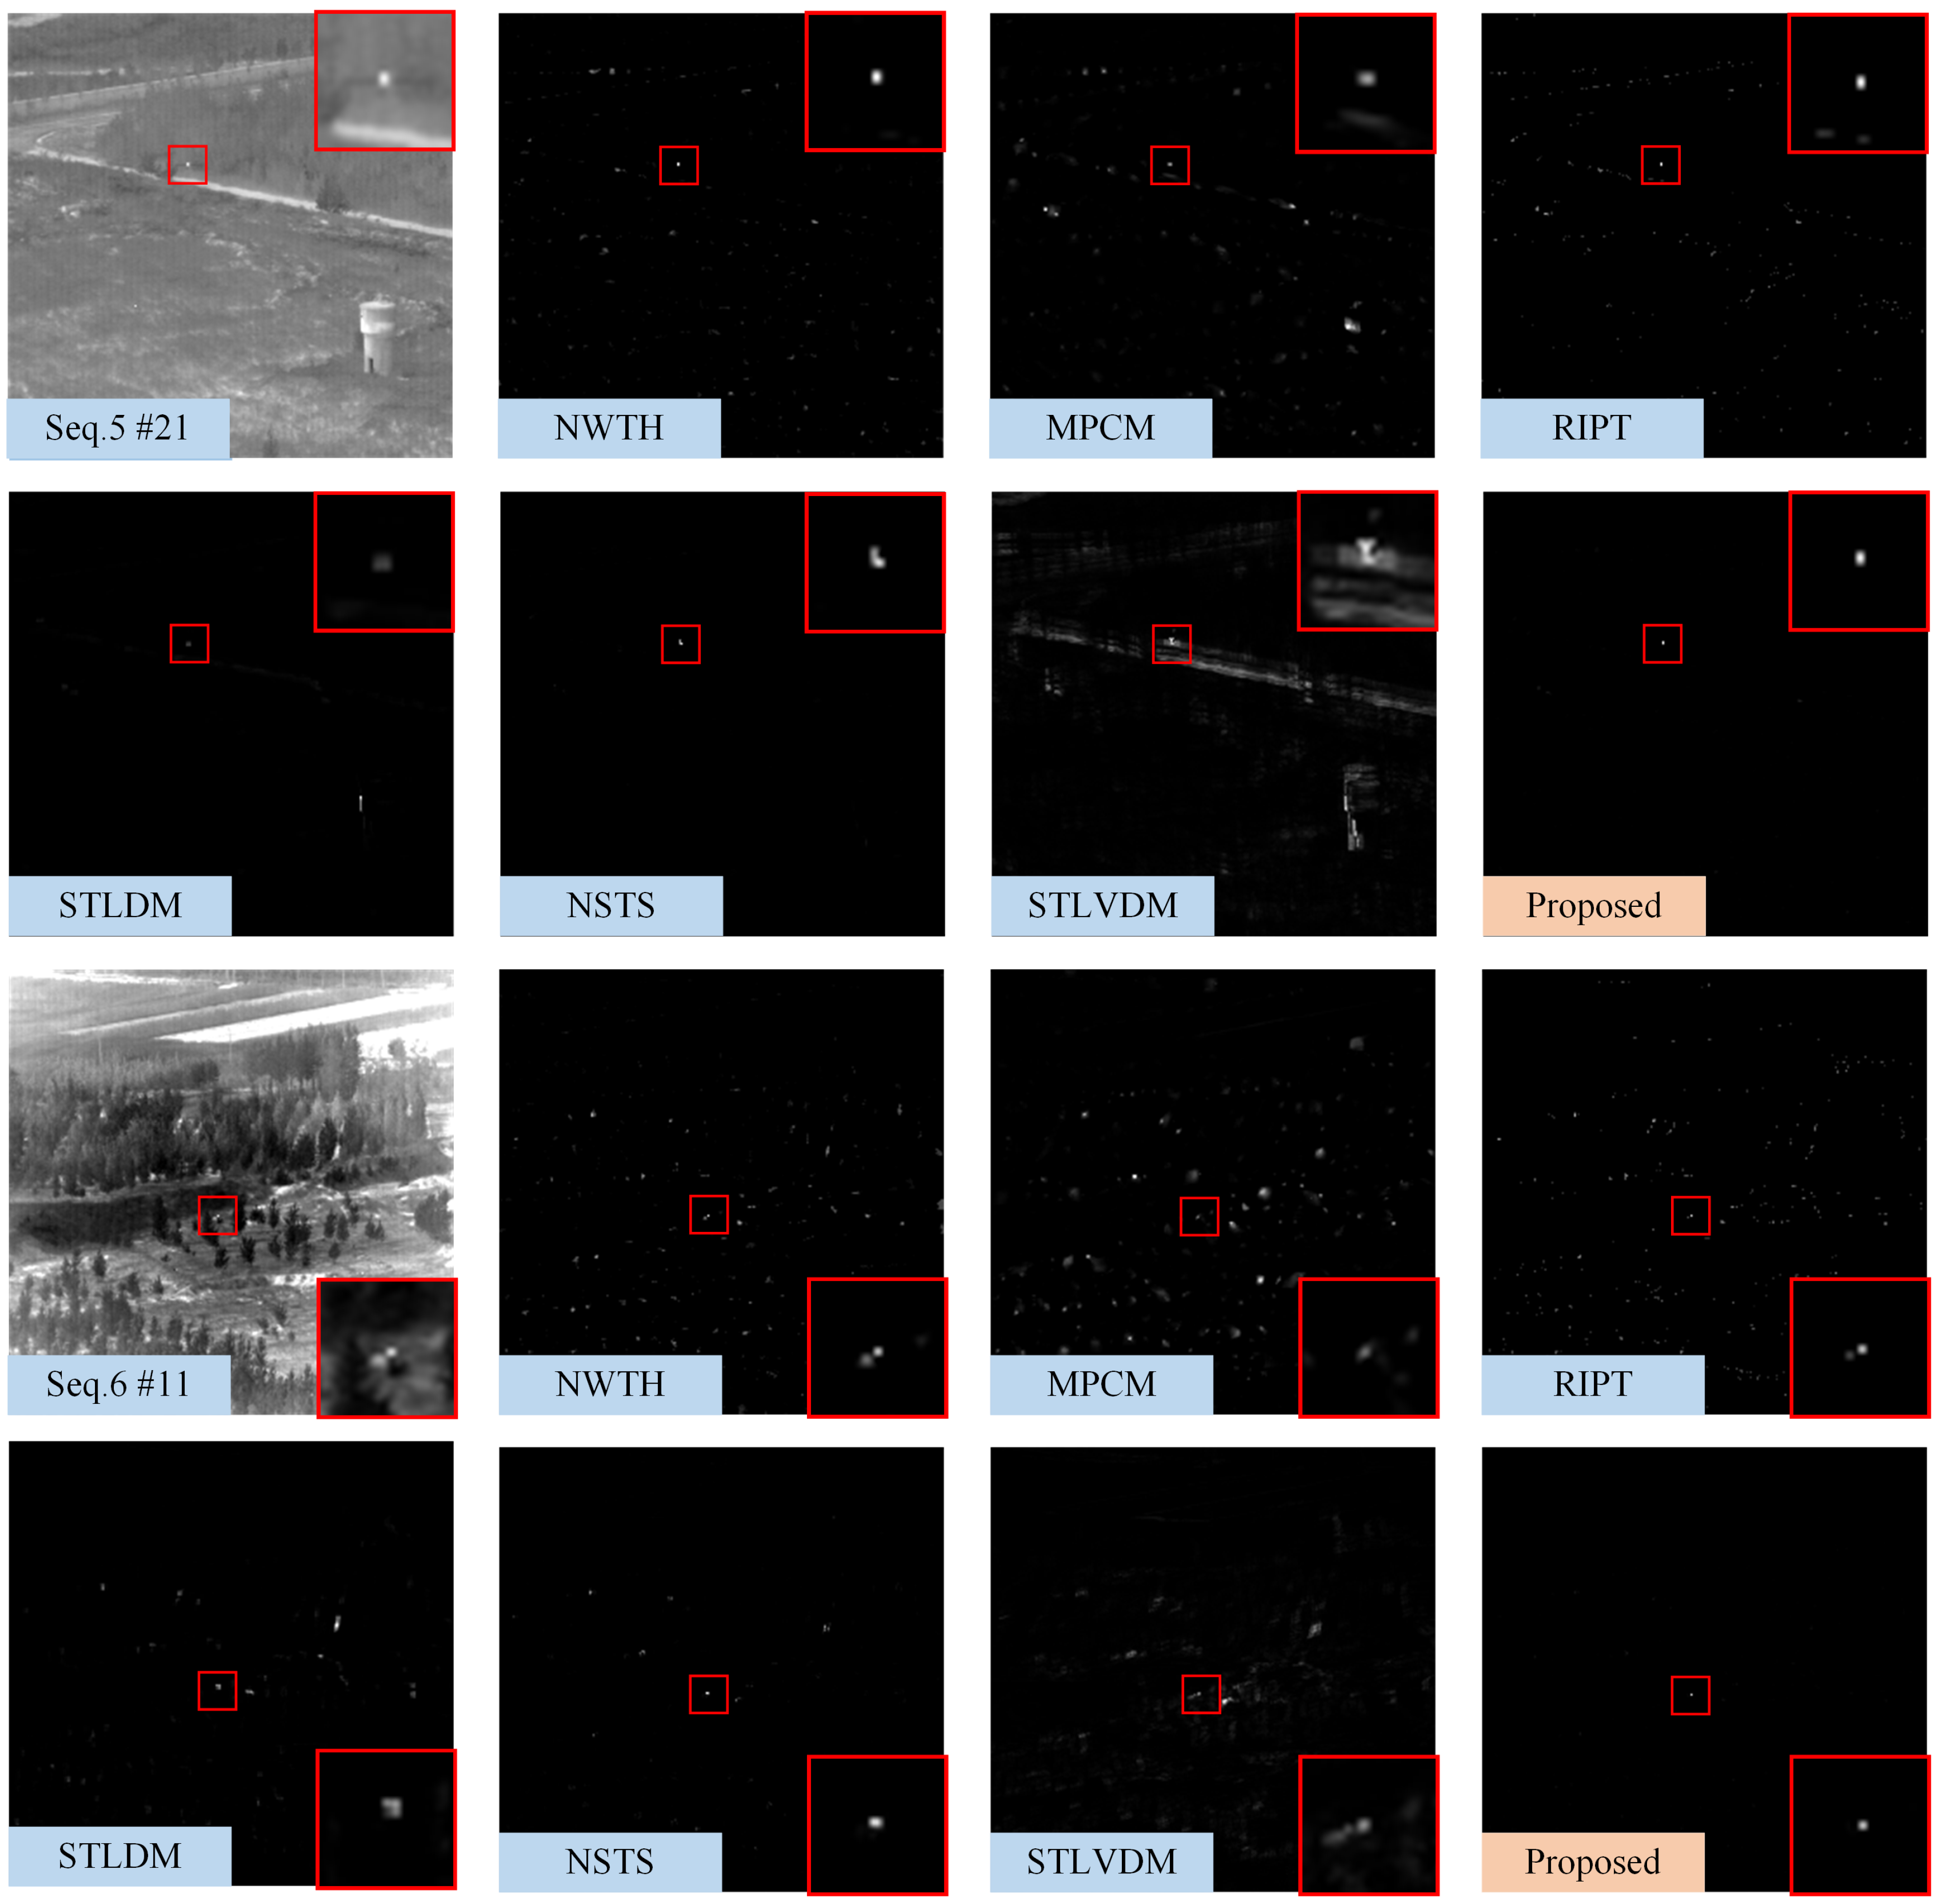
3.1. Local Grayscale Difference (LGD) Measure
3.2. Temporal Features Analysis and Measure
3.2.1. Feature Detection and Image Registration
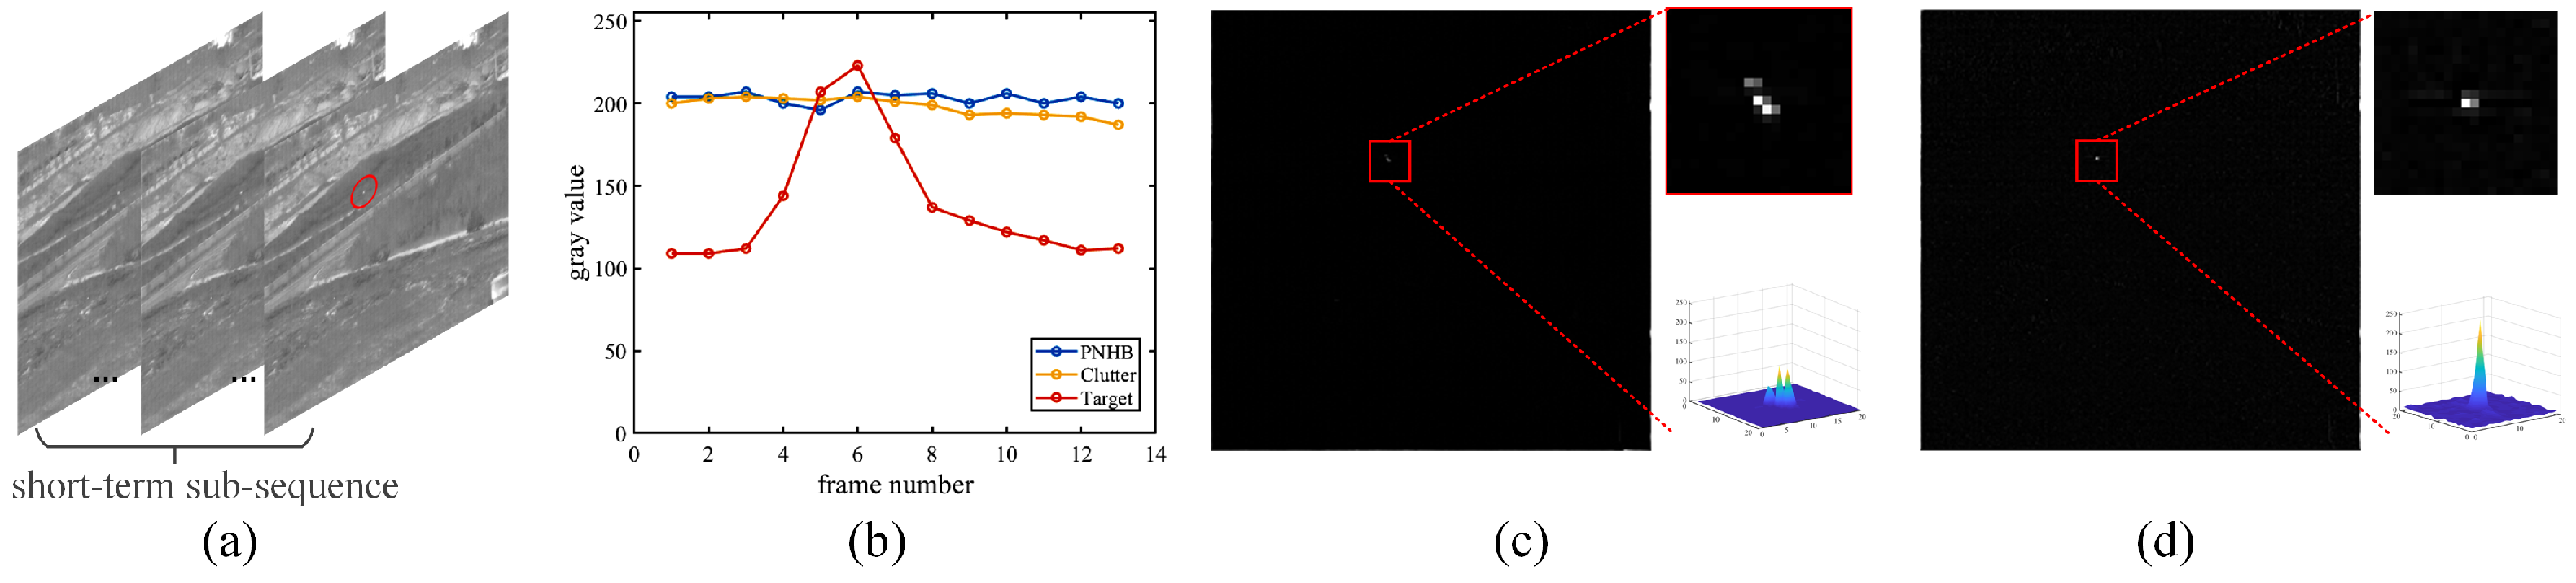
3.2.2. Temporal Features Analysis
3.2.3. Short-Term Energy Aggregation (SEA) Mechanism
3.2.4. Extract Candidate Targets from STSM
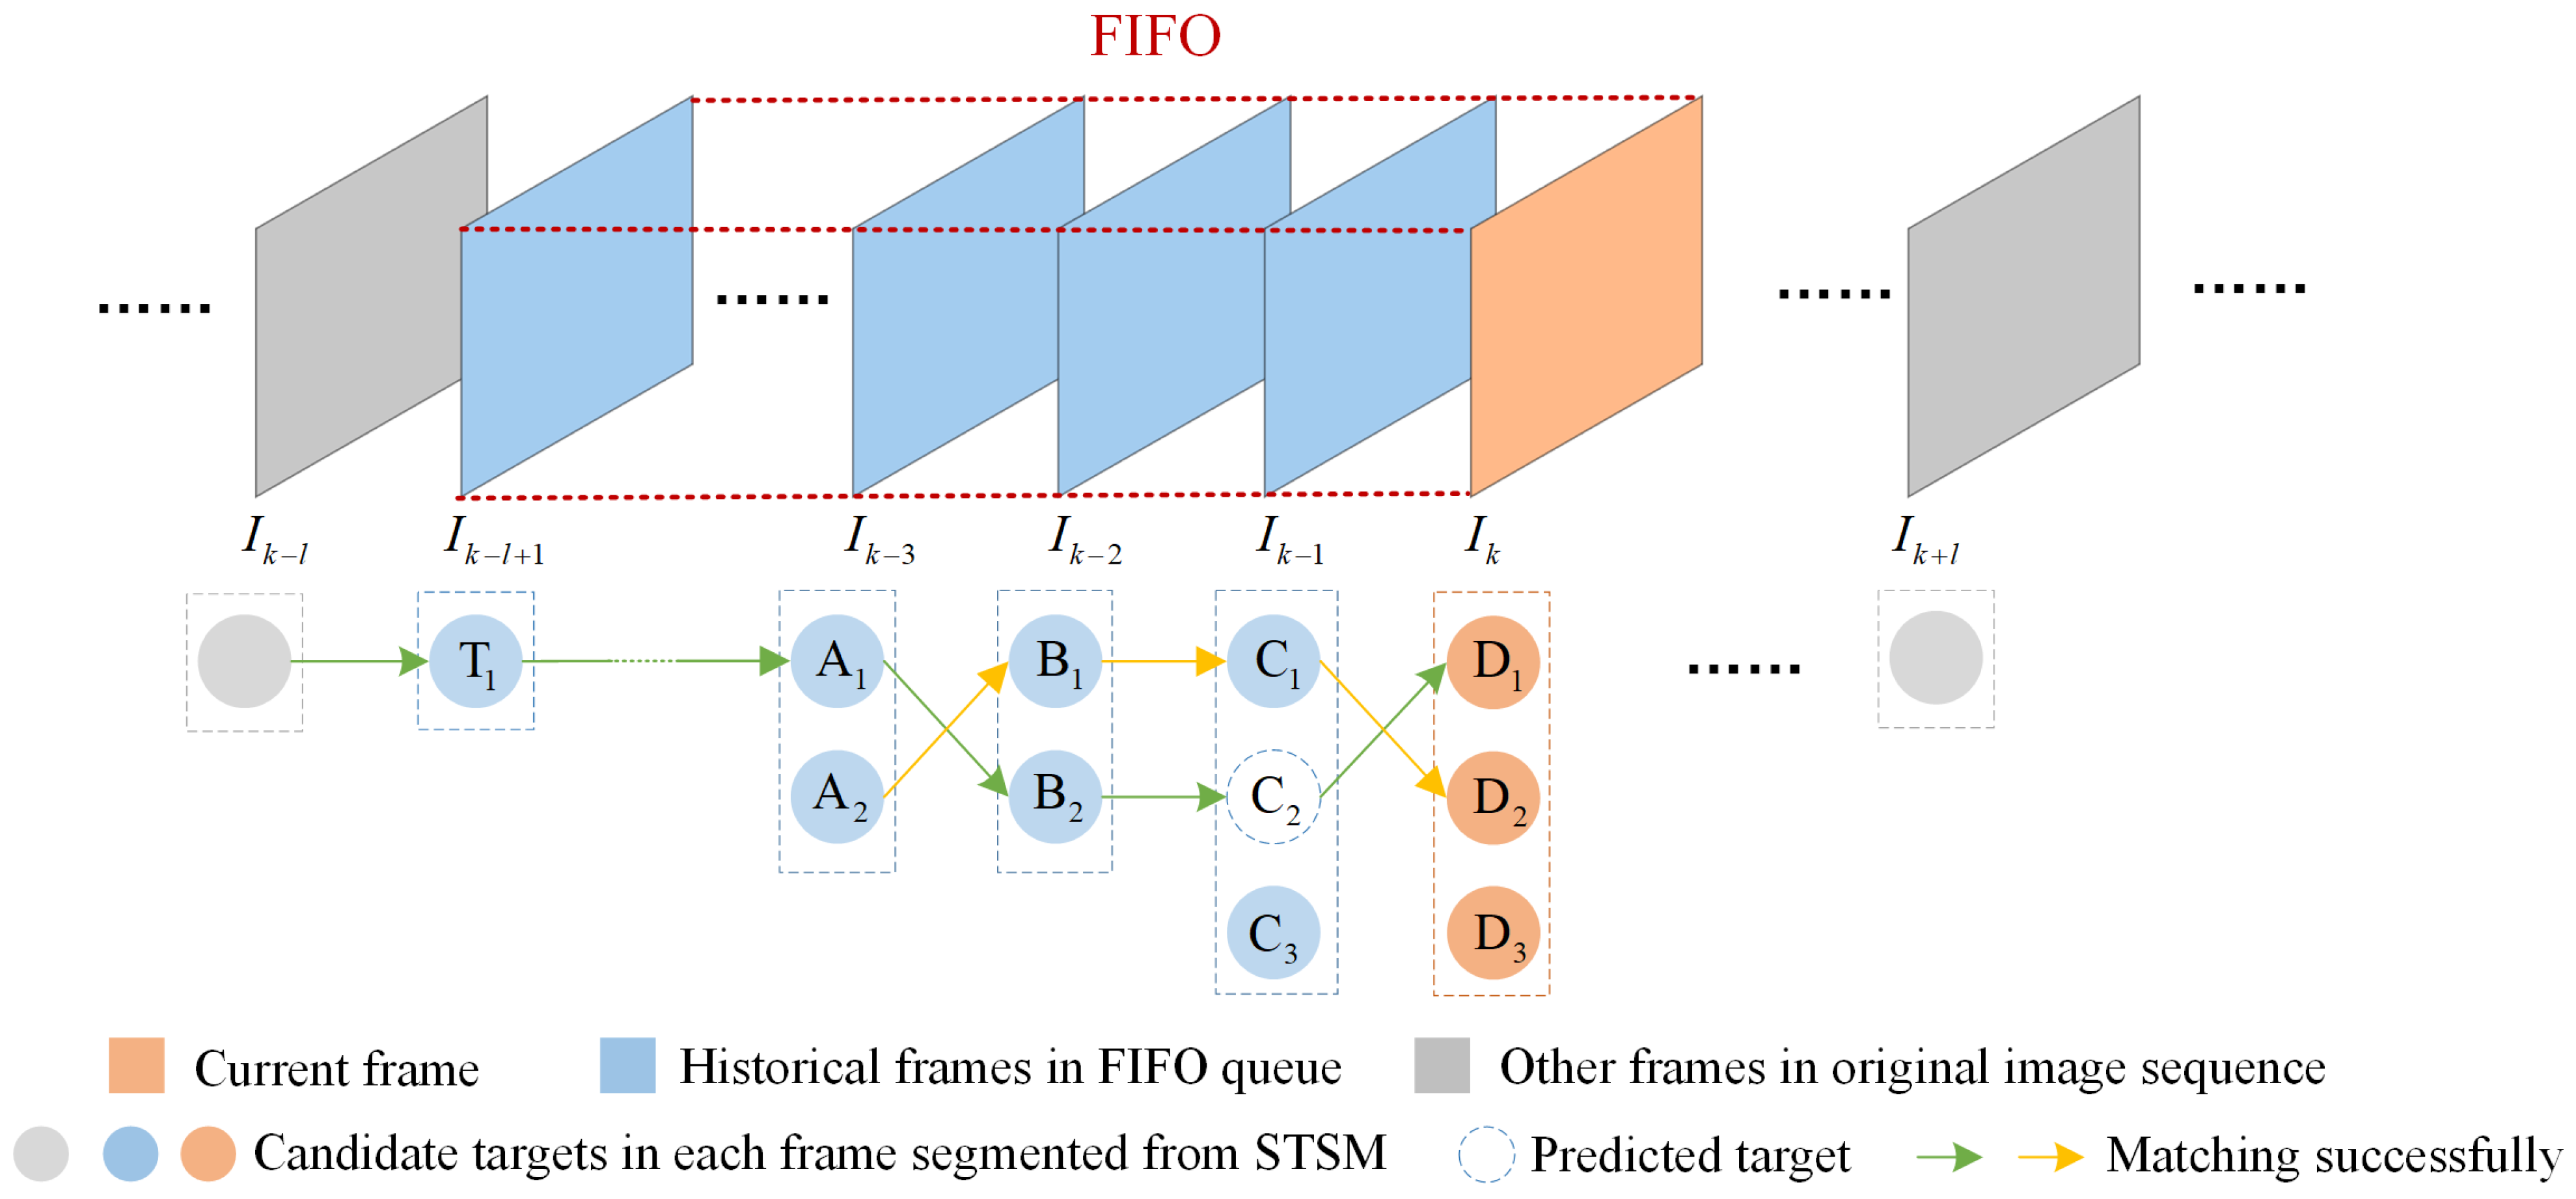
3.2.5. Long-Term Trajectory Continuity (LTC) Measure
| Algorithm 1 Long-term Trajectory Continuity (LTC) Measure |
| Input:—candidate targets extracted from the current frame, —trajectories of the historical frames stored in FIFO queue, R—distance threshold. |
| Output:—confirmed targets in the current frame, —updated trajectories in FIFO queue. |
|
4. Experiments and Analysis
4.1. Experimental Setup
4.1.1. Datasets
4.1.2. Evaluation Metrics
4.1.3. Baseline Methods
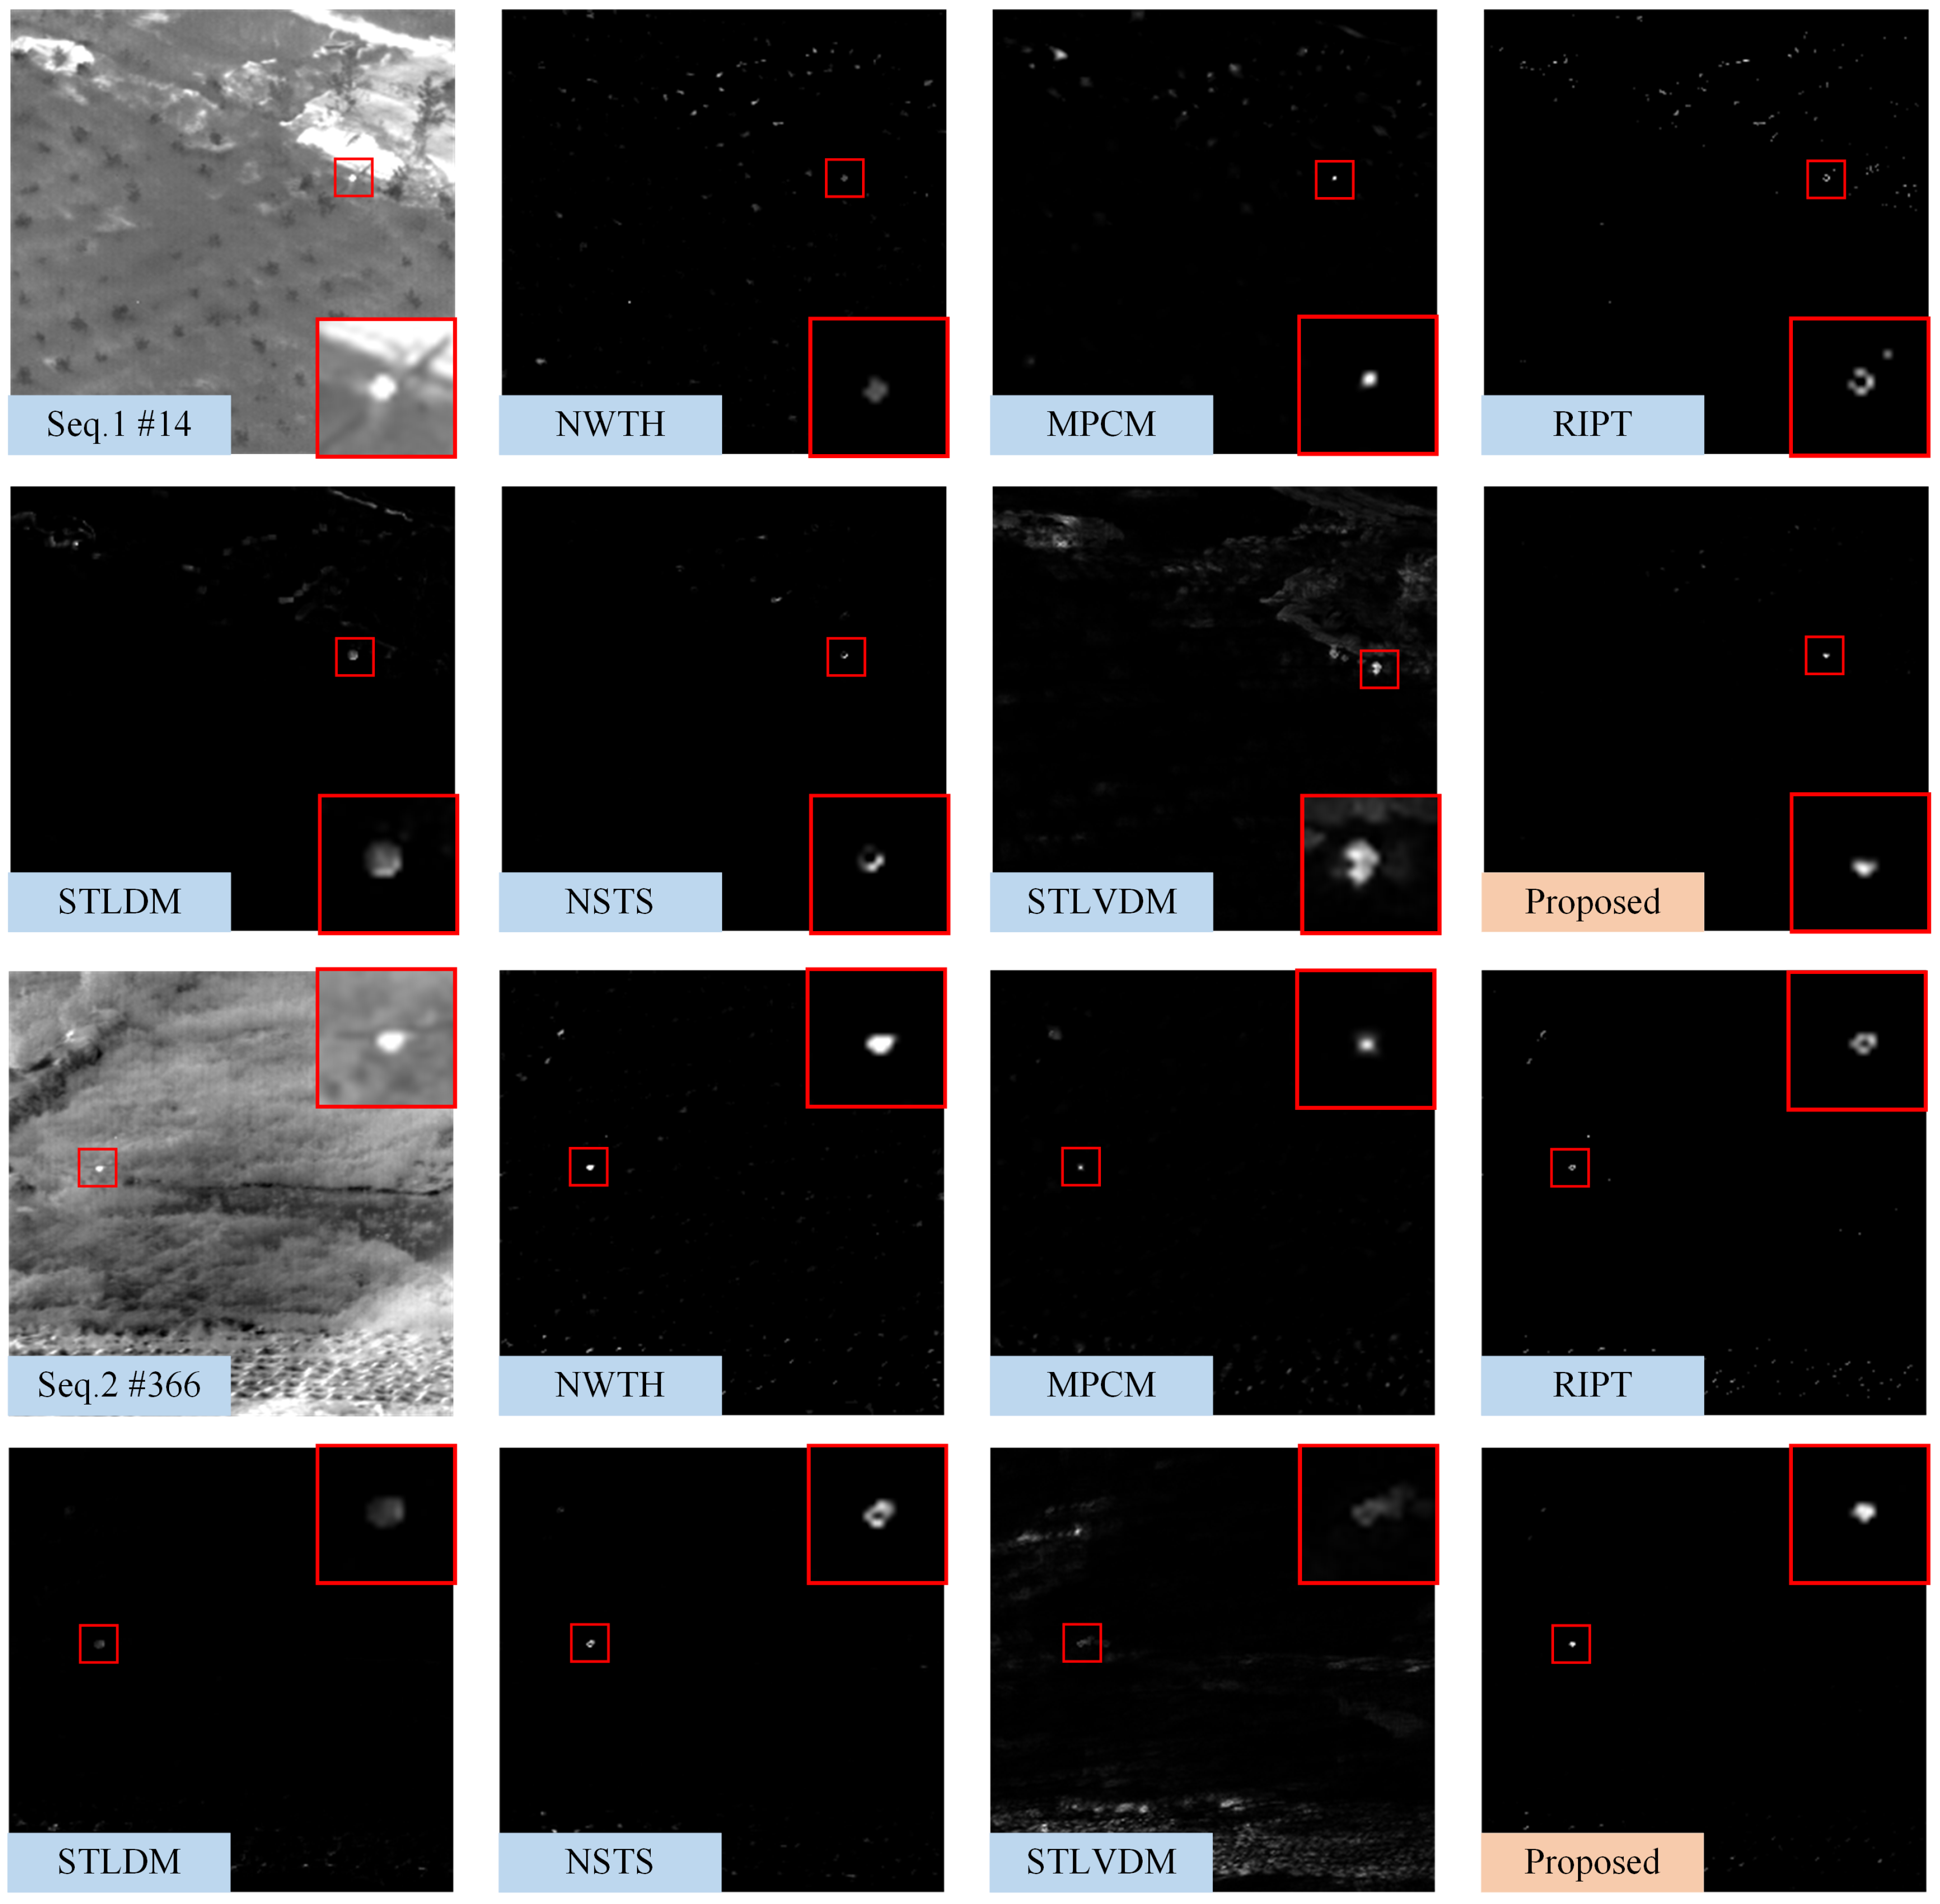
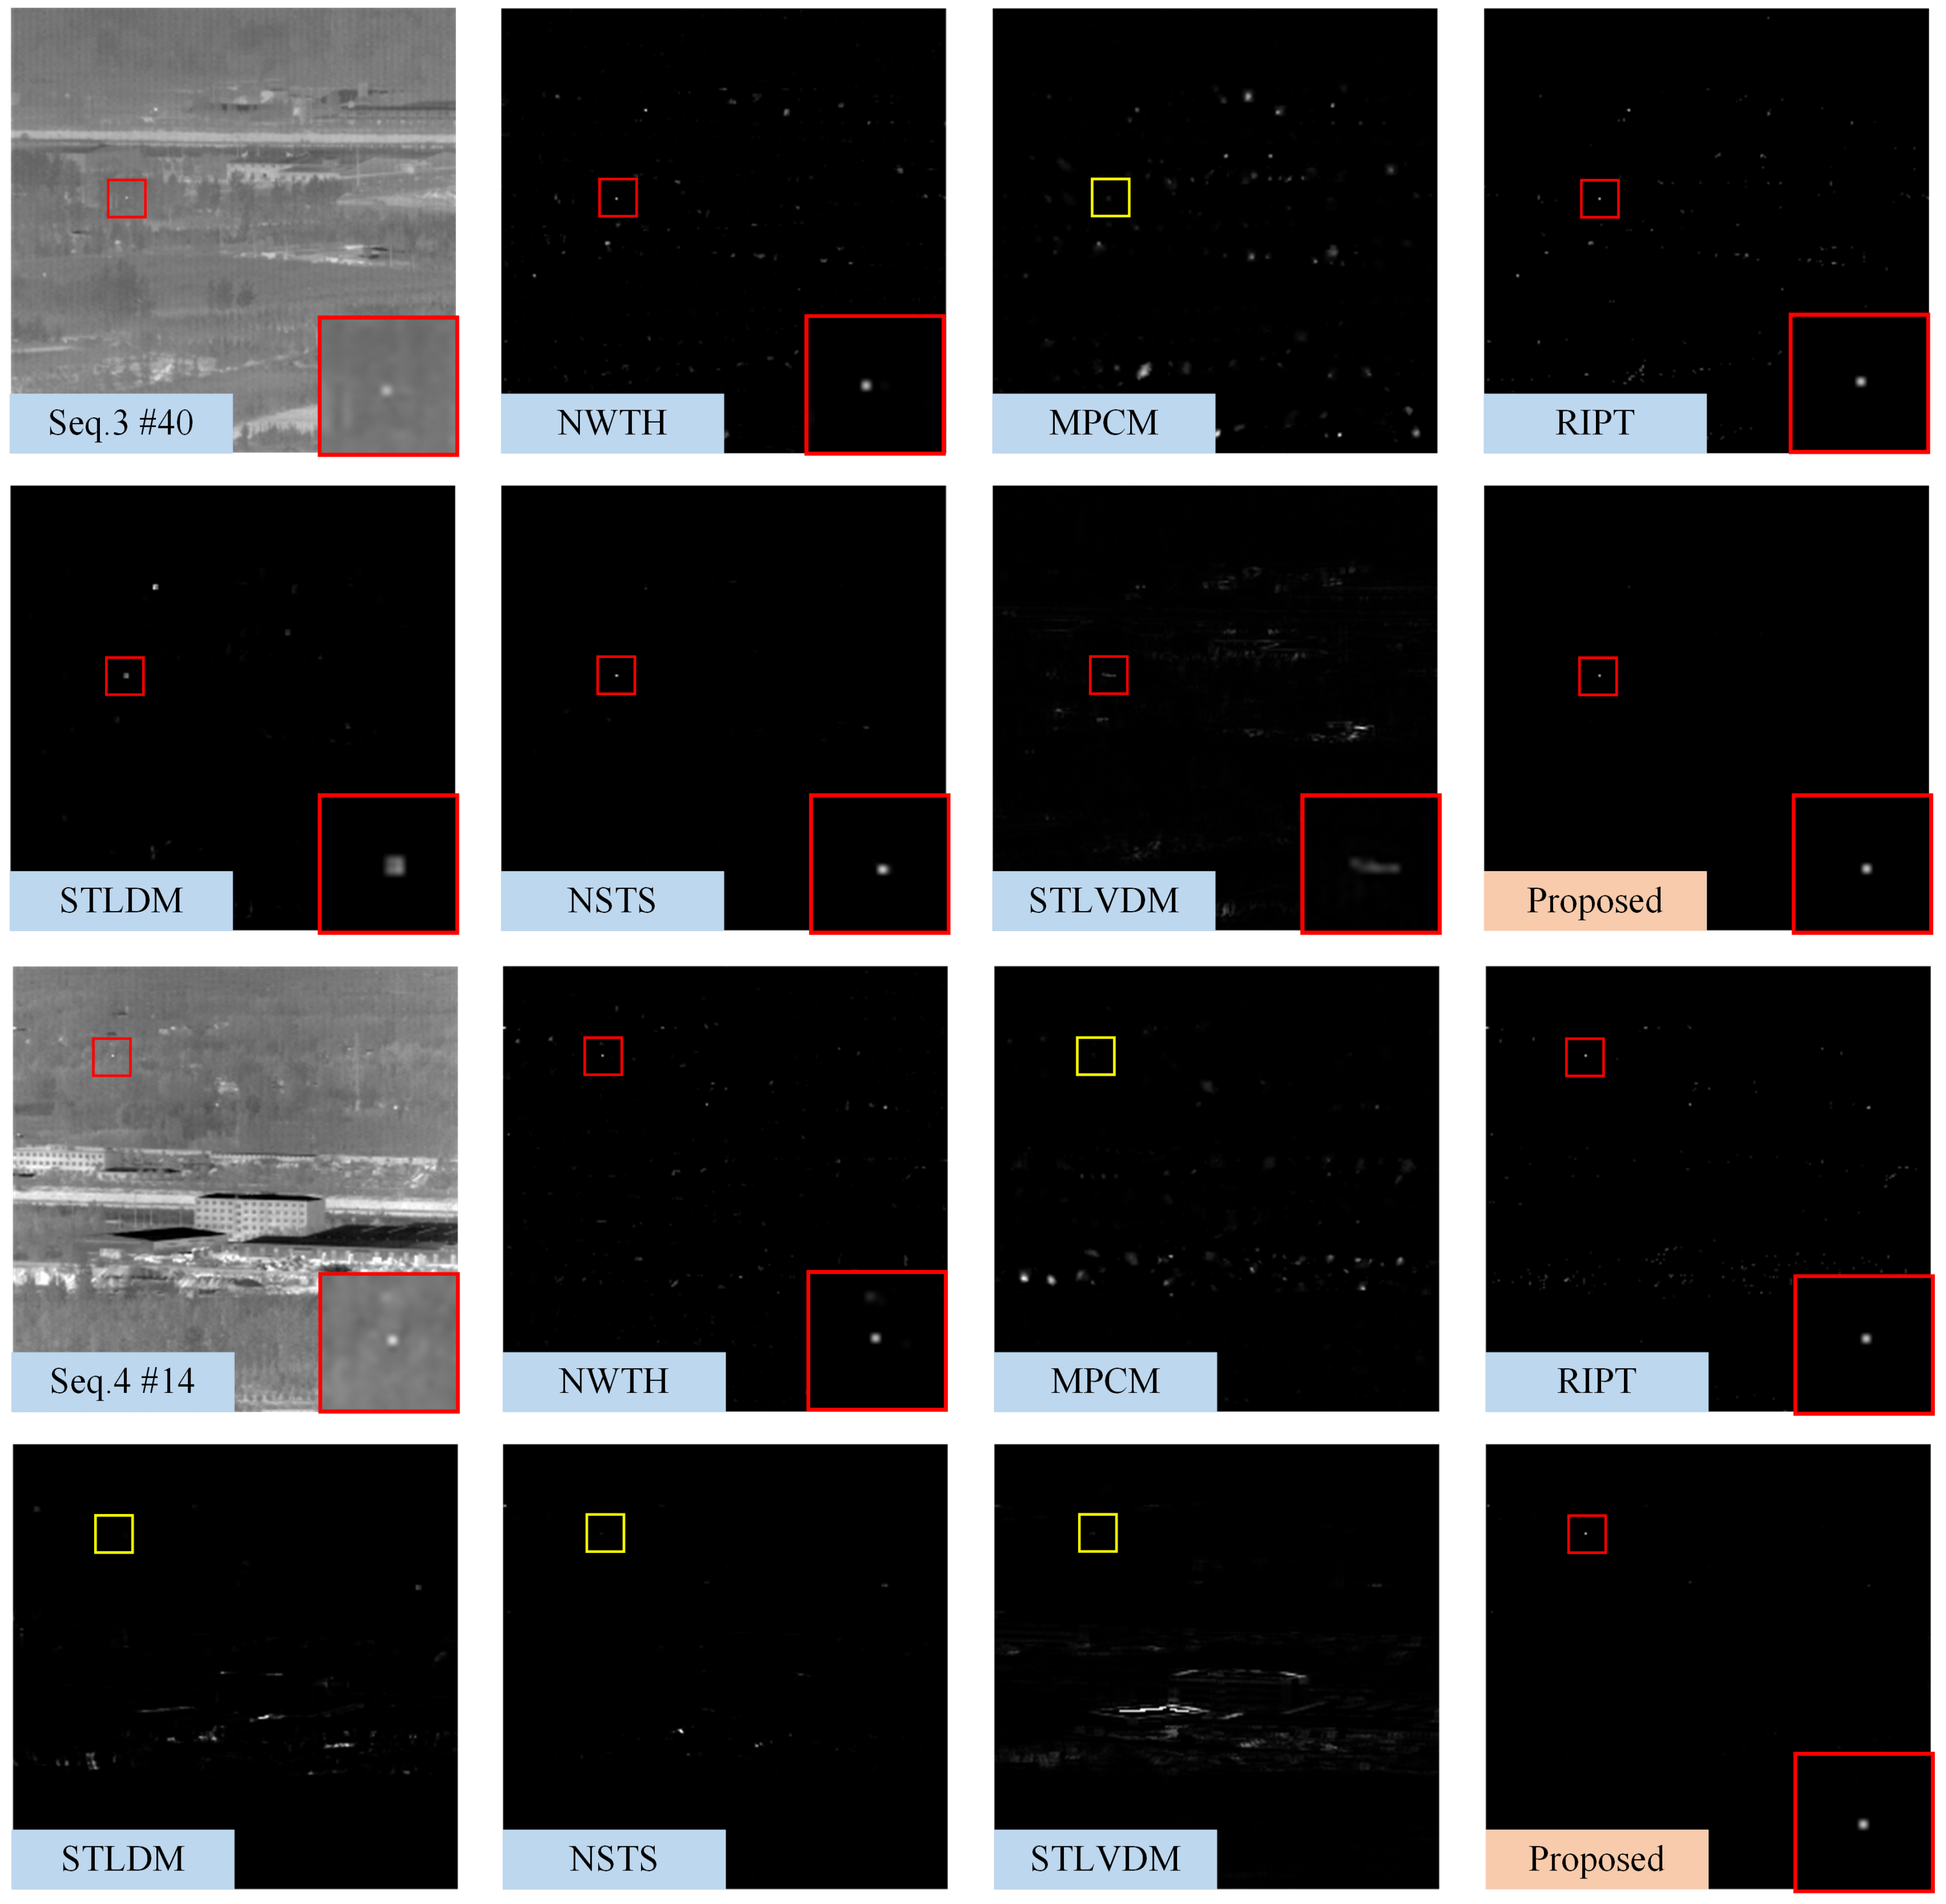
4.2. Qualitative Comparison
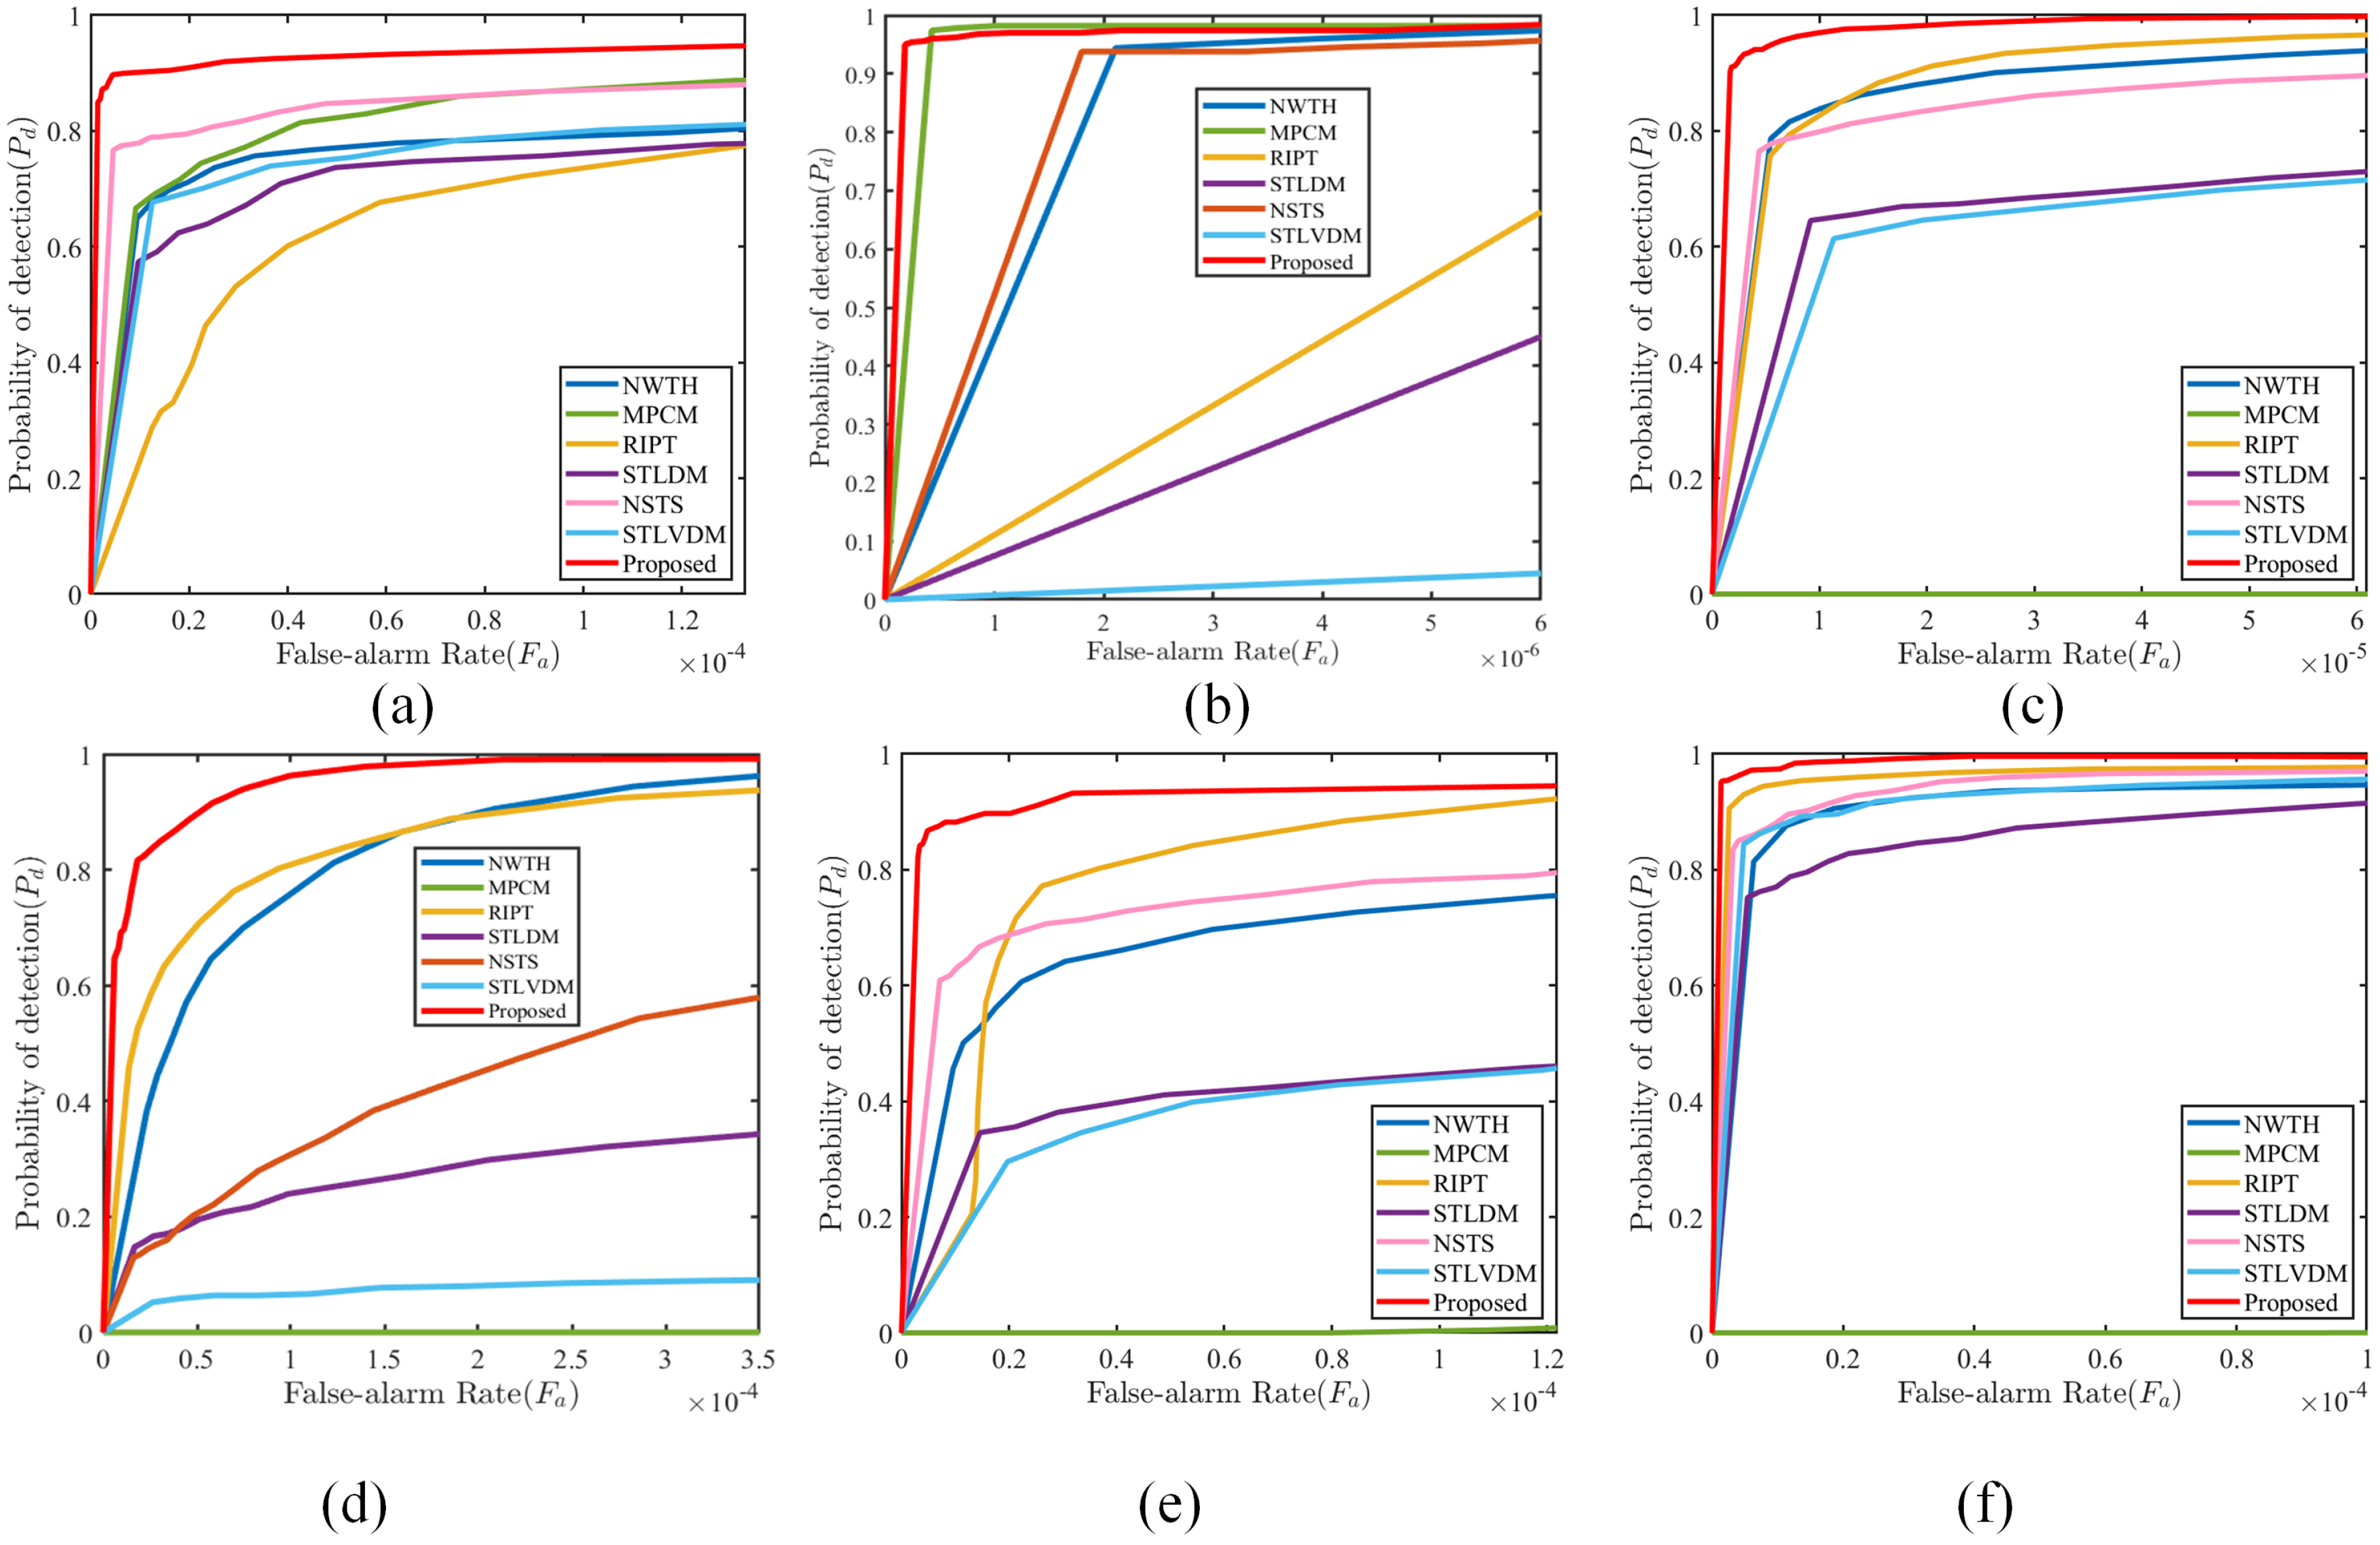
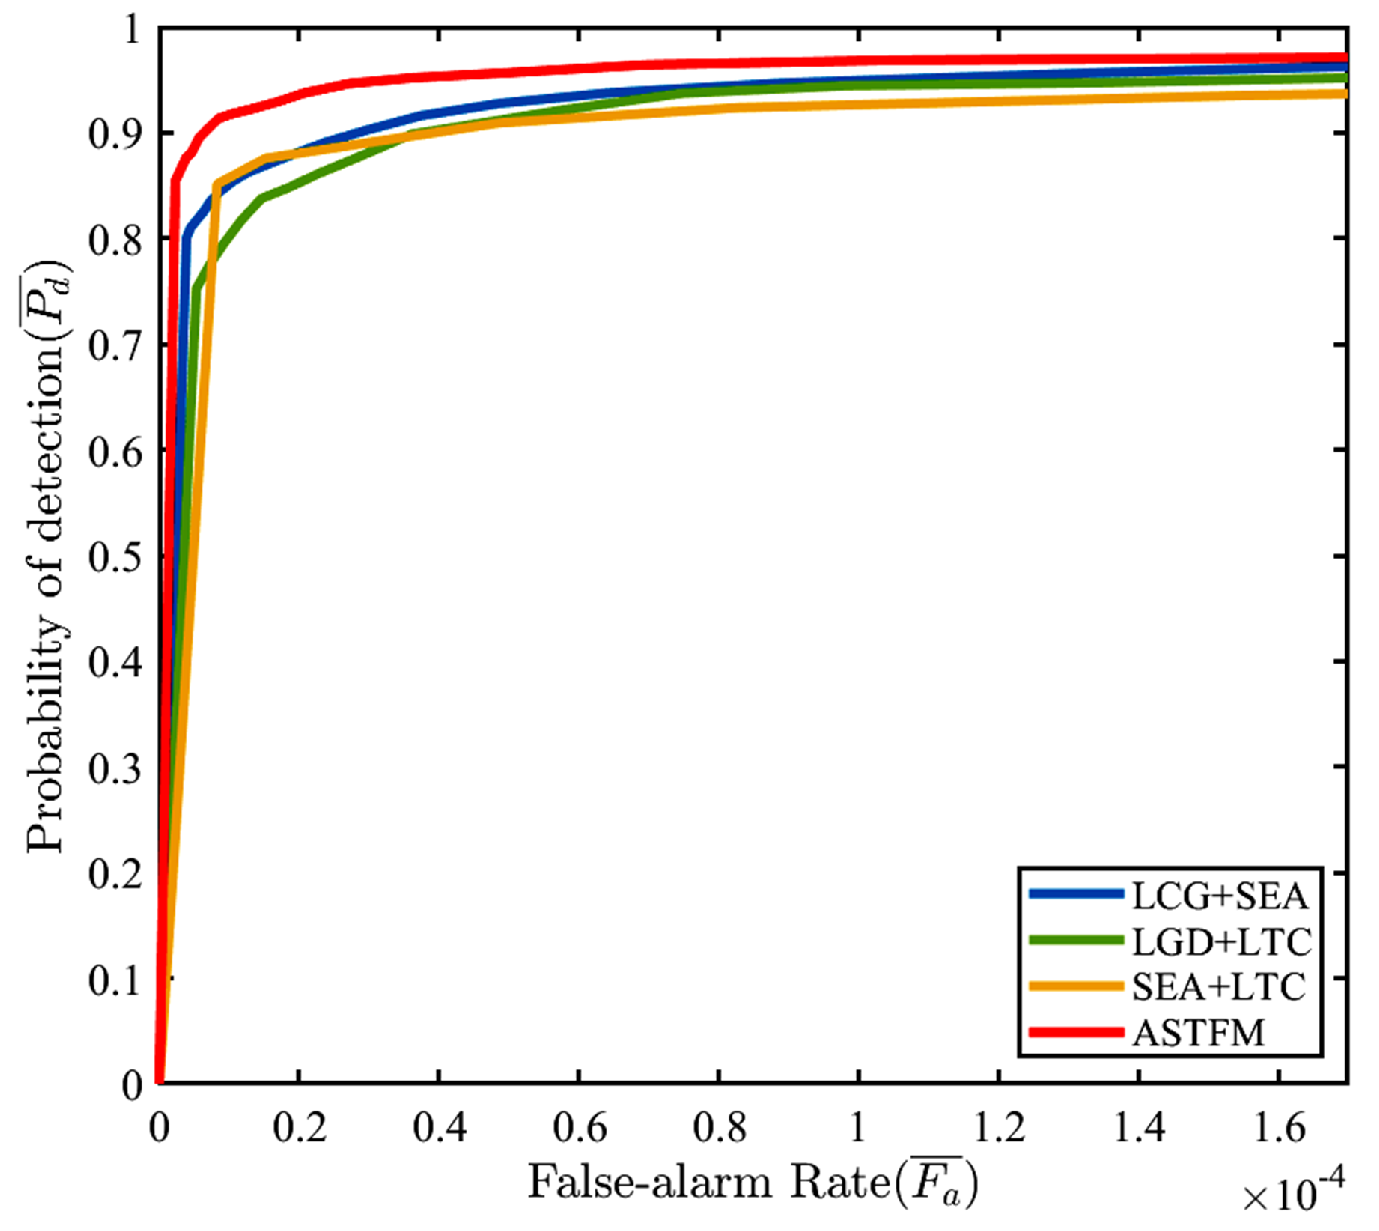
4.3. Quantitative Comparison
4.4. Ablation Study
5. Discussion
6. Conclusions
Author Contributions
Funding
Institutional Review Board Statement
Informed Consent Statement
Data Availability Statement
Conflicts of Interest
Abbreviations
| IRST | Infrared search and tracking |
| STFM | Spatial-temporal features measure |
| LGD | Local grayscale difference |
| SEA | Short-term energy aggregation |
| STSM | Spatial-temporal saliency map |
| LTC | Long-term trajectory continuity |
| UAVs | Unmanned aerial vehicles |
| FOV | Field of view |
| HVS | Human visual system |
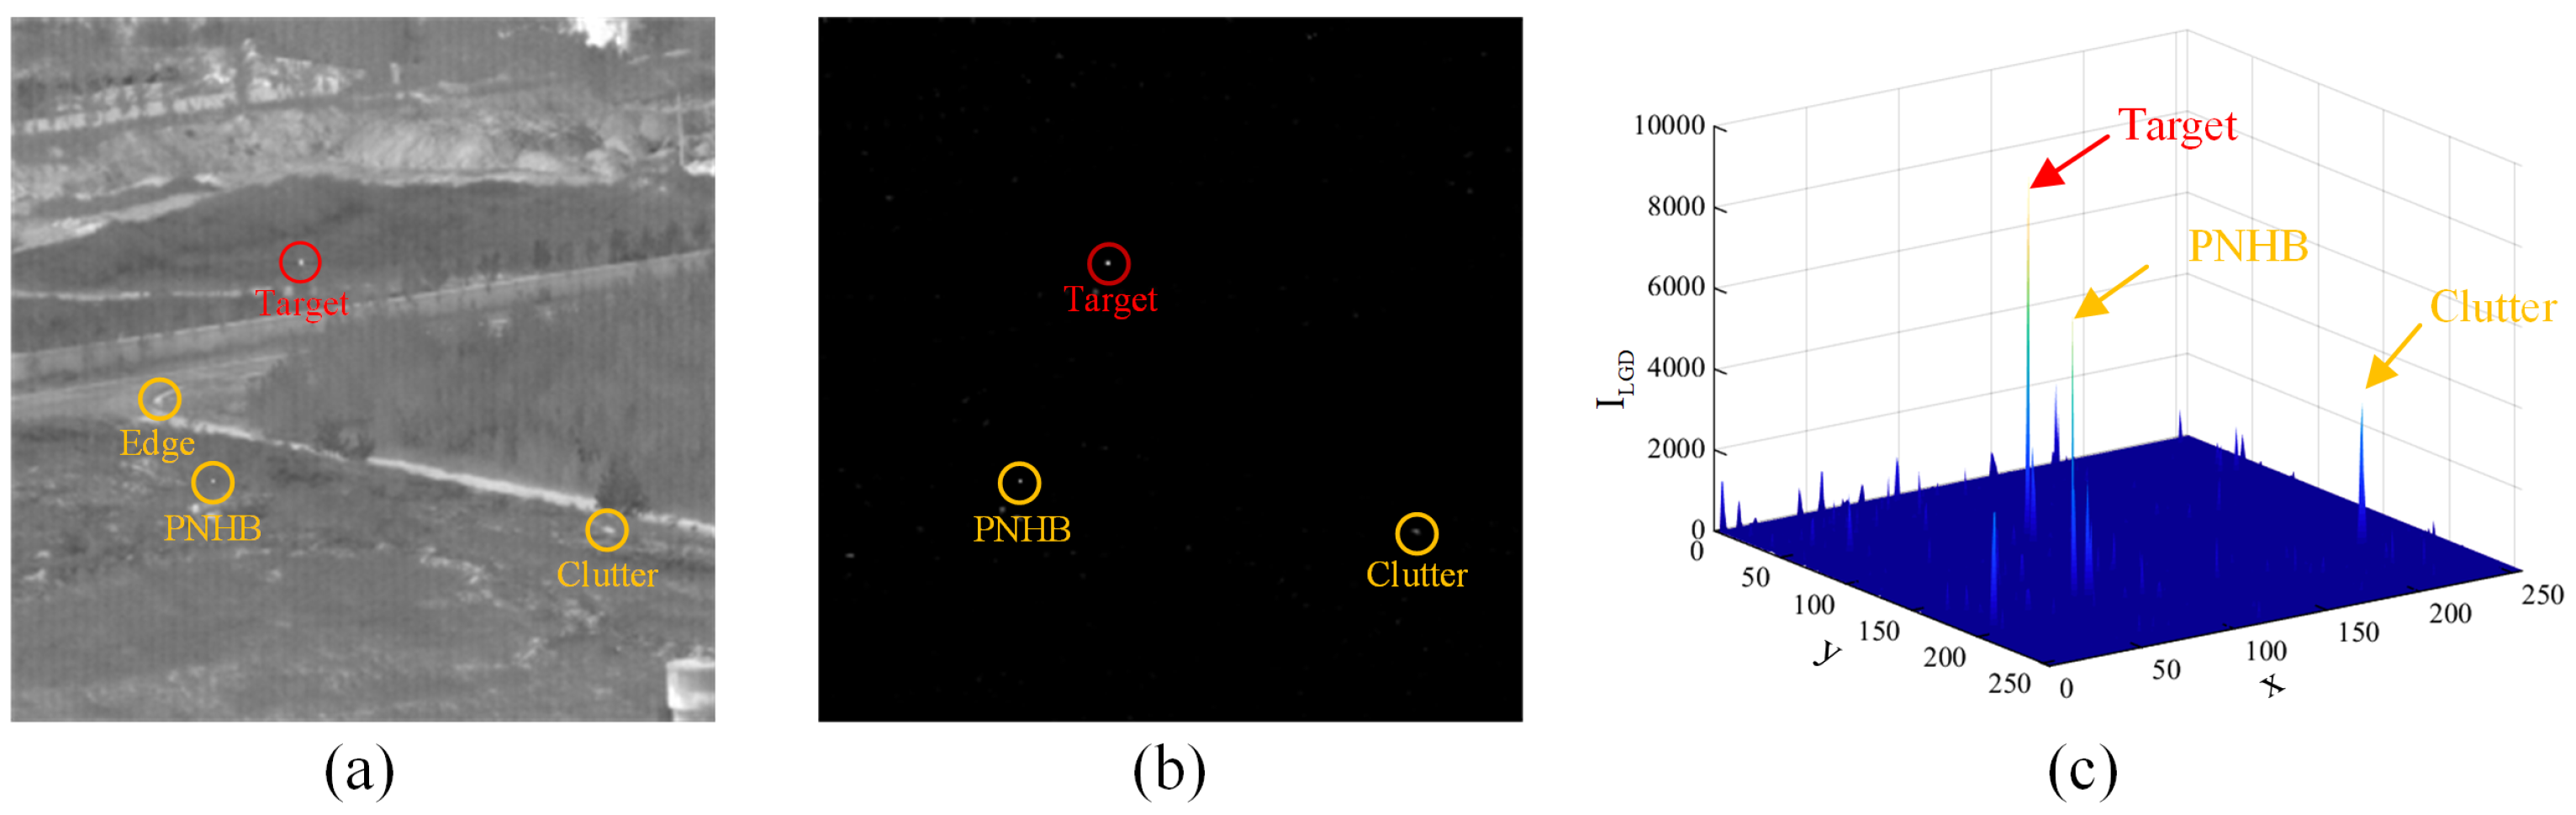
| PNHB | Pixel-sized noises with high brightness |
| IFD | Improved frame difference |
| FIFO | First-in-first-out |
References
- Shi, X.; Yang, C.; Xie, W.; Liang, C.; Shi, Z.; Chen, J. Anti-Drone System with Multiple Surveillance Technologies: Architecture, Implementation, and Challenges. IEEE Commun. Mag. 2018, 56, 68–74. [Google Scholar] [CrossRef]
- Chen, S.; Yin, Y.; Wang, Z.; Gui, F. Low-altitude protection technology of anti-UAVs based on multisource detection information fusion. Int. J. Adv. Robot. Syst. 2020, 17, 1729881420962907. [Google Scholar] [CrossRef]
- Gao, J.; Guo, Y.; Lin, Z.; An, W.; Li, J. Robust Infrared Small Target Detection Using Multiscale Gray and Variance Difference Measures. IEEE J. Sel. Top. Appl. Earth Obs. Remote Sens. 2018, 11, 5039–5052. [Google Scholar] [CrossRef]
- Sun, H.; Liu, Q.; Wang, J.; Ren, J.; Wu, Y.; Zhao, H.; Li, H. Fusion of Infrared and Visible Images for Remote Detection of Low-Altitude Slow-Speed Small Targets. IEEE J. Sel. Top. Appl. Earth Obs. Remote Sens. 2021, 14, 2971–2983. [Google Scholar] [CrossRef]
- Ding, L.; Xu, X.; Cao, Y.; Zhai, G.; Yang, F.; Qian, L. Detection and tracking of infrared small target by jointly using SSD and pipeline filter. Digit. Signal Process. 2021, 110, 102949. [Google Scholar] [CrossRef]
- Zhang, K.; Ni, S.; Yan, D.; Zhang, A. Review of Dim Small Target Detection Algorithms in Single-frame Infrared Images. In Proceedings of the 2021 IEEE 4th Advanced Information Management, Communicates, Electronic and Automation Control Conference (IMCEC), Chongqing, China, 18–20 June 2021; IEEE: Piscataway, NJ, USA, 2021; Volume 4, pp. 2115–2120. [Google Scholar]
- Chen, C.L.P.; Li, H.; Wei, Y.; Xia, T.; Tang, Y.Y. A Local Contrast Method for Small Infrared Target Detection. IEEE Trans. Geosci. Remote Sens. 2014, 52, 574–581. [Google Scholar] [CrossRef]
- Qin, Y.; Li, B. Effective Infrared Small Target Detection Utilizing a Novel Local Contrast Method. IEEE Geosci. Remote Sens. Lett. 2016, 13, 1890–1894. [Google Scholar] [CrossRef]
- Moradi, S.; Moallem, P.; Sabahi, M.F. Fast and robust small infrared target detection using absolute directional mean difference algorithm. Signal Process. 2020, 177, 107727. [Google Scholar] [CrossRef]
- Wei, Y.; You, X.; Li, H. Multiscale patch-based contrast measure for small infrared target detection. Pattern Recognit. 2016, 58, 216–226. [Google Scholar] [CrossRef]
- Kim, S.; Yang, Y.; Lee, J.; Park, Y. Small target detection utilizing robust methods of the human visual system for IRST. J. Infrared Millim. Terahertz Waves 2009, 30, 994–1011. [Google Scholar] [CrossRef]
- Hadhoud, M.; Thomas, D. The two-dimensional adaptive LMS (TDLMS) algorithm. IEEE Trans. Circuits Syst. 1988, 35, 485–494. [Google Scholar] [CrossRef]
- Gao, C.; Meng, D.; Yang, Y.; Wang, Y.; Zhou, X.; Hauptmann, A.G. Infrared Patch-Image Model for Small Target Detection in a Single Image. IEEE Trans. Image Process. 2013, 22, 4996–5009. [Google Scholar] [CrossRef] [PubMed]
- Deng, L.; Zhu, H.; Tao, C.; Wei, Y. Infrared moving point target detection based on spatial–temporal local contrast filter. Infrared Phys. Technol. 2016, 76, 168–173. [Google Scholar] [CrossRef]
- Du, P.; Hamdulla, A. Infrared moving small-target detection using spatial–temporal local difference measure. IEEE Geosci. Remote Sens. Lett. 2019, 17, 1817–1821. [Google Scholar] [CrossRef]
- Pang, D.; Shan, T.; Ma, P.; Li, W.; Liu, S.; Tao, R. A novel spatiotemporal saliency method for low-altitude slow small infrared target detection. IEEE Geosci. Remote Sens. Lett. 2021, 19, 1–5. [Google Scholar] [CrossRef]
- Tom, V.T.; Peli, T.; Leung, M.; Bondaryk, J.E. Morphology-based algorithm for point target detection in infrared backgrounds. In Proceedings of the Signal and Data Processing of Small Targets 1993, Orlando, FL, USA, 11–16 April 1993; Drummond, O.E., Ed.; International Society for Optics and Photonics, SPIE: Bellingham, WA, USA, 1993; Volume 1954, pp. 2–11. [Google Scholar] [CrossRef]
- Deshpande, S.D.; Er, M.H.; Venkateswarlu, R.; Chan, P. Max-mean and max-median filters for detection of small targets. In Proceedings of the Signal and Data Processing of Small Targets 1999, Denver, CO, USA, 29 July–3 August 2001; Drummond, O.E., Ed.; International Society for Optics and Photonics, SPIE: Bellingham, WA, USA, 1999; Volume 3809, pp. 74–83. [Google Scholar] [CrossRef]
- Dai, Y.; Wu, Y. Reweighted Infrared Patch-Tensor Model With Both Nonlocal and Local Priors for Single-Frame Small Target Detection. IEEE J. Sel. Top. Appl. Earth Obs. Remote Sens. 2017, 10, 3752–3767. [Google Scholar] [CrossRef] [Green Version]
- Zhang, T.; Peng, Z.; Wu, H.; He, Y.; Li, C.; Yang, C. Infrared small target detection via self-regularized weighted sparse model. Neurocomputing 2021, 420, 124–148. [Google Scholar] [CrossRef]
- Wang, X.; Peng, Z.; Kong, D.; Zhang, P.; He, Y. Infrared dim target detection based on total variation regularization and principal component pursuit. Image Vis. Comput. 2017, 63, 1–9. [Google Scholar] [CrossRef]
- Tong, X.; Sun, B.; Wei, J.; Zuo, Z.; Su, S. EAAU-Net: Enhanced asymmetric attention U-Net for infrared small target detection. Remote Sens. 2021, 13, 3200. [Google Scholar] [CrossRef]
- Zhang, T.; Cao, S.; Pu, T.; Peng, Z. AGPCNet: Attention-Guided Pyramid Context Networks for Infrared Small Target Detection. arXiv 2021, arXiv:2111.03580. [Google Scholar] [CrossRef]
- Wang, H.; Zhou, L.; Wang, L. Miss detection vs. false alarm: Adversarial learning for small object segmentation in infrared images. In Proceedings of the IEEE/CVF International Conference on Computer Vision, Seoul, Korea, 27 October–2 November 2019; pp. 8509–8518. [Google Scholar] [CrossRef]
- Nasiri, M.; Chehresa, S. Infrared small target enhancement based on variance difference. Infrared Phys. Technol. 2017, 82, 107–119. [Google Scholar] [CrossRef]
- Wu, L.; Ma, Y.; Fan, F.; Wu, M.; Huang, J. A Double-Neighborhood Gradient Method for Infrared Small Target Detection. IEEE Geosci. Remote Sens. Lett. 2021, 18, 1476–1480. [Google Scholar] [CrossRef]
- Silverman, J.; Caefer, C.E.; DiSalvo, S.; Vickers, V.E. Temporal filtering for point target detection in staring IR imagery: II. Recursive variance filter. In Proceedings of the Signal and Data Processing of Small Targets 1998, Orlando, FL, USA, 14–16 April 1998; SPIE: Bellingham, WA, USA, 1998; Volume 3373, pp. 44–53. [Google Scholar] [CrossRef]
- Tzannes, A.P.; Brooks, D.H. Detecting small moving objects using temporal hypothesis testing. IEEE Trans. Aerosp. Electron. Syst. 2002, 38, 570–586. [Google Scholar] [CrossRef]
- Liu, D.; Li, Z.; Wang, X.; Zhang, J. Moving target detection by nonlinear adaptive filtering on temporal profiles in infrared image sequences. Infrared Phys. Technol. 2015, 73, 41–48. [Google Scholar] [CrossRef]
- Gao, J.; Lin, Z.; An, W. Infrared Small Target Detection Using a Temporal Variance and Spatial Patch Contrast Filter. IEEE Access 2019, 7, 32217–32226. [Google Scholar] [CrossRef]
- Zhang, Y.; Leng, K.; Park, K.S. Infrared Detection of Small Moving Target Using Spatial–Temporal Local Vector Difference Measure. IEEE Geosci. Remote Sens. Lett. 2022, 19, 1–5. [Google Scholar] [CrossRef]
- Liu, H.K.; Zhang, L.; Huang, H. Small target detection in infrared videos based on spatio-temporal tensor model. IEEE Trans. Geosci. Remote Sens. 2020, 58, 8689–8700. [Google Scholar] [CrossRef]
- Sun, Y.; Yang, J.; Long, Y.; An, W. Infrared small target detection via spatial-temporal total variation regularization and weighted tensor nuclear norm. IEEE Access 2019, 7, 56667–56682. [Google Scholar] [CrossRef]
- Pang, D.; Shan, T.; Li, W.; Ma, P.; Tao, R.; Ma, Y. Facet Derivative-Based Multidirectional Edge Awareness and Spatial-Temporal Tensor Model for Infrared Small Target Detection. IEEE Trans. Geosci. Remote Sens. 2021, 60, 5001015. [Google Scholar] [CrossRef]
- Zhang, P.; Zhang, L.; Wang, X.; Shen, F.; Pu, T.; Fei, C. Edge and Corner Awareness-Based Spatial–Temporal Tensor Model for Infrared Small-Target Detection. IEEE Trans. Geosci. Remote Sens. 2021, 59, 10708–10724. [Google Scholar] [CrossRef]
- Zhao, M.; Li, W.; Li, L.; Hu, J.; Ma, P.; Tao, R. Single-Frame Infrared Small-Target Detection: A Survey. IEEE Geosci. Remote Sens. Mag. 2022, 2–34. [Google Scholar] [CrossRef]
- Hubel, D.H.; Wiesel, T.N. Receptive fields, binocular interaction and functional architecture in the cat’s visual cortex. J. Physiol. 1962, 160, 106. [Google Scholar] [CrossRef] [PubMed]
- He, K.; Li, C.; Yang, Y.; Huang, G.; Hopcroft, J.E. Integrating Large Circular Kernels into CNNs through Neural Architecture Search. arXiv 2021, arXiv:2107.02451. [Google Scholar] [CrossRef]
- Qu, X.; Chen, H.; Peng, G. Novel detection method for infrared small targets using weighted information entropy. J. Syst. Eng. Electron. 2012, 23, 838–842. [Google Scholar] [CrossRef]
- Wang, B.; Motai, Y.; Dong, L.; Xu, W. Detecting infrared maritime targets overwhelmed in sun glitters by antijitter spatiotemporal saliency. IEEE Trans. Geosci. Remote Sens. 2019, 57, 5159–5173. [Google Scholar] [CrossRef]
- Harris, C.; Stephens, M. A combined corner and edge detector. In Proceedings of the Alvey Vision Conference, Reading, UK, 31 August–2 September 1988; Volume 15, pp. 10–5244. [Google Scholar] [CrossRef]
- Silpa-Anan, C.; Hartley, R. Optimised KD-trees for fast image descriptor matching. In Proceedings of the 2008 IEEE Conference on Computer Vision and Pattern Recognition, Anchorage, AK, USA, 23–28 June 2008; pp. 1–8. [Google Scholar] [CrossRef] [Green Version]
- Wang, H.; Li, H.; Zhou, H.; Chen, X. Low-altitude infrared small target detection based on fully convolutional regression network and graph matching. Infrared Phys. Technol. 2021, 115, 103738. [Google Scholar] [CrossRef]
- Hui, B.; Song, Z.; Fan, H.; Zhong, P.; Hu, W.; Zhang, X.; Lin, J.; Su, H.; Jin, W.; Zhang, Y.; et al. A dataset for infrared image dim-small aircraft target detection and tracking under ground/air background. Sci. Data Bank 2019, 1, 2019. [Google Scholar] [CrossRef]
- Gao, C.; Wang, L.; Xiao, Y.; Zhao, Q.; Meng, D. Infrared small-dim target detection based on Markov random field guided noise modeling. Pattern Recognit. 2018, 76, 463–475. [Google Scholar] [CrossRef]
- Bai, X.; Zhou, F. Analysis of new top-hat transformation and the application for infrared dim small target detection. Pattern Recognit. 2010, 43, 2145–2156. [Google Scholar] [CrossRef]
- Kim, S. High-Speed Incoming Infrared Target Detection by Fusion of Spatial and Temporal Detectors. Sensors 2015, 15, 7267–7293. [Google Scholar] [CrossRef] [Green Version]


| Seq. | Frame Number | Target Size | Scene Description |
|---|---|---|---|
| 1 | 399 | Single target from near to far, non-uniform background | |
| 2 | 500 | ∼ | Single target from far to near, chaotic ground background |
| 3 | 1500 | ∼ | Single target from far to near, cluttered ground background |
| 4 | 751 | ∼ | Single target, ground background containing man-made buildings |
| 5 | 399 | ∼ | Single target from near to far, non-uniform background |
| 6 | 500 | Single dim target, cluttered ground background |
| Methods | Parameter Settings |
|---|---|
| NWTH | |
| MPCM | Cell size: , , , |
| RIPT | Patch size: , sliding step: 10, , , , |
| STLDM | Subblock size: , |
| NSTS | Internal cell size: , middle cell size: , external cell size: , |
| STLVDM | , |
| STFM (proposed) | , , , |
| Seq. | Metrics | NWTH | MPCM | RIPT | STLDM | NSTS | STLVDM | Proposed |
|---|---|---|---|---|---|---|---|---|
| 1 | 21.34 | 20.45 | 6.98 | 40.84 | 282.74 | 6.30 | Inf | |
| 20.11 | 1.42 | 35.90 | 25.39 | 90.05 | 4.75 | Inf | ||
| 0.86 | 0.82 | 0.18 | 1.64 | 0.81 | 1.79 | 1.48 | ||
| 2 | 17.5486 | 12.01 | 4.22 | 32.20 | 182.49 | 4.22 | 350.63 | |
| 34.40 | 1.29 | 26.66 | 21.36 | Inf | 4.10 | 401.66 | ||
| 0.54 | 0.87 | 0.17 | 1.24 | 1.00 | 1.57 | 1.31 | ||
| 3 | 37.02 | 4.28 | 17.40 | 9.19 | 44.82 | 19.67 | Inf | |
| 50.20 | 1.64 | 31.18 | 6.35 | 58.82 | 20.97 | Inf | ||
| 1.41 | 1.53 | 0.50 | 3.15 | 3.06 | 4.30 | 5.64 | ||
| 4 | 23.93 | 2.38 | 6.68 | 4.04 | 33.58 | 5.54 | Inf | |
| 23.75 | 1.23 | 10.37 | 24.77 | 14.53 | 10.75 | Inf | ||
| 0.89 | 0.30 | 0.54 | 1.85 | 1.24 | 1.13 | 1.97 | ||
| 5 | 20.44 | 3.95 | 18.15 | 19.31 | 31.94 | 16.97 | 325.77 | |
| 29.81 | 1.46 | 19.96 | 9.5 | 16.92 | 7.19 | 261.93 | ||
| 0.66 | 0.75 | 0.72 | 2.37 | 3.68 | 4.04 | 2.08 | ||
| 6 | 11.87 | 7.79 | 26.76 | 15.51 | 31.80 | 17.6547 | 278.18 | |
| 10.96 | 1.12 | 21.19 | 4.54 | 3.52 | 2.6264 | 282.64 | ||
| 1.06 | 0.82 | 2.11 | 2.28 | 2.30 | 3.22 | 3.56 |
| Modules | (%) | ||
|---|---|---|---|
| LCG | SEA | LTC | |
| ✓ | ✓ | 95.65 | |
| ✓ | ✓ | 94.72 | |
| ✓ | ✓ | 93.52 | |
| ✓ | ✓ | ✓ | 97.11 |
Publisher’s Note: MDPI stays neutral with regard to jurisdictional claims in published maps and institutional affiliations. |
© 2022 by the authors. Licensee MDPI, Basel, Switzerland. This article is an open access article distributed under the terms and conditions of the Creative Commons Attribution (CC BY) license (https://creativecommons.org/licenses/by/4.0/).
Share and Cite
Mu, J.; Rao, J.; Chen, R.; Li, F. Low-Altitude Infrared Slow-Moving Small Target Detection via Spatial-Temporal Features Measure. Sensors 2022, 22, 5136. https://doi.org/10.3390/s22145136
Mu J, Rao J, Chen R, Li F. Low-Altitude Infrared Slow-Moving Small Target Detection via Spatial-Temporal Features Measure. Sensors. 2022; 22(14):5136. https://doi.org/10.3390/s22145136
Chicago/Turabian StyleMu, Jing, Junmin Rao, Ruimin Chen, and Fanming Li. 2022. "Low-Altitude Infrared Slow-Moving Small Target Detection via Spatial-Temporal Features Measure" Sensors 22, no. 14: 5136. https://doi.org/10.3390/s22145136
APA StyleMu, J., Rao, J., Chen, R., & Li, F. (2022). Low-Altitude Infrared Slow-Moving Small Target Detection via Spatial-Temporal Features Measure. Sensors, 22(14), 5136. https://doi.org/10.3390/s22145136