1. Introduction
The Heavy Ion Beam Diagnostic (HIBD) [
1] is the only tool for direct measurements of plasma potential in magnetically confined fusion plasmas. The measurements of plasma potential fluctuations are of special interest and importance in investigations of turbulent transport [
2]. Traditionally, the plasma potential is obtained from the measurements of secondary beam energy using an electrostatic energy analyzer with split-plate detector (SPD), which transforms the beam energy variation to the difference in currents between split plates [
3]. Conventionally, with the assumption of relatively small electron density and temperature gradients inside the sample (primary beam ionization) volume, the data from SPD are analyzed with the assumption that the secondary beam current is uniform. However, because the secondary beam presents an effective projection of the primary beam inside the sample volume, it should be coupled with the profile of the primary beam, which, generally, is non-uniform.
This paper considers the possible influence of the secondary beam non-uniformity on plasma potential and its fluctuation measurements using SPD technique.
The paper is organized as follows. The coupling of primary and secondary beam profiles is examined in
Section 2 for a simplistic model of circular primary beam and secondary ions that emerge perpendicular to the primary beam axis. Split-plate detection and SPD transfer characteristics for the non-uniform secondary beam are considered in
Section 3. The influence of the secondary beam non-uniformity on plasma potential and its fluctuation measurements is analyzed in
Section 4. The supported experimental data from the ISTTOK tokamak HIBD for primary and secondary beam profiles and SPD transfer characteristics obtained for the 90° cylindrical energy analyzer (90° CEA) are presented in
Section 5. The multiple-cell and multi-split-plate detection for direct measurements of the secondary beam profile and SPD transfer characteristic is proposed in
Section 6.
Section 7 provides a summary.
2. Coupling of Primary and Secondary Beam Profiles
In HIBD, a beam of singly charged ions (primary beam, I
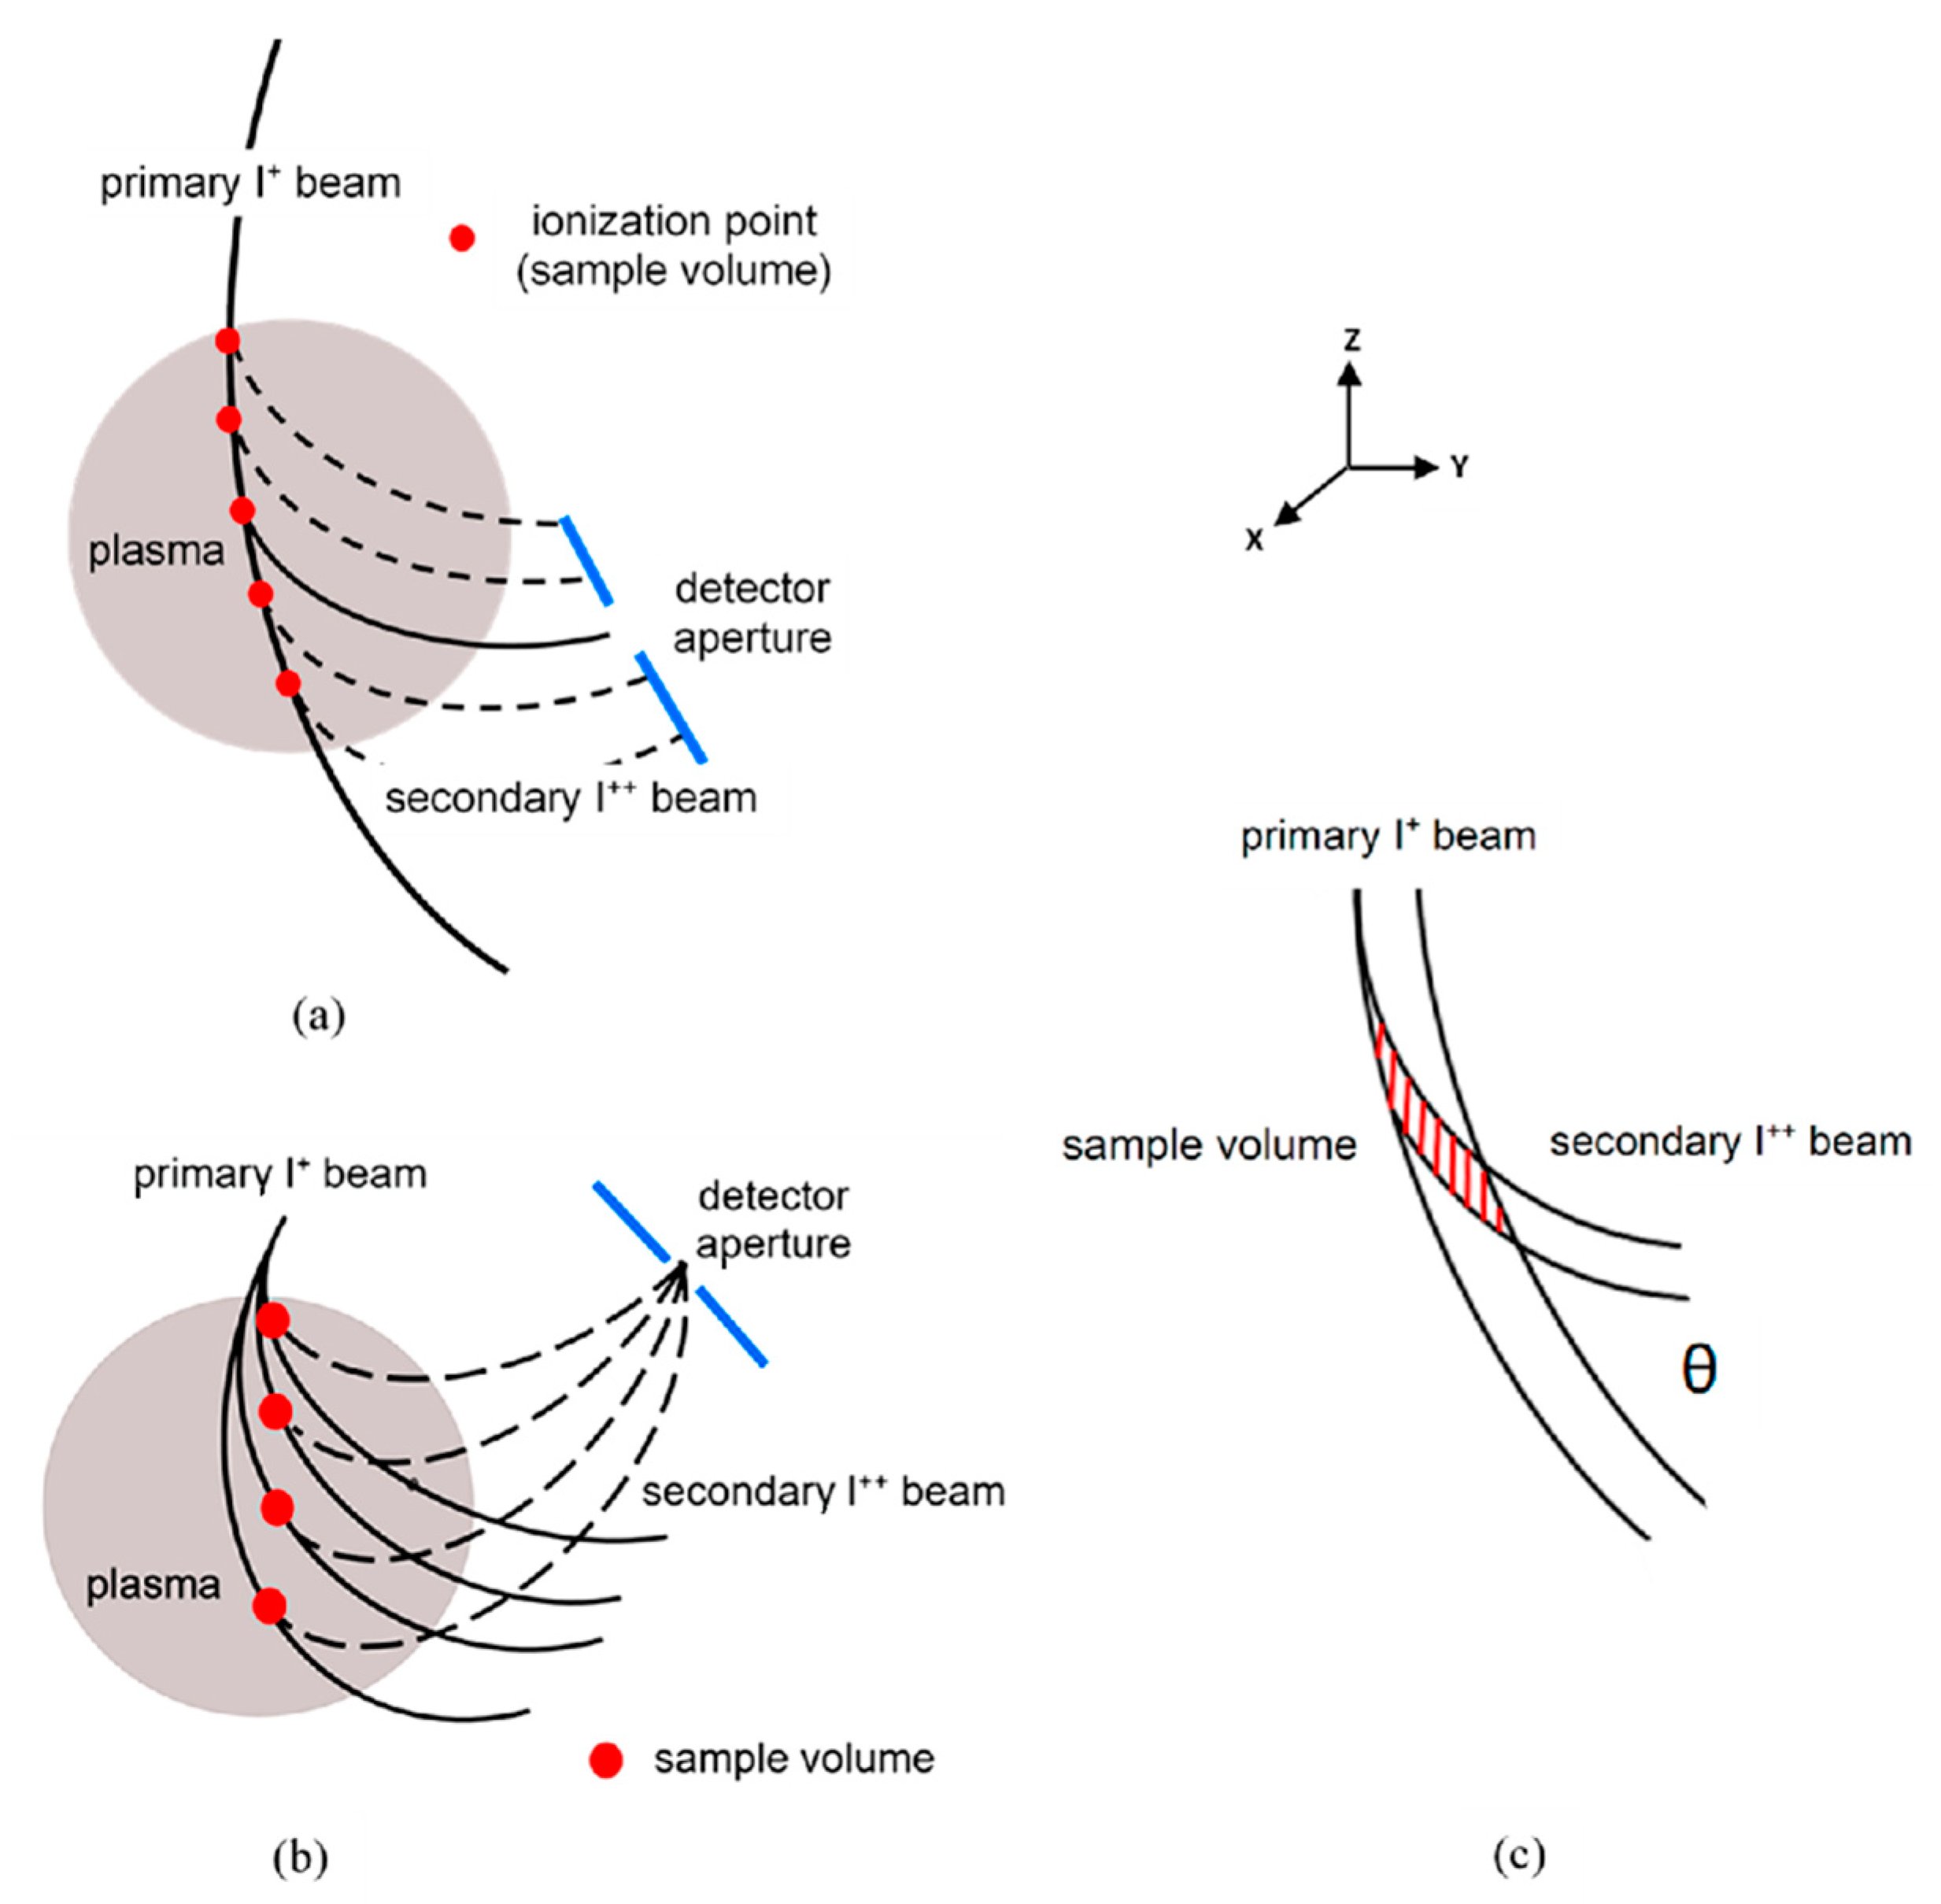
+) is directed through the plasma across the confining magnetic field with energy to provide a Larmor radius higher than the dimension of the plasma cross-section, as shown in
Figure 1a. Colliding with plasma electrons, some primary ions are ionized to the double-charge state (secondary beam, I
++) along the primary beam path and are separated from the primary beam by the magnetic field. If to place a small aperture detector in the fan of the secondary ions that emerged from the plasma, it will only observe those secondaries that are created in a small sample volume along the primary beam, as schematically depicted in
Figure 1c.
In
Figure 1a, the injection angle of the primary beam is fixed and its trajectory inside the plasma presents an effective detector line of the measurements. In traditional HIBD shown in
Figure 1b, the primary beam injection angle is scanned during plasma shot, and a fan of secondary ions created inside the definite sample volume of every angle discriminated primary beam trajectory is focused in one spatially definite point by the toroidal magnetic field. The respective sample volumes in the angle fan of the primary beam trajectories inside the plasma form the detector line of the measurements. In HIBD configuration in
Figure 1a, the plasma parameters along the detector line are measured simultaneously with multichannel detection of the secondary ions. This HIBD configuration is used on the ISTTOK [
4]. On the other hand, in
Figure 1b showing traditional HIBD configuration with detection of the focused secondary ions in one spatial point, the measurements of the plasma parameters in the sample volumes along the detector line are delayed in time. In both HIBD configurations, the formation of the sample volume is similar (as in
Figure 1c) with the sample volume size determined by the dimensions of the primary beam and detector aperture.
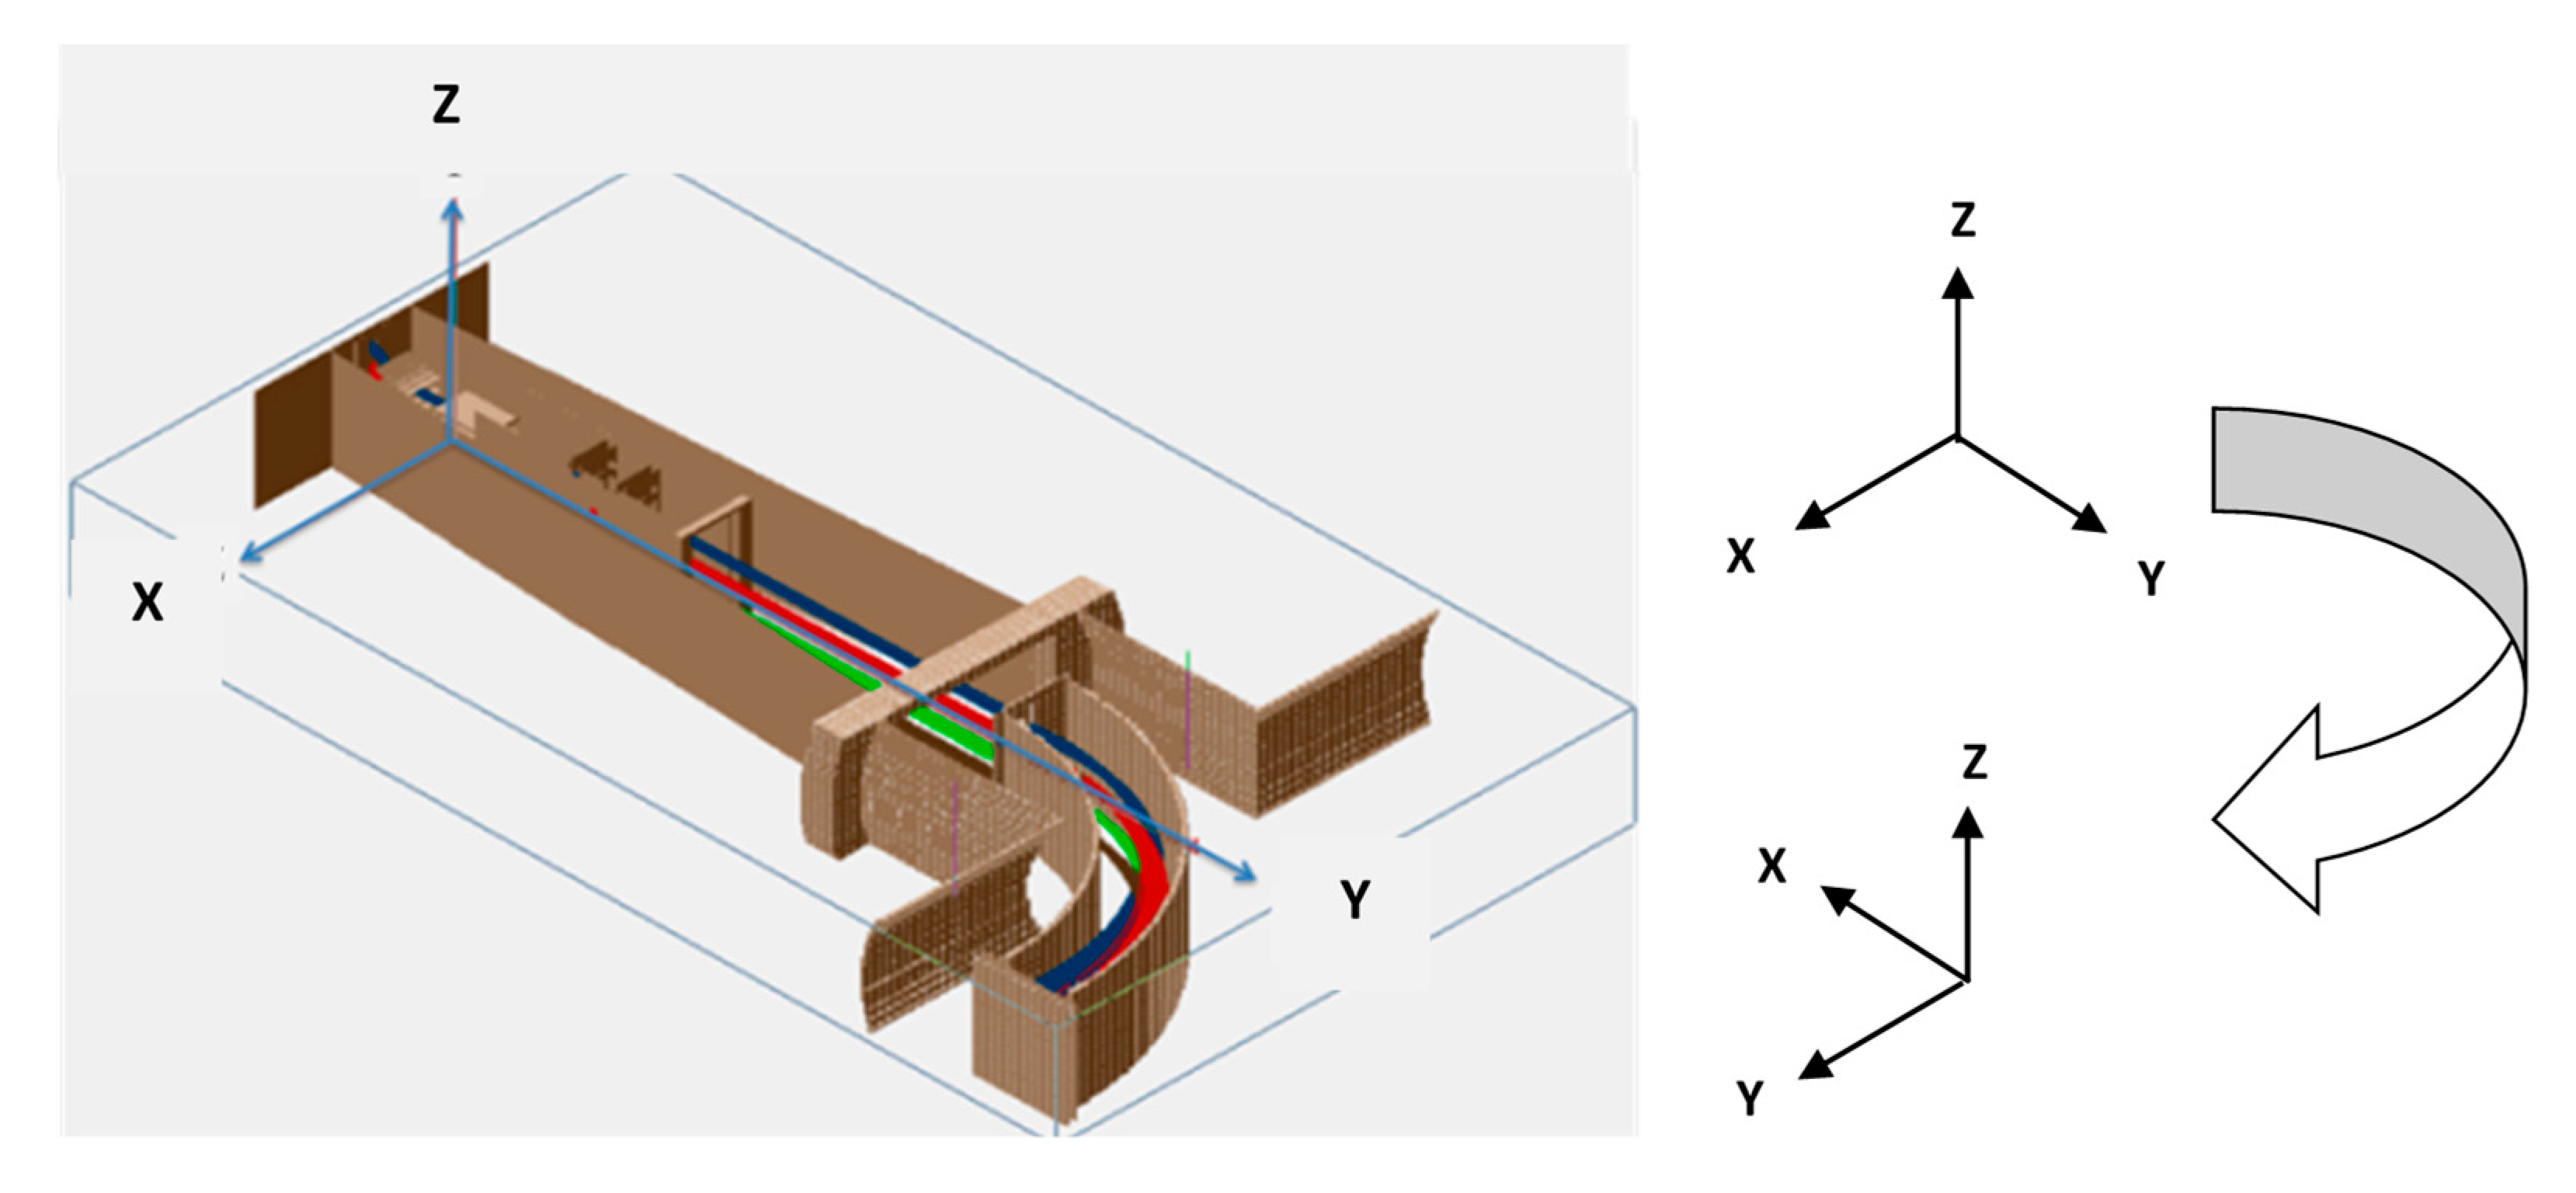
Consider the primary beam of circular cross section and uniform current density. The sample volume then consists of a cylinder with parallel end planes that cut the cylinder at some angle
θ with respect to the cylindrical (beam) axis. In the YZ plane projection in
Figure 1c, the sample volume cross-section is roughly a parallelogram. Diagonal of the parallelogram is minimal at
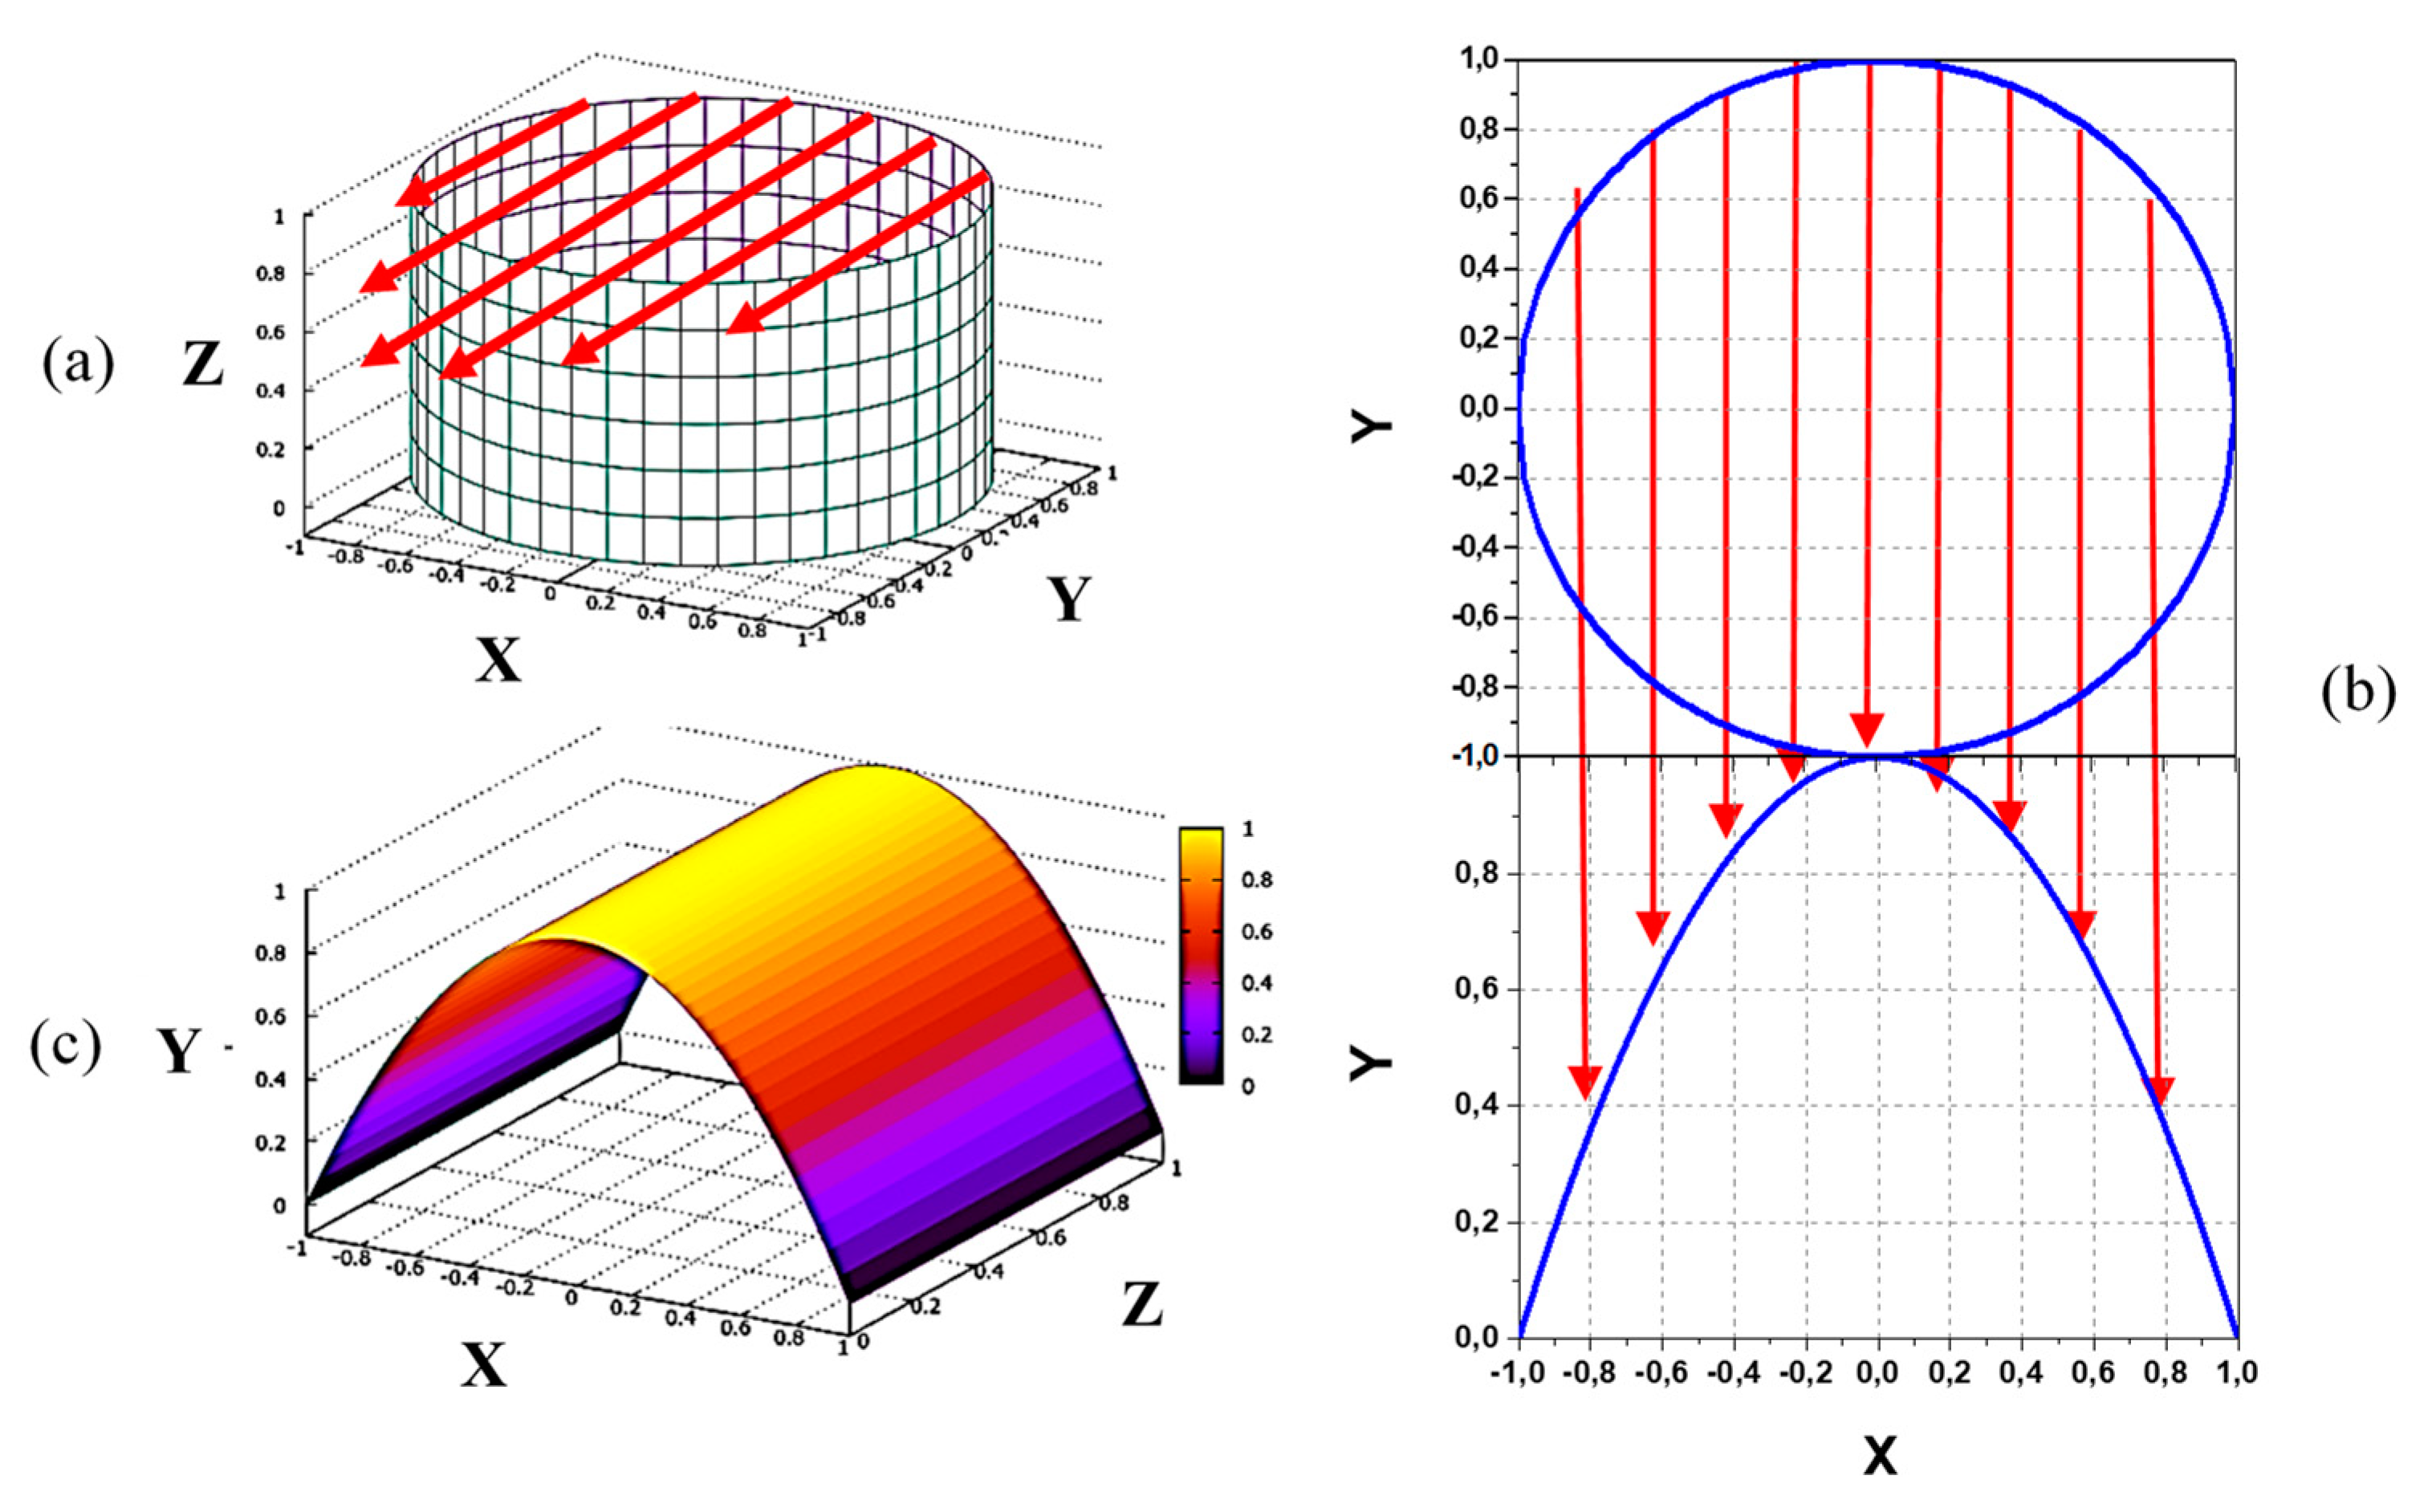
θ = 90°, determining maximal spatial resolution of the measurements. For that hypothetical ideal situation, the 3D image of the sample volume of unit length (determined by detector slit width in the vertical Z direction) and circular primary beam of unit radius (in XY plane) is shown in
Figure 2a with the emerged (in Y direction) secondary ions marked by arrows. As illustrated in
Figure 2b the current distribution (profile) of the secondary beam is determined by the secondary ions created (integrated) along the chords in the XY cross-section of the primary beam. The respective 3D image of the secondary beam is shown in
Figure 2c, demonstrating parabolic (
y = 1 −
x2) and rectangular shapes of the beam in XY and XZ planes, determined, respectively, by chords lengths and the analyzer entrance slit width.
These simplistic considerations demonstrate that even for the uniform primary beam, the secondary beam can attain non-uniformity as a result of the shape of the primary beam.
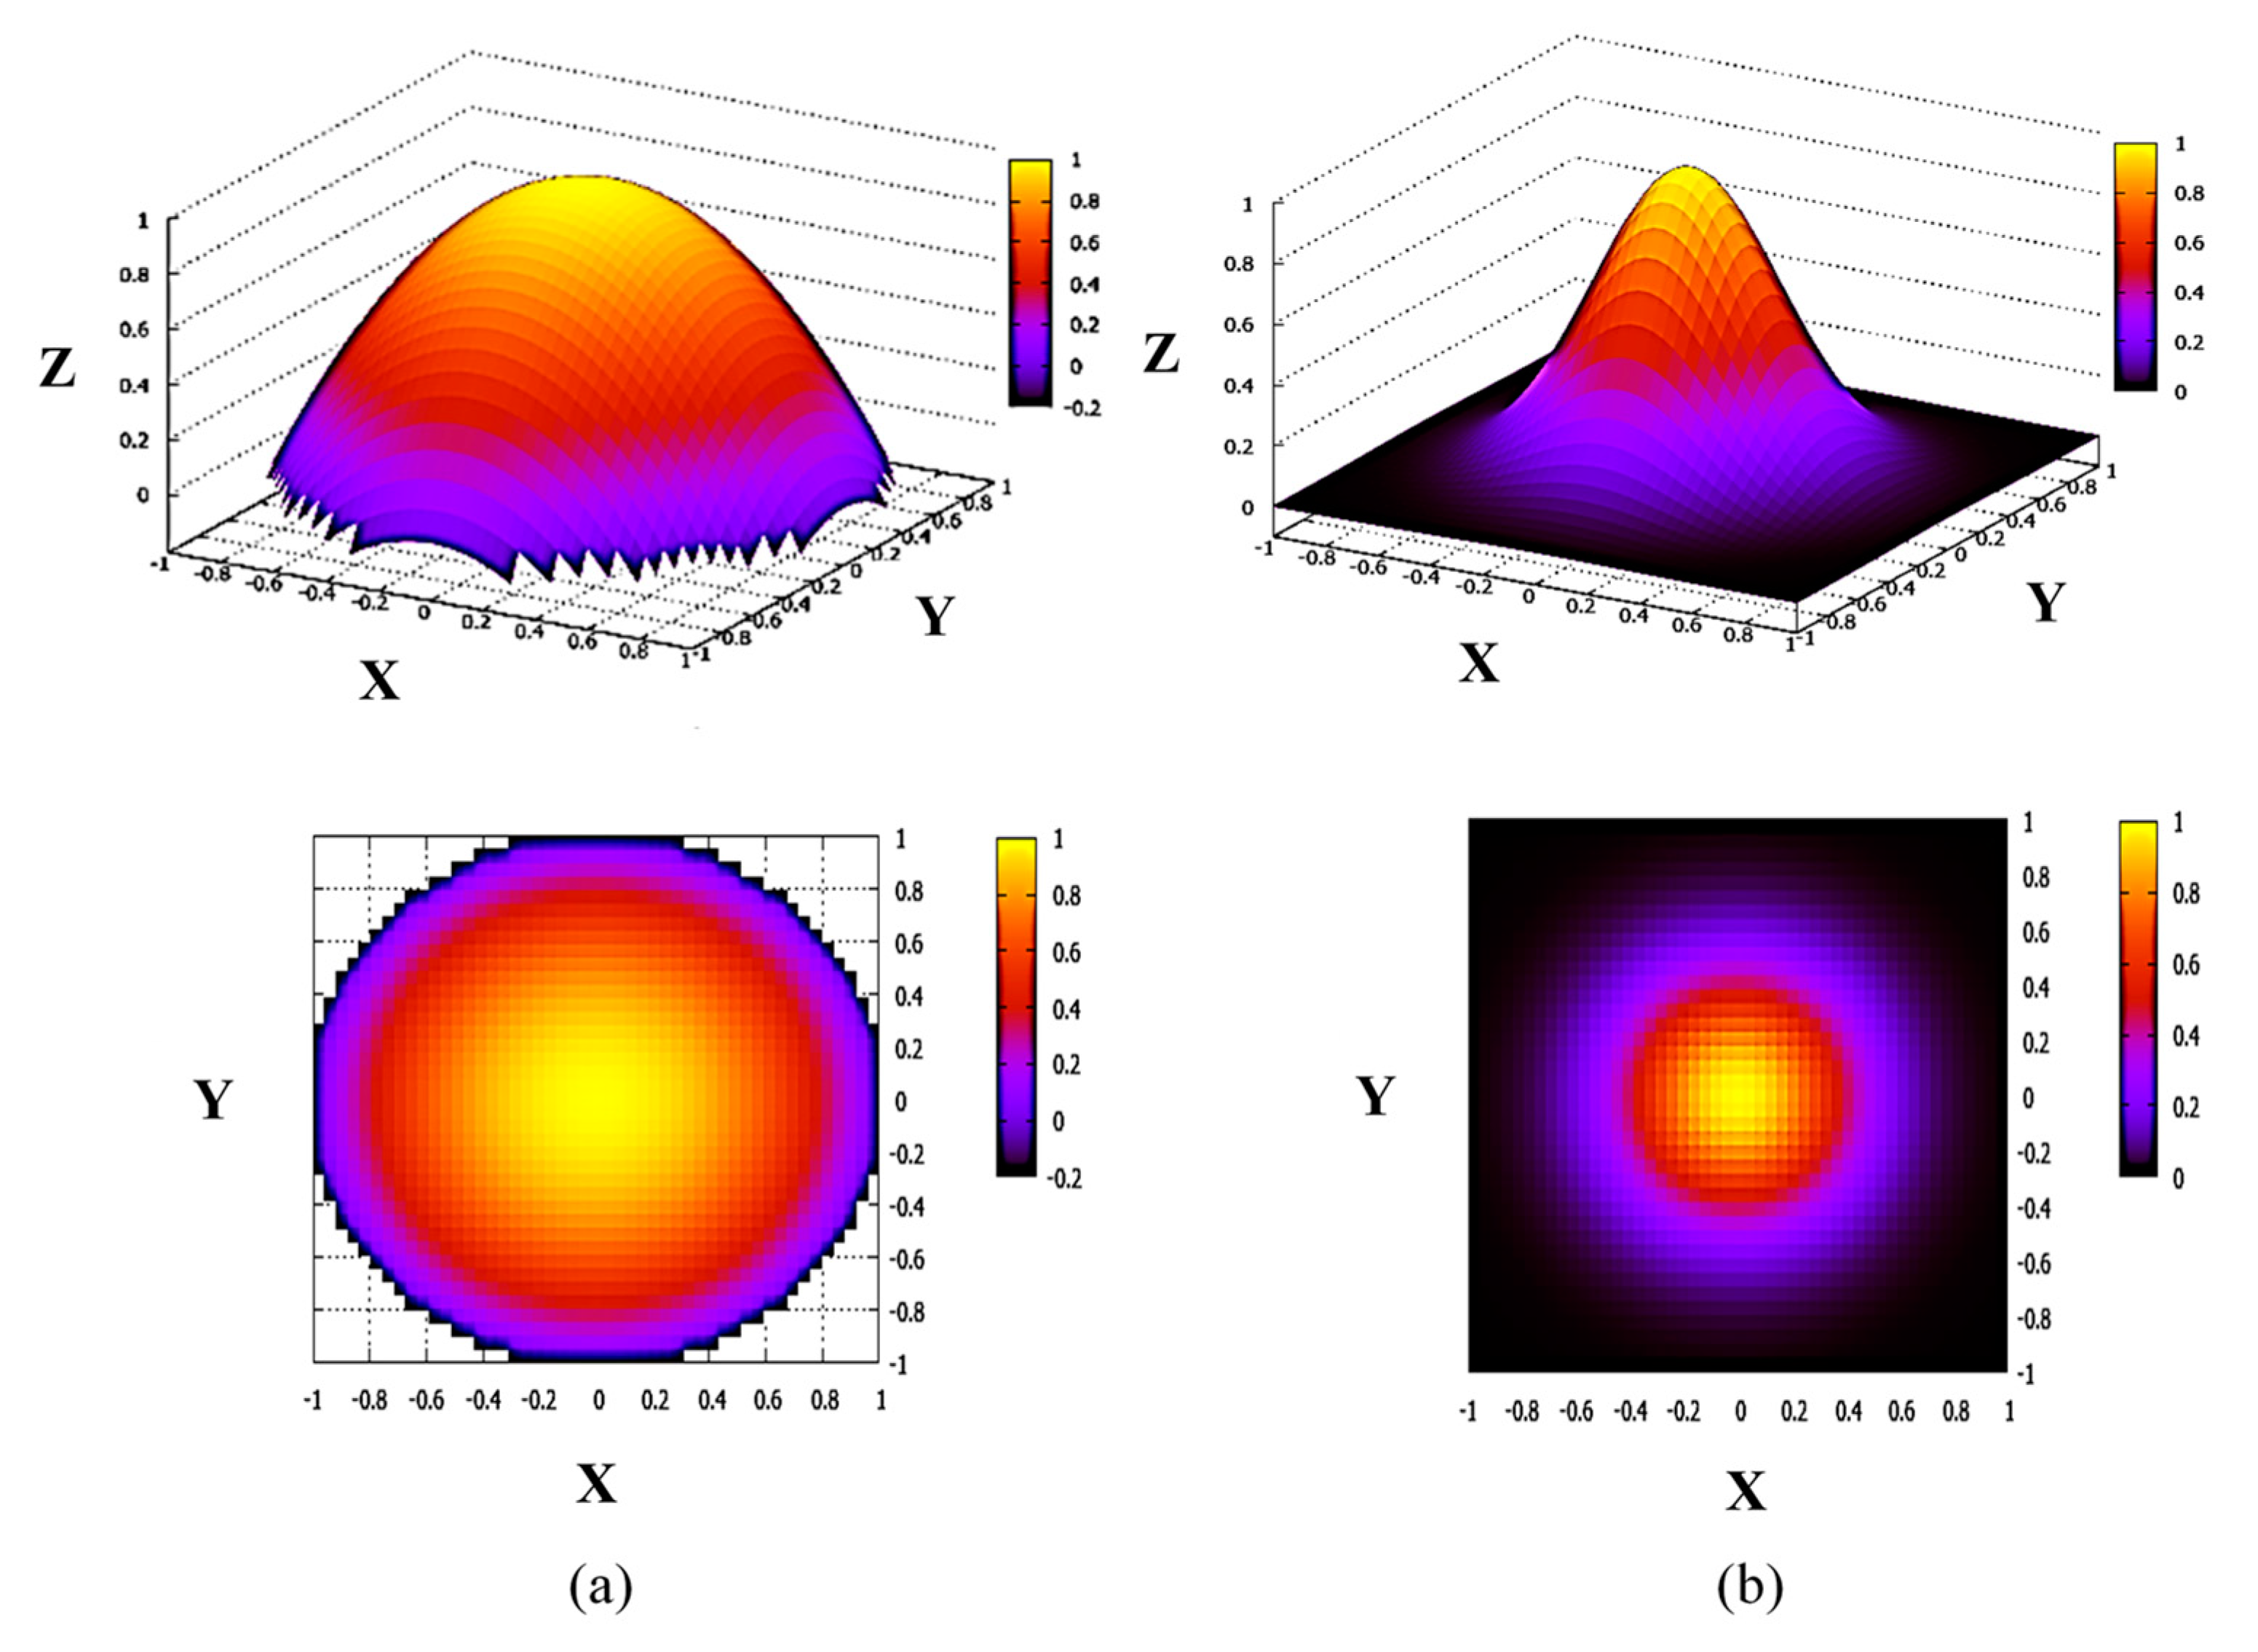
The 3D and 2D images of the above considered circular primary beam, but with parabolic,
y = 1 −
x2, and bell-shape,
y = exp(−5
x2), current density profiles are shown, respectively, in
Figure 3a,b.
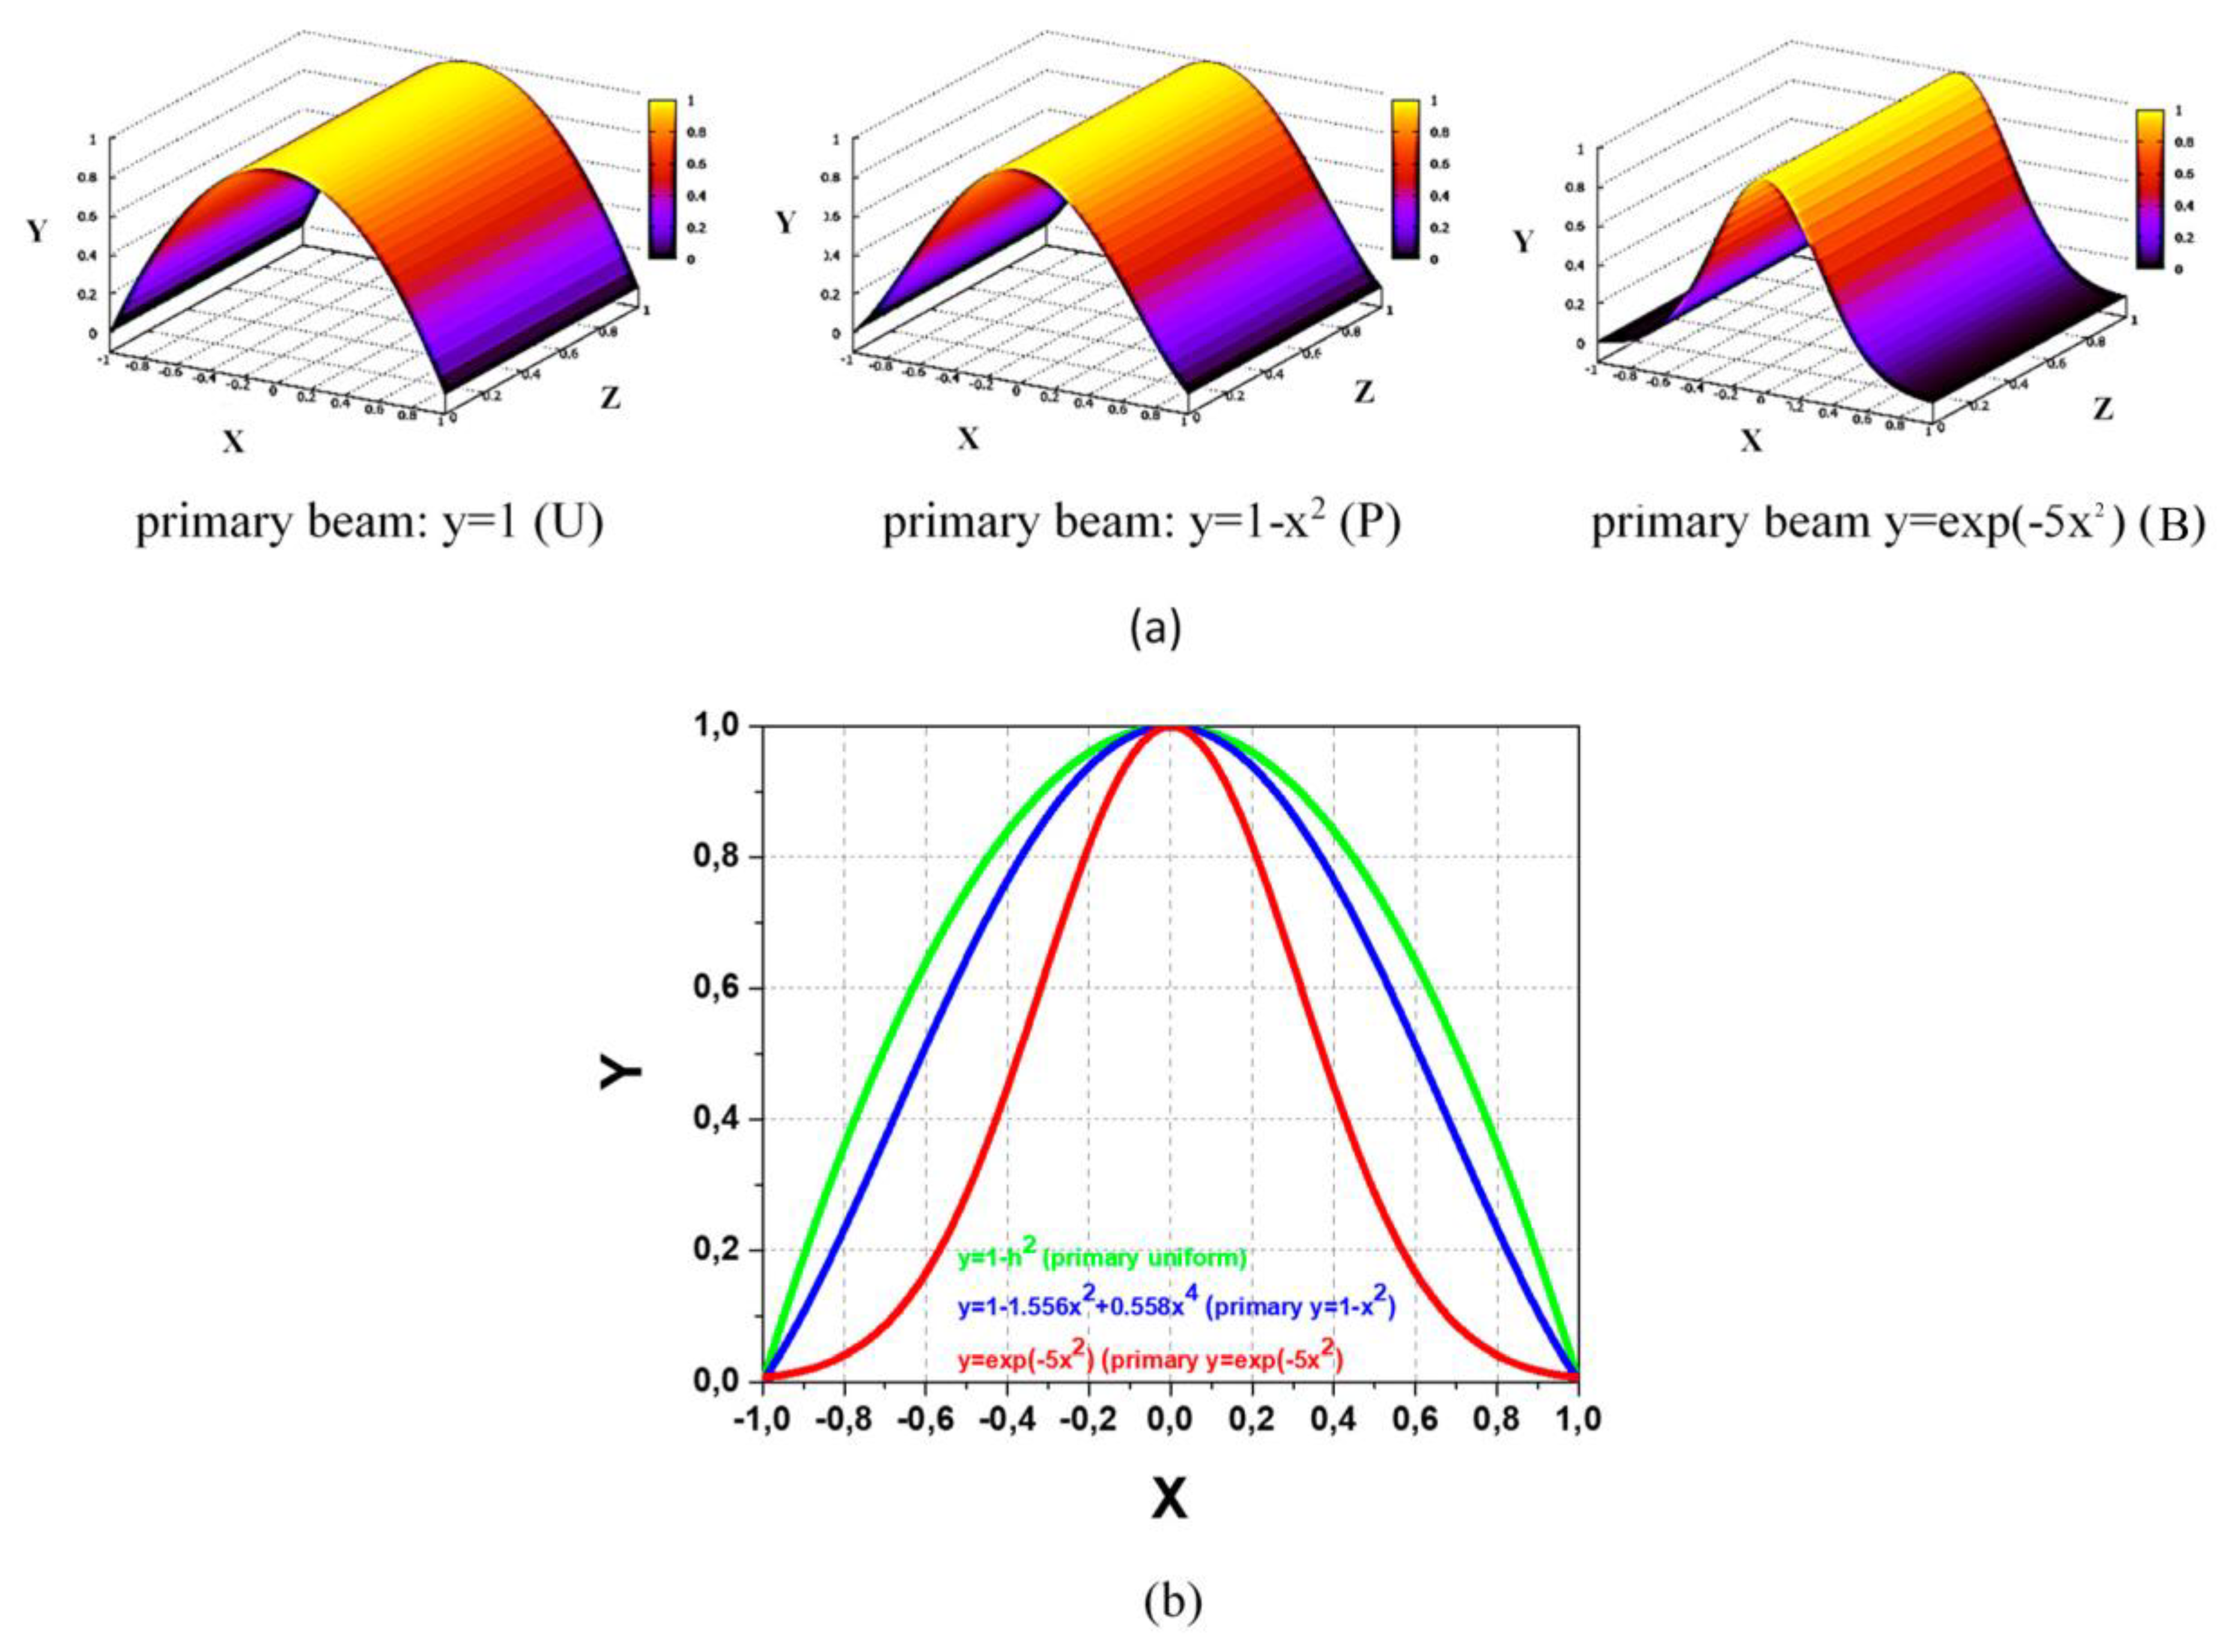
Figure 4a,b present the respective normalized 3D images and XY profiles of the secondary beam obtained in similar simplified considerations by integration in planes of primary beam chord slices, being:
for the, respectively, uniform (
y = 1), parabolic (
y = 1 −
x2) and bell-shape (
y= exp(−5
x2)) primary beam.
The results in
Figure 4 demonstrate the modifications of the secondary beam profile introduced by the non-uniformity of the primary beam. Additionally, notice that in real conditions of tangent propagation of secondary ions from the sample volume (as in
Figure 1c), the respective XY cross-sections of the sample volume are rather ellipsoids than circles, with corresponding alterations in the secondary beam profile.
3. Split-Plate Detection and SPD Transfer Characteristics
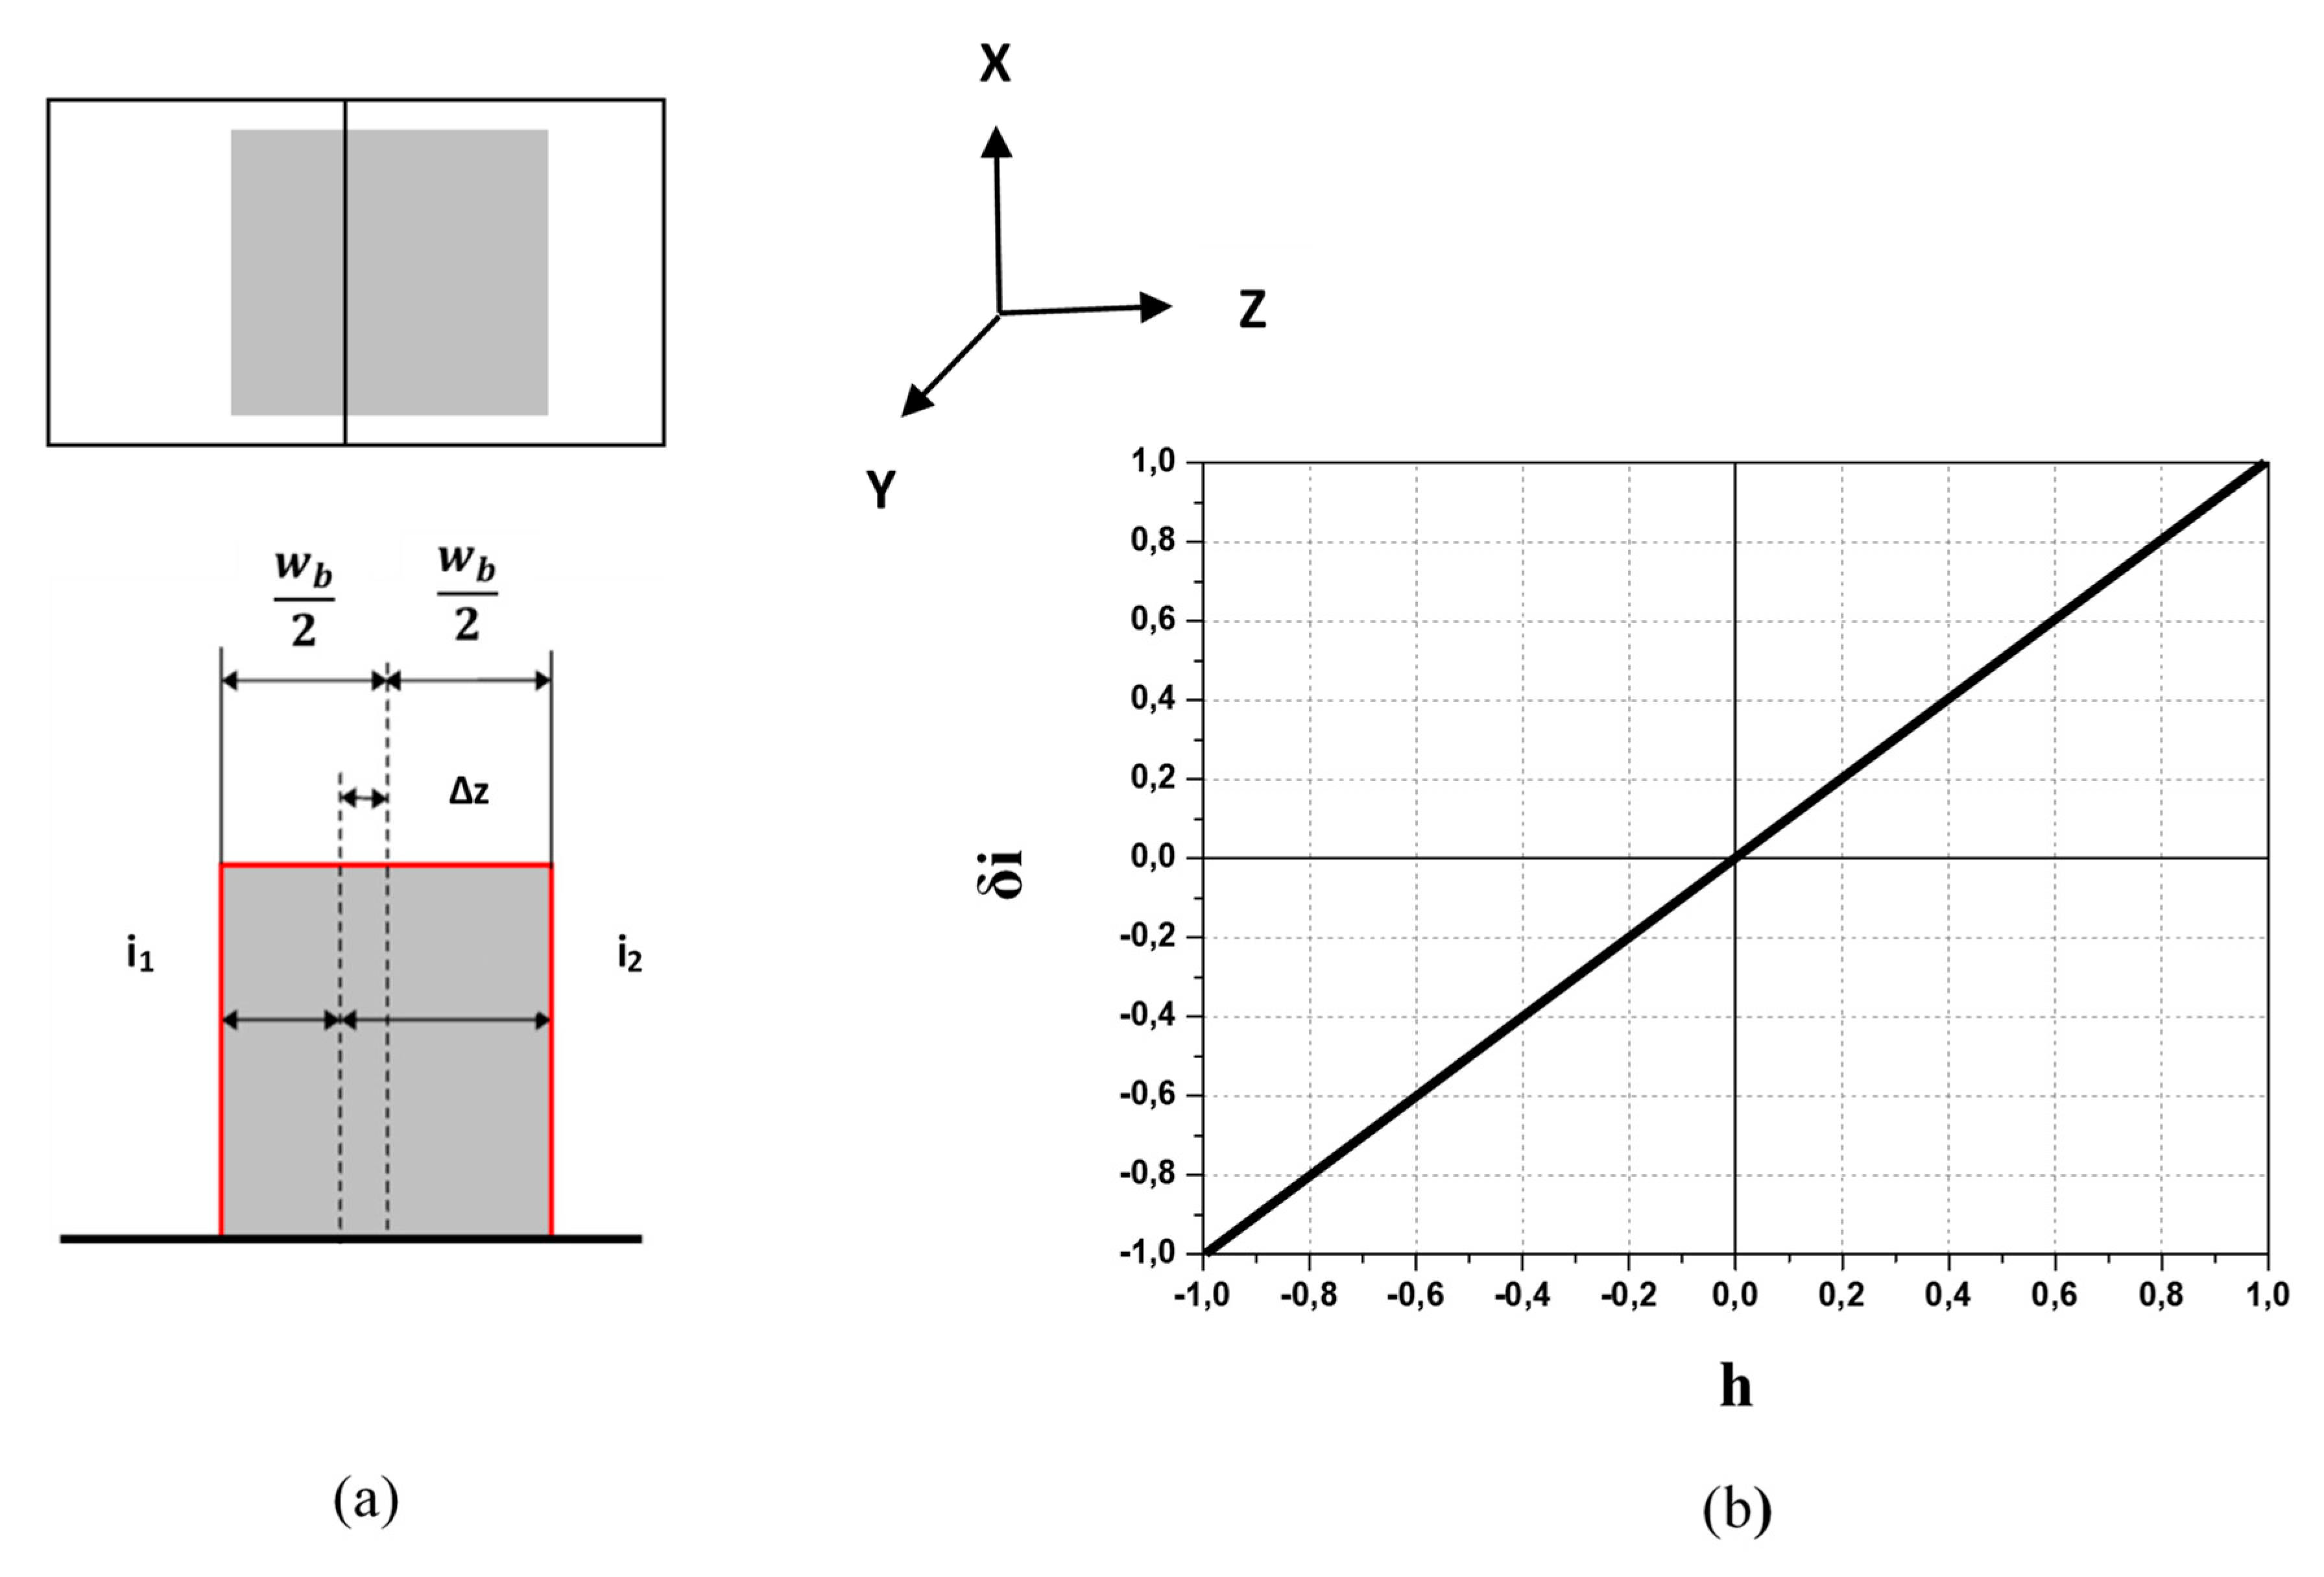
In the HIBD standard split-plate detection, the secondary beam displacement, due to energy variation, is measured from the difference in the currents between the split plates. Conventionally, this can be explained according to the schematic of ideal case depicted in
Figure 5a for the uniform rectangular beam of width
wb [
3]. From simple geometrical considerations, the relationship between beam displacement ∆
z and split-plate current difference Δ
i =
i1 −
i2 between plates is:
where
h = ∆
z/
wb is the normalized on the beam width displacement,
iΣ =
i1 +
i2 is the sum split-plates current and
δi is the normalized beam current difference.
The respective ideal secondary beam
δiI-
h SPD transfer characteristic resulting from the effective scan of the beam across split-line is shown in
Figure 5b and is linear inside the dynamic range of
δi = ±1 and
h = ±1.
Formally, the current on the split plates can be represented by triple integral ∫d
x ∫d
y∫d
z taken on the secondary beam current profile over the appropriate functions and bounds of
x, y, and
z. The beam current difference between split plates expressed in terms of current on one of the plates (for example,
i2) is:
Then, for the secondary beams in
Figure 4 and beam displacement in the Z direction (split-line parallel to X axis as shown in
Figure 6a), the current
i2 and
δiZ-
h transfer characteristic are:
where
y =
f(
x) is the secondary beam profile in the XY plane and
C =
−1∫
1 f(
x)d
x = Const.
Contrary, for the beam displacement in the X direction (split-line parallel to Z axis as shown in
Figure 6b), the respective current
i2 and
δiX-
h transfer characteristic are:
where
F(
h) =
−1∫
h f(
x)d
x.
The results of Equations (4) and (5) demonstrate the orthotropy of the
δi-
h transfer characteristics for beam displacements in Z and X directions, or effective dependence on the orientation of the analyzer energy dispersion plane. As follows from Equation (4), for beam displacement in the Z direction and split-line parallel to the X axis (analyzer energy dispersion in YZ plane), the linearity of the
δiz-
h characteristic is persisted for any beam profile in the XY plane, determining the effective applicability of SPD data analysis based on the assumption of secondary ion beam’s uniformity. This result applies for the HIBDs with the orientation of the analyzer energy dispersion plane coinciding with a plane of secondary beam propagation. This is typical for all traditional HIBDs operated with the injection of the angle-scanned primary beam (
Figure 1b) and the mirror-type 30° Proca-Green electrostatic energy analyzer [
3]. On ISTTOK, the HIBD is operated with the fixed injection angle of the primary beam (
Figure 1a) and employs the 90° cylindrical energy analyzer (90° CEA) due to its multichannel operation ability along the analyzer non-dispersive direction [
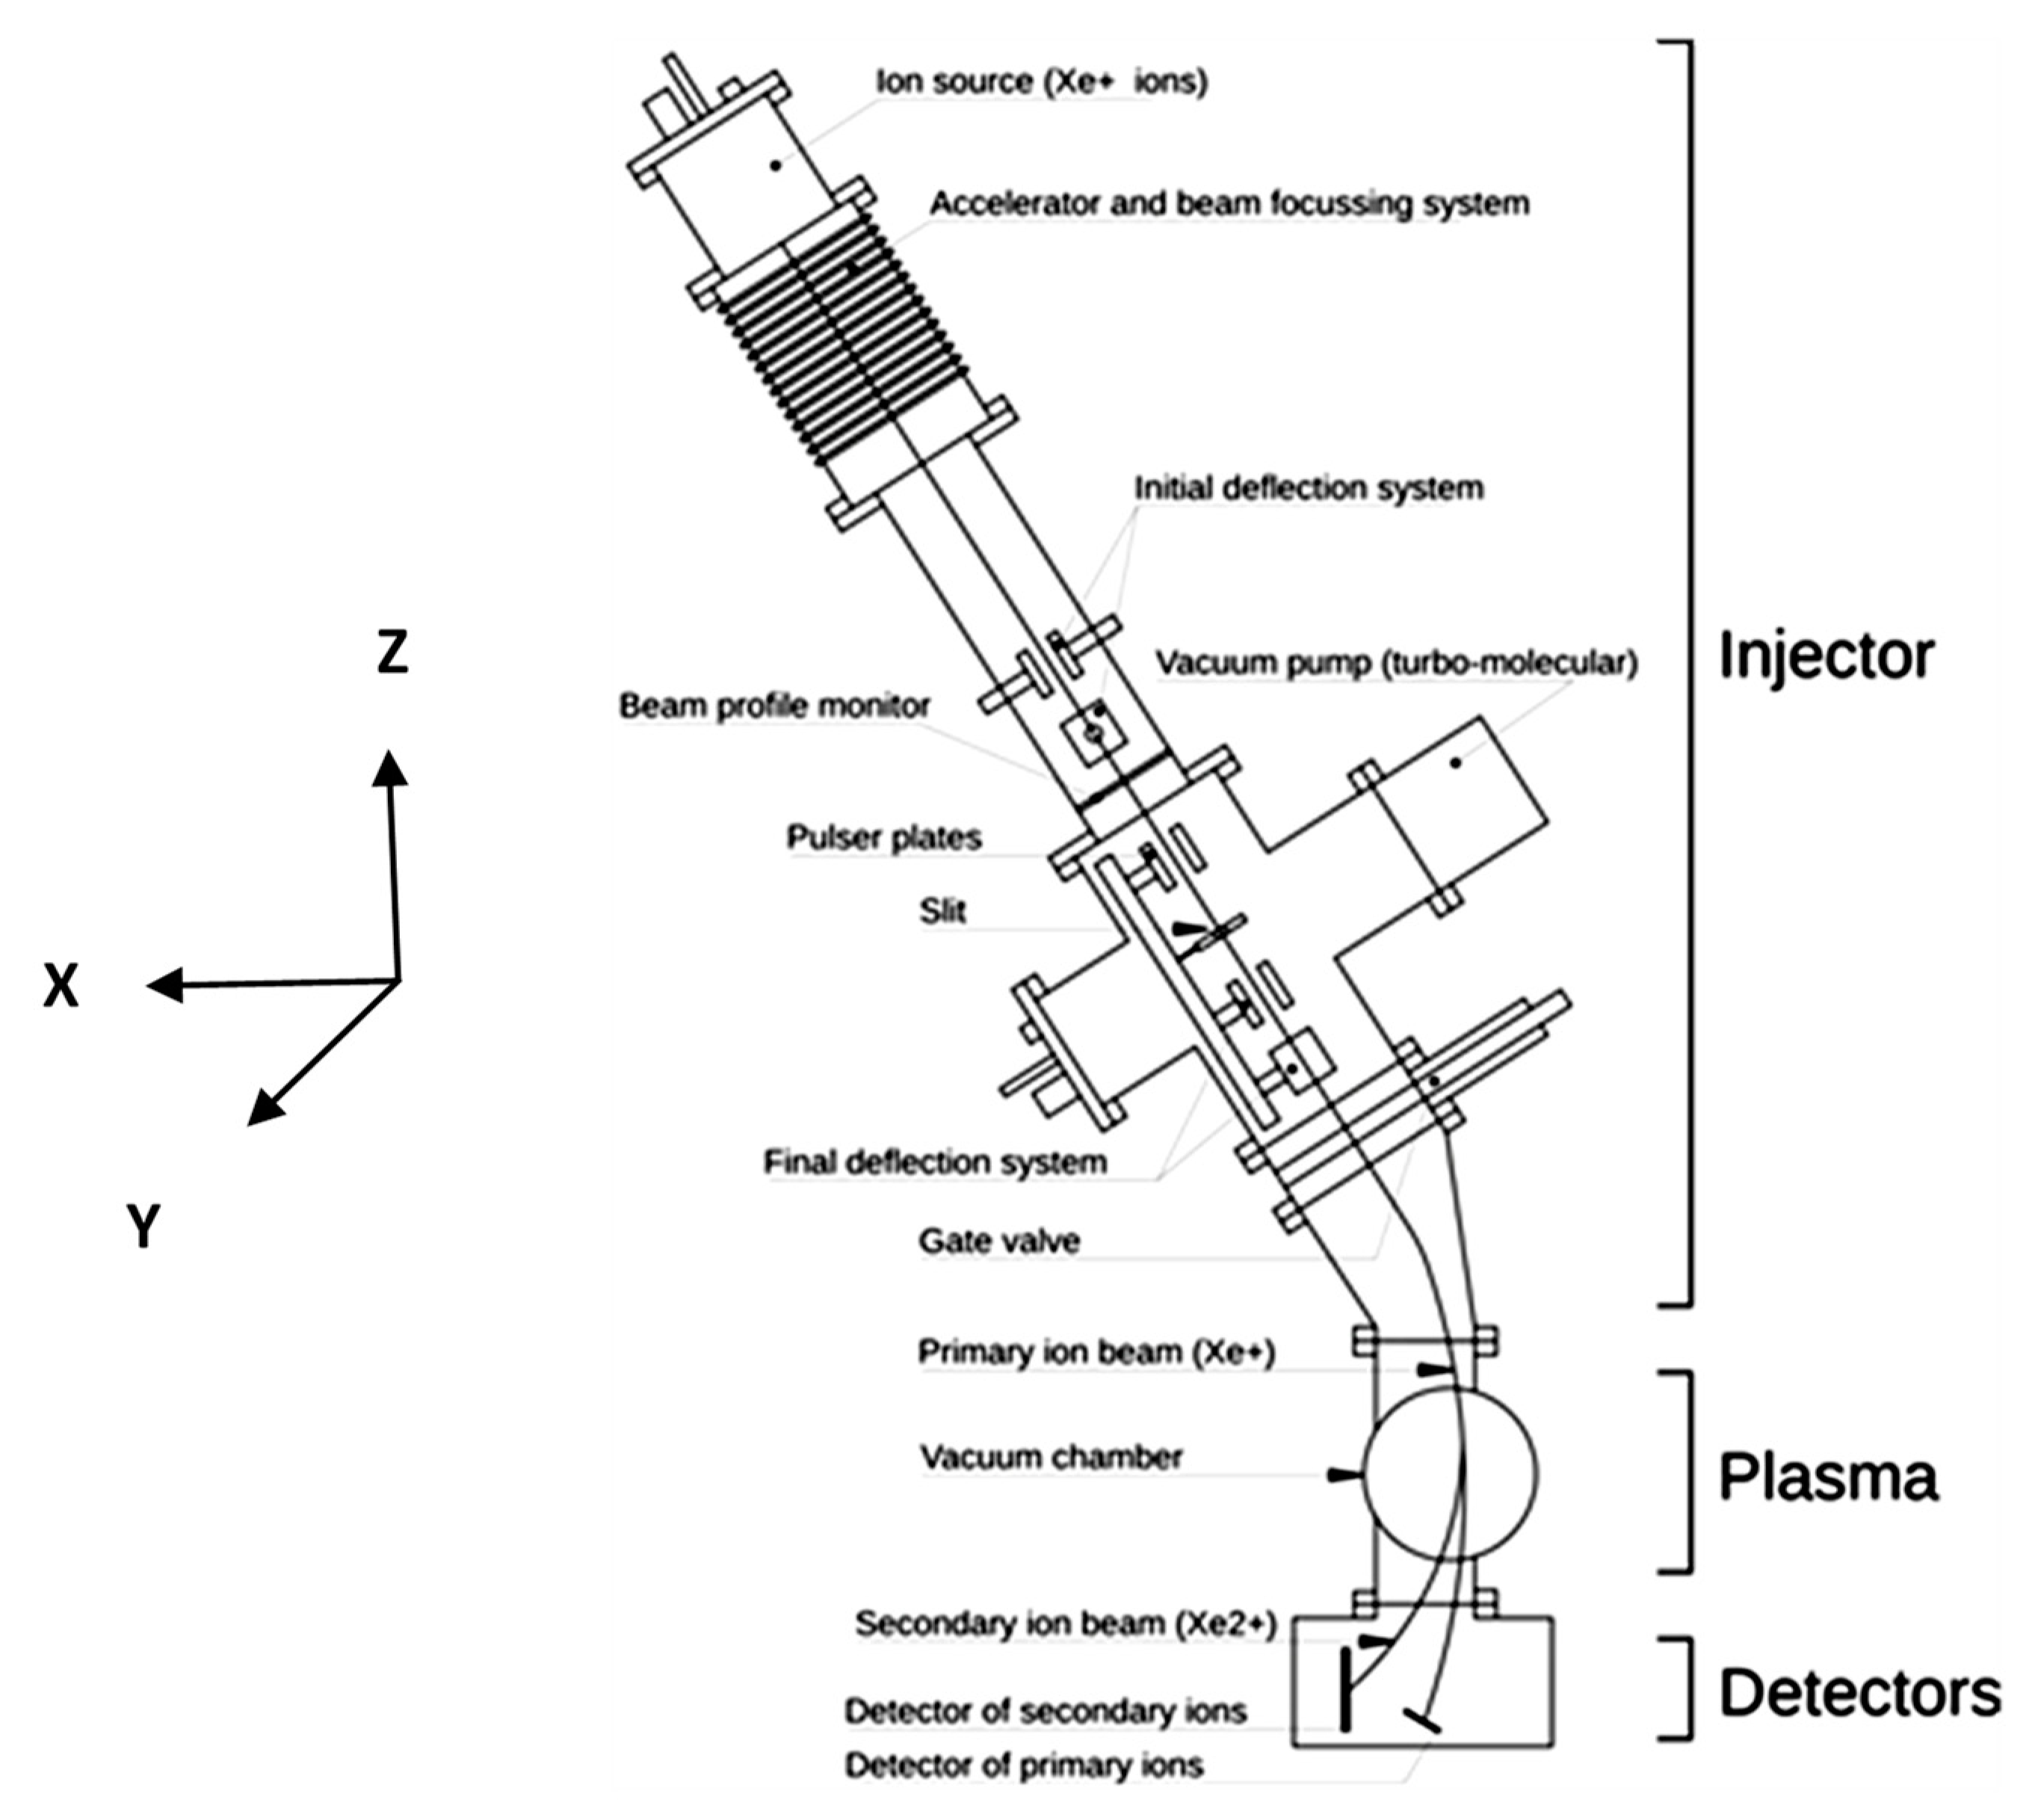
5].
Figure 7 shows the schematic of the 90° CEA arrangement on ISTTOK. Multichannel operation along non-dispersive Z direction is achieved by the orientation of the analyzer energy dispersion XY plane orthogonal to the YZ plane of secondary beam propagation. In that analyzer orientation, the secondary beam displacement due to energy variation is effectively converted to X direction (as shown in the inset in
Figure 7) in
Figure 6, and, in accordance with Equation (5), the SPD
δiX-
h transfer characteristic should be sensitive to the secondary beam profile in the XY plane, violating the assumption of secondary beam uniformity in the analysis of the respective data from SPD.
Consider the secondary beams of the 3D images in
Figure 4 obtained in the above simplified considerations. They are marked in relation to the primary beam profiles as U (uniform), P (parabolic) and B (bell-like).
In accordance with Equation (5) for beam displacement in the X direction and using Equation (1), the respective secondary beam
δiX-
h transfer characteristics shown in
Figure 8 are:
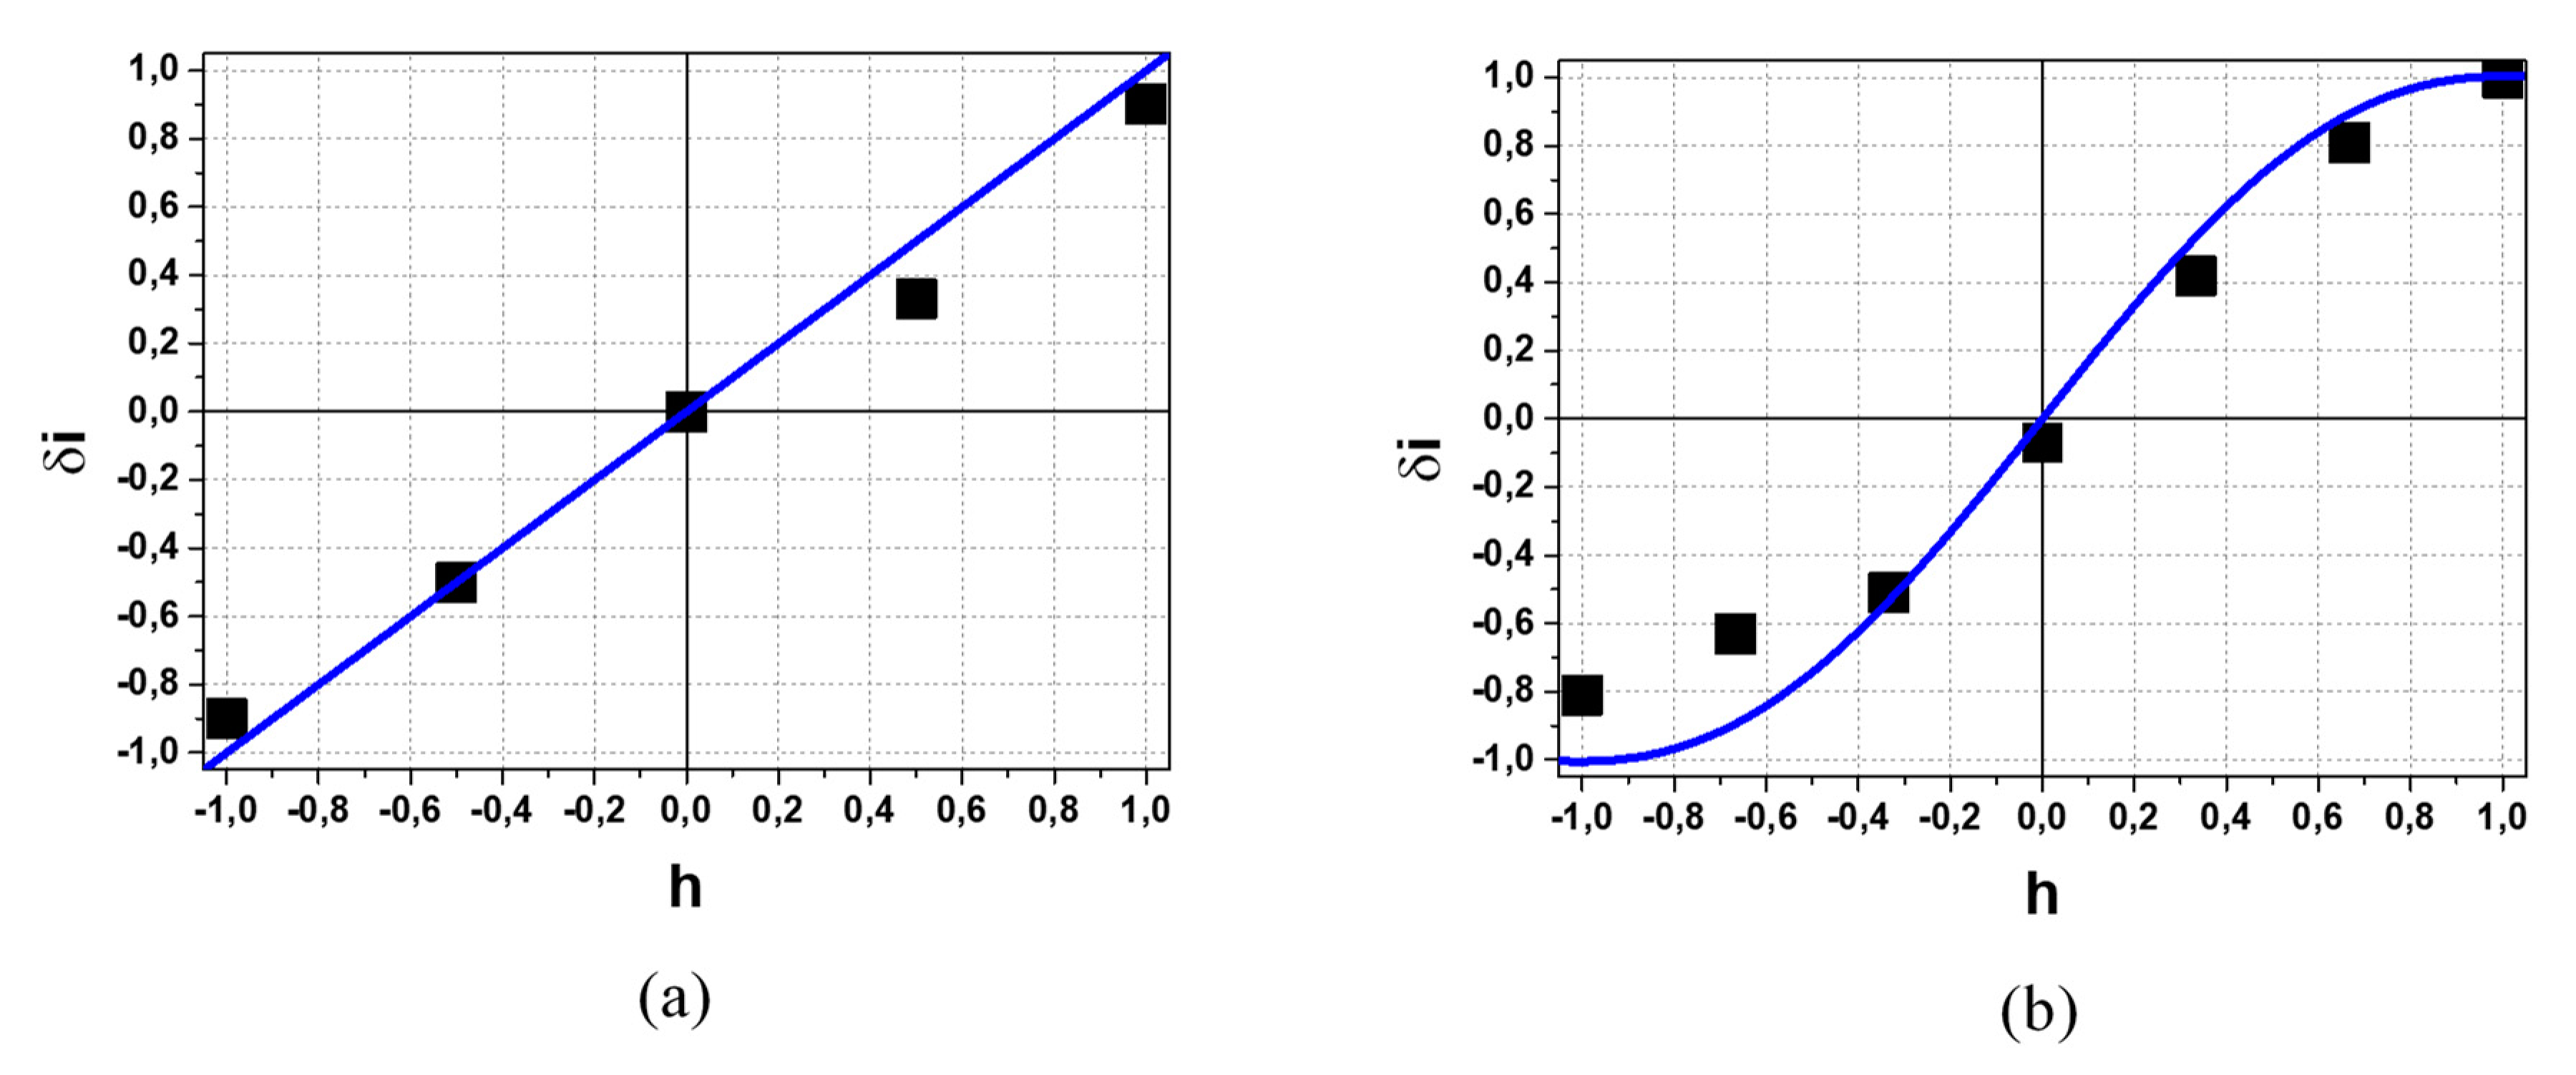
The results in
Figure 8 demonstrate the deviation and non-linearity of the
δiXU-
h.
δiXP-
h and
δiXB-
h transfer characteristics inside the dynamic range in comparison with ideal case of linear
δiI-
h characteristics in
Figure 5. Additionally, the following accompanying features should be pointed: (i) the effective narrowing of the dynamic range and (ii) magnification of the curves slope near
h = 0. The last feature for the initially centered on split-line beam is equivalent to effectively increasing the sensitivity, which gives an advantage in the measurements of plasma potential fluctuations in such conditions.
Finally, it should be noticed here that investigations of the poloidal magnetic field and its fluctuations generated by the plasma current in standard HIBD applications with 30° Proca-Green energy analyzer are realized by the measurements of secondary beam displacement on SPD in a plane orthogonal to the analyzer energy dispersion plane [
6,
7]. These measurements are therefore sensitive to the secondary beam profile.
4. The Influence of the Secondary Beam Non-Uniformity on Plasma Potential and Its Fluctuations Measurements
For better a comparison,
Figure 9 presents the respective differences in
δiU, δiP,
δiB (subscript X is omitted) and
δiI:
δiU,P,B −
δiI (i.e., the result for ideal case of uniform secondary beam in
Figure 5 is subtracted from the results in
Figure 8). The curves plotted in that way represent the deviations induced by beam profile in the measurements of plasma potential as a function of the secondary beam centerline position
h. Note up to 40% deviation on
δiB in the case of the bell-shape beam profile (B), if the center of the secondary beam is positioned at
h0 = 0.4 inside the dynamic range window.
The plasma potential
Φpl in measurements with 90° CEA is obtained from relation [
5]:
where
wb is the beam width,
R0 is the central radios of 90° CEA,
CE is the energy dispersion coefficient and
E0 is the beam energy.
For
wb = 10 mm,
R0 = 105 mm,
CE = 1.56 [
8] and from the data in
Figure 9 for the bell-shape profile of the secondary beam at
h0 = 0.4, the discrepancy in plasma potential value due to the non-linearity of
δi-
h characteristic is Δ(
Φpl/
E0) = 10
−2, or 200 V in absolute value for the ISTTOK HIBD Xe
+ primary beam energy of
E0 = 20 keV.
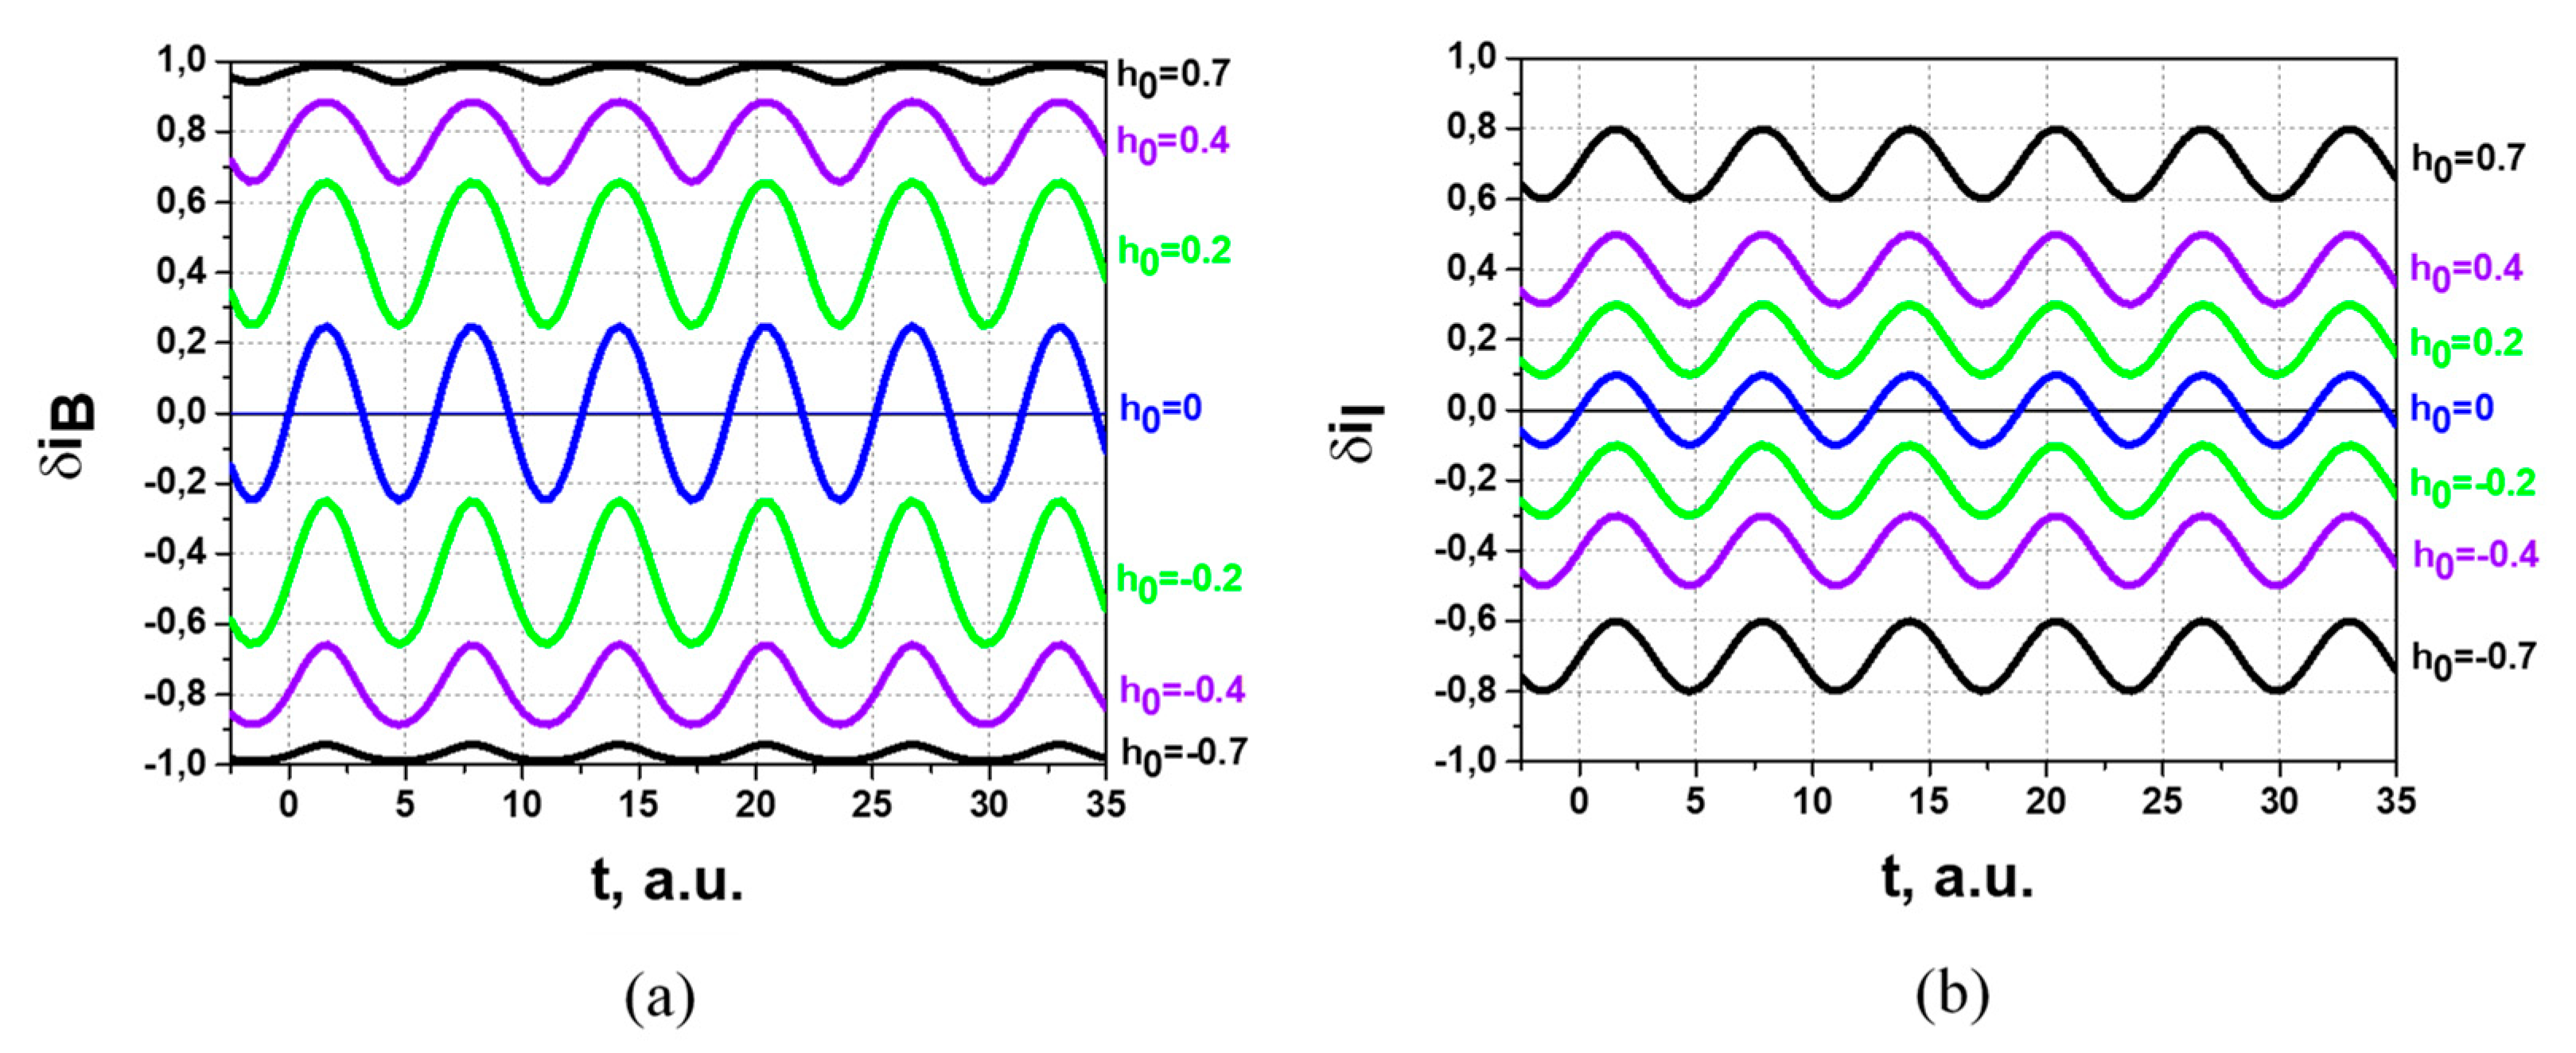
The non-linear response of the SPD on the secondary beam non-uniformity also influences the measurements of plasma potential fluctuations.
Figure 10 shows the
δi response on harmonic variation of the secondary beam position on SPD, given by:
for bell-shape (
δiB,
Figure 10a) and ideal uniform (
δiI,
Figure 10b) beams,
ah = 0.1 and different
h0.
Comparison of the results in
Figure 10a for the bell-shape (
δiB) beam and in
Figure 10b for the ideal (
δiI) uniform beam shows distortions (in amplitude and shape) in harmonic variation in the secondary beam position introduced by the non-linearity of the SPD response for different
h0.
It should be pointed out that in the cross-correlation analysis of the plasma fluctuations realized in simultaneous multichannel measurements, the difference in the background plasma potential in sample volumes determines the different relative positions of the analyzed secondary beams on SPD (different operation points h0 on δi-h characteristic), attributing, therefore, a different response to the plasma potential fluctuations from different sample volumes.
6. Multiple-Cell and Multi-Split-Plate Detection
The above considerations indicate the necessity of the secondary beam profile control. In real experimental conditions, it is also important in standard HIBD applications for plasma potential and its fluctuations measurements due to effects of misaligned and scraped-off secondary beam as a result of mechanical interferences in the secondary beamline and analyzer entrance slits, aggravated by non-uniform components of the magnetic field along the beam propagation path [
13,
14]. The measurements of the secondary beam profile on SPD in one plasma shot are not trivial and to solve the issue, the implementation of MCAD with dedicated resolution may be suggested.
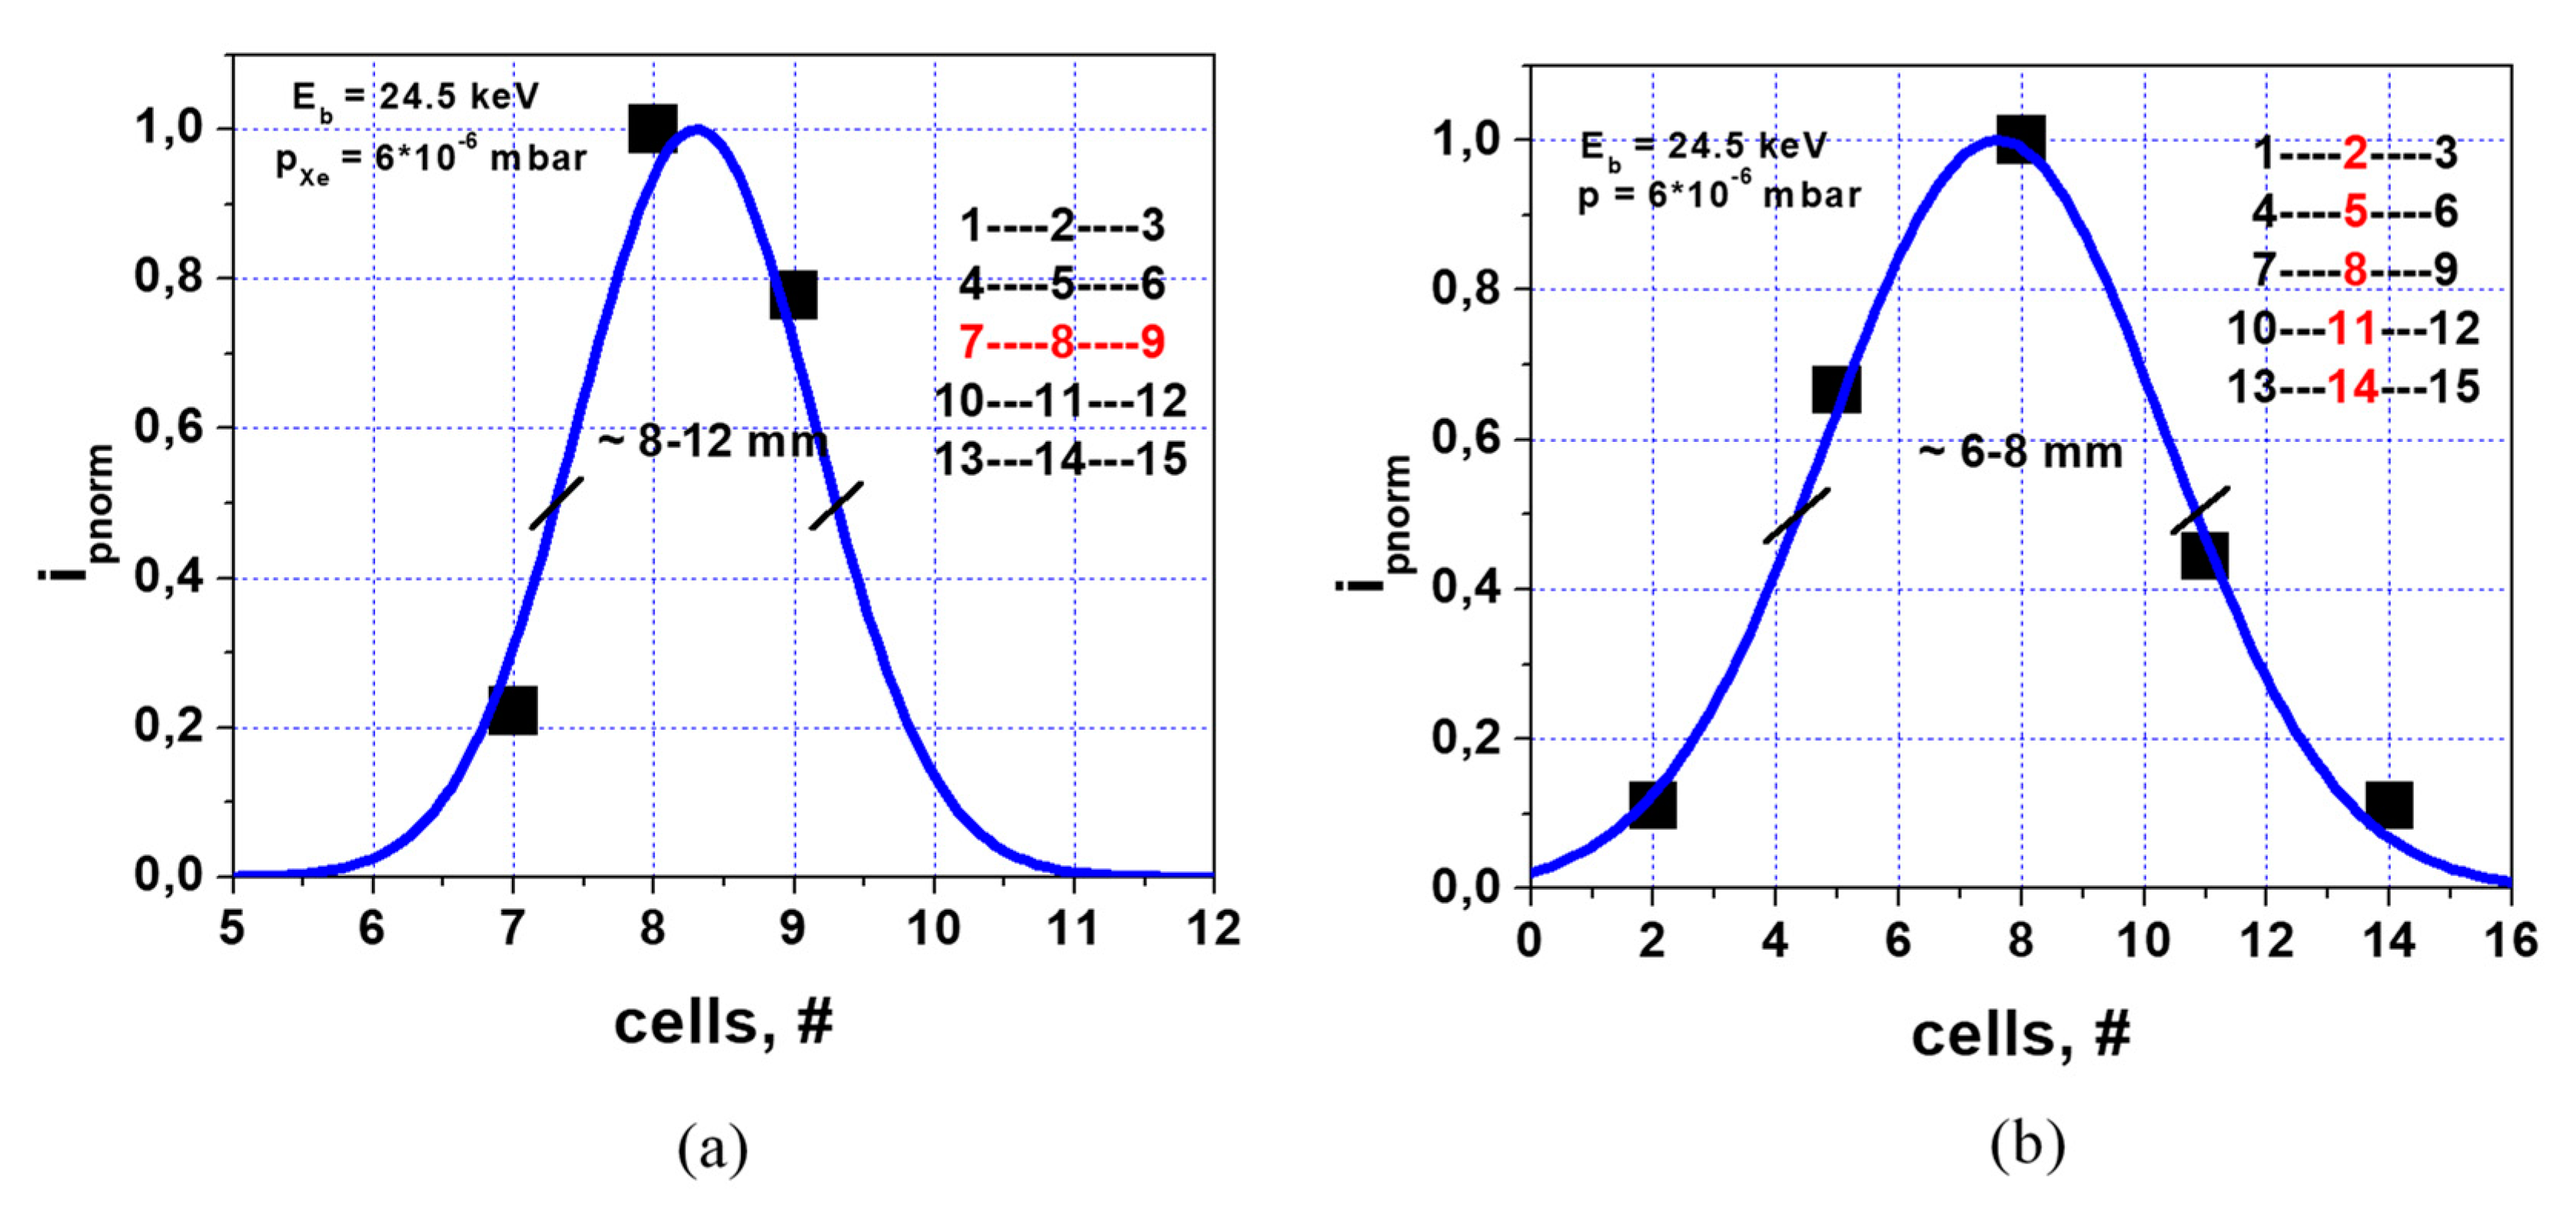
Figure 16 shows a number of MCAD cells of width
lcell distributed over the SPD dynamic range window. With that MCAD there is a possibility to determine the secondary beam profile in the energy dispersion plane in one plasma shot with a spatial resolution of the cell width. Additionally, there is a possibility to measure directly the
δi-
h characteristic by successive subtraction of the acquired signals from the cells, given by:
Such measurements are equivalent to effective scanning of δi-h characteristic, while MCAD operating in that mode may be considered as a multi-split-plate detector (MSPD).
The number and minimal width of the cells of MCAD in
Figure 16 can be estimated from the analyzer dynamic range, (Δ
E/
E0)
DR, and the minimum detectable change of ion beam energy, (Δ
E/
E0)
min, determined by the signal-to-noise ratio (SNR) of the beam current measured on the cell. As an example, for the 90° CEA, the (Δ
E/
E0)
DR and (Δ
E/
E0)
min in terms of
δi are [
5]:
Estimation of cell number (and therefore the number of reliable points
Nest, or resolution of the
δi-
h characteristic measurements) is given by the ratio of (Δ
E/
E0)
DR/(Δ
E/
E0)
min, being from Equations (10) and (11)
Nest = 2(SNR). Then, estimation for the corresponding cell width is
lcell =
wb/
Nest, and, particularly for SNR = 10 and
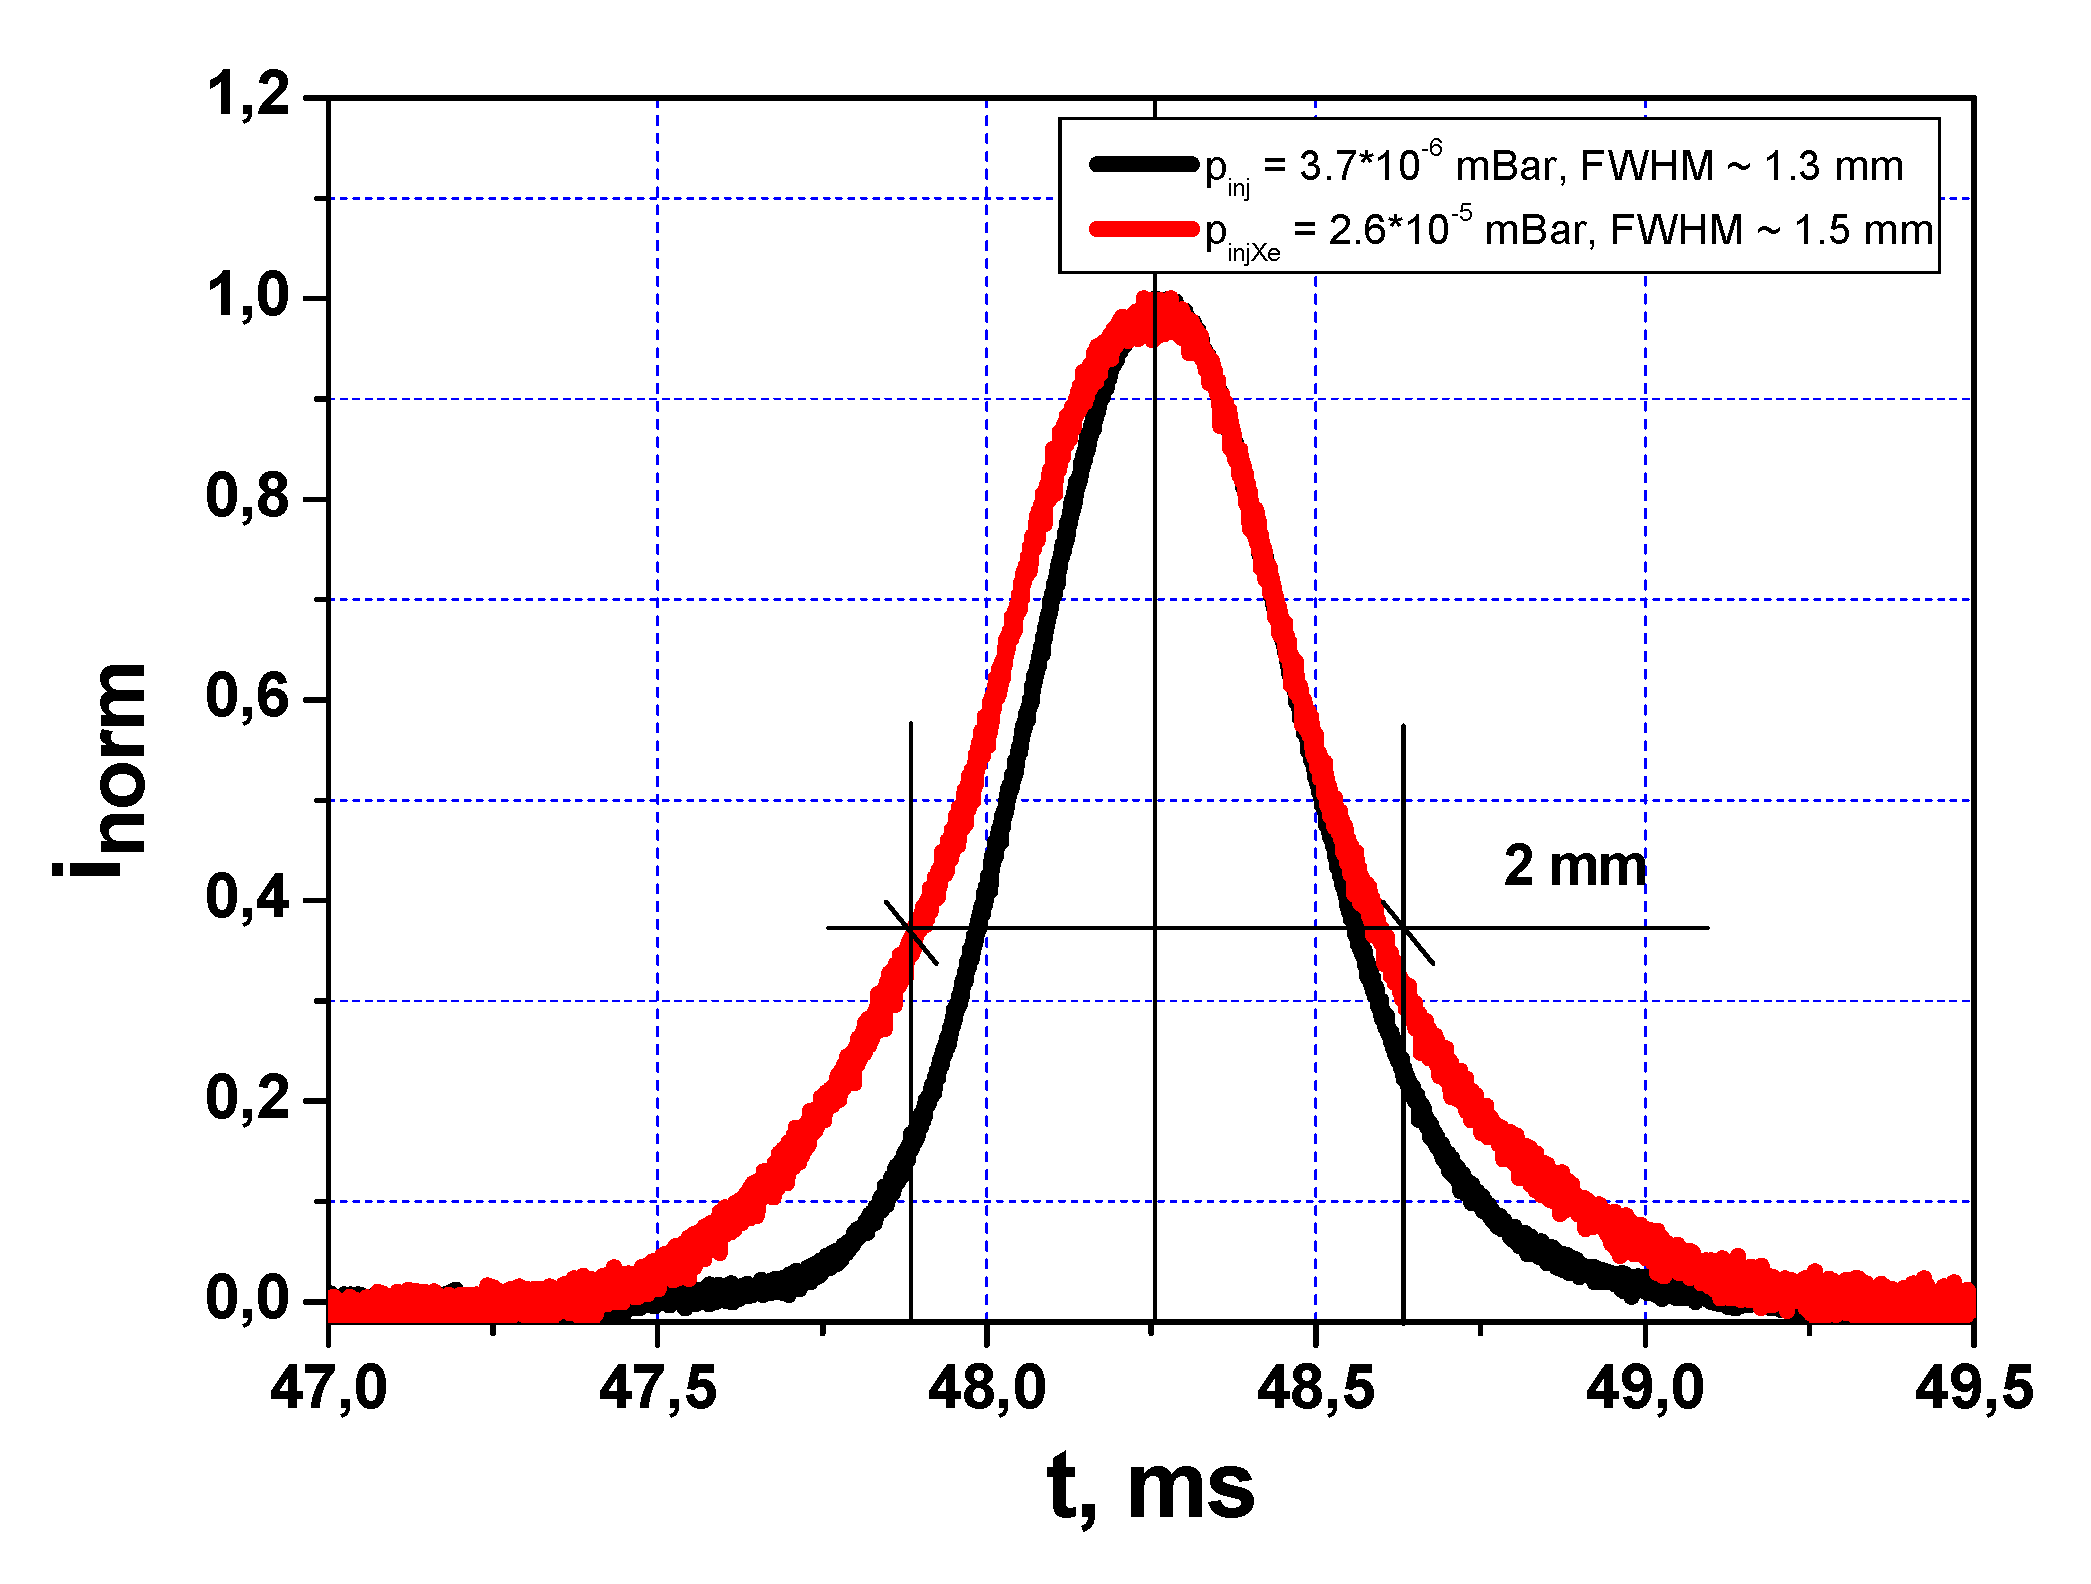
wb = 10 mm (for 90° CEA operated in 2-times deceleration mode [
12]); this results in the minimal cell width of
lcell = 0.5 mm.
7. Summary
The coupling of the primary and secondary beam profiles inside the sample volume is examined in the simplistic model of circular primary beam and secondary ions that emerge orthogonal to the primary beam axis. These considerations demonstrate that even for the uniform primary beam, the secondary beam can attain non-uniformity determined by the shape of the primary beam with additional modifications, if the primary beam is non-uniform. In the frame of that simplistic model, the δi-h transfer characteristics of the non-uniform secondary beam are orthotropic in directions of beam displacement depending on the orientation of the analyzer energy dispersion plane. In the case of energy dispersion and beam propagation planes coincidence, the linearity of δi-h characteristic is persisted for any secondary beam profile in a plane orthogonal to the plane of beam propagation. It is correct for practically all traditional HIBDs operated with angle-scanned primary beam and the mirror-type 30° Proca-Green electrostatic energy analyzer. In the case of energy dispersion and the beam propagation planes orthogonality, the SPD δi-h transfer characteristic is non-linear, determined by the respective secondary beam profile. This situation takes place for ISTTOK HIBD operated with fixed injection angle primary beam and 90° CEA. The non-linearity of δi-h transfer characteristic was observed experimentally for 90° CEA operated in 2-times deceleration mode. In that case, the assumption of secondary beam uniformity in the analysis of the respective data from SPD is violated and requires knowledge of the secondary beam profile. The corresponding measurements can be realized with MCAD of dedicated resolution. In addition, for that MCAD operated in multiple-split-plate configuration, the direct measurements of δi-h transfer characteristic are available. Additionally, for the non-uniform profiles of the secondary beam, the MCAD data can be used as a supplement for plasma potential measurements by evaluation the shift in center of mass of the secondary beam current distribution.
Finally, it should be noted that knowledge of the secondary beam profile and its influence on the measurements is also important in traditional HIBD applications in investigations of the poloidal magnetic field and its fluctuations generated by plasma current, and if the secondary beam misalignment and scrape-off are suspected.


