
Continuous Monitoring of Vital Signs Using Cameras: A Systematic Review

 ,
,  ,
,  ,
,  ,
, 
Abstract
:1. Introduction
- Which vital sign is monitored using what type of camera?
- What is the performance and which factors affect it?
- Which health issues are addressed by camera-based techniques?
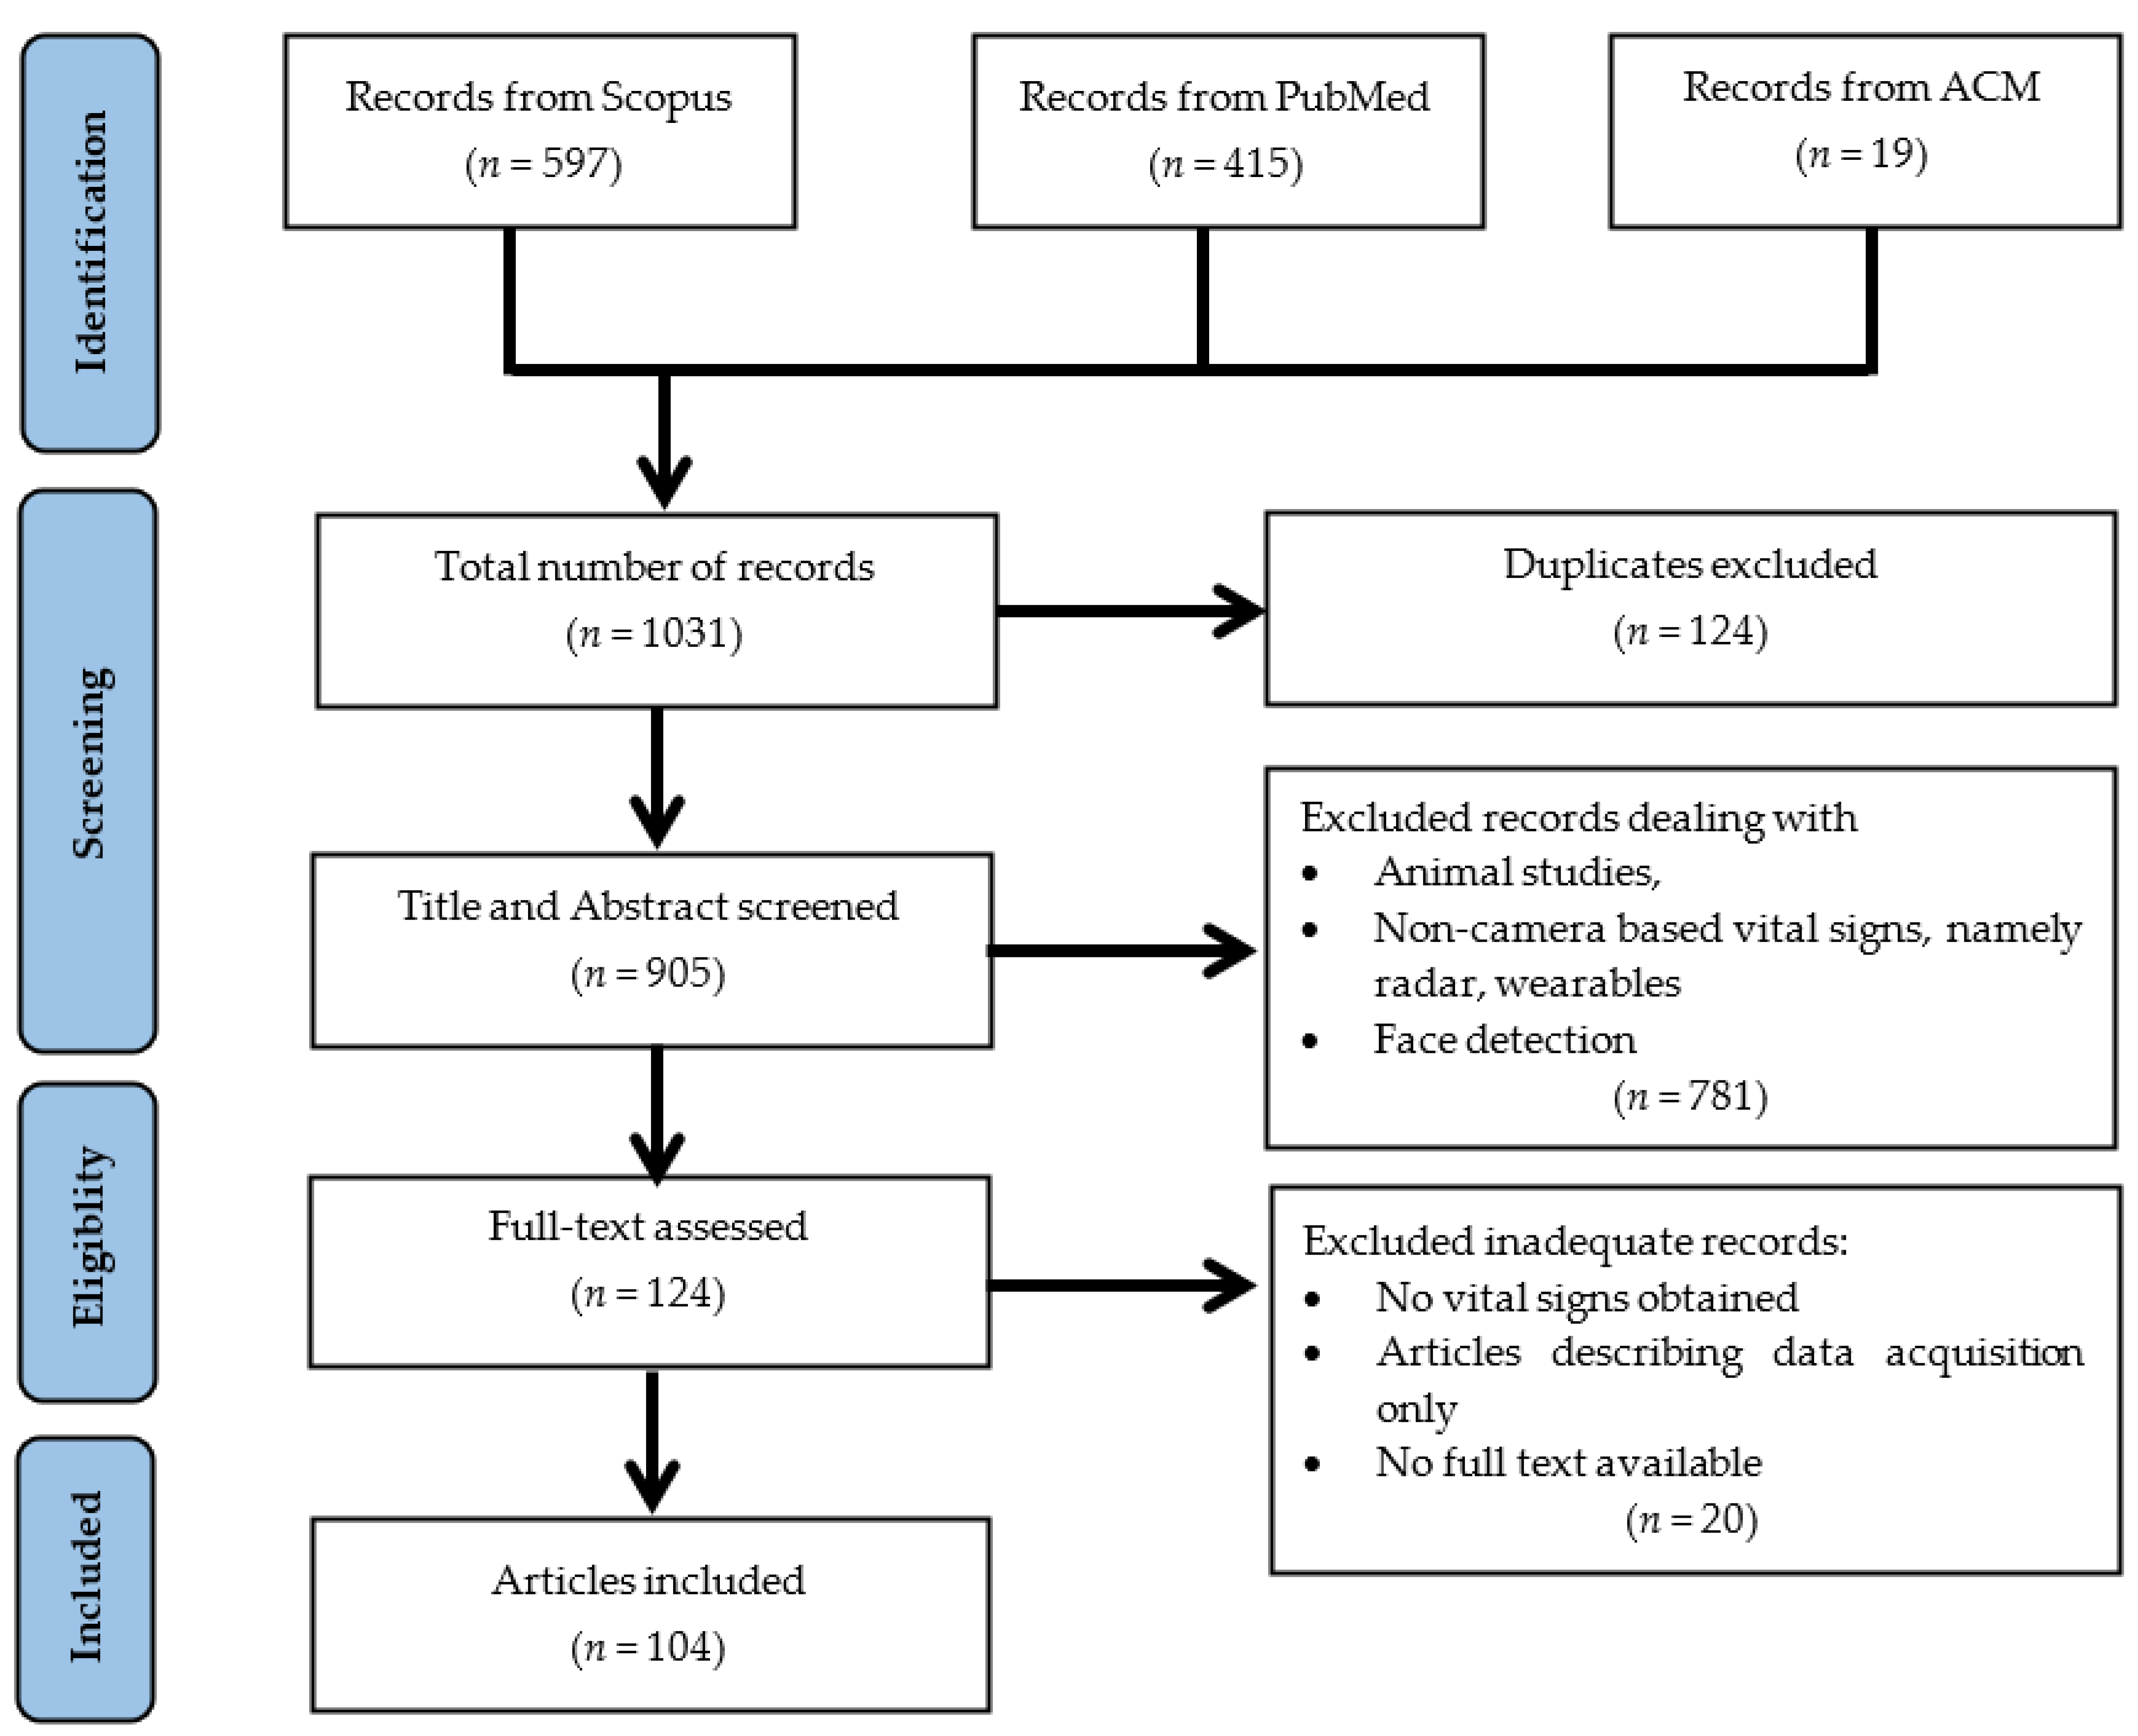
2. Methods
2.1. Selecting Databases
2.2. Composing the Search Query
- Sensor technology: camera, video, image, RGB, infrared, thermal, thermography;
- Sensor setting: remote, noncontact, contactless, contact-free, touchless, vision-based;
- Biosignal: biosignal, biomedical signal, physiological signal, cardiorespiratory signal, heart rate, heartbeat, pulse rate, respiratory rate, breathing rate, blood pressure, body temperature, oxygen saturation; and the
- Modality: photoplethysmogra* (to include photoplethysmogram, photoplethysmograph, and photoplethysmography).
2.3. Inclusion and Exclusion Criteria
- Inclusion criteria
- a.
- English language
- b.
- Human research
- c.
- Journal, Conference
- Exclusion criteria
- a.
- Review, systematic review, survey
3. Results
- Optical image (RGB, NIR, or FIR)
- Extraction of vital sign (HR, RR, BP, BST, or SpO2)
- Comparison to ground truth
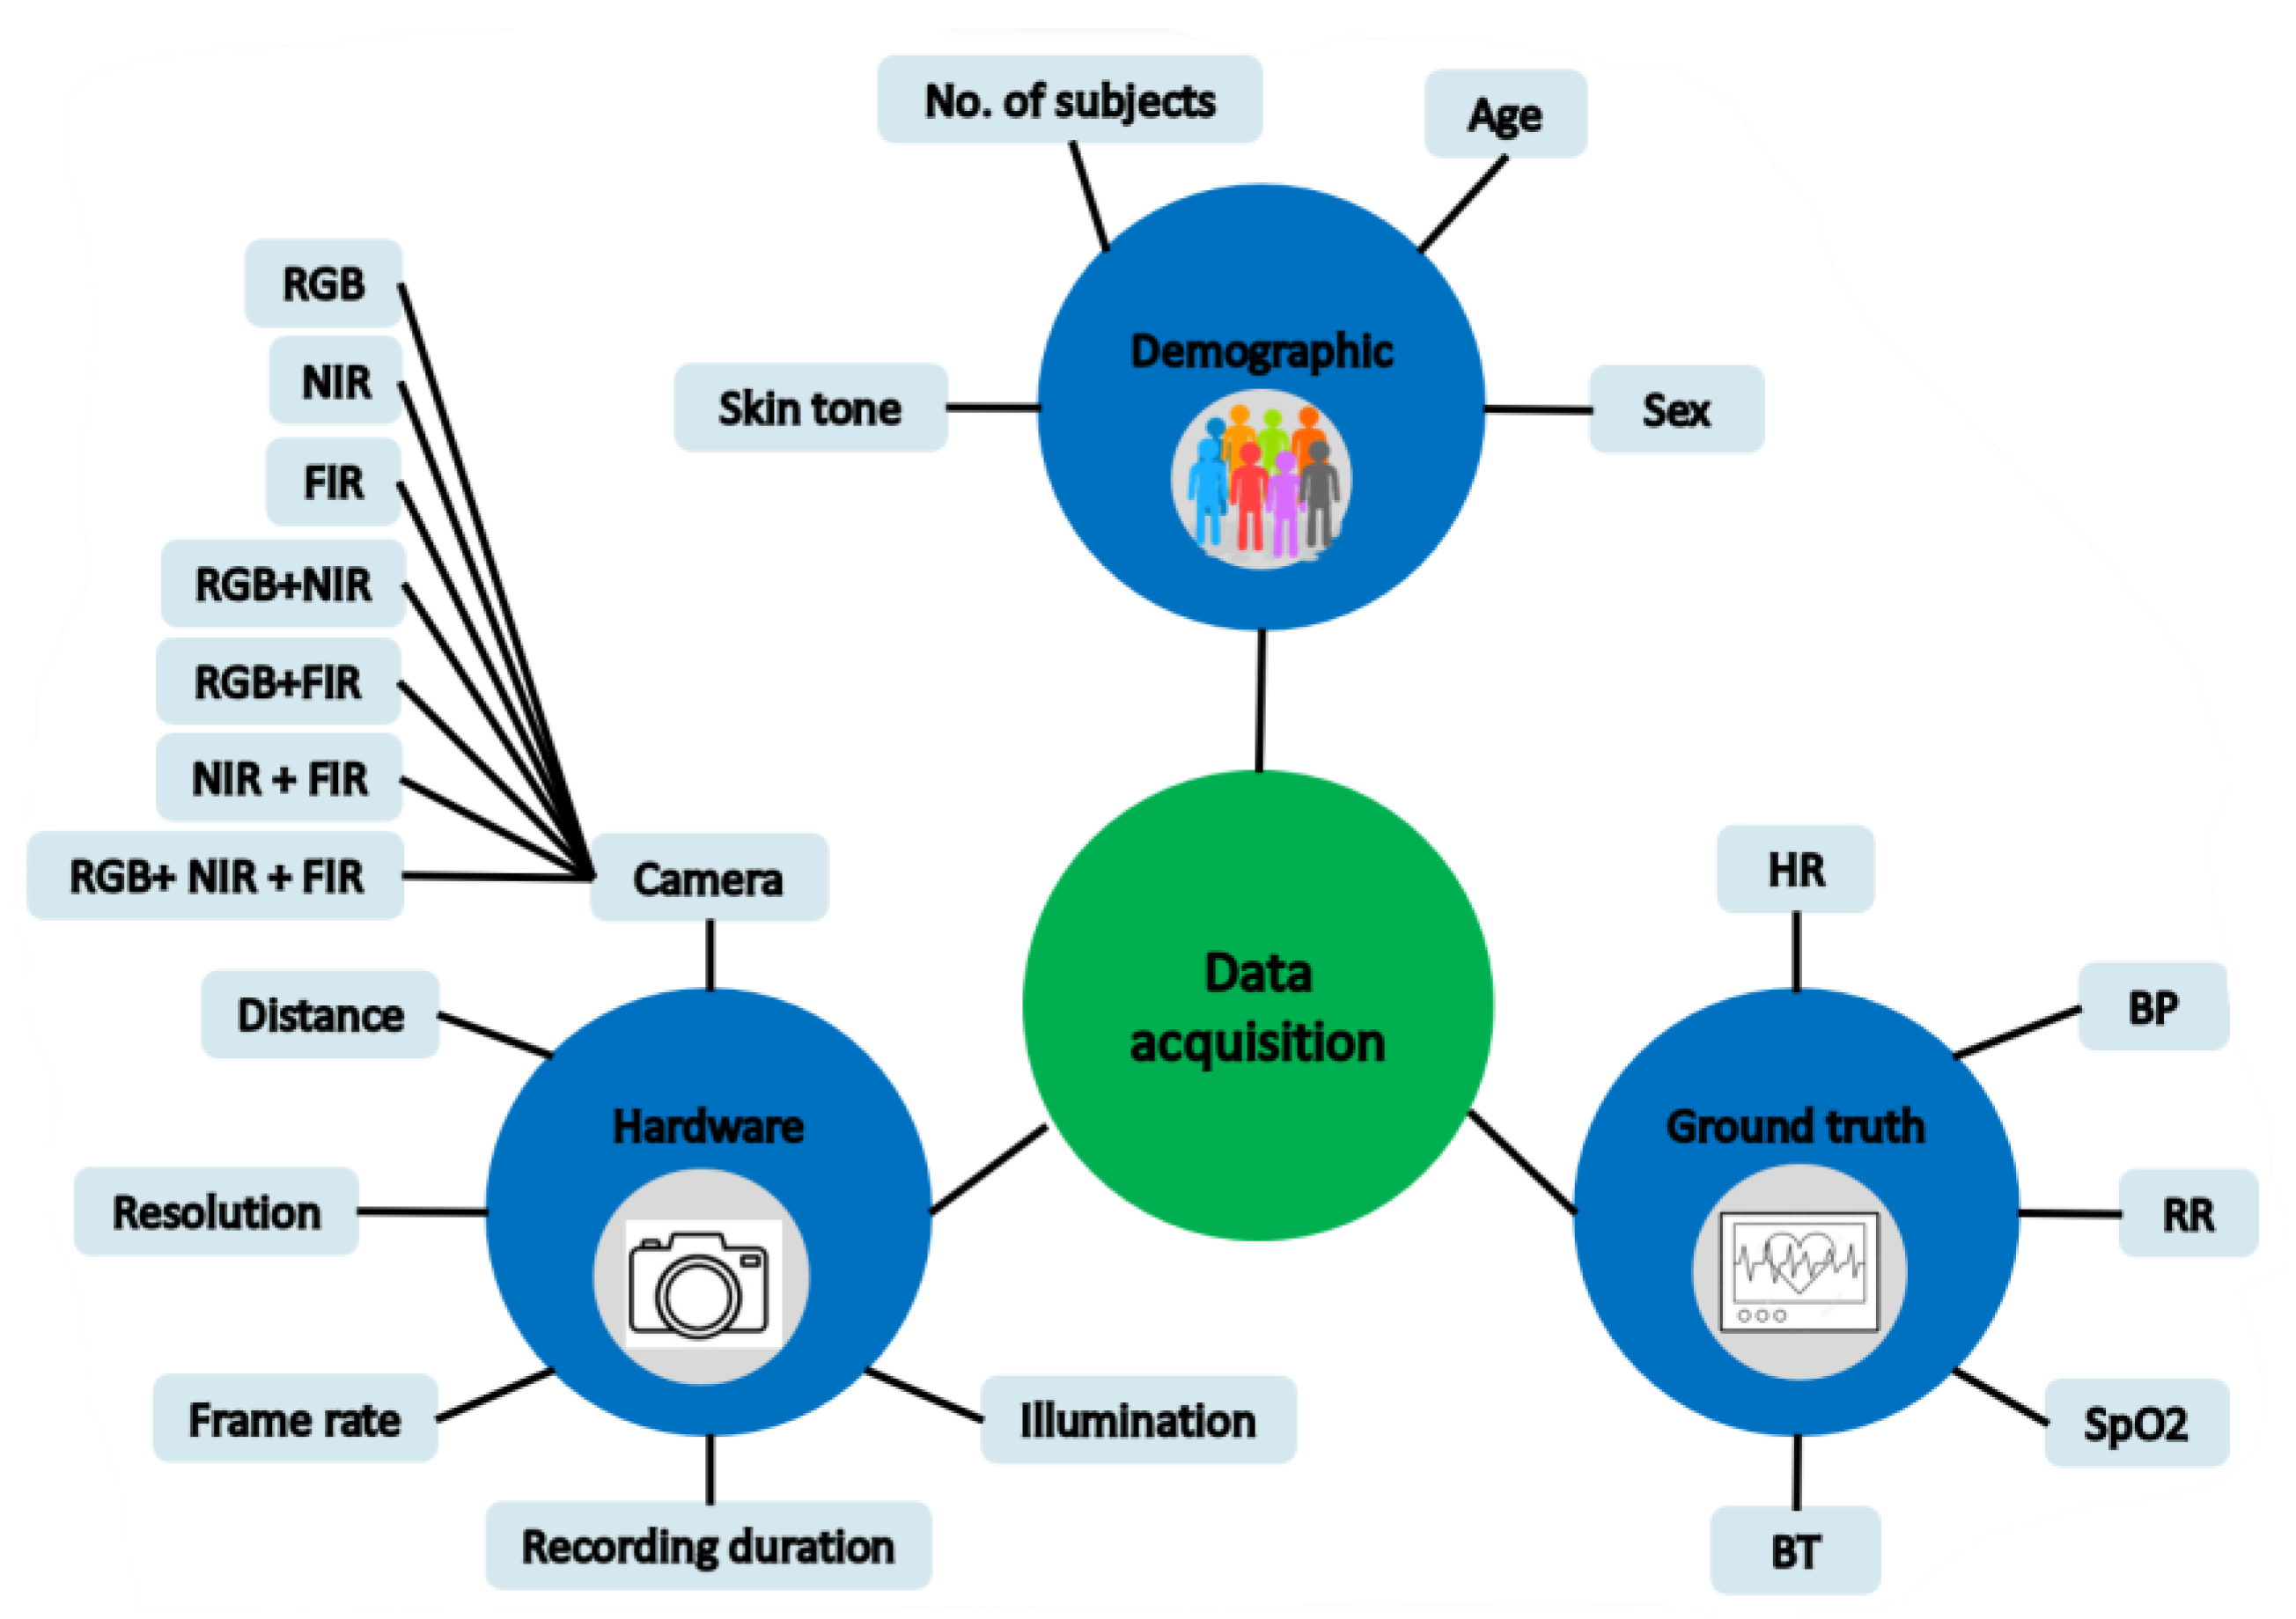
3.1. Data Acquisition
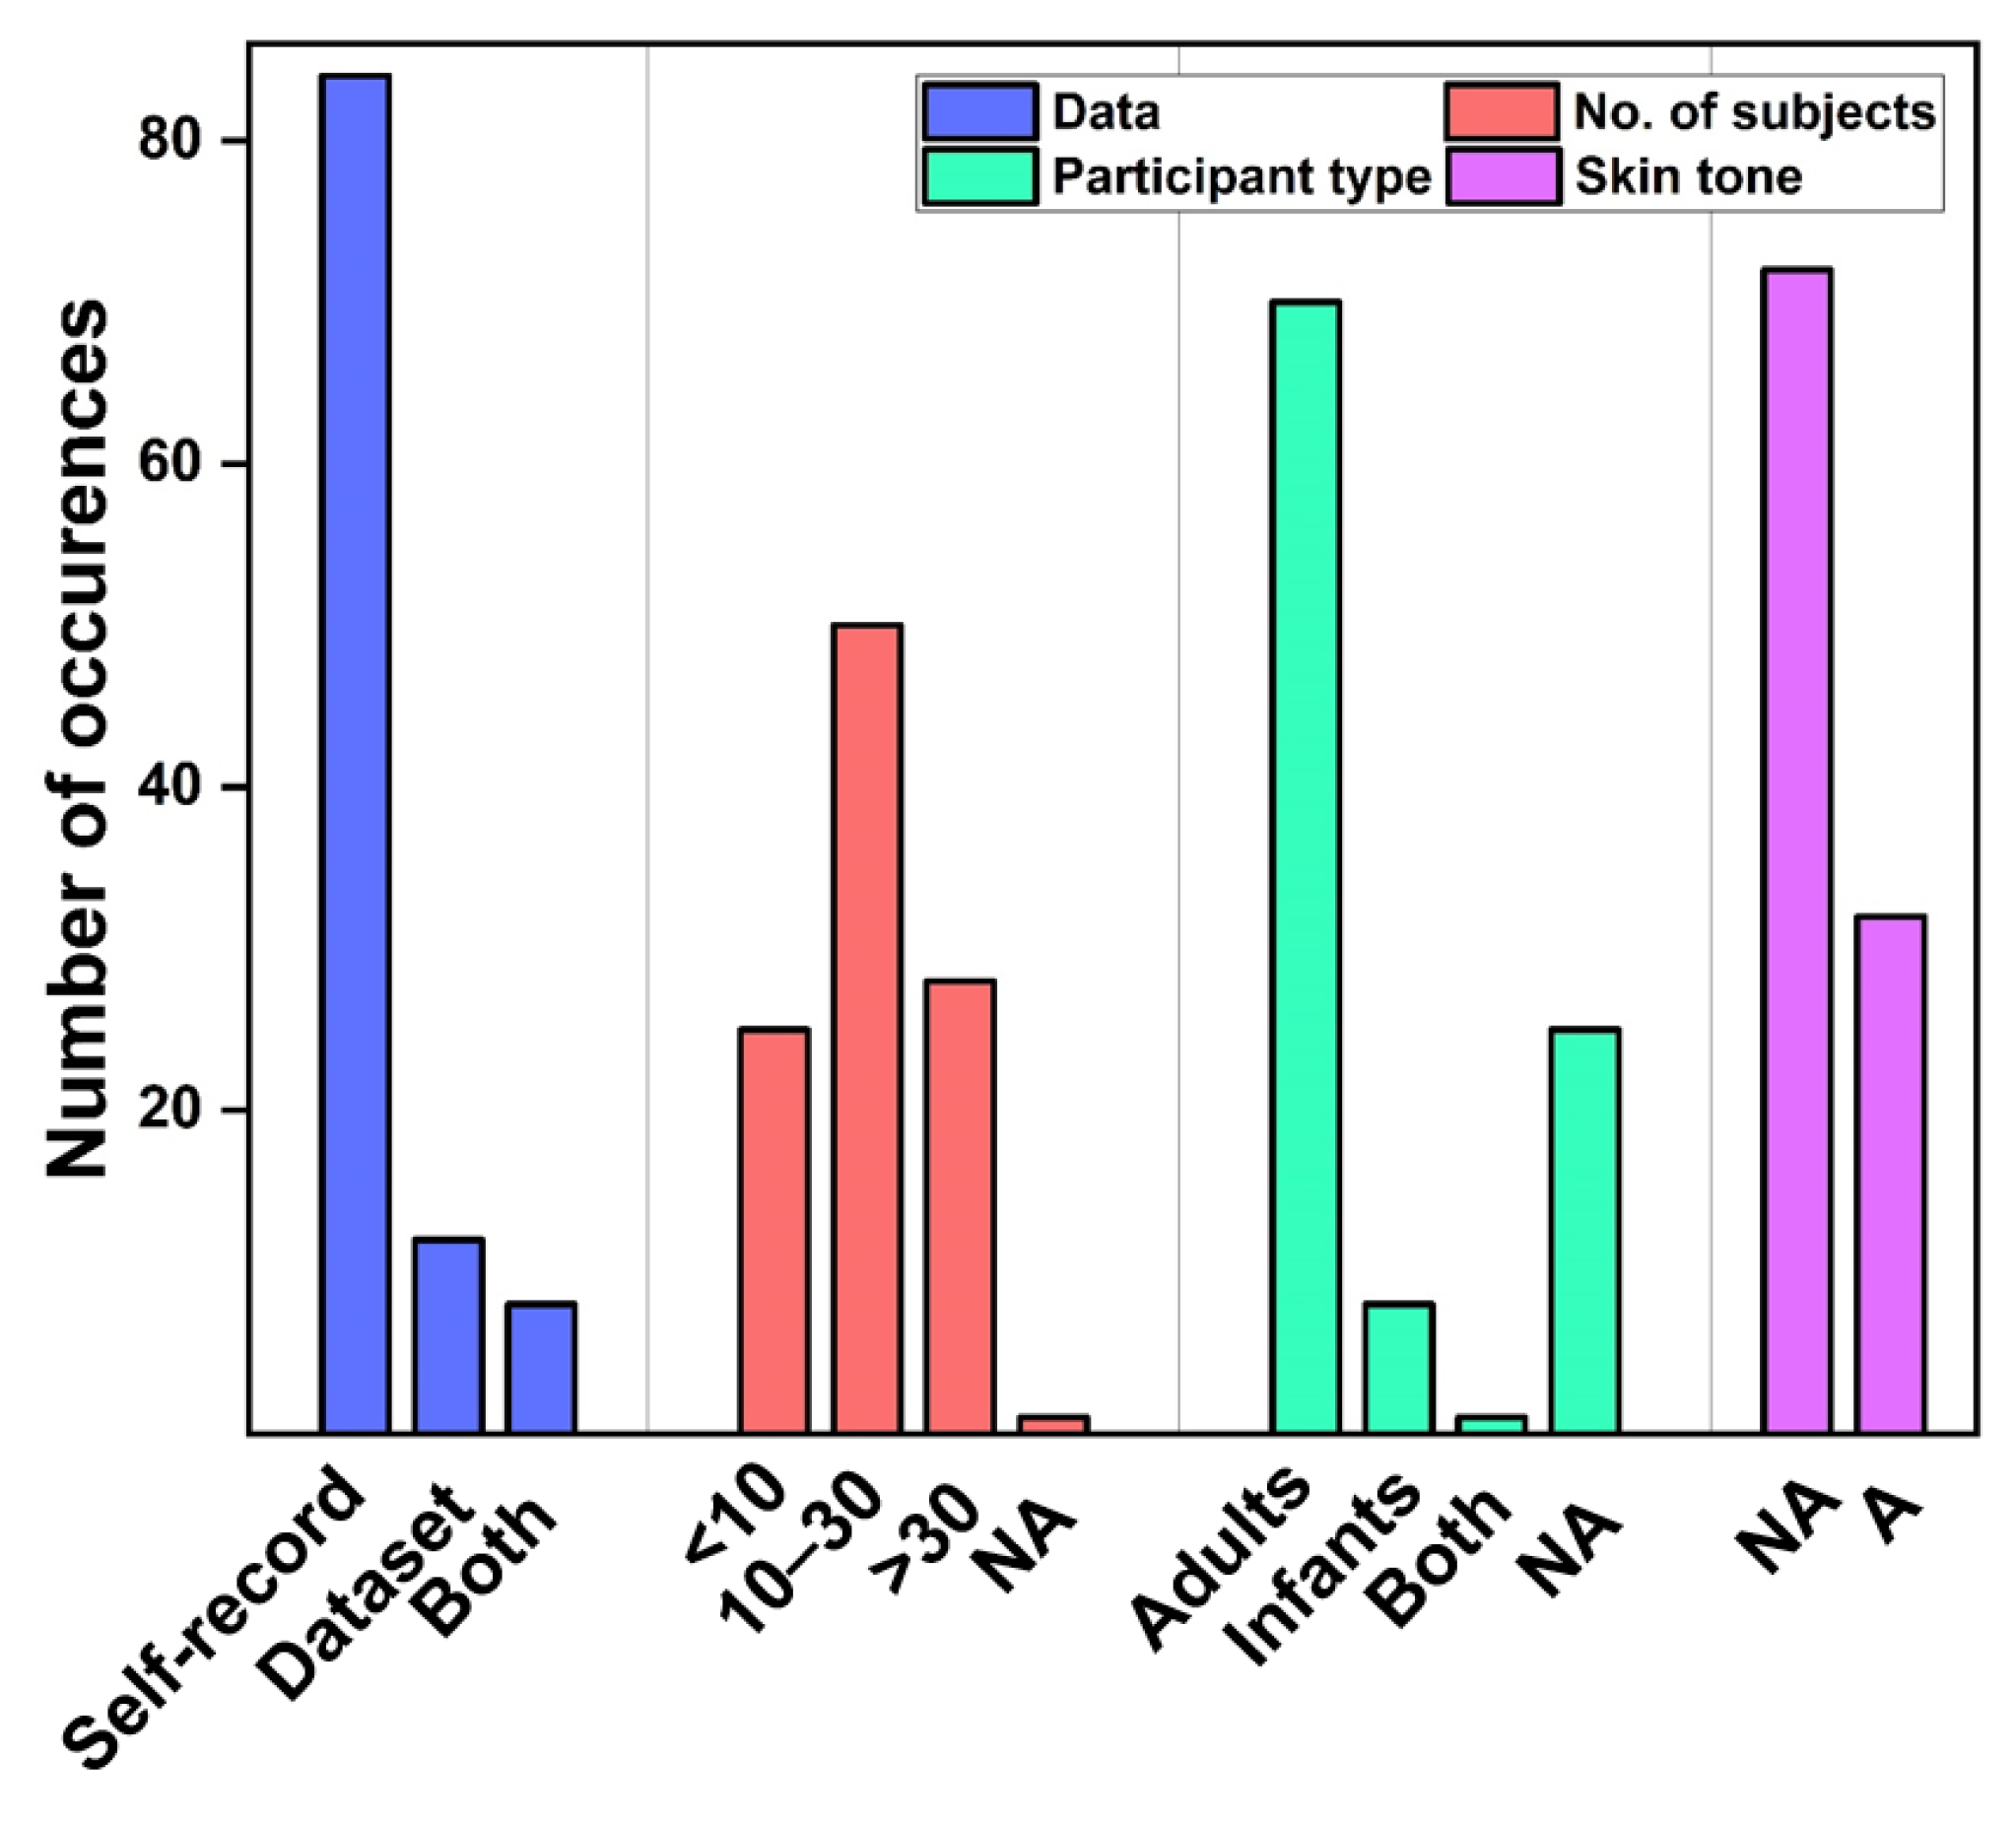
3.1.1. Study Design
3.1.2. Hardware Setup
3.1.3. Ground Truth
3.2. Existing Datasets
3.3. Image Processing
3.3.1. ROI Detection
3.3.2. ROI Tracking

| Algorithms | Description | Advantage | Disadvantage |
|---|---|---|---|
| Viola–Jones [18,75,81,83,87,93,106,115,129,153] | It utilizes Haar-like features and Adaboost algorithm to construct a cascade classifier. | It works well on full, frontal, and well-lit facts. | It suffers from faces in a crowd, face rotation, inclined or angled faces, expression variations, and low image resolution. |
| Histogram of oriented Gradients [86,151,160] | It constructs the feature by calculating the gradient direction histogram on the local area of the image. | Fast running speed and identifies 68 facial landmark points. | It may be influenced by light intensity and detection and inaccurate location of feature points on profile. |
| Multitask cascaded convolutional neural network [154] | It is a convolutional-neural-network (CNN)-based framework, which consists of three stages for joint face detection and alignment. | Accurate face detection, less affected by light intensity and direction. | It may provide sophisticated models and calculation, which may result in a slow running speed; only five feature points can be tracked. |
| Single shot multibox detector [78] | It is a fast convolutional neural network to detect faces using a single neural network. | Fast processing speed and multiscale feature map is adopted. | The robustness of the network to small object detection may not too high. |
| You look only once [100,161] | It is one stage detector based on object detection. | Fastest object detection algorithm. It utilizes full image as context information which is possible to achieve real-time requirements. | It requires a graphics-processing-based computational machine. It may be relatively sensitive to the scale of the object. |
| Template matching [51,61,106] | It matches the image by providing a base template which to compare. | Relatively easier to implement and use. | Not suitable for complex templates, no face in the frame, or occlusion of face. |
3.3.3. Image Enhancement
3.3.4. Color Channel Decomposition
3.3.5. Raw Signal Extraction
3.4. Signal Processing
3.4.1. Preprocessing
3.4.2. Vital Sign Extraction
Heart Rate
Respiratory Rate
Blood Pressure
Body Skin Temperature
Oxygen Saturation
3.5. Data Fusion
3.6. Vital Sign Estimation
3.7. Performance Assessment
3.7.1. Performance Metrics
Heart Rate
Respiratory Rate
Blood Pressure
Body Skin Temperature
Oxygen Saturation
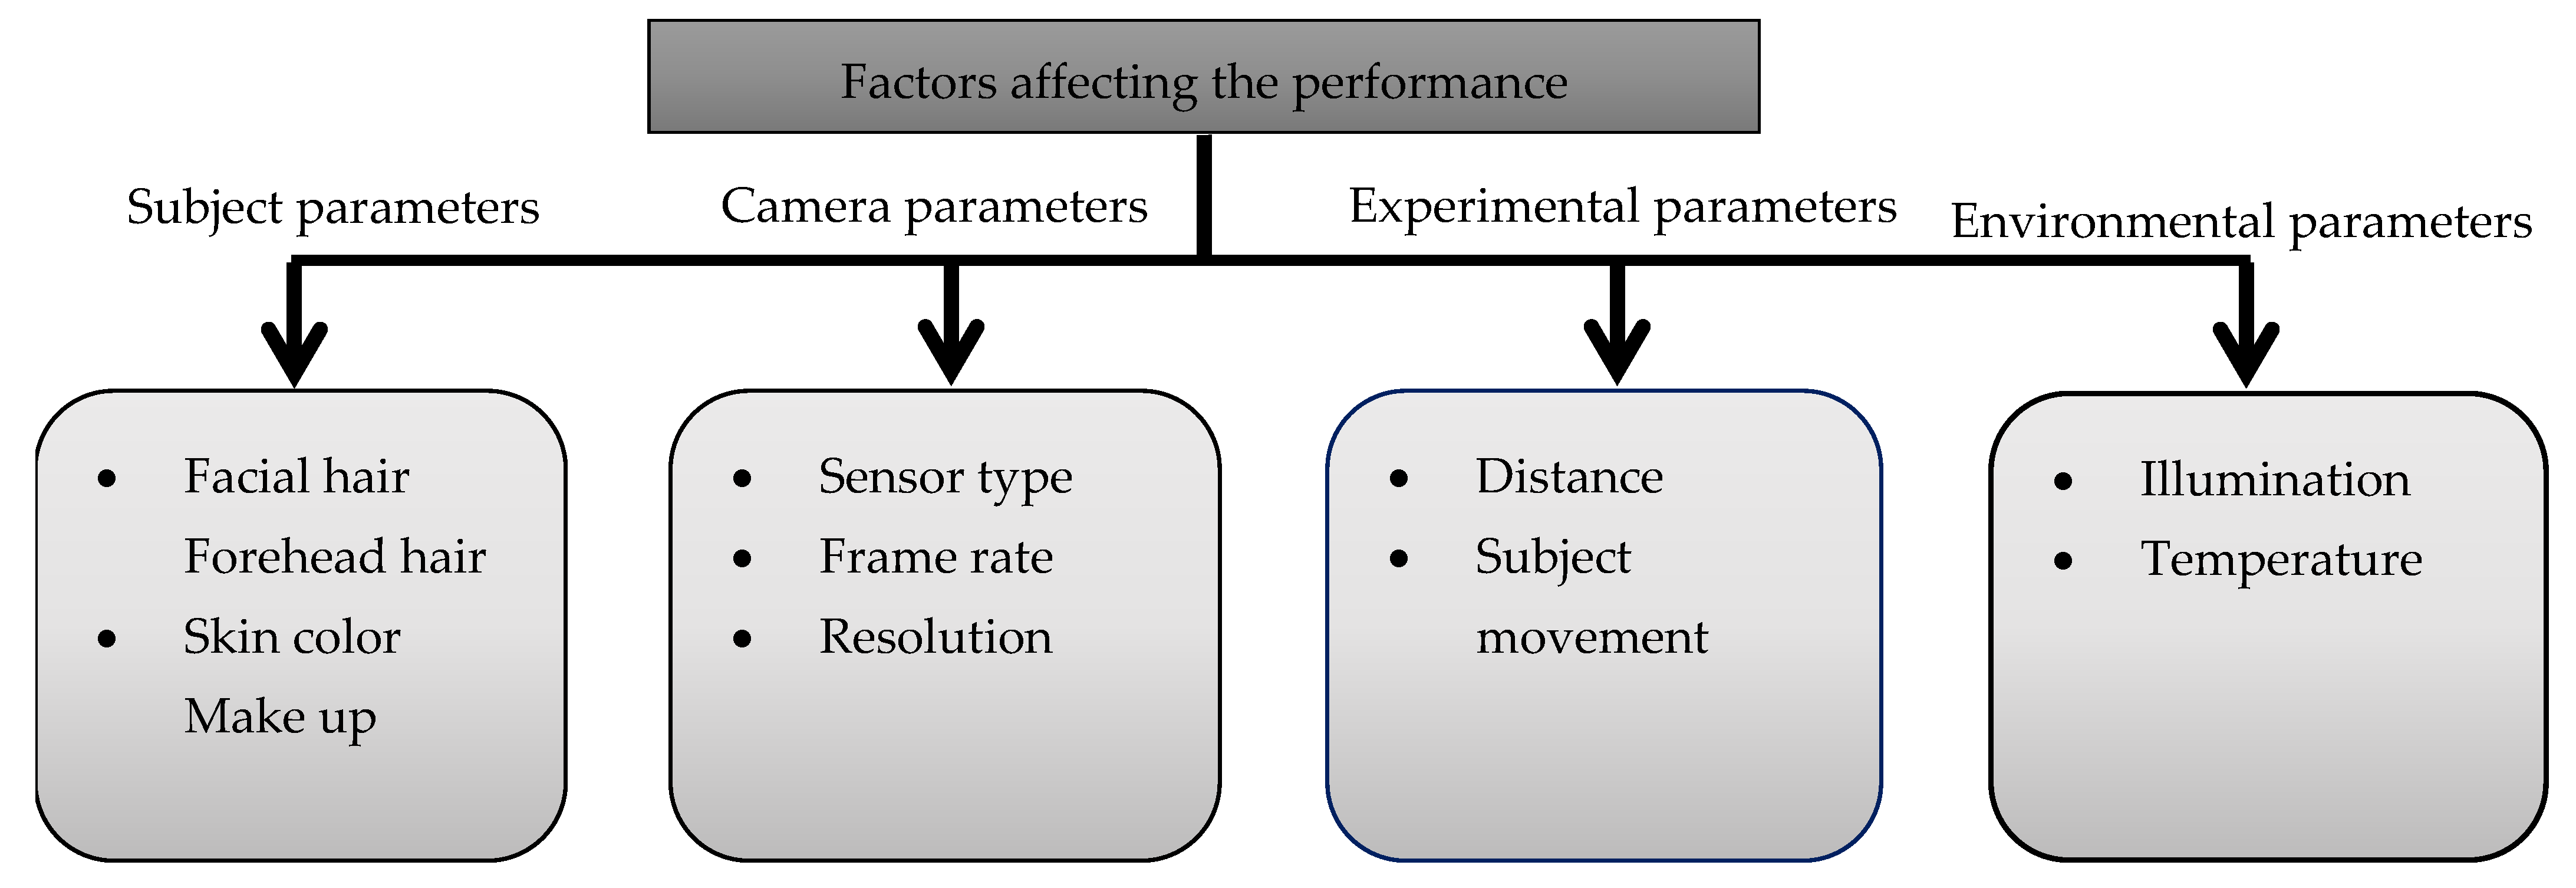
3.7.2. Factors Affecting the Performance
3.8. Applications
4. Discussion
4.1. Limitations
4.2. Research Questions
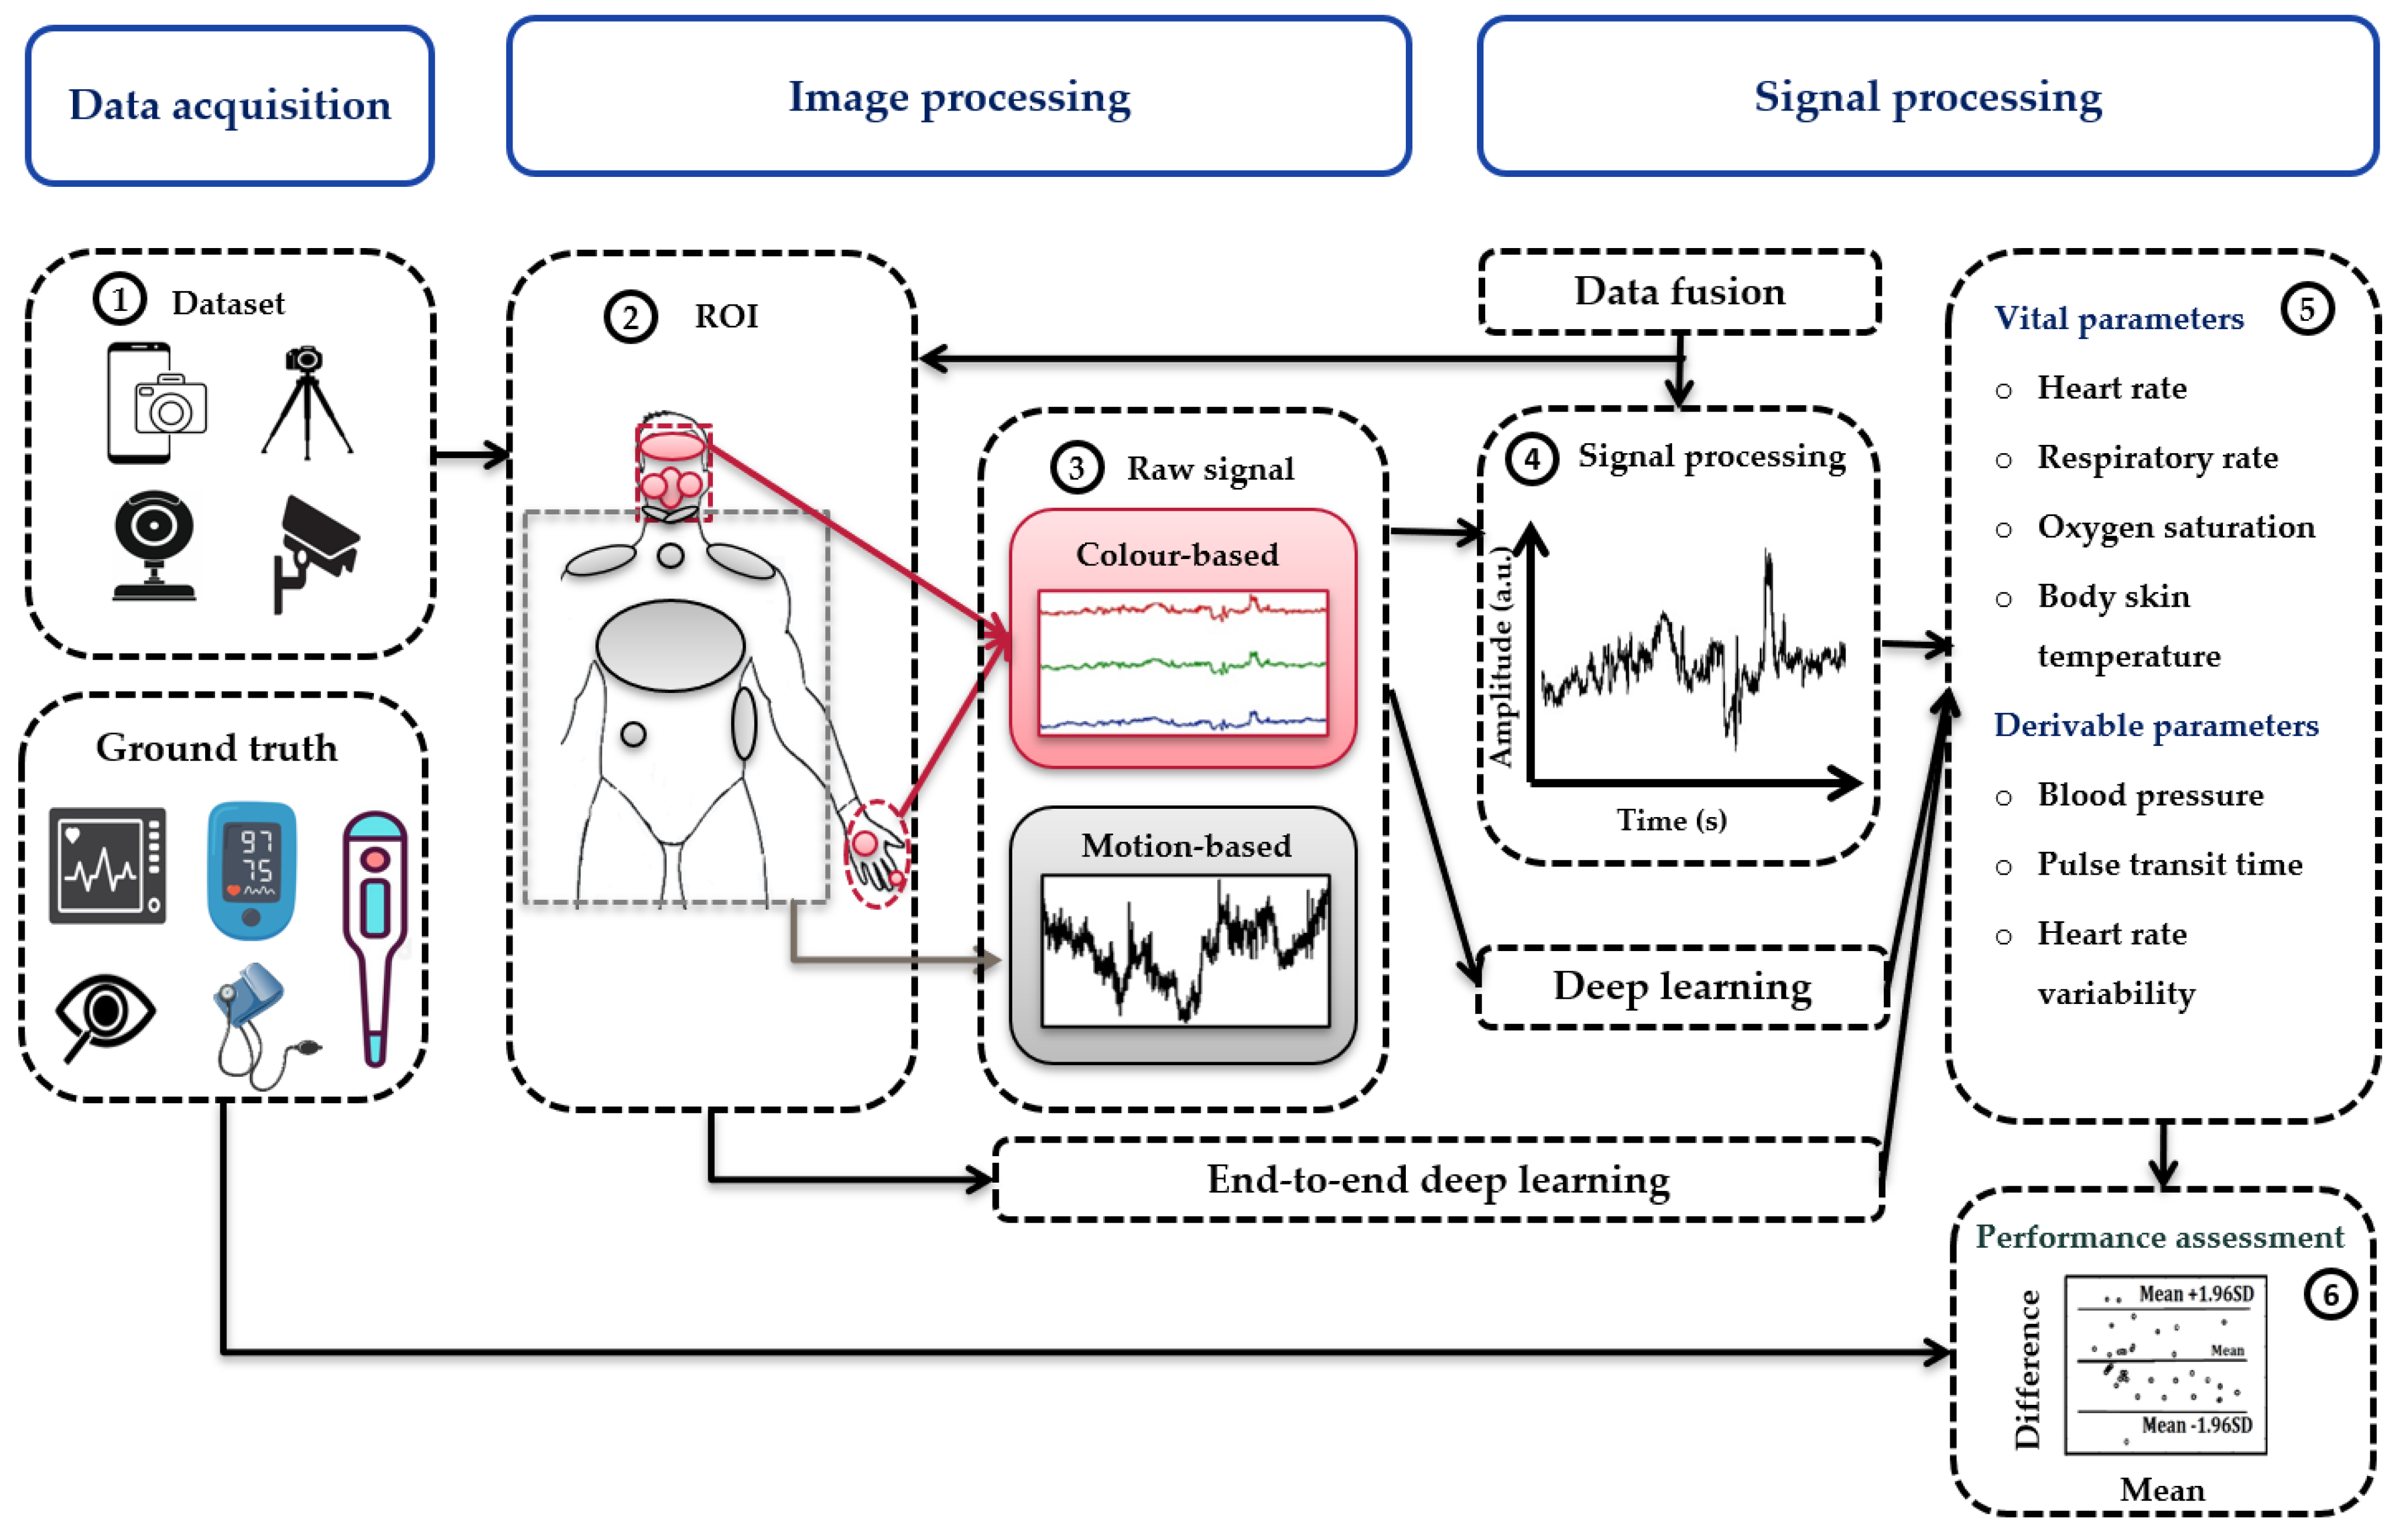
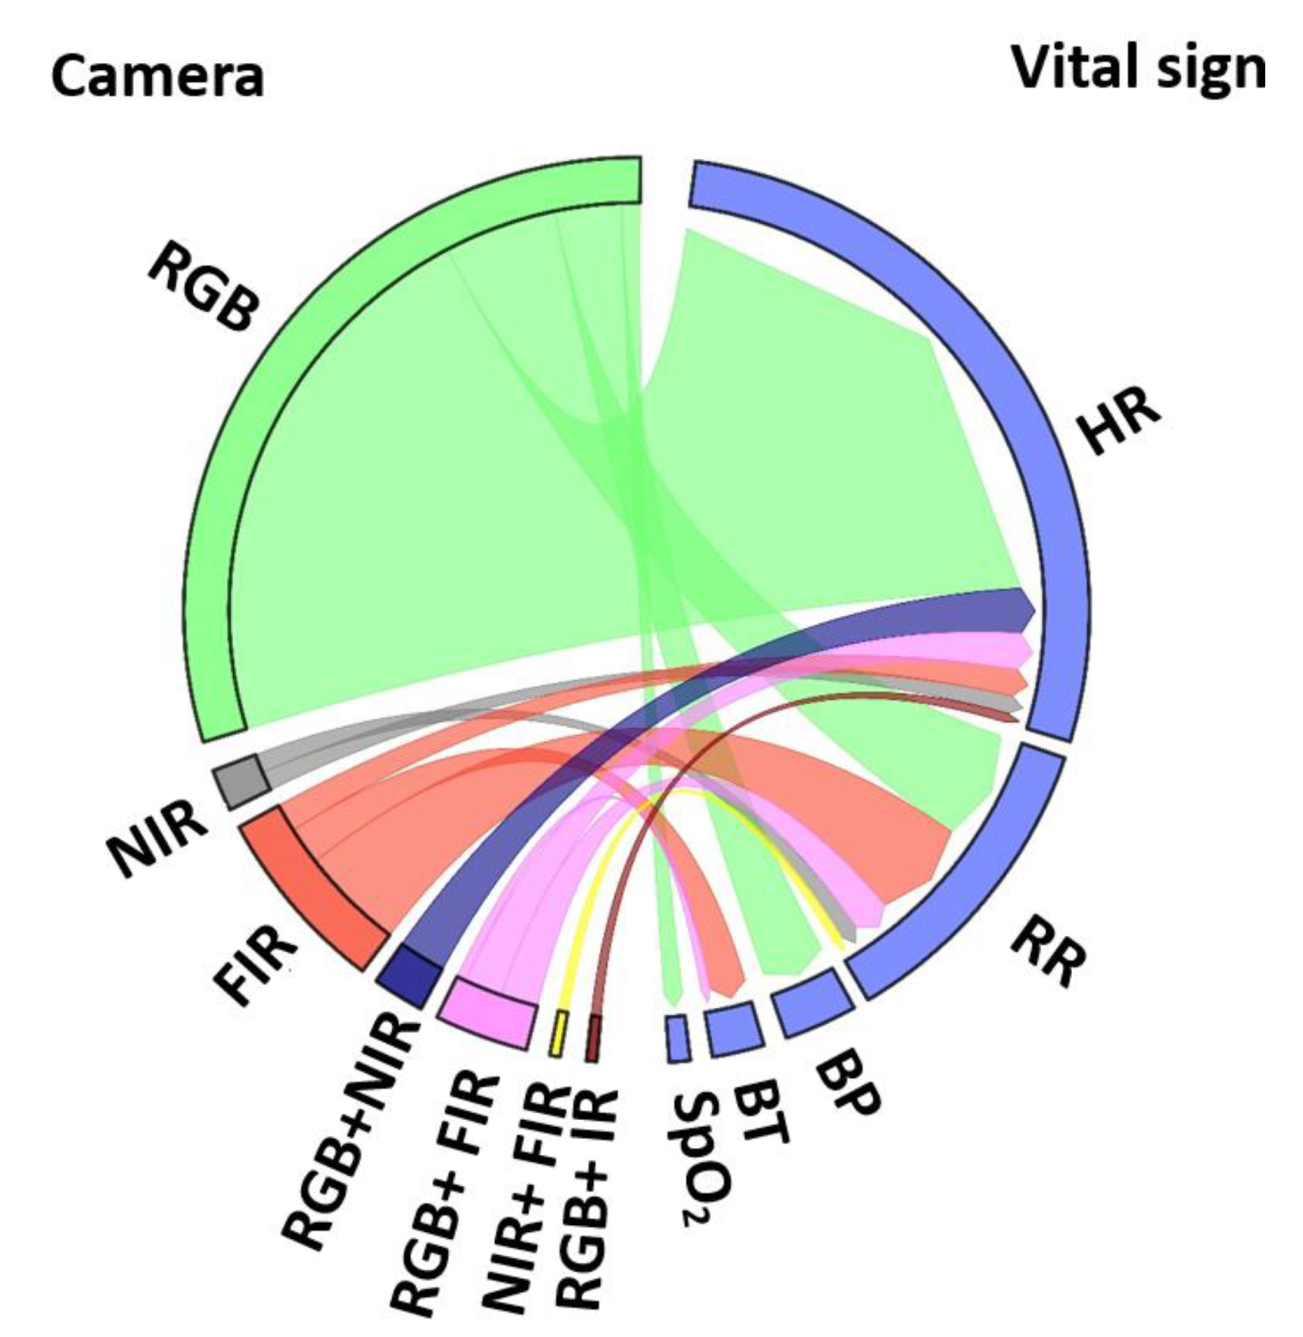
- Which vital sign is monitored using what type of camera? Using RGB cameras, the iPPG signal is extracted from a ROI in the video frames to monitor HR, SpO2, and BP based on color intensity changes, whereas RR is monitored based on body motion. NIR cameras measure the HR and RR as similar to RGB. In addition, thermal cameras extract HR, and RR based on periodic motions of the torso area, breathe airflow, or vertical movement of the face, whereas BST is obtained from the highest temperature of the ROI (Figure 6).
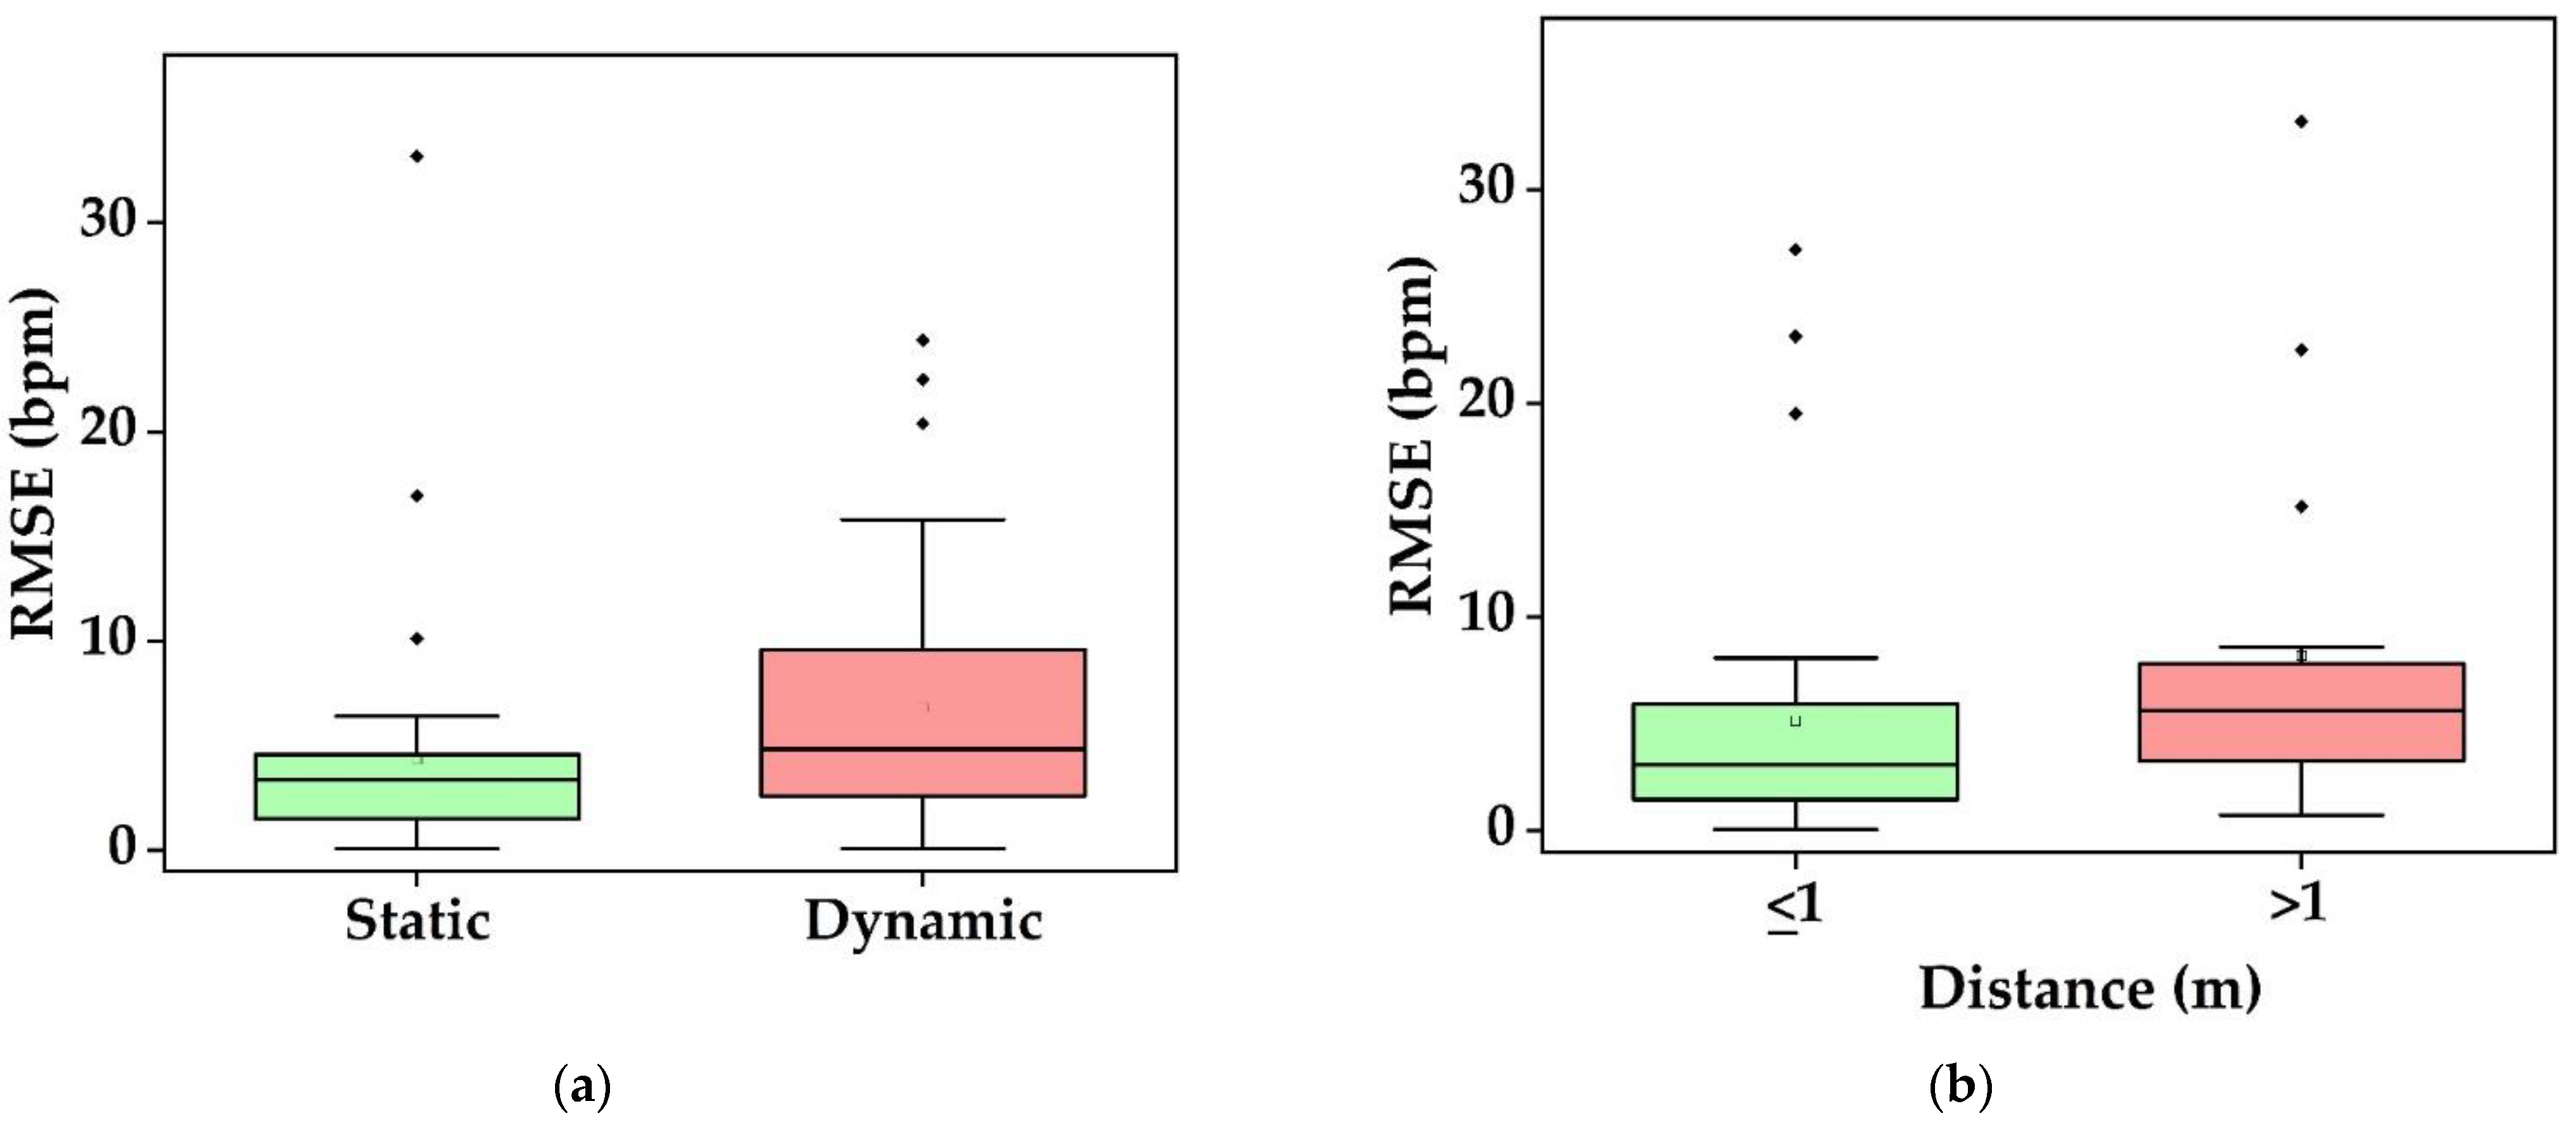
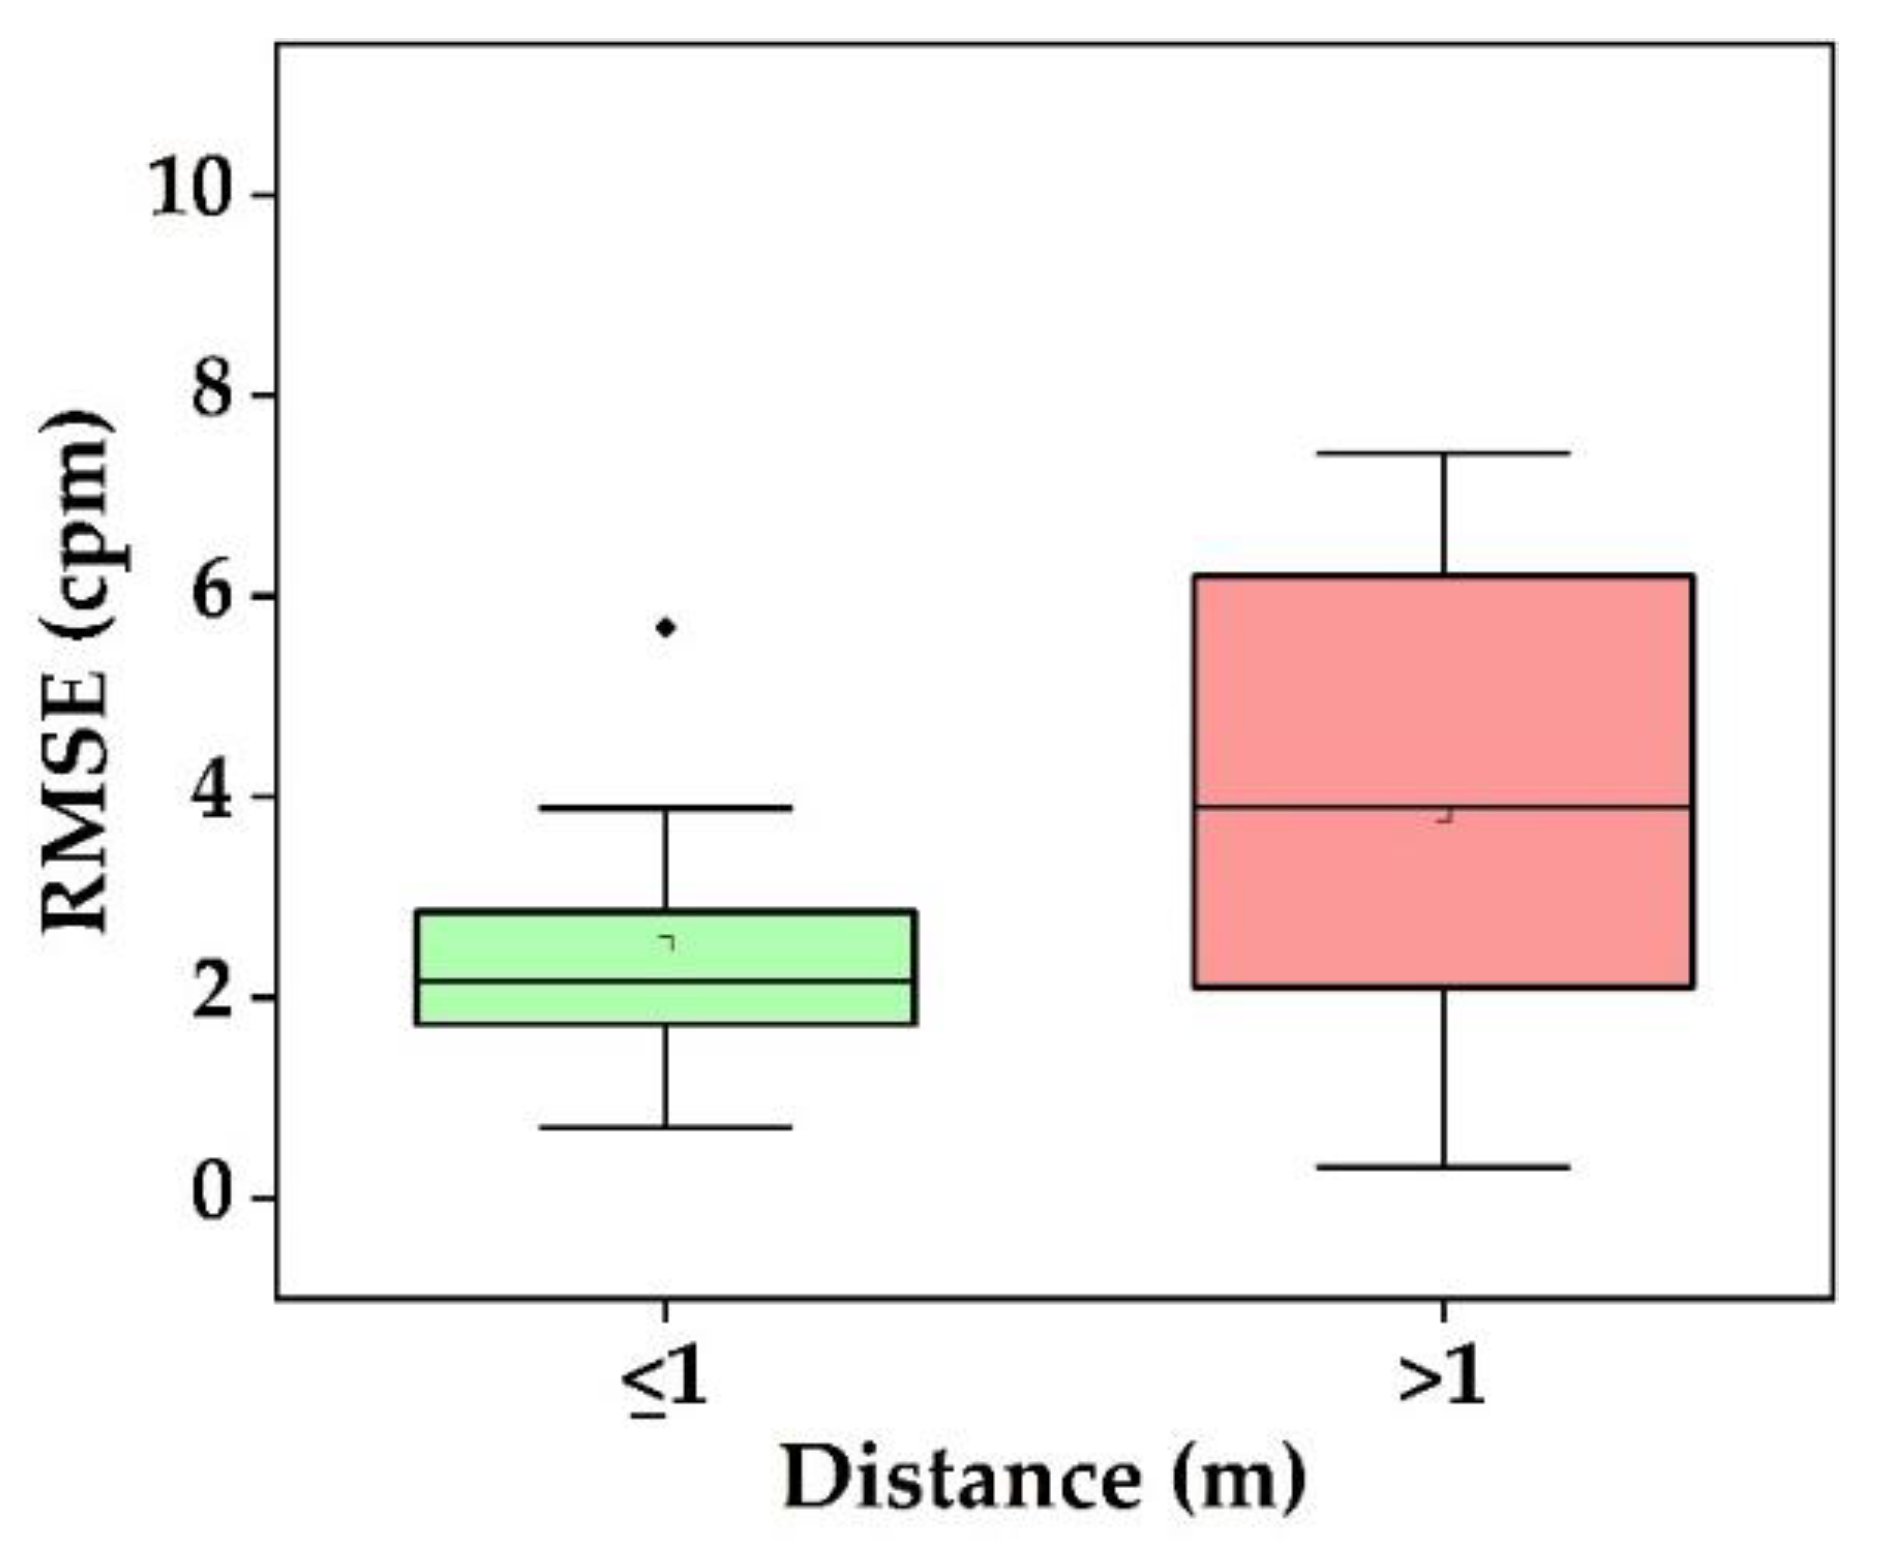
- What is the performance and which factor affects it? Static conditions avoid physical movement in well-controlled environments. Here, error rates are less than 5 bpm and 3 cpm for HR and RR, respectively (Figure 9a). The performance suffers considerably from body motion and face expressions and is further lowered if the camera-subject distance is more than 1 m (Figure 9b and Figure 10). In addition, changes in illumination considerably impacts the performance. Low light illumination decreases accuracy. These effects are quantified using several metrics (e.g., MAE, RMSE, CC).
- Which health issues are addressed by camera-based techniques? The working horses’ applications are ICU patients, neonatal, and geriatric monitoring as well as daily monitoring at home and hospital, during driving, and while performing exercises. Further, since March 2020, the COVID-19 pandemic is ongoing globally. As the virus affects the lungs, noncontact SpO2 monitoring is a valuable alternative to contact-based methods, as it avoids transmission of the virus. HR, RR, and BST can also be monitored to keep the best track of subject’s health. It is also further useful for monitoring vital signs in a noncontact way during other pandemic situations.
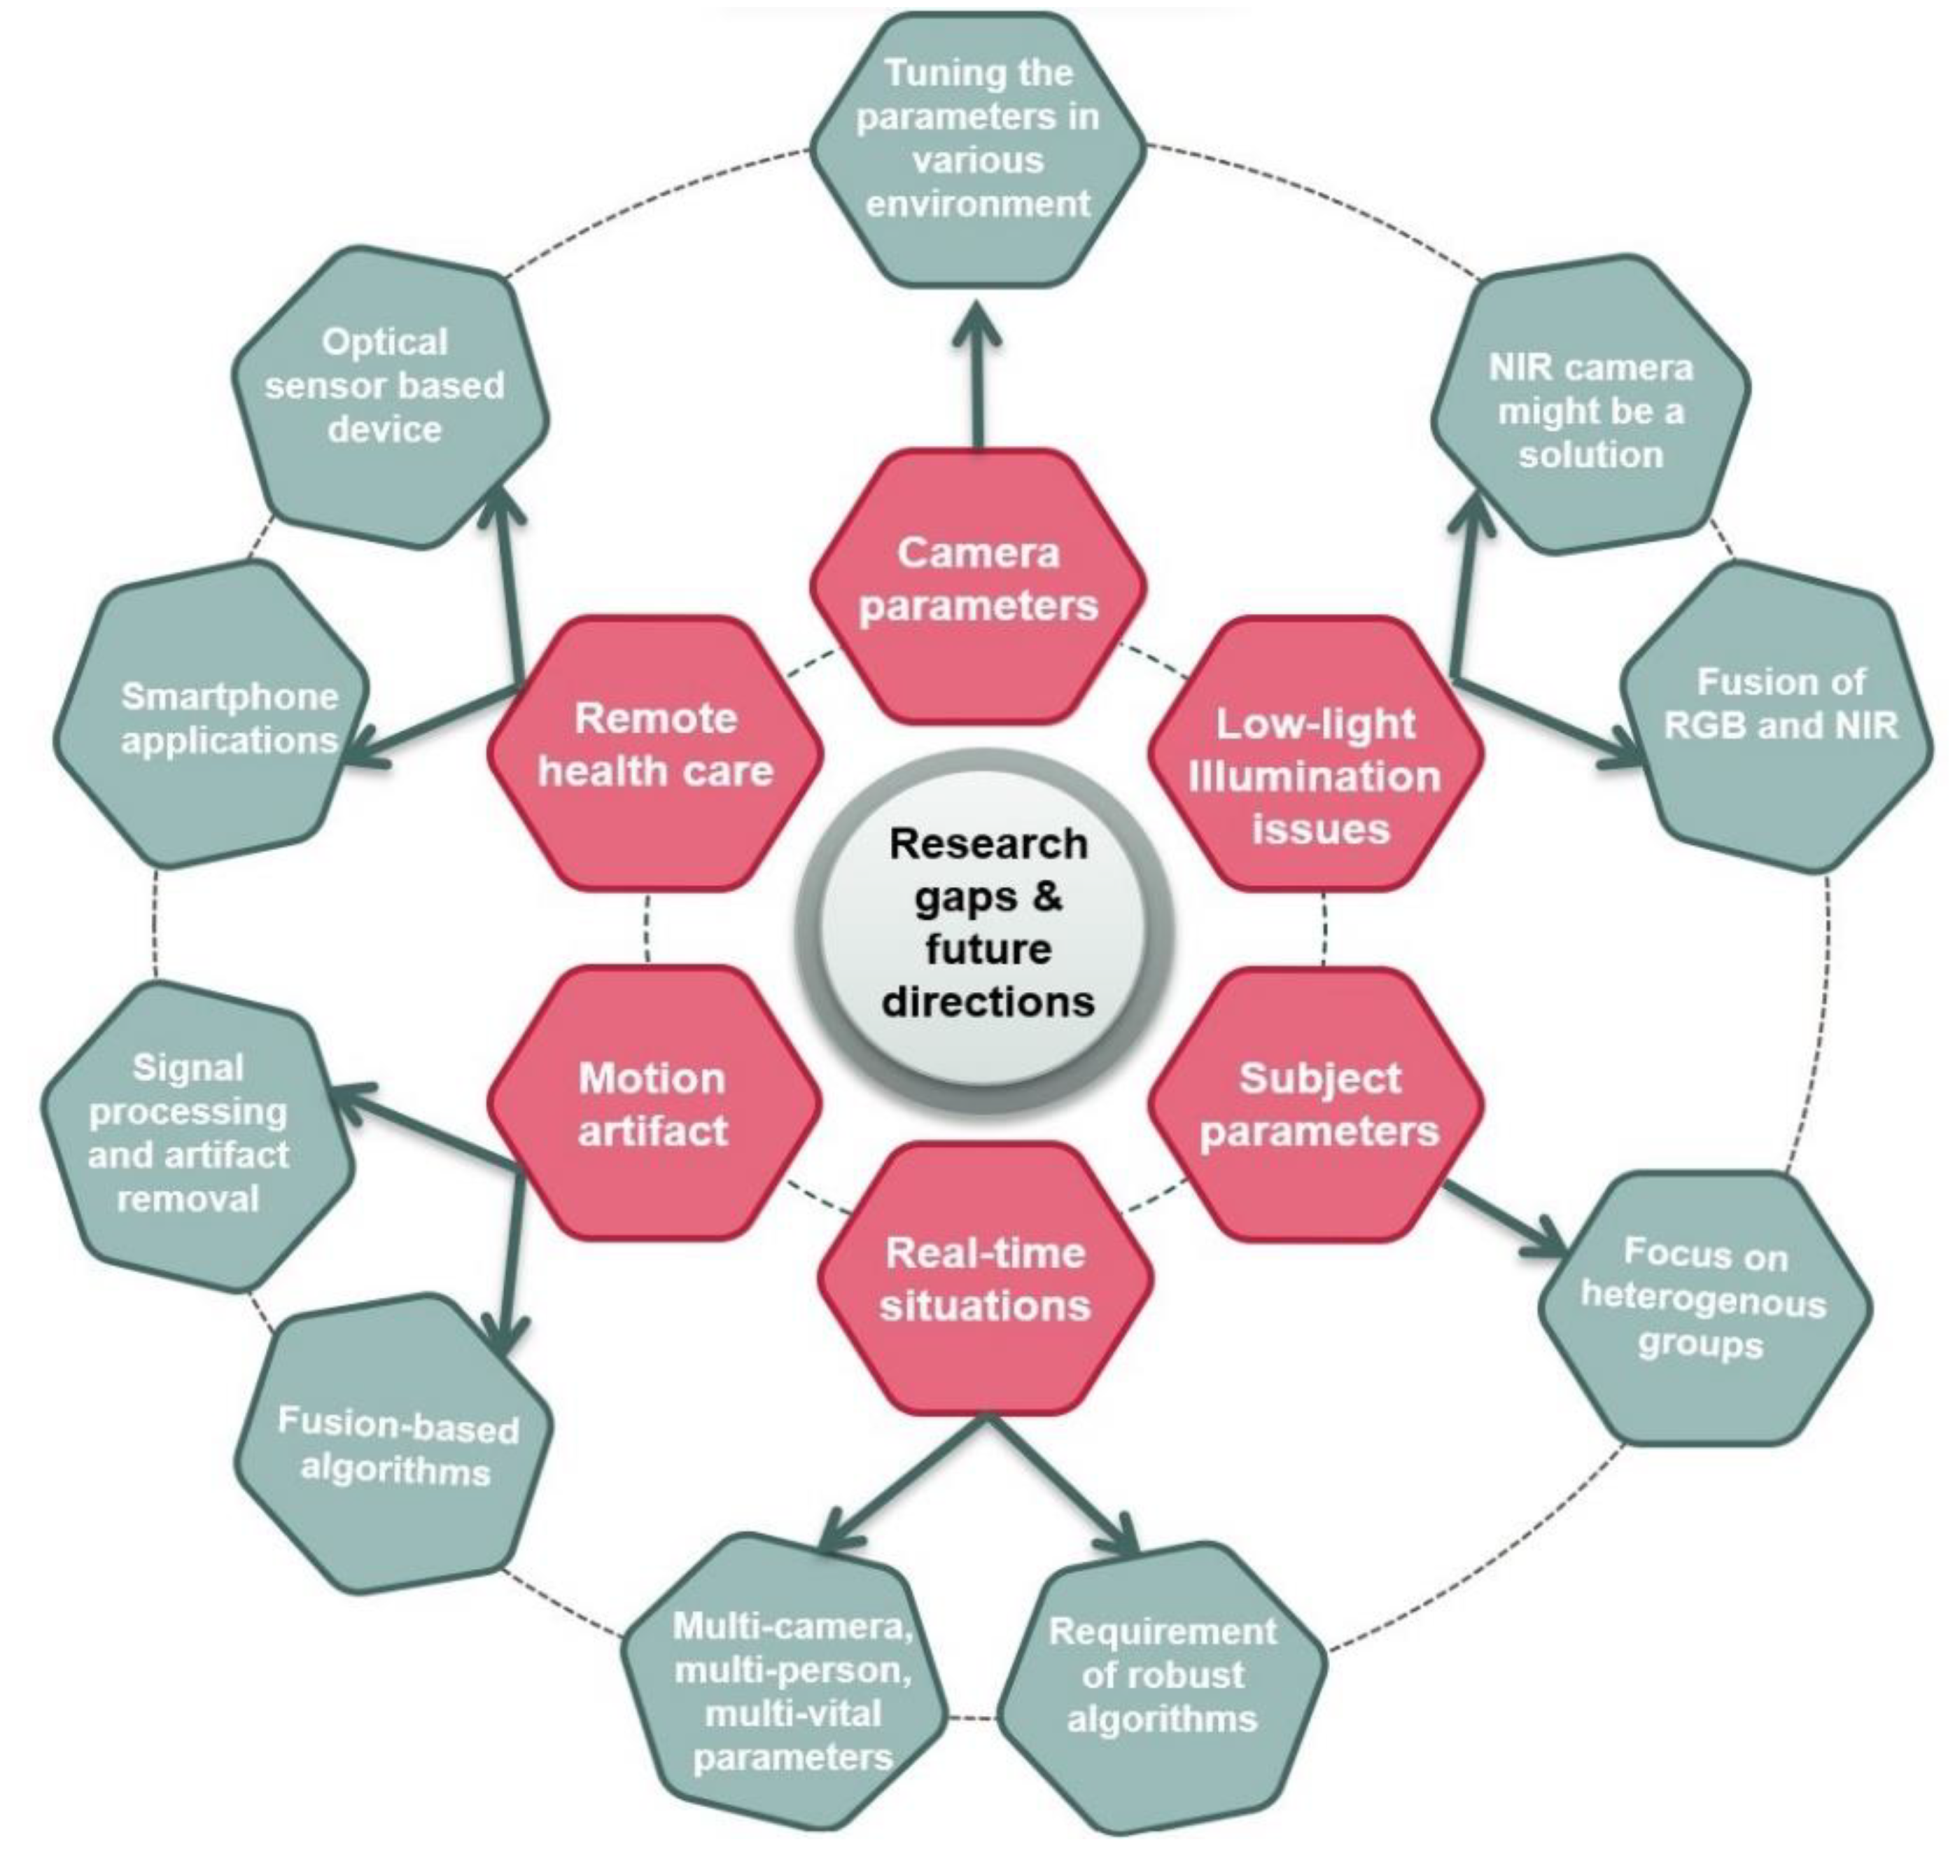
4.3. Research Gaps and Future Research Directions
5. Conclusions
Supplementary Materials
Author Contributions
Funding
Institutional Review Board Statement
Informed Consent Statement
Data Availability Statement
Conflicts of Interest
Abbreviations
| ECG | Electrocardiography |
| PPG | Photoplethysmography |
| HR | Heart rate |
| RR | Respiratory rate |
| BP | Blood pressure |
| BT | Body temperature |
| SpO2 | Oxygen saturation |
| bpm | beats per minute |
| cpm | cycles per minute |
| BCG | ballistocardiography |
| ICU | Intensive care units |
| iPPG | Imaging PPG |
| rPPG | Remote PPG |
| HRV | HR variability |
| PR | Pulse rate |
| PRV | Pulse rate variability |
| RGB | Red–green–blue |
| NIR | Near-infrared |
| FIR | Far-infrared |
| BST | Body skin temperature |
| IR | Infrared |
| px | pixels |
| SNR | Signal-to-noise ratio |
| PRISMA | Preferred reporting items for systematic reviews and meta-analyses |
| ACM | Association for Computing Machinery |
| ROI | region of interest |
| fps | frame per second |
| MR-NIRP | MERL-Rice near infrared pulse dataset |
| CCD | Charge coupled devices |
| EULA | End user license agreement |
| HSV | Hue saturation value |
| YCbCr | luminance, chroma blue, chroma red |
| AAMI | Association for the Advancement of Medical Instrumentation |
| BSS | Blind source separation |
| ICA | Independent component analysis |
| PCA | Principal component analysis |
| DL | Deep learning |
| CHROM | Chrominance model |
| POS | Plane-orthogonal-to-skin |
| IBI | Interbeat interval |
| PTT | Pulse transit time |
| MAE | Mean absolute error |
| RMSE | Root mean square error |
| CC | Correlation coefficient |
| BCT | Body core temperature |
| mHealth | Mobile health |
| FDA | Food and Drugs Administration |
Appendix A. Searching String
Appendix A.1. PubMed
- (“biosignal”[Title] OR “bio signal”[Title] OR “biomedical signal”[Title] OR “physiological”[Title] OR “cardiorespiratory signal”[Title] OR “cardiorespiratory signals”[Title] OR “ppg”[Title] OR “photoplethysmograph”[Title] OR “photoplethysmography”[Title] OR “photoplethysmogram”[Title] OR “vital sign”[Title] OR “vital signs”[Title] OR “respiration”[Title] OR “respiratory”[Title] OR “breathing”[Title] OR “heart rate”[Title] OR “pulse rate”[Title] OR “heart beat”[Title] OR “body temperature”[Title] OR “oxygen saturation”[Title] OR “blood pressure”[Title] OR “face”[Title] OR “facial”[Title])
- (“processing”[Title] OR “analytics”[Title] OR “analysis”[Title] OR “analyse”[Title] OR “analysing”[Title] OR “analyze”[Title] OR “analyzing”[Title] OR “measure”[Title] OR “measurement”[Title] OR “measuring”[Title] OR “sensing”[Title] OR “monitor”[Title] OR “monitoring”[Title] OR “estimation”[Title] OR “estimate”[Title] OR “estimating”[Title] OR “quantification”[Title] OR “identification”[Title] OR “recognition”[Title] OR “detect”[Title] OR “detection”[Title] OR “detecting”[Title] OR “tracking”[Title] OR “feature map”[Title] OR “feature maps”[Title])
- (review[pt] OR systematic review[pt] OR survey[pt])
- (english[la])
- (“2018/01/01”[DP]: “2021/04/30” [DP])
Appendix A.2. Scopus
- (“biosignal” OR “bio signal” OR “biomedical signal” OR “physiological” OR “cardiorespiratory signal” OR “cardiorespiratory signals” OR “ppg” OR “photoplethysmograph” OR “photoplethysmography” OR “photoplethysmogram” OR “vital sign” OR “vital signs” OR “respiration” OR “respiratory” OR “breathing” OR “heart rate” OR “pulse rate” OR “heart beat” OR “body temperature” OR “oxygen saturation” OR “blood pressure” OR “face” OR “facial”)
- (“processing” OR “analytics” OR “analysis” OR “analyse” OR “analysing” OR “analyze” OR “analyzing” OR “measure” OR “measurement” OR “measuring” OR “sensing” OR “monitor” OR “monitoring” OR “estimation” OR “estimate” OR “estimating” OR “quantification” OR “identification” OR “recognition” OR “detect” OR “detection” OR “detecting” OR “tracking” OR “feature map” OR “feature maps”))
- PUBDATETXT(“January 2021” OR “February 2021” OR “March 2021” OR “April 2021” OR “January 2020” OR “February 2020” OR “March 2020” OR “April 2020” OR “May 2020” OR “June 2020” OR “July 2020” OR “August 2020” OR “September 2020” OR “October 2020” OR “November 2020” OR “December 2020” OR “January 2019” OR “February 2019” OR “March 2019” OR “April 2019” OR “May 2019” OR “June 2019” OR “July 2019” OR “August 2019” OR “September 2019” OR “October 2019” OR “November 2019” OR “December 2019” OR “January 2018” OR “February 2018” OR “March 2018” OR “April 2018” OR “May 2018” OR “June 2018” OR “July 2018” OR “August 2018” OR “September 2018” OR “October 2018” OR “November 2018” OR “December 2018”)
- (“review” OR “survey”)
- (LIMIT-TO (LANGUAGE, “English”))
- (LIMIT-TO (PUBSTAGE, “final”))
- (LIMIT-TO (SUBJAREA, “MEDI”) OR LIMIT-TO (SUBJAREA, “ENGI”) OR LIMIT-TO (SUBJAREA, “NEUR”) OR LIMIT-TO (SUBJAREA, “COMP”) OR LIMIT-TO (SUBJAREA, “HEAL”) OR LIMIT-TO (SUBJAREA, “MULT”))
Appendix A.3. ACM
- (“biosignal” OR “bio signal” OR “biomedical signal” OR “physiological” OR “cardiorespiratory signal” OR “cardiorespiratory signals” OR “ppg” OR “photoplethysmograph” OR “photoplethysmography” OR “photoplethysmogram” OR “vital sign” OR “vital signs” OR “respiration” OR “respiratory” OR “breathing” OR “heart rate” OR “pulse rate” OR “heart beat” OR “body temperature” OR “oxygen saturation” OR “blood pressure” OR “face” OR “facial”)
- (“processing” OR “analytics” OR “analysis” OR “analyse” OR “analysing” OR “analyze” OR “analyzing” OR “measure” OR “measurement” OR “measuring” OR “sensing” OR “monitor” OR “monitoring” OR “estimation” OR “estimate” OR “estimating” OR “quantification” OR “identification” OR “recognition” OR “detect” OR “detection” OR “detecting” OR “tracking” OR “feature map” OR “feature maps”))
- “review” NOT “survey”
- 2018:2021
References
- Sörnmo, L.; Laguna, P. Bioelectrical Signal Processing in Cardiac and Neurological Applications; Academic Press: Cambridge, MA, USA, 2005; Volume 8. [Google Scholar]
- Zhou, G.; Wang, Y.; Cui, L. Biomedical Sensor, Device and Measurement Systems. In Advances in Bioengineering; Serra, P.A., Ed.; InTech: London, UK, 2015; ISBN 978-953-51-2141-1. [Google Scholar]
- Levick, J.R. An Introduction to Cardiovascular Physiology; Butterworths: London, UK; Boston, MA, USA, 1991; ISBN 978-0-7506-1028-5. [Google Scholar]
- Lu, G.; Yang, F.; Taylor, J.A.; Stein, J.F. A Comparison of Photoplethysmography and ECG Recording to Analyse Heart Rate Variability in Healthy Subjects. J. Med. Eng. Technol. 2009, 33, 634–641. [Google Scholar] [CrossRef] [PubMed]
- Evans, D.; Hodgkinson, B.; Berry, J. Vital Signs in Hospital Patients: A Systematic Review. Int. J. Nurs. Stud. 2001, 38, 643–650. [Google Scholar] [CrossRef]
- Rohmetra, H.; Raghunath, N.; Narang, P.; Chamola, V.; Guizani, M.; Lakkaniga, N.R. AI-Enabled Remote Monitoring of Vital Signs for COVID-19: Methods, Prospects and Challenges. Computing 2021, 1–27. [Google Scholar] [CrossRef]
- Wang, W.; Wang, X. Contactless Vital Signs Monitoring; Academic Press: Cambridge, MA, USA, 2022. [Google Scholar]
- Hlastala, M.P.; Berger, A.J. Physiology of Respiration; Oxford University Press: Oxford, UK, 2001. [Google Scholar]
- Sherwood, L. Human Physiology: From Cells to Systems, 9th ed.; Brooks/Cole, Cengage Learning: Boston, MA, USA, 2016; ISBN 978-1-285-86693-2. [Google Scholar]
- Ruiz, M.; Garcia, J.; Fernández, B. Body Temperature and Its Importance as a Vital Constant. Rev. Enferm. 2009, 32, 44–52. [Google Scholar]
- Hafen, B.B.; Sharma, S. Oxygen Saturation; StatPearls Publishing: Treasure Island, FL, USA, 2021. [Google Scholar]
- Sun, Z.; He, Q.; Li, Y.; Wang, W.; Wang, R.K. Robust Non-Contact Peripheral Oxygenation Saturation Measurement Using Smartphone-Enabled Imaging Photoplethysmography. Biomed. Opt. Express 2021, 12, 1746. [Google Scholar] [CrossRef]
- Antink, C.H.; Lyra, S.; Paul, M.; Yu, X.; Leonhardt, S. A Broader Look: Camera-Based Vital Sign Estimation across the Spectrum. Yearb. Med. Inf. 2019, 28, 102–114. [Google Scholar] [CrossRef] [Green Version]
- Zheng, Y.-L.; Ding, X.-R.; Poon, C.C.Y.; Lo, B.P.L.; Zhang, H.; Zhou, X.-L.; Yang, G.-Z.; Zhao, N.; Zhang, Y.-T. Unobtrusive Sensing and Wearable Devices for Health Informatics. IEEE Trans. Biomed. Eng. 2014, 61, 1538–1554. [Google Scholar] [CrossRef]
- Leonhardt, S.; Leicht, L.; Teichmann, D. Unobtrusive Vital Sign Monitoring in Automotive Environments—A Review. Sensors 2018, 18, 3080. [Google Scholar] [CrossRef] [Green Version]
- Magjarevic, R.; Ottenbacher, J.; Heuer, S. Motion Artefacts in Capacitively Coupled ECG Electrodes. In IFMBE Proceedings, Proceedings of the World Congress on Medical Physics and Biomedical Engineering, Munich, Germany, 7–12 September 2009; Dössel, O., Schlegel, W.C., Eds.; Springer: Berlin/Heidelberg, Germany, 2009; Volume 25/4, pp. 1059–1062. ISBN 978-3-64203-8-815. [Google Scholar]
- Kumar, M.; Veeraraghavan, A.; Sabharwal, A. DistancePPG: Robust Non-Contact Vital Signs Monitoring Using a Camera. Biomed. Opt. Express 2015, 6, 1565. [Google Scholar] [CrossRef] [Green Version]
- Wu, T.; Blazek, V.; Schmitt, H.J. Photoplethysmography Imaging: A New Noninvasive and Noncontact Method for Mapping of the Dermal Perfusion Changes. In Proceedings of the SPIE 4163, Optical Techniques and Instrumentation for the Measurement of Blood Composition, Structure, and Dynamics, Amsterdam, The Netherlands, 4–8 July 2000. [Google Scholar]
- Huelsbusch, M.; Blazek, V. Contactless Mapping of Rhythmical Phenomena in Tissue Perfusion Using PPGI. In Proceedings of the SPIE 4683, Medical Imaging 2002: Physiology and Function from Multidimensional Images, San Diego, CA, USA, 23–28 February 2002; pp. 110–117. [Google Scholar]
- Nadrag, C.; Poenaru, V.; Suciu, G. Heart Rate Measurement Using Face Detection in Video. In Proceedings of the 2018 International Conference on Communications (COMM), Bucharest, Romania, 14–16 June 2018. [Google Scholar]
- Chaichulee, S.; Villarroel, M.; Jorge, J.; Arteta, C.; McCormick, K.; Zisserman, A.; Tarassenko, L. Cardio-Respiratory Signal Extraction from Video Camera Data for Continuous Non-Contact Vital Sign Monitoring Using Deep Learning. Physiol. Meas. 2019, 40, 115001. [Google Scholar] [CrossRef] [Green Version]
- Lee, H.; Cho, A.; Whang, M. Vision-Based Measurement of Heart Rate from Ballistocardiographic Head Movements Using Unsupervised Clustering. Sensors 2019, 19, 3263. [Google Scholar] [CrossRef] [PubMed] [Green Version]
- Yu, X.; Laurentius, T.; Bollheimer, C.; Leonhardt, S.; Antink, C.H. Noncontact Monitoring of Heart Rate and Heart Rate Variability in Geriatric Patients Using Photoplethysmography Imaging. IEEE J. Biomed. Health Inform. 2021, 25, 1781–1792. [Google Scholar] [CrossRef] [PubMed]
- Rossol, S.L.; Yang, J.K.; Toney-Noland, C.; Bergin, J.; Basavaraju, C.; Kumar, P.; Lee, H.C. Non-Contact Video-Based Neonatal Respiratory Monitoring. Children 2020, 7, 171. [Google Scholar] [CrossRef] [PubMed]
- Lorato, I.; Stuijk, S.; Meftah, M.; Kommers, D.; Andriessen, P.; van Pul, C.; de Haan, G. Multi-Camera Infrared Thermography for Infant Respiration Monitoring. Biomed. Opt. Express 2020, 11, 4848–4861. [Google Scholar] [CrossRef]
- Lorato, I.; Stuijk, S.; Meftah, M.; Kommers, D.; Andriessen, P.; van Pul, C.; de Haan, G. Towards Continuous Camera-Based Respiration Monitoring in Infants. Sensors 2021, 21, 2268. [Google Scholar] [CrossRef]
- Pereira, C.B.; Yu, X.; Goos, T.; Reiss, I.; Orlikowsky, T.; Heimann, K.; Venema, B.; Blazek, V.; Leonhardt, S.; Teichmann, D. Noncontact Monitoring of Respiratory Rate in Newborn Infants Using Thermal Imaging. IEEE Trans. Biomed. Eng. 2019, 66, 1105–1114. [Google Scholar] [CrossRef]
- Maurya, L.; Kaur, P.; Chawla, D.; Mahapatra, P. Non-Contact Breathing Rate Monitoring in Newborns: A Review. Comput. Biol. Med. 2021, 132, 104321. [Google Scholar] [CrossRef]
- Chan, P.; Wong, G.; Dinh Nguyen, T.; Nguyen, T.; McNeil, J.; Hopper, I. Estimation of Respiratory Rate Using Infrared Video in an Inpatient Population: An Observational Study. J. Clin. Monit. Comput. 2020, 34, 1275–1284. [Google Scholar] [CrossRef]
- Spicher, N.; Kukuk, M.; Maderwald, S.; Ladd, M.E. Initial Evaluation of Prospective Cardiac Triggering Using Photoplethysmography Signals Recorded with a Video Camera Compared to Pulse Oximetry and Electrocardiography at 7T MRI. BioMed. Eng. OnLine 2016, 15, 126. [Google Scholar] [CrossRef] [Green Version]
- Kim, J.; Kwon, J.H.; Kim, E.; Yoo, S.K.; Shin, C. Respiratory Measurement Using Infrared Thermography and Respiratory Volume Monitor during Sedation in Patients Undergoing Endoscopic Urologic Procedures under Spinal Anesthesia. J. Clin. Monit. Comput. 2019, 33, 647–656. [Google Scholar] [CrossRef]
- Jakkaew, P.; Onoye, T. Non-Contact Respiration Monitoring and Body Movements Detection for Sleep Using Thermal Imaging. Sensors 2020, 20, 6307. [Google Scholar] [CrossRef] [PubMed]
- Wang, J.; Spicher, N.; Warnecke, J.M.; Haghi, M.; Schwartze, J.; Deserno, T.M. Unobtrusive Health Monitoring in Private Spaces: The Smart Home. Sensors 2021, 21, 864. [Google Scholar] [CrossRef] [PubMed]
- Hu, M.; Zhai, G.; Li, D.; Fan, Y.; Duan, H.; Zhu, W.; Yang, X. Combination of Near-Infrared and Thermal Imaging Techniques for the Remote and Simultaneous Measurements of Breathing and Heart Rates under Sleep Situation. PLoS ONE 2018, 13, e0190466. [Google Scholar] [CrossRef] [PubMed] [Green Version]
- Wang, J.; Warnecke, J.; Haghi, M.; Deserno, T. Unobtrusive Health Monitoring in Private Spaces: The Smart Vehicle. Sensors 2020, 20, 2442. [Google Scholar] [CrossRef]
- Nowara, E.M.; Marks, T.K.; Mansour, H.; Veeraraghavan, A. SparsePPG: Towards Driver Monitoring Using Camera-Based Vital Signs Estimation in Near-Infrared. In Proceedings of the 2018 IEEE/CVF Conference on Computer Vision and Pattern Recognition Workshops (CVPRW), Salt Lake City, UT, USA, 18–22 June 2018; pp. 1272–1281. [Google Scholar]
- Sugita, N.; Noro, T.; Yoshizawa, M.; Ichiji, K.; Yamaki, S.; Homma, N. Estimation of Absolute Blood Pressure Using Video Images Captured at Different Heights from the Heart. In Proceedings of the 2019 41st Annual International Conference of the IEEE Engineering in Medicine and Biology Society (EMBC), Berlin, Germany, 23–27 July 2019; pp. 4458–4461. [Google Scholar]
- Kim, C.-I.; Lee, J.-H. The Non-Contact Biometric Identified Bio Signal Measurement Sensor and Algorithms. THC 2018, 26, 215–228. [Google Scholar] [CrossRef] [Green Version]
- Benedetto, S.; Caldato, C.; Greenwood, D.C.; Bartoli, N.; Pensabene, V.; Actis, P. Remote Heart Rate Monitoring—Assessment of the Facereader RPPg by Noldus. PLoS ONE 2019, 14, e0225592. [Google Scholar] [CrossRef] [Green Version]
- Wei, J.; Luo, H.; Wu, S.J.; Zheng, P.P.; Fu, G.; Lee, K. Transdermal Optical Imaging Reveal Basal Stress via Heart Rate Variability Analysis: A Novel Methodology Comparable to Electrocardiography. Front. Psychol. 2018, 9, 98. [Google Scholar] [CrossRef] [Green Version]
- Nowara, E.M.; Marks, T.K.; Mansour, H.; Veeraraghavan, A. Near-Infrared Imaging Photoplethysmography During Driving. IEEE Trans. Intell. Transport. Syst. 2020, 23, 3589–3600. [Google Scholar] [CrossRef]
- Ding, X.; Nassehi, D.; Larson, E.C. Measuring Oxygen Saturation With Smartphone Cameras Using Convolutional Neural Networks. IEEE J. Biomed. Health Inform. 2019, 23, 2603–2610. [Google Scholar] [CrossRef]
- Sanyal, S.; Nundy, K.K. Algorithms for Monitoring Heart Rate and Respiratory Rate From the Video of a User’s Face. IEEE J. Transl. Eng. Health Med. 2018, 6, 1–11. [Google Scholar] [CrossRef]
- Liu, H.; Allen, J.; Zheng, D.; Chen, F. Recent Development of Respiratory Rate Measurement Technologies. Physiol. Meas. 2019, 40, 07TR01. [Google Scholar] [CrossRef] [PubMed] [Green Version]
- Cerina, L.; Iozzia, L.; Mainardi, L. Influence of Acquisition Frame-Rate and Video Compression Techniques on Pulse-Rate Variability Estimation from VPPG Signal. Biomed. Eng. Biomed. Tech. 2017, 64, 53–65. [Google Scholar] [CrossRef] [PubMed]
- Fleischhauer, V.; Ruprecht, N.; Sorelli, M.; Bocchi, L.; Zaunseder, S. Pulse Decomposition Analysis in Photoplethysmography Imaging. Physiol. Meas. 2020, 41, 095009. [Google Scholar] [CrossRef] [PubMed]
- Gudi, A.; Bittner, M.; van Gemert, J. Real-Time Webcam Heart-Rate and Variability Estimation with Clean Ground Truth for Evaluation. Appl. Sci. 2020, 10, 8630. [Google Scholar] [CrossRef]
- Wang, W.; den Brinker, A.C.; de Haan, G. Single-Element Remote-PPG. IEEE Trans. Biomed. Eng. 2019, 66, 2032–2043. [Google Scholar] [CrossRef] [PubMed]
- Bánhalmi, A.; Borbás, J.; Fidrich, M.; Bilicki, V.; Gingl, Z.; Rudas, L. Analysis of a Pulse Rate Variability Measurement Using a Smartphone Camera. J. Healthc. Eng. 2018, 2018, 1–15. [Google Scholar] [CrossRef]
- Hassan, M.A.; Malik, A.S.; Fofi, D.; Saad, N.; Karasfi, B.; Ali, Y.S.; Meriaudeau, F. Heart Rate Estimation Using Facial Video: A Review. Biomed. Signal Process. Control 2017, 38, 346–360. [Google Scholar] [CrossRef]
- Chen, W.; Hernandez, J.; Picard, R.W. Estimating Carotid Pulse and Breathing Rate from Near-Infrared Video of the Neck. Physiol. Meas. 2018, 39, 10NT01. [Google Scholar] [CrossRef] [Green Version]
- Queiroz, L.; Oliveira, H.; Yanushkevich, S.; Ferber, R. Video-Based Breathing Rate Monitoring in Sleeping Subjects. In Proceedings of the 2020 IEEE International Conference on Systems, Man, and Cybernetics (SMC), Toronto, ON, Canada, 11 October 2020; pp. 2458–2464. [Google Scholar]
- Zhu, K.; Li, M.; Akbarian, S.; Hafezi, M.; Yadollahi, A.; Taati, B. Vision-Based Heart and Respiratory Rate Monitoring During Sleep—A Validation Study for the Population at Risk of Sleep Apnea. IEEE J. Transl. Eng. Health Med. 2019, 7, 1–8. [Google Scholar] [CrossRef]
- Nowara, E.; McDuff, D. Combating the Impact of Video Compression on Non-Contact Vital Sign Measurement Using Supervised Learning. In Proceedings of the 2019 IEEE/CVF International Conference on Computer Vision Workshop (ICCVW), Seoul, Korea, 27–28 October 2019; pp. 1706–1712. [Google Scholar]
- Kado, S.; Monno, Y.; Moriwaki, K.; Yoshizaki, K.; Tanaka, M.; Okutomi, M. Remote Heart Rate Measurement from RGB-NIR Video Based on Spatial and Spectral Face Patch Selection. In Proceedings of the 2018 40th Annual International Conference of the IEEE Engineering in Medicine and Biology Society (EMBC), Honolulu, HI, USA, 17–21 July 2018; pp. 5676–5680. [Google Scholar]
- Chen, M.; Zhu, Q.; Zhang, H.; Wu, M.; Wang, Q. Respiratory Rate Estimation from Face Videos. In Proceedings of the 2019 IEEE EMBS International Conference on Biomedical & Health Informatics (BHI), Chicago, IL, USA, 19–22 May 2019; pp. 1–4. [Google Scholar]
- Barbosa Pereira, C.; Czaplik, M.; Blazek, V.; Leonhardt, S.; Teichmann, D. Monitoring of Cardiorespiratory Signals Using Thermal Imaging: A Pilot Study on Healthy Human Subjects. Sensors 2018, 18, 1541. [Google Scholar] [CrossRef] [Green Version]
- Wartzek, T.; Mühlsteff, J.; Imhoff, M. Temperature Measurement. Biomed. Tech. Biomed. Eng. 2011, 56, 241–257. [Google Scholar] [CrossRef] [PubMed]
- Song, R.; Zhang, S.; Cheng, J.; Li, C.; Chen, X. New Insights on Super-High Resolution for Video-Based Heart Rate Estimation with a Semi-Blind Source Separation Method. Comput. Biol. Med. 2020, 116, 103535. [Google Scholar] [CrossRef] [PubMed]
- Scebba, G.; Da Poian, G.; Karlen, W. Multispectral Video Fusion for Non-Contact Monitoring of Respiratory Rate and Apnea. IEEE Trans. Biomed. Eng. 2021, 68, 350–359. [Google Scholar] [CrossRef] [PubMed]
- Zhou, Y.; Ghassemi, P.; Chen, M.; McBride, D.; Casamento, J.P.; Pfefer, T.J.; Wang, Q. Clinical Evaluation of Fever-Screening Thermography: Impact of Consensus Guidelines and Facial Measurement Location. J. Biomed. Opt. 2020, 25, 097002. [Google Scholar] [CrossRef]
- Li, M.H.; Yadollahi, A.; Taati, B. Noncontact Vision-Based Cardiopulmonary Monitoring in Different Sleeping Positions. IEEE J. Biomed. Health Inform. 2017, 21, 1367–1375. [Google Scholar] [CrossRef]
- Sikdar, A.; Behera, S.K.; Dogra, D.P. Computer-Vision-Guided Human Pulse Rate Estimation: A Review. IEEE Rev. Biomed. Eng. 2016, 9, 91–105. [Google Scholar] [CrossRef]
- Rouast, P.V.; Adam, M.T.P.; Chiong, R.; Cornforth, D.; Lux, E. Remote Heart Rate Measurement Using Low-Cost RGB Face Video: A Technical Literature Review. Front. Comput. Sci. 2018, 12, 858–872. [Google Scholar] [CrossRef]
- Wang, C.; Pun, T.; Chanel, G. A Comparative Survey of Methods for Remote Heart Rate Detection from Frontal Face Videos. Front. Bioeng. Biotechnol. 2018, 6, 33. [Google Scholar] [CrossRef] [Green Version]
- Zaunseder, S.; Trumpp, A.; Wedekind, D.; Malberg, H. Cardiovascular Assessment by Imaging Photoplethysmography—A Review. Biomed. Eng. Biomed. Tech. 2018, 63, 617–634. [Google Scholar] [CrossRef]
- Addison, A.P.; Addison, P.S.; Smit, P.; Jacquel, D.; Borg, U.R. Noncontact Respiratory Monitoring Using Depth Sensing Cameras: A Review of Current Literature. Sensors 2021, 21, 1135. [Google Scholar] [CrossRef]
- Rehouma, H.; Noumeir, R.; Essouri, S.; Jouvet, P. Advancements in Methods and Camera-Based Sensors for the Quantification of Respiration. Sensors 2020, 20, 7252. [Google Scholar] [CrossRef] [PubMed]
- Khanam, F.-T.-Z.; Al-Naji, A.; Chahl, J. Remote Monitoring of Vital Signs in Diverse Non-Clinical and Clinical Scenarios Using Computer Vision Systems: A Review. Appl. Sci. 2019, 9, 4474. [Google Scholar] [CrossRef] [Green Version]
- Steinman, J.; Barszczyk, A.; Sun, H.-S.; Lee, K.; Feng, Z.-P. Smartphones and Video Cameras: Future Methods for Blood Pressure Measurement. Front. Digit. Health 2021, 3, 770096. [Google Scholar] [CrossRef] [PubMed]
- Harford, M.; Catherall, J.; Gerry, S.; Young, J.; Watkinson, P. Availability and Performance of Image-Based, Non-Contact Methods of Monitoring Heart Rate, Blood Pressure, Respiratory Rate, and Oxygen Saturation: A Systematic Review. Physiol. Meas. 2019, 40, 06TR01. [Google Scholar] [CrossRef] [PubMed]
- Moher, D.; Liberati, A.; Tetzlaff, J.; Altman, D.G. PRISMA Group Preferred Reporting Items for Systematic Reviews and Meta-Analyses: The PRISMA Statement. PLoS Med. 2009, 6, e1000097. [Google Scholar] [CrossRef] [PubMed] [Green Version]
- Hsu, W.; Baumgartner, C.; Deserno, T.M.; Section Editors of the IMIA Yearbook Section on Sensors, Signals, and Imaging Informatics. Notable Papers and New Directions in Sensors, Signals, and Imaging Informatics. Yearb. Med. Inf. 2021, 30, 150–158. [Google Scholar] [CrossRef]
- Zhang, S.; Song, R.; Cheng, J.; Zhang, Y.; Chen, X. A Feasibility Study of a Video-Based Heart Rate Estimation Method with Convolutional Neural Networks. In Proceedings of the 2019 IEEE International Conference on Computational Intelligence and Virtual Environments for Measurement Systems and Applications (CIVEMSA), Tianjin, China, 14–16 June 2019; pp. 1–5. [Google Scholar]
- Qiu, Y.; Liu, Y.; Arteaga-Falconi, J.; Dong, H.; El Saddik, A. EVM-CNN: Real-Time Contactless Heart Rate Estimation from Facial Video. IEEE Trans. Multimed. 2019, 21, 1778–1787. [Google Scholar] [CrossRef]
- Jaiswal, K.B.; Meenpal, T. Continuous Pulse Rate Monitoring from Facial Video Using RPPG. In Proceedings of the 2020 11th International Conference on Computing, Communication and Networking Technologies (ICCCNT), Kharagpur, India, 1–3 July 2020; pp. 1–5. [Google Scholar]
- Liu, X.; Yang, X.; Jin, J.; Wong, A. Detecting Pulse Wave from Unstable Facial Videos Recorded From Consumer-Level Cameras: A Disturbance-Adaptive Orthogonal Matching Pursuit. IEEE Trans. Biomed. Eng. 2020, 67, 3352–3362. [Google Scholar] [CrossRef]
- Hsu, G.-S.J.; Xie, R.-C.; Ambikapathi, A.; Chou, K.-J. A Deep Learning Framework for Heart Rate Estimation from Facial Videos. Neurocomputing 2020, 417, 155–166. [Google Scholar] [CrossRef]
- Maki, Y.; Monno, Y.; Tanaka, M.; Okutomi, M. Remote Heart Rate Estimation Based on 3D Facial Landmarks. In Proceedings of the 2020 42nd Annual International Conference of the IEEE Engineering in Medicine & Biology Society (EMBC), Montreal, QC, Canada, 20–24 July 2020; pp. 2634–2637. [Google Scholar]
- Rapczynski, M.; Werner, P.; Al-Hamadi, A. Effects of Video Encoding on Camera-Based Heart Rate Estimation. IEEE Trans. Biomed. Eng. 2019, 66, 3360–3370. [Google Scholar] [CrossRef]
- Gupta, P.; Bhowmick, B.; Pal, A. MOMBAT: Heart Rate Monitoring from Face Video Using Pulse Modeling and Bayesian Tracking. Comput. Biol. Med. 2020, 121, 103813. [Google Scholar] [CrossRef] [PubMed]
- Umematsu, T.; Tsujikawa, M. Head-Motion Robust Video-Based Heart Rate Estimation Using Facial Feature Point Fluctuations. In Proceedings of the 2018 40th Annual International Conference of the IEEE Engineering in Medicine and Biology Society (EMBC), Honolulu, HI, USA, 17–21 July 2018; pp. 1–4. [Google Scholar]
- Raseena, K.T.; Ghosh, P.K. A Maximum Likelihood Formulation to Exploit Heart Rate Variability for Robust Heart Rate Estimation From Facial Video. In Proceedings of the 2018 40th Annual International Conference of the IEEE Engineering in Medicine and Biology Society (EMBC), Honolulu, HI, USA, 17–21 July 2018; pp. 5191–5194. [Google Scholar]
- Kurihara, K.; Sugimura, D.; Hamamoto, T. Non-Contact Heart Rate Estimation via Adaptive RGB/NIR Signal Fusion. IEEE Trans. Image Process. 2021, 30, 6528–6543. [Google Scholar] [CrossRef] [PubMed]
- Li, P.; Benezeth, Y.; Macwan, R.; Nakamura, K.; Gomez, R.; Li, C.; Yang, F. Video-Based Pulse Rate Variability Measurement Using Periodic Variance Maximization and Adaptive Two-Window Peak Detection. Sensors 2020, 20, 2752. [Google Scholar] [CrossRef] [PubMed]
- Tsou, Y.-Y.; Lee, Y.-A.; Hsu, C.-T.; Chang, S.-H. Siamese-RPPG Network: Remote Photoplethysmography Signal Estimation from Face Videos. In Proceedings of the 35th Annual ACM Symposium on Applied Computing, Brno, Czech Republic, 30 March 2020; pp. 2066–2073. [Google Scholar]
- Hassan, M.A.; Malik, A.S.; Fofi, D.; Karasfi, B.; Meriaudeau, F. Towards Health Monitoring Using Remote Heart Rate Measurement Using Digital Camera: A Feasibility Study. Measurement 2020, 149, 106804. [Google Scholar] [CrossRef] [PubMed]
- Sorelli, M.; Kopietz, C.; Zaunseder, S.; Bocchi, L. Pulse Decomposition Analysis in Camera-Based Photoplethysmography. In Proceedings of the 2019 41st Annual International Conference of the IEEE Engineering in Medicine and Biology Society (EMBC), Berlin, Germany, 23–27 July 2019; pp. 3179–3182. [Google Scholar]
- Iozza, L.; Lázaro, J.; Cerina, L.; Silvestri, D.; Mainardi, L.; Laguna, P.; Gil, E. Monitoring Breathing Rate by Fusing the Physiological Impact of Respiration on Video-Photoplethysmogram with Head Movements. Physiol. Meas. 2019, 40, 094002. [Google Scholar] [CrossRef] [PubMed] [Green Version]
- Paul, M.; Yu, X.; Wu, B.; Weiss, C.; Antink, C.H.; Blazek, V.; Leonhardt, S. Waveform Analysis for Camera-Based Photoplethysmography Imaging. In Proceedings of the 2019 41st Annual International Conference of the IEEE Engineering in Medicine and Biology Society (EMBC), Berlin, Germany, 23–27 July 2019; pp. 2713–2718. [Google Scholar]
- Schrumpf, F.; Monch, C.; Bausch, G.; Fuchs, M. Exploiting Weak Head Movements for Camera-Based Respiration Detection. In Proceedings of the 2019 41st Annual International Conference of the IEEE Engineering in Medicine and Biology Society (EMBC), Berlin, Germany, 23–27 July 2019; pp. 6059–6062. [Google Scholar]
- Barbieri, R.; Ficarelli, L.; Levi, R.; Negro, M.; Cerina, L.; Mainardi, L. Identification and Tracking of Physiological Parameters from Skin Using Video Photoplethysmography. In Proceedings of the 2019 41st Annual International Conference of the IEEE Engineering in Medicine and Biology Society (EMBC), Berlin, Germany, 23–27 July 2019; pp. 6822–6825. [Google Scholar]
- Yu, X.; Paul, M.; Antink, C.H.; Venema, B.; Blazek, V.; Bollheimer, C.; Leonhardt, S.; Teichmann, D. Non-Contact Remote Measurement of Heart Rate Variability Using Near-Infrared Photoplethysmography Imaging. In Proceedings of the 2018 40th Annual International Conference of the IEEE Engineering in Medicine and Biology Society (EMBC), Honolulu, HI, USA, 17–21 July 2018; pp. 846–849. [Google Scholar]
- Cosar, S.; Yan, Z.; Zhao, F.; Lambrou, T.; Yue, S.; Bellotto, N. Thermal Camera Based Physiological Monitoring with an Assistive Robot. In Proceedings of the 2018 40th Annual International Conference of the IEEE Engineering in Medicine and Biology Society (EMBC), Honolulu, HI, USA, 17–21 July 2018; pp. 5010–5013. [Google Scholar]
- Melchor Rodríguez, A.; Ramos-Castro, J. Video Pulse Rate Variability Analysis in Stationary and Motion Conditions. BioMed. Eng. OnLine 2018, 17, 11. [Google Scholar] [CrossRef] [Green Version]
- Wang, W.; Shan, C. Impact of Makeup on Remote-PPG Monitoring. Biomed. Phys. Eng. Express 2020, 6, 035004. [Google Scholar] [CrossRef]
- Moya-Albor, E.; Brieva, J.; Ponce, H.; Rivas-Scott, O.; Gomez-Pena, C. Heart Rate Estimation Using Hermite Transform Video Magnification and Deep Learning. In Proceedings of the 2018 40th Annual International Conference of the IEEE Engineering in Medicine and Biology Society (EMBC), Honolulu, HI, USA, 17–21 July 2018; pp. 2595–2598. [Google Scholar]
- Chen, Q.; Jiang, X.; Liu, X.; Lu, C.; Wang, L.; Chen, W. Non-Contact Heart Rate Monitoring in Neonatal Intensive Care Unit Using RGB Camera. In Proceedings of the 2020 42nd Annual International Conference of the IEEE Engineering in Medicine & Biology Society (EMBC), Montreal, QC, Canada, 20–24 July 2020; pp. 5822–5825. [Google Scholar]
- Villarroel, M.; Chaichulee, S.; Jorge, J.; Davis, S.; Green, G.; Arteta, C.; Zisserman, A.; McCormick, K.; Watkinson, P.; Tarassenko, L. Non-Contact Physiological Monitoring of Preterm Infants in the Neonatal Intensive Care Unit. NPJ Digit. Med. 2019, 2, 128. [Google Scholar] [CrossRef] [Green Version]
- Lyra, S.; Mayer, L.; Ou, L.; Chen, D.; Timms, P.; Tay, A.; Chan, P.Y.; Ganse, B.; Leonhardt, S.; Hoog Antink, C. A Deep Learning-Based Camera Approach for Vital Sign Monitoring Using Thermography Images for ICU Patients. Sensors 2021, 21, 1495. [Google Scholar] [CrossRef]
- Wieler, M.E.; Murphy, T.G.; Blecherman, M.; Mehta, H.; Bender, G.J. Infant Heart-Rate Measurement and Oxygen Desaturation Detection with a Digital Video Camera Using Imaging Photoplethysmography. J. Perinatol. 2021, 41, 1725–1731. [Google Scholar] [CrossRef]
- Gibson, K.; Al-Naji, A.; Fleet, J.; Steen, M.; Esterman, A.; Chahl, J.; Huynh, J.; Morris, S. Non-Contact Heart and Respiratory Rate Monitoring of Preterm Infants Based on a Computer Vision System: A Method Comparison Study. Pediatr. Res. 2019, 86, 738–741. [Google Scholar] [CrossRef] [PubMed]
- Pavlidis, I.; Garza, I.; Tsiamyrtzis, P.; Dcosta, M.; Swanson, J.W.; Krouskop, T.; Levine, J.A. Dynamic Quantification of Migrainous Thermal Facial Patterns—A Pilot Study. IEEE J. Biomed. Health Inform. 2019, 23, 1225–1233. [Google Scholar] [CrossRef] [PubMed]
- Huynh, S.; Balan, R.K.; Ko, J.; Lee, Y. VitaMon: Measuring Heart Rate Variability Using Smartphone Front Camera. In Proceedings of the 17th Conference on Embedded Networked Sensor Systems, New York, NY, USA, 10–13 November 2019; pp. 1–14. [Google Scholar]
- Massaroni, C.; Lo Presti, D.; Formica, D.; Silvestri, S.; Schena, E. Non-Contact Monitoring of Breathing Pattern and Respiratory Rate via RGB Signal Measurement. Sensors 2019, 19, 2758. [Google Scholar] [CrossRef] [PubMed] [Green Version]
- Negishi, T.; Sun, G.; Liu, H.; Sato, S.; Matsui, T.; Kirimoto, T. Stable Contactless Sensing of Vital Signs Using RGB-Thermal Image Fusion System with Facial Tracking for Infection Screening. In Proceedings of the 2018 40th Annual International Conference of the IEEE Engineering in Medicine and Biology Society (EMBC), Honolulu, HI, USA, 17–21 July 2018; pp. 4371–4374. [Google Scholar]
- Liu, X.; Yang, X.; Jin, J.; Li, J. Self-Adaptive Signal Separation for Non-Contact Heart Rate Estimation from Facial Video in Realistic Environments. Physiol. Meas. 2018, 39, 06NT01. [Google Scholar] [CrossRef]
- Cobos-Torres, J.-C.; Abderrahim, M.; Martínez-Orgado, J. Non-Contact, Simple Neonatal Monitoring by Photoplethysmography. Sensors 2018, 18, 4362. [Google Scholar] [CrossRef] [Green Version]
- Paul, M.; Karthik, S.; Joseph, J.; Sivaprakasam, M.; Kumutha, J.; Leonhardt, S.; Hoog Antink, C. Non-Contact Sensing of Neonatal Pulse Rate Using Camera-Based Imaging: A Clinical Feasibility Study. Physiol. Meas. 2020, 41, 024001. [Google Scholar] [CrossRef]
- Addison, P.S.; Jacquel, D.; Foo, D.M.H.; Borg, U.R. Video-Based Heart Rate Monitoring across a Range of Skin Pigmentations during an Acute Hypoxic Challenge. J. Clin. Monit. Comput. 2018, 32, 871–880. [Google Scholar] [CrossRef] [Green Version]
- Shirbani, F.; Hui, N.; Tan, I.; Butlin, M.; Avolio, A.P. Effect of Ambient Lighting and Skin Tone on Estimation of Heart Rate and Pulse Transit Time from Video Plethysmography. In Proceedings of the 2020 42nd Annual International Conference of the IEEE Engineering in Medicine & Biology Society (EMBC), Montreal, QC, Canada, 20–24 July 2020; pp. 2642–2645. [Google Scholar]
- Tang, C.; Lu, J.; Liu, J. Non-Contact Heart Rate Monitoring by Combining Convolutional Neural Network Skin Detection and Remote Photoplethysmography via a Low-Cost Camera. In Proceedings of the 2018 IEEE/CVF Conference on Computer Vision and Pattern Recognition Workshops (CVPRW), Salt Lake City, UT, USA, 18–22 June 2018; pp. 1309–1315. [Google Scholar]
- Zhou, Y.; Ni, H.; Zhang, Q.; Wu, Q. The Noninvasive Blood Pressure Measurement Based on Facial Images Processing. IEEE Sens. J. 2019, 19, 10624–10634. [Google Scholar] [CrossRef]
- Liu, L.; Zhao, Y.; Kong, L.; Liu, M.; Dong, L.; Ma, F.; Pang, Z. Robust Real-Time Heart Rate Prediction for Multiple Subjects from Facial Video Using Compressive Tracking and Support Vector Machine. J. Med. Imag. 2018, 5, 024503. [Google Scholar] [CrossRef]
- McGinnis, R.S.; McGinnis, E.W.; Petrillo, C.; Ferri, J.; Scism, J.; Price, M. Validation of Smartphone Based Heart Rate Tracking for Remote Treatment of Panic Attacks. IEEE J. Biomed. Health Inform. 2021, 25, 656–662. [Google Scholar] [CrossRef]
- Shoushan, M.M.; Reyes, B.A.; Rodriguez, A.M.; Chong, J.W. Non-Contact HR Monitoring via Smartphone and Webcam During Different Respiratory Maneuvers and Body Movements. IEEE J. Biomed. Health Inform. 2021, 25, 602–612. [Google Scholar] [CrossRef] [PubMed]
- Bieber, G.; Antony, N.; Haescher, M. Touchless Heart Rate Recognition by Robots to Support Natural Human-Robot Communication. In Proceedings of the 11th PErvasive Technologies Related to Assistive Environments Conference, Corfu, Greece, 26 June 2018; pp. 415–420. [Google Scholar]
- Maki, Y.; Monno, Y.; Yoshizaki, K.; Tanaka, M.; Okutomi, M. Inter-Beat Interval Estimation from Facial Video Based on Reliability of BVP Signals. In Proceedings of the 2019 41st Annual International Conference of the IEEE Engineering in Medicine and Biology Society (EMBC), Berlin, Germany, 23–27 July 2019; pp. 6525–6528. [Google Scholar]
- Takahashi, R.; Ogawa-Ochiai, K.; Tsumura, N. Non-Contact Method of Blood Pressure Estimation Using Only Facial Video. Artif. Life Robot. 2020, 25, 343–350. [Google Scholar] [CrossRef]
- McDuff, D.J.; Blackford, E.B.; Estepp, J.R. Fusing Partial Camera Signals for Noncontact Pulse Rate Variability Measurement. IEEE Trans. Biomed. Eng. 2018, 65, 1725–1739. [Google Scholar] [CrossRef] [PubMed]
- Perepelkina, O.; Artemyev, M.; Churikova, M.; Grinenko, M. HeartTrack: Convolutional Neural Network for Remote Video-Based Heart Rate Monitoring. In Proceedings of the 2020 IEEE/CVF Conference on Computer Vision and Pattern Recognition Workshops (CVPRW), Seattle, WA, USA, 14–19 June 2020; pp. 1163–1171. [Google Scholar]
- Gonzalez Viejo, C.; Fuentes, S.; Torrico, D.; Dunshea, F. Non-Contact Heart Rate and Blood Pressure Estimations from Video Analysis and Machine Learning Modelling Applied to Food Sensory Responses: A Case Study for Chocolate. Sensors 2018, 18, 1802. [Google Scholar] [CrossRef] [Green Version]
- Yang, D.; Xiao, G.; Wei, J.; Luo, H. Preliminary Assessment of Video-Based Blood Pressure Measurement According to ANSI/AAMI/ISO81060-2:2013 Guideline Accuracy Criteria: Anura Smartphone App with Transdermal Optimal Imaging Technology. Blood Press. Monit. 2020, 25, 295–298. [Google Scholar] [CrossRef]
- Laurie, J.; Higgins, N.; Peynot, T.; Fawcett, L.; Roberts, J. An Evaluation of a Video Magnification-Based System for Respiratory Rate Monitoring in an Acute Mental Health Setting. Int. J. Med. Inform. 2021, 148, 104378. [Google Scholar] [CrossRef]
- Kwasniewska, A.; Szankin, M.; Ruminski, J.; Kaczmarek, M. Evaluating Accuracy of Respiratory Rate Estimation from Super Resolved Thermal Imagery. In Proceedings of the 2019 41st Annual International Conference of the IEEE Engineering in Medicine and Biology Society (EMBC), Berlin, Germany, 23–27 July 2019; pp. 2744–2747. [Google Scholar]
- Oiwa, K.; Bando, S.; Nozawa, A. Contactless Blood Pressure Sensing Using Facial Visible and Thermal Images. Artif. Life Robot. 2018, 23, 387–394. [Google Scholar] [CrossRef]
- Dagdanpurev, S.; Sun, G.; Choimaa, L.; Abe, S.; Matsui, T. Clinical Application of Multiple Vital Signs-Based Infection Screening System in a Mongolian Hospital: Optimization of Facial Temperature Measurement by Thermography at Various Ambient Temperature Conditions Using Linear Regression Analysis. In Proceedings of the 2018 40th Annual International Conference of the IEEE Engineering in Medicine and Biology Society (EMBC), Honolulu, HI, USA, 17–21 July 2018; pp. 5313–5316. [Google Scholar]
- Kwon, H.-M.; Ikeda, K.; Kim, S.-H.; Thiele, R.H. Non-Contact Thermography-Based Respiratory Rate Monitoring in a Post-Anesthetic Care Unit. J. Clin. Monit. Comput. 2020, 35, 1291–1297. [Google Scholar] [CrossRef]
- Xie, K.; Fu, C.-H.; Liang, H.; Hong, H.; Zhu, X. Non-Contact Heart Rate Monitoring for Intensive Exercise Based on Singular Spectrum Analysis. In Proceedings of the 2019 IEEE Conference on Multimedia Information Processing and Retrieval (MIPR), San Jose, CA, USA, 28–30 March 2019; pp. 228–233. [Google Scholar]
- Prakash, S.K.A.; Tucker, C.S. Bounded Kalman Filter Method for Motion-Robust, Non-Contact Heart Rate Estimation. Biomed. Opt. Express 2018, 9, 873. [Google Scholar] [CrossRef]
- Negishi, T.; Abe, S.; Matsui, T.; Liu, H.; Kurosawa, M.; Kirimoto, T.; Sun, G. Contactless Vital Signs Measurement System Using RGB-Thermal Image Sensors and Its Clinical Screening Test on Patients with Seasonal Influenza. Sensors 2020, 20, 2171. [Google Scholar] [CrossRef] [Green Version]
- Chuang, Y.T.; Lai, S.J.; Chang, T.F.; Lin, Y.H. Image-Based Skin Temperature and Pulse Rate Measuring System. In Proceedings of the 2020 IEEE International Conference on Consumer Electronics—Taiwan (ICCE-Taiwan), Taoyuan, Taiwan, 28–30 September 2020; pp. 1–2. [Google Scholar]
- Soleymani, M.; Lichtenauer, J.; Pun, T.; Pantic, M. A Multimodal Database for Affect Recognition and Implicit Tagging. IEEE Trans. Affect. Comput. 2012, 3, 42–55. [Google Scholar] [CrossRef] [Green Version]
- Koelstra, S.; Muhl, C.; Soleymani, M.; Lee, J.-S.; Yazdani, A.; Ebrahimi, T.; Pun, T.; Nijholt, A.; Patras, I. DEAP: A Database for Emotion Analysis; Using Physiological Signals. IEEE Trans. Affect. Comput. 2012, 3, 18–31. [Google Scholar] [CrossRef] [Green Version]
- Bobbia, S.; Macwan, R.; Benezeth, Y.; Mansouri, A.; Dubois, J. Unsupervised Skin Tissue Segmentation for Remote Photoplethysmography. Pattern Recognit. Lett. 2019, 124, 82–90. [Google Scholar] [CrossRef]
- Stricker, R.; Muller, S.; Gross, H.-M. Non-Contact Video-Based Pulse Rate Measurement on a Mobile Service Robot. In Proceedings of the the 23rd IEEE International Symposium on Robot and Human Interactive Communication, Edinburgh, UK, 25–29 August 2014; pp. 1056–1062. [Google Scholar]
- Niu, X.; Han, H.; Shan, S.; Chen, X. VIPL-HR: A Multi-Modal Database for Pulse Estimation from Less-Constrained Face Video. arXiv 2018, arXiv:1810.04927. [Google Scholar]
- Heusch, G.; Anjos, A.; Marcel, S. A Reproducible Study on Remote Heart Rate Measurement. arXiv 2017, arXiv:1709.00962. [Google Scholar]
- HCI Tagging Database—Home. Available online: https://mahnob-db.eu/hci-tagging (accessed on 8 May 2022).
- DEAP: A Dataset for Emotion Analysis Using Physiological and Audiovisual Signals. Available online: https://www.eecs.qmul.ac.uk/mmv/datasets/deap/ (accessed on 8 May 2022).
- FAVIP Database. Available online: https://spire.ee.iisc.ac.in/spire/database.php (accessed on 23 May 2022).
- Ryu, J.; Hong, S.; Liang, S.; Pak, S.; Chen, Q.; Yan, S. Research on the Combination of Color Channels in Heart Rate Measurement Based on Photoplethysmography Imaging. J. Biomed. Opt. 2021, 26, 025003. [Google Scholar] [CrossRef]
- Benezeth, Y. UBFCrPPG. Available online: https://sites.google.com/view/ybenezeth/ubfcrppg (accessed on 8 May 2022).
- Pulse Rate Detection Dataset-PURE. Available online: https://www.tu-ilmenau.de/en/university/departments/department-of-computer-science-and-automation/profile/institutes-and-groups/institute-of-computer-and-systems-engineering/group-for-neuroinformatics-and-cognitive-robotics/data-sets-code/pulse-rate-detection-dataset-pure (accessed on 8 May 2022).
- Hsu, G.-S.; Ambikapathi, A.; Chen, M.-S. Deep Learning with Time-Frequency Representation for Pulse Estimation from Facial Videos. In Proceedings of the 2017 IEEE International Joint Conference on Biometrics (IJCB), Denver, CO, USA, 1–4 October 2017; pp. 383–389. [Google Scholar]
- VIPL-HR Database. Available online: https://vipl.ict.ac.cn/zygx/sjk/201811/t20181129_32716.html (accessed on 8 May 2022).
- COHFACE | Zenodo. Available online: https://zenodo.org/record/4081054#.YosWt1RBy3A (accessed on 23 May 2022).
- Technology-MMSE-HR Dataset (Multimodal Spontaneous Expression-Heart Rate Dataset). Available online: https://binghamton.technologypublisher.com/tech/MMSE-HR_dataset_(Multimodal_Spontaneous_Expression-Heart_Rate_dataset) (accessed on 8 May 2022).
- TokyoTech Remote PPG Dataset. Available online: http://www.ok.sc.e.titech.ac.jp/res/VitalSensing/remoteIBI/Dataset.html (accessed on 8 May 2022).
- MR-NIRP Database. Available online: https://computationalimaging.rice.edu/mr-nirp-dataset/ (accessed on 8 May 2022).
- Ronca, V.; Giorgi, A.; Rossi, D.; Di Florio, A.; Di Flumeri, G.; Aricò, P.; Sciaraffa, N.; Vozzi, A.; Tamborra, L.; Simonetti, I.; et al. A Video-Based Technique for Heart Rate and Eye Blinks Rate Estimation: A Potential Solution for Telemonitoring and Remote Healthcare. Sensors 2021, 21, 1607. [Google Scholar] [CrossRef]
- Hochhausen, N.; Barbosa Pereira, C.; Leonhardt, S.; Rossaint, R.; Czaplik, M. Estimating Respiratory Rate in Post-Anesthesia Care Unit Patients Using Infrared Thermography: An Observational Study. Sensors 2018, 18, 1618. [Google Scholar] [CrossRef] [Green Version]
- Lee, K.; Park, D.; Cho, C.; Ko, H. Robust Remote Heart Rate Estimation in Car Driving Environment. In Proceedings of the 2018 IEEE International Conference on Consumer Electronics (ICCE), Las Vegas, NV, USA, 12–14 January 2018; pp. 1–2. [Google Scholar]
- Zheng, K.; Ci, K.; Cui, J.; Kong, J.; Zhou, J. Non-Contact Heart Rate Detection When Face Information Is Missing during Online Learning. Sensors 2020, 20, 7021. [Google Scholar] [CrossRef]
- Selvaraju, V.; Spicher, N.; Swaminathan, R.; Deserno, T.M. Face Detection from In-Car Video for Continuous Health Monitoring. In Proceedings of the SPIE Medical Imaging: Imaging Informatics for Healthcare, Research, and Applications, San Diego, CA, USA, 4 April 2022; Volume 12037, pp. 49–56. [Google Scholar]
- Zhang, Q.; Zhou, Y.; Song, S.; Liang, G.; Ni, H. Heart Rate Extraction Based on Near-Infrared Camera: Towards Driver State Monitoring. IEEE Access 2018, 6, 33076–33087. [Google Scholar] [CrossRef]
- Lee, K.; Lee, J.; Ha, C.; Han, M.; Ko, H. Video-Based Contactless Heart-Rate Detection and Counting via Joint Blind Source Separation with Adaptive Noise Canceller. Appl. Sci. 2019, 9, 4349. [Google Scholar] [CrossRef] [Green Version]
- Cai, K.; Chen, J.; Zhang, L.; Lin, Q.; Ji, H. A Passive Heart Rate Measurement Method Using Camera. In Proceedings of the 2018 International Conference on Computing and Pattern Recognition—ICCPR ’18, Shenzhen, China, 23–25 June 2018; pp. 68–72. [Google Scholar]
- Fujita, Y.; Hiromoto, M.; Sato, T. Fast And Robust Heart Rate Estimation From Videos Through Dynamic Region Selection. In Proceedings of the 2018 40th Annual International Conference of the IEEE Engineering in Medicine and Biology Society (EMBC), Honolulu, HI, USA, 17–21 July 2018; pp. 3024–3027. [Google Scholar]
- Le, D.Q.; Lie, W.-N.; Nhu, Q.N.Q.; Nguyen, T.T.A. Heart Rate Estimation Based on Facial Image Sequence. In Proceedings of the 2020 5th International Conference on Green Technology and Sustainable Development (GTSD), Ho Chi Minh City, Vietnam, 27–28 November 2020; pp. 449–453. [Google Scholar]
- Zhu, M.; He, Y.; He, Q. A Review of Researches on Deep Learning in Remote Sensing Application. IJG 2019, 10, 1–11. [Google Scholar] [CrossRef] [Green Version]
- Gutstein, S. Remote Photoplethysmography for Cardiovascular Monitoring; AD1080252; Defense Technical Information Center: Fort Belvoir, VA, USA, 2019; pp. 1–37. [Google Scholar]
- Yu, Z.; Peng, W.; Li, X.; Hong, X.; Zhao, G. Remote Heart Rate Measurement from Highly Compressed Facial Videos: An End-to-End Deep Learning Solution with Video Enhancement. arXiv 2019, arXiv:1907.11921. [Google Scholar]
- Pai, A.; Veeraraghavan, A.; Sabharwal, A. HRVCam: Robust Camera-Based Measurement of Heart Rate Variability. J. Biomed. Opt. 2021, 26, 022707. [Google Scholar] [CrossRef] [PubMed]
- Li, F.; Zhao, Y.; Kong, L.; Dong, L.; Liu, M.; Hui, M.; Liu, X. A Camera-Based Ballistocardiogram Heart Rate Measurement Method. Rev. Sci. Instrum. 2020, 91, 054105. [Google Scholar] [CrossRef] [PubMed]
- Chen, L.; Liu, N.; Hu, M.; Zhai, G. RGB-Thermal Imaging System Collaborated with Marker Tracking for Remote Breathing Rate Measurement. In Proceedings of the 2019 IEEE Visual Communications and Image Processing (VCIP), Sydney, Australia, 1–4 December 2019; pp. 1–4. [Google Scholar]
- Wu, H.; Wang, T.; Dai, T.; Lin, Y.; Wang, Y. A Real-Time Vision-Based Heart Rate Measurement Framework for Home Nursing Assistance. In Proceedings of the 3rd International Conference on Crowd Science and Engineering, Singapore, 28–31 July 2018; pp. 1–7. [Google Scholar]
- Huang, P.-W.; Wu, B.-J.; Wu, B.-F. A Heart Rate Monitoring Framework for Real-World Drivers Using Remote Photoplethysmography. IEEE J. Biomed. Health Inform. 2021, 25, 1397–1408. [Google Scholar] [CrossRef] [PubMed]
- Nageotte, M.P. Fetal Heart Rate Monitoring. Semin. Fetal Neonatal Med. 2015, 20, 144–148. [Google Scholar] [CrossRef]
- Hill, B.; Annesley, S.H. Monitoring Respiratory Rate in Adults. Br. J. Nurs. 2020, 29, 12–16. [Google Scholar] [CrossRef]
- Sylvia S, M. Understanding Human Anatomy & Physiology, 5th ed.; WCB/McGraw-Hill: New York, NY, USA, 2004. [Google Scholar]
- Luo, H.; Yang, D.; Barszczyk, A.; Vempala, N.; Wei, J.; Wu, S.J.; Zheng, P.P.; Fu, G.; Lee, K.; Feng, Z.-P. Smartphone-Based Blood Pressure Measurement Using Transdermal Optical Imaging Technology. Circ. Cardiovasc. Imaging 2019, 12, e008857. [Google Scholar] [CrossRef] [Green Version]
- Okada, G.; Mitsuhashi, R.; Kagawa, K.; Kawahito, S.; Tsumura, N. Noncontact Heart Rate Measurement Using a High-Sensitivity Camera in a Low-Light Environment. Artif. Life Robot. 2019, 24, 6–11. [Google Scholar] [CrossRef]
- Qi, L.; Yu, H.; Xu, L.; Mpanda, R.S.; Greenwald, S.E. Robust Heart-Rate Estimation from Facial Videos Using Project_ICA. Physiol. Meas. 2019, 40, 085007. [Google Scholar] [CrossRef] [PubMed]
- Lewandowska, M.; Nowak, J. Measuring Pulse Rate with a Webcam. J. Med. Imaging Health Inform. 2012, 2, 87–92. [Google Scholar] [CrossRef]
- Poh, M.-Z.; McDuff, D.J.; Picard, R.W. Advancements in Noncontact, Multiparameter Physiological Measurements Using a Webcam. IEEE Trans. Biomed. Eng. 2011, 58, 7–11. [Google Scholar] [CrossRef] [PubMed] [Green Version]
- Poh, M.-Z.; McDuff, D.J.; Picard, R.W. Non-Contact, Automated Cardiac Pulse Measurements Using Video Imaging and Blind Source Separation. Opt. Express 2010, 18, 10762. [Google Scholar] [CrossRef]
- Gauci, L.; Falzon, O.; Camilleri, K.P. PCA-Driven Detection and Enhancement of Microchanges in Video Data Associated with Heart Rate. In Proceedings of the 2019 41st Annual International Conference of the IEEE Engineering in Medicine and Biology Society (EMBC), Berlin, Germany, 23–27 July 2019; pp. 3892–3895. [Google Scholar]
- Boccignone, G.; Conte, D.; Cuculo, V.; D’Amelio, A.; Grossi, G.; Lanzarotti, R. An Open Framework for Remote-PPG Methods and Their Assessment. IEEE Access 2020, 8, 216083–216103. [Google Scholar] [CrossRef]
- Wang, W.; Stuijk, S.; de Haan, G. A Novel Algorithm for Remote Photoplethysmography: Spatial Subspace Rotation. IEEE Trans. Biomed. Eng. 2016, 63, 1974–1984. [Google Scholar] [CrossRef]
- Zheng, K.; Ci, K.; Li, H.; Shao, L.; Sun, G.; Liu, J.; Cui, J. Heart Rate Prediction from Facial Video with Masks Using Eye Location and Corrected by Convolutional Neural Networks. Biomed. Signal Processing Control 2022, 75, 103609. [Google Scholar] [CrossRef]
- Huang, B.; Chang, C.-M.; Lin, C.-L.; Chen, W.; Juang, C.-F.; Wu, X. Visual Heart Rate Estimation from Facial Video Based on CNN. In Proceedings of the 2020 15th IEEE Conference on Industrial Electronics and Applications (ICIEA), Kristiansand, Norway, 9–13 November 2020; pp. 1658–1662. [Google Scholar]
- Task Force of the European Society of Cardiology the North American Society of Pacing Electrophysiology. Heart Rate Variability: Standards of Measurement, Physiological Interpretation, and Clinical Use. Circulation 1996, 93, 1043–1065. [Google Scholar] [CrossRef] [Green Version]
- Becker, C.; Achermann, S.; Rocque, M.; Kirenko, I.; Schlack, A.; Dreher-Hummel, T.; Zumbrunn, T.; Bingisser, R.; Nickel, C.H. Camera-Based Measurement of Respiratory Rates Is Reliable. Eur. J. Emerg. Med. 2018, 25, 416–422. [Google Scholar] [CrossRef]
- Jakkaew, P.; Onoye, T. An Approach to Non-Contact Monitoring of Respiratory Rate and Breathing Pattern Based on Slow Motion Images. In Proceedings of the 2019 IEEE International Conference on Consumer Electronics—Asia (ICCE-Asia), Bangkok, Thailand, 12–14 June 2019; pp. 47–51. [Google Scholar]
- Sugita, N.; Yoshizawa, M.; Abe, M.; Tanaka, A.; Homma, N.; Yambe, T. Contactless Technique for Measuring Blood-Pressure Variability from One Region in Video Plethysmography. J. Med. Biol. Eng. 2019, 39, 76–85. [Google Scholar] [CrossRef]
- Kurihara, K.; Sugimura, D.; Hamamoto, T. Adaptive Fusion of RGB/NIR Signals Based on Face/Background Cross-Spectral Analysis for Heart Rate Estimation. In Proceedings of the 2019 IEEE International Conference on Image Processing (ICIP), Taipei, Taiwan, 22–25 September 2019; pp. 4534–4538. [Google Scholar]
- Zhou, L.; Yin, M.; Xu, X.; Yuan, X.; Liu, X. Non-Contact Detection of Human Heart Rate with Kinect. Clust. Comput 2019, 22, 8199–8206. [Google Scholar] [CrossRef]
- Alonso-Cuevas, J.L.; Sanchez-Yanez, R.E. Simplified Heart Rate Measurement from Video. In Proceedings of the 3rd International Workshop on Interactive and Spatial Computing, Richardson, TX, USA, 12–13 April 2018; pp. 23–28. [Google Scholar]
- Zhu, Q.; Wong, C.-W.; Fu, C.-H.; Wu, M. Fitness Heart Rate Measurement Using Face Videos. In Proceedings of the 2017 IEEE International Conference on Image Processing (ICIP), Beijing, China, 17–20 September 2017; pp. 2000–2004. [Google Scholar]
- Pursche, T.; Claus, R.; Tibken, B.; Moller, R. Using the Hilbert-Huang Transform to Increase the Robustness of Video Based Remote Heart-Rate Measurement from Human Faces. In Proceedings of the 2018 IEEE 8th International Conference on Consumer Electronics—Berlin (ICCE-Berlin), Berlin, Germany, 2–5 September 2018; pp. 1–4. [Google Scholar]
- Bastardot, F.; Marques-Vidal, P.; Vollenweider, P. Association of Body Temperature with Obesity. The CoLaus Study. Int. J. Obes. 2019, 43, 1026–1033. [Google Scholar] [CrossRef] [PubMed] [Green Version]
- Maharatna, K.; Mazomenos, E.B.; Morgan, J.; Bonfiglio, S. Towards the Development of Next-Generation Remote Healthcare System: Some Practical Considerations. In Proceedings of the 2012 IEEE International Symposium on Circuits and Systems, Seoul, Korea, 20–23 May 2012; pp. 1–4. [Google Scholar]
- Talmon, J.; Ammenwerth, E.; Brender, J.; Dekeizer, N.; Nykanen, P.; Rigby, M. STARE-HI—Statement on Reporting of Evaluation Studies in Health Informatics. Int. J. Med. Inform. 2009, 78, 1–9. [Google Scholar] [CrossRef] [PubMed]
- Meratwal, M.; Spicher, N.; Deserno, T.M. Multi-Camera and Multi-Person Indoor Activity Recognition for Continuous Health Monitoring Using Long Short Term Memory. In Proceedings of the Medical Imaging 2022: Imaging Informatics for Healthcare, Research, and Applications, San Diego, CA, USA, 4 April 2022; Volume 12037, pp. 64–71. [Google Scholar]
- Xu, K. Silicon Electro-Optic Micro-Modulator Fabricated in Standard CMOS Technology as Components for All Silicon Monolithic Integrated Optoelectronic Systems. J. Micromech. Microeng. 2021, 31, 054001. [Google Scholar] [CrossRef]
- McDuff, D.; Hurter, C. InPhysible: Camouflage Against Video-Based Physiological Measurement. In Proceedings of the 2018 40th Annual International Conference of the IEEE Engineering in Medicine and Biology Society (EMBC), Honolulu, HI, USA, 17–21 July 2018; pp. 5784–5789. [Google Scholar]
- Kalmeda. Die Mobile Tinnitus-Therapie Auf Rezept. Available online: https://www.kalmeda.de (accessed on 10 May 2022).

| Article Year | HR | RR | BP | BST | SpO2 | Multiple | Total |
|---|---|---|---|---|---|---|---|
| 2018 | 25 | 2 | 1 | 1 | 0 | 7 | 36 |
| 2019 | 14 | 9 | 3 | 0 | 0 | 3 | 29 |
| 2020 | 16 | 5 | 2 | 1 | 0 | 3 | 27 |
| 2021 | 5 | 4 | 0 | 0 | 1 | 2 | 12 |
| Total | 60 | 20 | 6 | 2 | 1 | 15 | 104 |
| Database | No. of Subjects | Camera Type | Camera Detail | Frame Rate (fps) | Resolution (px × px) | Ground Truth |
|---|---|---|---|---|---|---|
| MAHNOB-HCI [133,139] | 27 | RGB | Allied Vision Stingray F-046C; F-046B | 60 | 780 × 580 | ECG |
| DEAP [134,140] | 22 | RGB | Sony DCR-HC27E | 50 | 720 × 576 | PPG, Respiration, EEG, EOG, EMG, GSR, BT |
| FAVIP [83,141] | 15 | RGB | Samsung galaxy S3 and iPhone 3GS | 30 | 1280 × 720 | Pulse oximeter |
| UBFC-RPPG [135,142,143] | 42 | RGB | Logitech C920 HD pro | 30 | 640 × 480 | Pulse oximeter |
| PURE [136,144] | 10 | RGB | evo274CVGE | 30 | 640 × 480 | Finger pulse oximeter |
| Pulse from face [78,145] | 13 | RGB | Nikon D5300 camera | 50 | 1280 × 720 | Two Mio Alpha II wrist heart rate monitors |
| VIPL_HR [137,146] | 107 | RGB | Logitech C310 | 25 | 960 × 720 | CONTEC CMS60C blood volume pulse recorder |
| NIR | Realsense F200 | 30 | 640 × 480 | |||
| RGB | 30 | 1920 × 1080 | ||||
| RGB | HUAWEI P9 smart phone | 30 | 1920 × 1080 | |||
| COHFACE [138,147] | 40 | RGB | Logitech HD C525 | 20 | 640 × 480 | Blood volume pulse sensor, respiratory belt |
| MMSE-HR [80,148] | 40 | RGB, IR | Di3D dynamic imaging system, FLIR A655sc | 25 | 1040 × 1392 | Biopac MP150 system—BP, HR |
| 50 | 640 × 480 | |||||
| TokyoTech Remote PPG [118,149] | 9 | RGB, NIR | Prototype RGB-NIR camera | 300 | 640 × 480 | Contact PPG sensor |
| MR-NIRP [41,150] | 18 | RGB, NIR | FLIR Grasshopper3, Point Grey Grasshopper | 30 | 640 × 640 | Finger pulse oximeter |
| Filtering | Description |
|---|---|
| Detrending filter [89,92,99,113,130,153,154,160] | It removes the trend in signal |
| Moving average filter [29,55,116,125,126,132,154,166] | It smooths a signal and suppresses high frequency noise |
| Band-pass filter [52,75,80,95,98,109,116,122,126,132,152,167] | It eliminates the frequency components outside the bandwidth range |
| Signal Processing Techniques | Characterization |
|---|---|
| ICA [176,177] | It decomposes the signal and extracts independent components of pulse information from temporal RGB traces. |
| PCA [51,53,175,178] | It utilizes a statistical technique to obtain uncorrelated components from RGB traces [151]. |
| GREEN [38,104,130] | In blood, hemoglobin and oxyhemoglobin absorb light of 520–580 nm, which is in the range of the camera’s green filter [38,104,130]. Hemoglobin absorbs green light in sufficient depth [81]. Therefore, the green channel is reported to have more information compared to blue or red channels [179]. |
| CHROM [162] | A linear combination of chrominance signals with the assumption of skin color necessitates a priori knowledge and eliminates motion artifacts but it may fail if pulse and specular signals are same [59]. |
| POS [116] | It projects the RGB-derived signals onto a plane orthogonal to the temporally normalized skin tone component. |
| Spatial subspace rotation [162,180] | It utilizes the subspace of skin pixels and rotation measurements for extracting cardiac pulse information but it may require complete continuous sequence of camera frames to recover the pulse wave [120]. |
| Kernel density ICA [59] | It does not require a prior assumption of probability distributions of hidden sources and so-called semi-BSS method. |
| Ref. | Camera Type | Camera Details | Frame Rate (fps) | Resolution (px × px) | ROI | Ground Truth | Results |
|---|---|---|---|---|---|---|---|
| [152] | FIR | Infratec VarioCAM HD head | 30 | 1024 × 768 | Nose | Philips IntelliVue MP30 monitor | Correlation coefficient (CC): 0.607 upon arrival, 0.849 upon discharge |
| [29] | FIR | Optrics PI 450 | 80 | 382 × 288 | Nose | Manual counting | CC: near distance: 0.960; far distance: 0.508; |
| [27] | FIR | InfraTec VarioCAM HD head | 30 | 1024 × 768 | Full frame and split into sub-ROI | Adults: Respiratory belt, Infants: Dräger M540 patient monitor | Root mean square error (RMSE): healthy adults: (sit still: 0.31 ± 0.09 cpm, stimulated breathing: 3.27 ± 0.72 cpm), infants: 4.15 ± 1.44 cpm |
| [125] | FIR | FLIR SC3000 | 30 | 320 × 240 | Nostril area and mouth, nose and cheeks enclosed | Subject finger flexion (upward–inhalation, downward–exhalation) | RMSE: 3.40 cpm |
| [94] | FIR | Optrics PI-450 | 27 | 382 × 288 | Nose | Manual | RMSE: stay still: 3.81 cpm, moving: 6.20 cpm |
| [25] | FIR | FLIR Lepton 2.5, FLIR lepton 3.5 | 8.7 | 60 × 80; 120 × 160 | Full frame | Philips MX700 patient monitor | Mean absolute error (MAE): 2.07 cpm |
| [32] | FIR | Seek Thermal Compact PRO for iPhone | 17 | 640 × 480 | Highest temperature point and around it | Respiration belt | RMSE: 1.82 ± 0.75 cpm |
| [128] | FIR | FLIR T450sc | 30 | - | Nose | GE healthcare patient monitor, visual inspection | CC: 0.95 |
| [57] | FIR | Infratec ImageIR 9300 | 50 | 1024 × 768 | Nose | piezo plethysmography, IntelliVue MP70 patient monitor | RMSE: 0.71 ± 0.30 cpm |
| [31] | FIR | FLIR T-420 | 10 | 320 × 240 | Nostril | Respiratory volume monitor | CC: 0.86 before sedation |
| [131] | RGB; FIR | Dual camera DFK23U618; FLIR A315 | 15 | 640 × 480; 320 × 240 | Nose and mouth | Respiration effort belt | CC: 0.87; RMSE: 1.73 cpm |
| [106] | RGB; FIR | Dual camera DFK23U618; FLIR A315 | 15 | 640 × 480; 320 × 240 | Nasal area | Respiratory effort belt | RMSE: standing: 1.44 cpm, seated position with body movement: 2.52 cpm |
| [166] | RGB, FIR | MAG62 thermal imager | 10 | 640 × 480 | Nostril region | Sleep respiratory monitor | Coefficient of determination: 0.905 |
| [60] | NIR; FIR | NIR: see3cam_CU40, FIR: FLIR lepton version 3.5 | 15; 8.7 | 336 × 190, 160 × 120 | Chest, Nostril | Respiratory belt | RMSE: 4.44 cpm |
| [26] | RGB; FIR | RGB: IDS UI-2220SE; FIR: FLIR Lepton 2.5 | 20; 8.7 | 576 × 768; 60 × 80 | Full frame | Philips patient monitor | MAE: 5.36 cpm |
| [124] | RGB | Point Grey Flea 3 GigE | - | 648 × 488 | Chest | Polysomnography | Mean error: non magnified: 0.874 cpm; magnified: 0.67 cpm |
| [24] | RGB | IP camera | 10 | 320 × 180 | Full frame | ECG impedance pneumography | CC: 0.948; RMSE: 6.36 cpm |
| [184] | RGB | IDS uEye-2220 | 20 | -- | Torso | Capnography | All clothing styles and respiratory patters (CC: 0.90–1.00) except winter coat-slow-deep scenario (CC:0.84) |
| [108] | RGB | Digital camera | 24/30 | 1920 × 1080 /1280 × 720 | Abdominal area | Dräguer NICU monitor | CC: 0.86 |
| [91] | RGB | IDS UI-3160CP | 120 | 1920 × 1080 | Face | Upper chest signal | Error: −0.25 to 0.5 cpm |
| [53] | NIR | Point Grey Firefly MV USB 2.0 | 30 | 640 × 480 | Full frame | PSG, ECG, Inductance plethysmography | CC: 0.80; RMSE: 2.10 ± 1.64 cpm; MAE: 0.82 ± 0.89 cpm |
| [102] | RGB | Nikon D610, D5300 | 30 | 1920 × 1080 | Abdominal area | Philips intellivue monitor | Limits of agreement: −22 to 23.6 cpm |
| [105] | RGB | CCD camera | 30 | 1280 × 720 | Jugular notch | Differential digital pressure sensor | MAE: 0.39 cpm; Limits of agreements: (slim fit: ±0.98 cpm, loose fit: ±1.07 cpm) |
| [43] | RGB | Smartphone LG G2 | 30 | - | Forehead | Visual inspection, Pulse oximeter, Heart rate monitor | RMSE: hue: 3.88 cpm; Green: 5.68 cpm |
| [89] | RGB | Logitech C922/ GigE Sony XCG-C30C | 60 | 1280 × 720/ 659 × 494 | Forehead, nose, cheeks | Respiratory belt | Relative error < 2% and inter quartile range < 5% |
| [51] | NIR | Monochromatic infrared camera | 62 | 640 × 240 | Neck area with chin and upper chest | Chest belt | CC: 0.99; RMSE: 0.70 cpm |
| [99] | RGB | JAI 3-CCD AT-200CL | 20 | 1620 × 1236 | Skin | Philips patient monitor | MAE: 3.5 cpm |
| [52] | NIR | Thermal imager MAG62, Avigilon H4 HD Dome | - | 640 × 480 | Chest | Manual | Coefficient of determination: dataset 1: 0.92, dataset 2: 0.87 |
| [185] | RGB | Smartphone Galaxy S9+ | 240 | 1920 × 1080 | Abdomen or waist area | Manual counting | Accuracy 99.09% |
| [56] | RGB | Canon camera | - | - | Cheeks enclosed | PPG sensor, Respiratory belt | RMSE: 2.16 cpm |
Publisher’s Note: MDPI stays neutral with regard to jurisdictional claims in published maps and institutional affiliations. |
© 2022 by the authors. Licensee MDPI, Basel, Switzerland. This article is an open access article distributed under the terms and conditions of the Creative Commons Attribution (CC BY) license (https://creativecommons.org/licenses/by/4.0/).
Share and Cite
Selvaraju, V.; Spicher, N.; Wang, J.; Ganapathy, N.; Warnecke, J.M.; Leonhardt, S.; Swaminathan, R.; Deserno, T.M. Continuous Monitoring of Vital Signs Using Cameras: A Systematic Review. Sensors 2022, 22, 4097. https://doi.org/10.3390/s22114097
Selvaraju V, Spicher N, Wang J, Ganapathy N, Warnecke JM, Leonhardt S, Swaminathan R, Deserno TM. Continuous Monitoring of Vital Signs Using Cameras: A Systematic Review. Sensors. 2022; 22(11):4097. https://doi.org/10.3390/s22114097
Chicago/Turabian StyleSelvaraju, Vinothini, Nicolai Spicher, Ju Wang, Nagarajan Ganapathy, Joana M. Warnecke, Steffen Leonhardt, Ramakrishnan Swaminathan, and Thomas M. Deserno. 2022. "Continuous Monitoring of Vital Signs Using Cameras: A Systematic Review" Sensors 22, no. 11: 4097. https://doi.org/10.3390/s22114097
APA StyleSelvaraju, V., Spicher, N., Wang, J., Ganapathy, N., Warnecke, J. M., Leonhardt, S., Swaminathan, R., & Deserno, T. M. (2022). Continuous Monitoring of Vital Signs Using Cameras: A Systematic Review. Sensors, 22(11), 4097. https://doi.org/10.3390/s22114097