Communication

Frequency-Domain Detection for Frequency-Division Multiplexing QEPAS

1
Jinlin Institute of Technology, Nanjing 211169, China
2
Hefei Institute of Physical Science, Chinese Academy of Sciences, Hefei 230031, China
3
University of Science and Technology of China, Hefei 230026, China
*
Author to whom correspondence should be addressed.
Sensors 2022, 22(11), 4030; https://doi.org/10.3390/s22114030
Submission received: 10 May 2022 / Revised: 18 May 2022 / Accepted: 25 May 2022 / Published: 26 May 2022

Abstract

:
To achieve multi-gas measurements of quartz-enhanced photoacoustic spectroscopy (QEPAS) sensors under a frequency-division multiplexing mode with a narrow modulation frequency interval, we report a frequency-domain detection method. A CH4 absorption line at 1653.72 nm and a CO2 absorption line at 2004.02 nm were investigated in this experiment. A modulation frequency interval of as narrow as 0.6 Hz for CH4 and CO2 detection was achieved. Frequency-domain 2f signals were obtained with a resolution of 0.125 Hz using a real-time frequency analyzer. With the multiple linear regressions of the frequency-domain 2f signals of various gas mixtures, small deviations within 2.5% and good linear relationships for gas detection were observed under the frequency-division multiplexing mode. Detection limits of 0.6 ppm for CH4 and 2.9 ppm for CO2 were simultaneously obtained. With the 0.6-Hz interval, the amplitudes of QEPAS signals will increase substantially since the modulation frequencies are closer to the resonant frequency of a QTF. Furthermore, the frequency-domain detection method with a narrow interval can realize precise gas measurements of more species with more lasers operating under the frequency-division multiplexing mode. Additionally, this method, with a narrow interval of modulation frequencies, can also realize frequency-division multiplexing detection for QEPAS sensors under low pressure despite the ultra-narrow bandwidth of the QTF.

1. Introduction

Quartz-enhanced photoacoustic spectroscopy (QEPAS) [1,2,3,4,5] is now widely employed in gas measurements due to its high sensitivity, zero baseline, and excellent anti-disturbance performance. With the implementation of QEPAS, a modulated laser beam is collimated and then focused between the prongs of a quartz tuning fork (QTF) [6,7,8]. Acoustic microresonators with optimal parameters and configurations are commonly employed to increase sensor sensitivity [9,10,11]. With the laser absorbed by target gases, an acoustic wave is generated through non-radiative relaxation and a piezoelectric current is generated by the mechanical vibration of the QTF prongs, which is then converted to an output voltage by a trans-impedance amplifier. With a lock-in amplifier, the photoacoustic signal, usually in its second harmonic (2f) regime, can hence be demodulated [12,13].
To detect multi-component gas mixtures with QEPAS, time-division multiplexing technology has been commonly adopted to regulate multiple lasers of different central wavelengths [14,15]. Diode lasers are controlled via switching modules to direct a single beam to the acoustic detection module separately. The response time would consequently degrade with the increase of gas species. An acoustic detection module based on multiple QTFs [16] or a QTF combining different resonate frequencies [17] can realize simultaneous gas detection. However, the alignment and processing technology of the special QTFs will be complicated. A frequency-division multiplexing QEPAS sensor has thus been demonstrated for accurate measurements of CH4 and CO2 with an ordinary acoustic detection module [18]. To eliminate interferences between 2f signals retrieved by lock-in amplifiers, the modulation frequencies must be set with a sufficient interval. Nevertheless, the frequency bandwidth of the QTF is usually several hertz and will decrease sharply at low pressure [19,20]. For example, the frequency bandwidth of the QTF is 2.5 Hz at atmospheric pressure [21]. For precise dual gas detection at atmospheric pressure under the frequency-division multiplexing mode, a 2.5-Hz difference of modulation frequencies is still within the bandwidth and will lead to interference-free 2f components. However, compared with the 2.5 Hz difference, the amplitudes of the QEPAS signal will increase substantially with a narrower difference, according to the QTF response, since the modulation frequencies will be closer to the resonant frequency of the QTF. For the fixed bandwidth of the QEPAS sensor, more gases can be detected simultaneously with more lasers operating under the frequency-division multiplexing mode if the frequency interval is narrower. Moreover, for gas detection of more than three species under the frequency-division multiplexing mode, the required bandwidth of the QTF should be larger than 5.0 Hz if the frequency difference is 2.5 Hz. Additionally, the required bandwidth will rise linearly with the increase of gas species. As a result, the required bandwidth will exceed the bandwidth of QTF for multi-gas detection with a relatively wide interval of modulation frequencies under the frequency-division multiplexing mode. Hence, a wider difference in modulation frequencies will cause a serious decline in the QEPAS signals for gas detection of more than three species at atmospheric pressure due to the limited bandwidth of the QTF. Commonly, the bandwidth of the QTF will decrease sharply at low pressure; the bandwidth of the QTF decreases to 0.9 Hz at 50 Torr [21]. For gas detection with low pressure, the 2.5 Hz difference already exceeds the 0.9-Hz bandwidth of the QTF and the QEPAS signals will decrease significantly. Hence, the wide difference in previous papers shows that precise gas detection under the frequency-division multiplexing mode at low pressure cannot be realized.
In this work, we introduce a frequency-domain detection method for frequency-division multiplexing QEPAS sensors with a narrow modulation frequency interval. A CH4 absorption line at 1653.72 nm and a CO2 absorption line at 2004.02 nm were investigated in this experiment. Modulation frequencies of 16,356.18 and 16,356.78 Hz for CH4 and CO2 detection with an interval of as narrow as 0.6 Hz were employed. Frequency-domain 2f signals were obtained with a resolution of 0.125 Hz using a real-time frequency analyzer. With the employment of multiple linear regressions [22], precise gas detection was achieved despite the serious interferences between the 2f components.

2. Principle of QEPAS
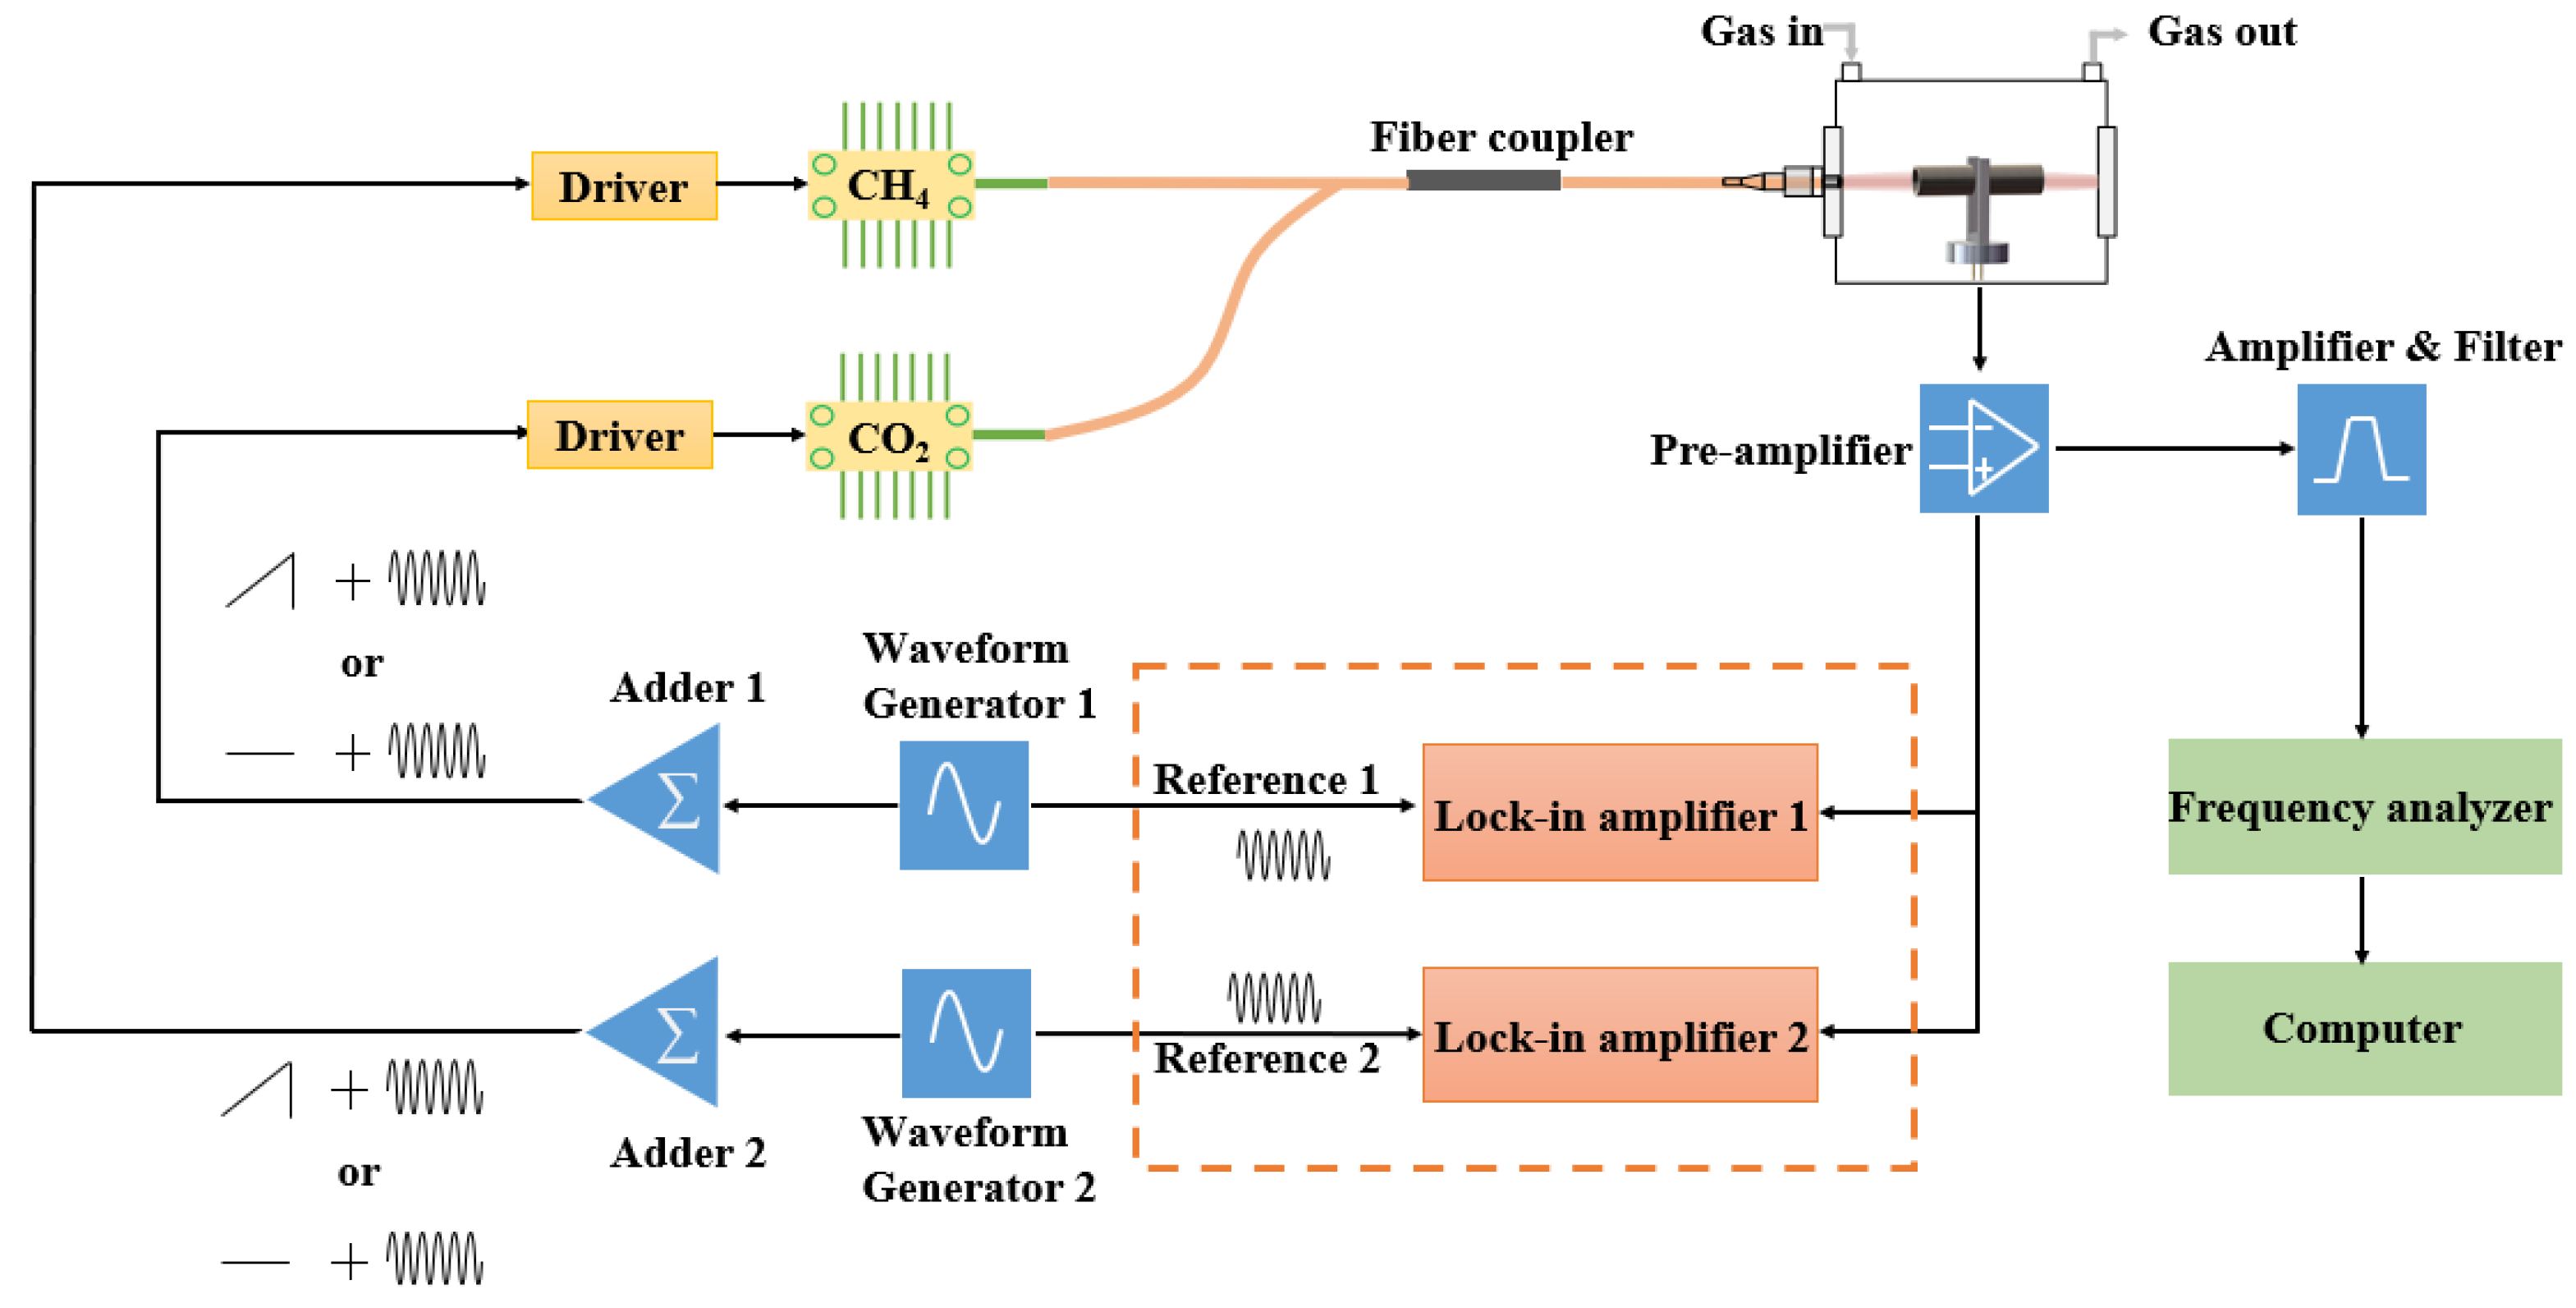
The QEPAS signal can be expressed as
S = K Q P c α ( v ) ε
where K is the sensor constant, Q is the quality factor of QTF, P is the laser power, c is the target gas mole fraction, α(v) is the absorption coefficient, and ε is the conversion efficiency. For gas detection of CH4 and CO2 with the frequency-division multiplexing mode, the detected frequency-domain 2f components can be treated as the superposition of the 2f components of CH4 and CO2
S 2 f = S C H 4 _ d + S C O 2 _ d
where SCH4_d is the CH4 signal and SCO2_d is the CO2 signal. Since the 2f components are proportional to gas mole fractions, Equation (2) can be expressed as
S 2 f = k 1 S C H 4 _ r e f + k 2 S C O 2 _ r e f
where SCH4_ref is a reference signal of CH4 with a known concentration, SCO2_ref is a reference signal of CO2 with a known concentration, k1 is the scale factor of CH4, and k2 is the scale factor of CO2. Hence, mole fractions of the experimental 2f components can be retrieved with the reference 2f components.

3. Instrument Setup

Figure 1 shows the instrument setup for a frequency-division multiplexing QEPAS sensor with the frequency-domain detection method. DFB lasers (NEL), operated at 1654 and 2004 nm, are selected as light sources for CH4 and CO2 detection. A CH4 absorption line at 1653.72 nm and a CO2 absorption line at 2004.02 nm are investigated in this experiment. The DFB lasers are controlled by home-made temperature and current drivers. Frequency-division multiplexing signals are generated with waveform generators (SDG1032X, Siglent, Shenzheng, China). The modulated laser beams are combined and then focused between the prongs of the QTF. Photoacoustic current from the QTF is converted to an output voltage by a trans-impedance amplifier and is then amplified again and filtered to enhance the signal-to-noise ratio. The center frequency of the bandpass filter is located at 32,713 Hz, and its bandwidth is compressed to 650 Hz. Output signals from the filter are processed by a real-time frequency analyzer (RSA5115B, Tektronix, OR, USA) with a sampling rate of 200 MHz and a resolution of 16 bits. To implement a comparison experiment, lock-in amplifiers (RS865A, Stanford Research Systems, Sunnyvale, CA, USA) are utilized to retrieve 2f components from the photoacoustic signals at different frequencies. The frequency-domain and time-domain signals are recorded and analyzed by a computer.

4. Experimental Results

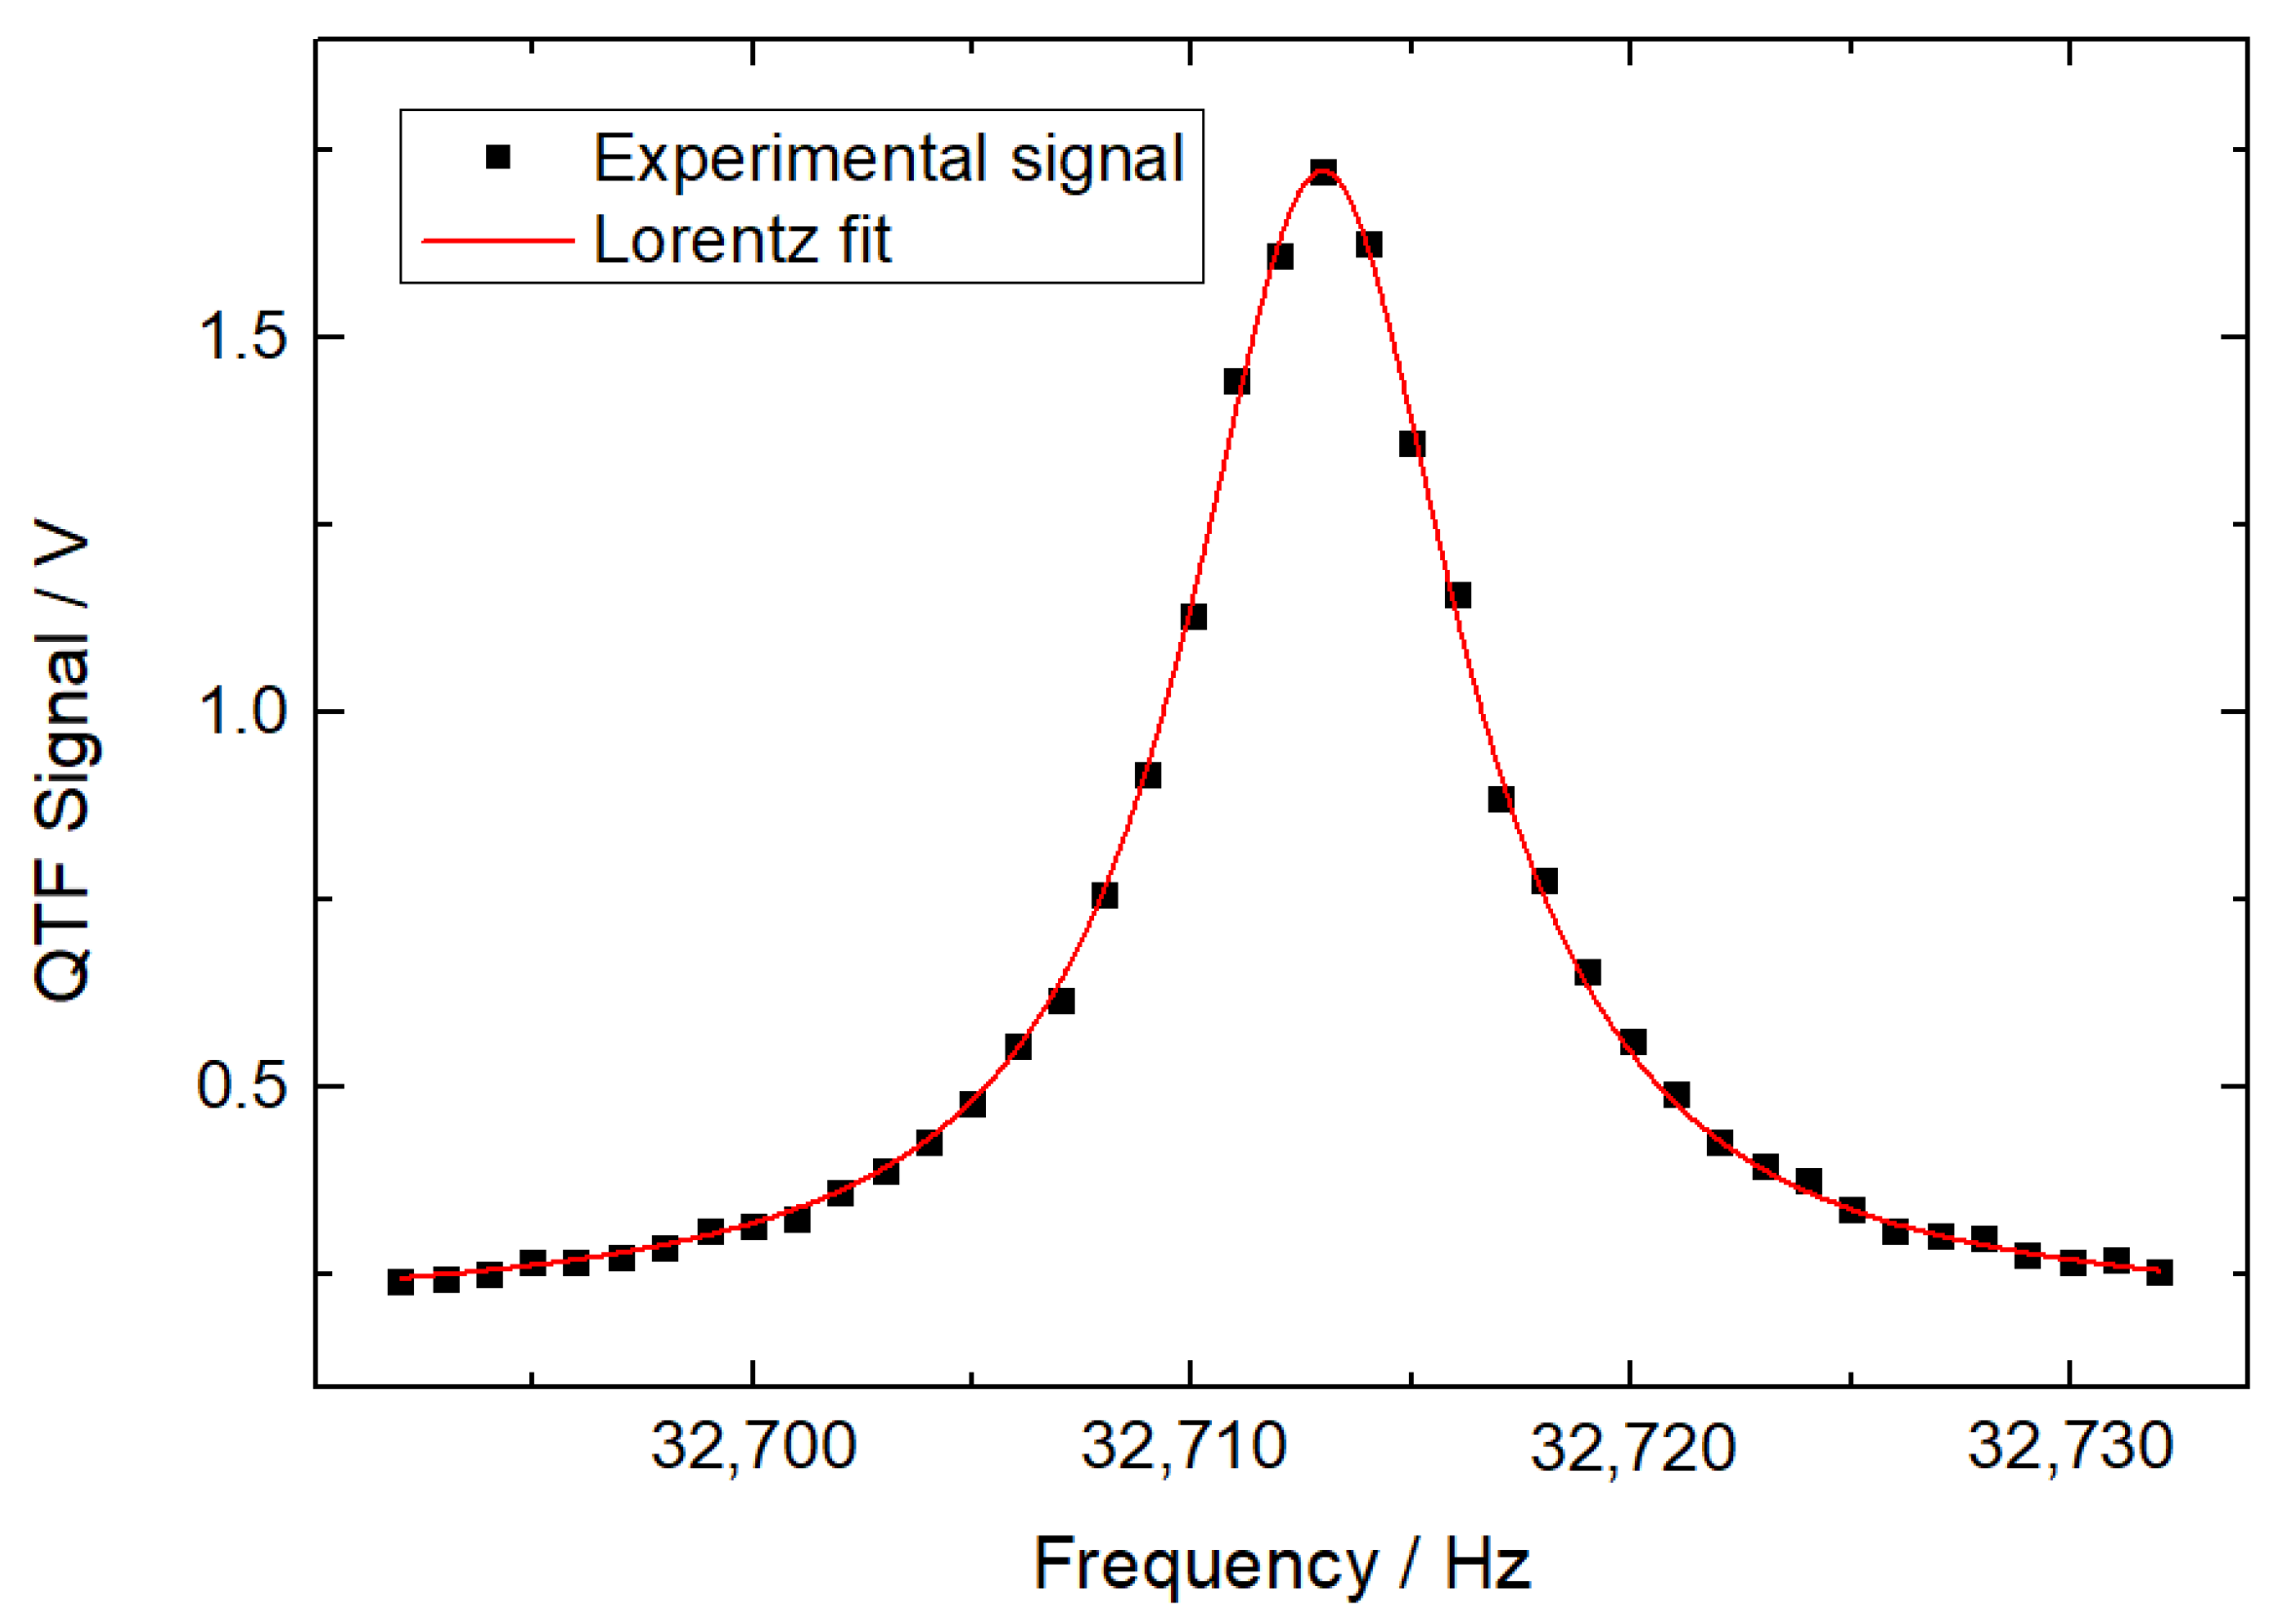
4.1. Frequency Response of QTF

The frequency response of the QTF is shown in Figure 2. Sinusoidal signals of different frequencies were generated via a function generator to measure the frequency response of the QTF. The frequency of the sinusoidal signals was scanned from 32,688.00 to 32,732.00 Hz with a step of 1.00 Hz. Peak values of output signals from the QTF were fitted using the Lorentz profile-based nonlinear least square method. The calculated resonant frequency and response bandwidth of the QTF were 32,712.96 and 7.65 Hz, respectively, which led to a quality factor of 4267. To demonstrate the frequency-domain detection method for frequency-division multiplexing QEPAS sensors, modulation frequencies of 16,356.18 Hz for CH4 detection and 16,356.78 Hz for CO2 detection were selected. The corresponding second harmonic frequencies were located at 32,712.36 and 32,713.56 Hz with a 1.20-Hz interval.

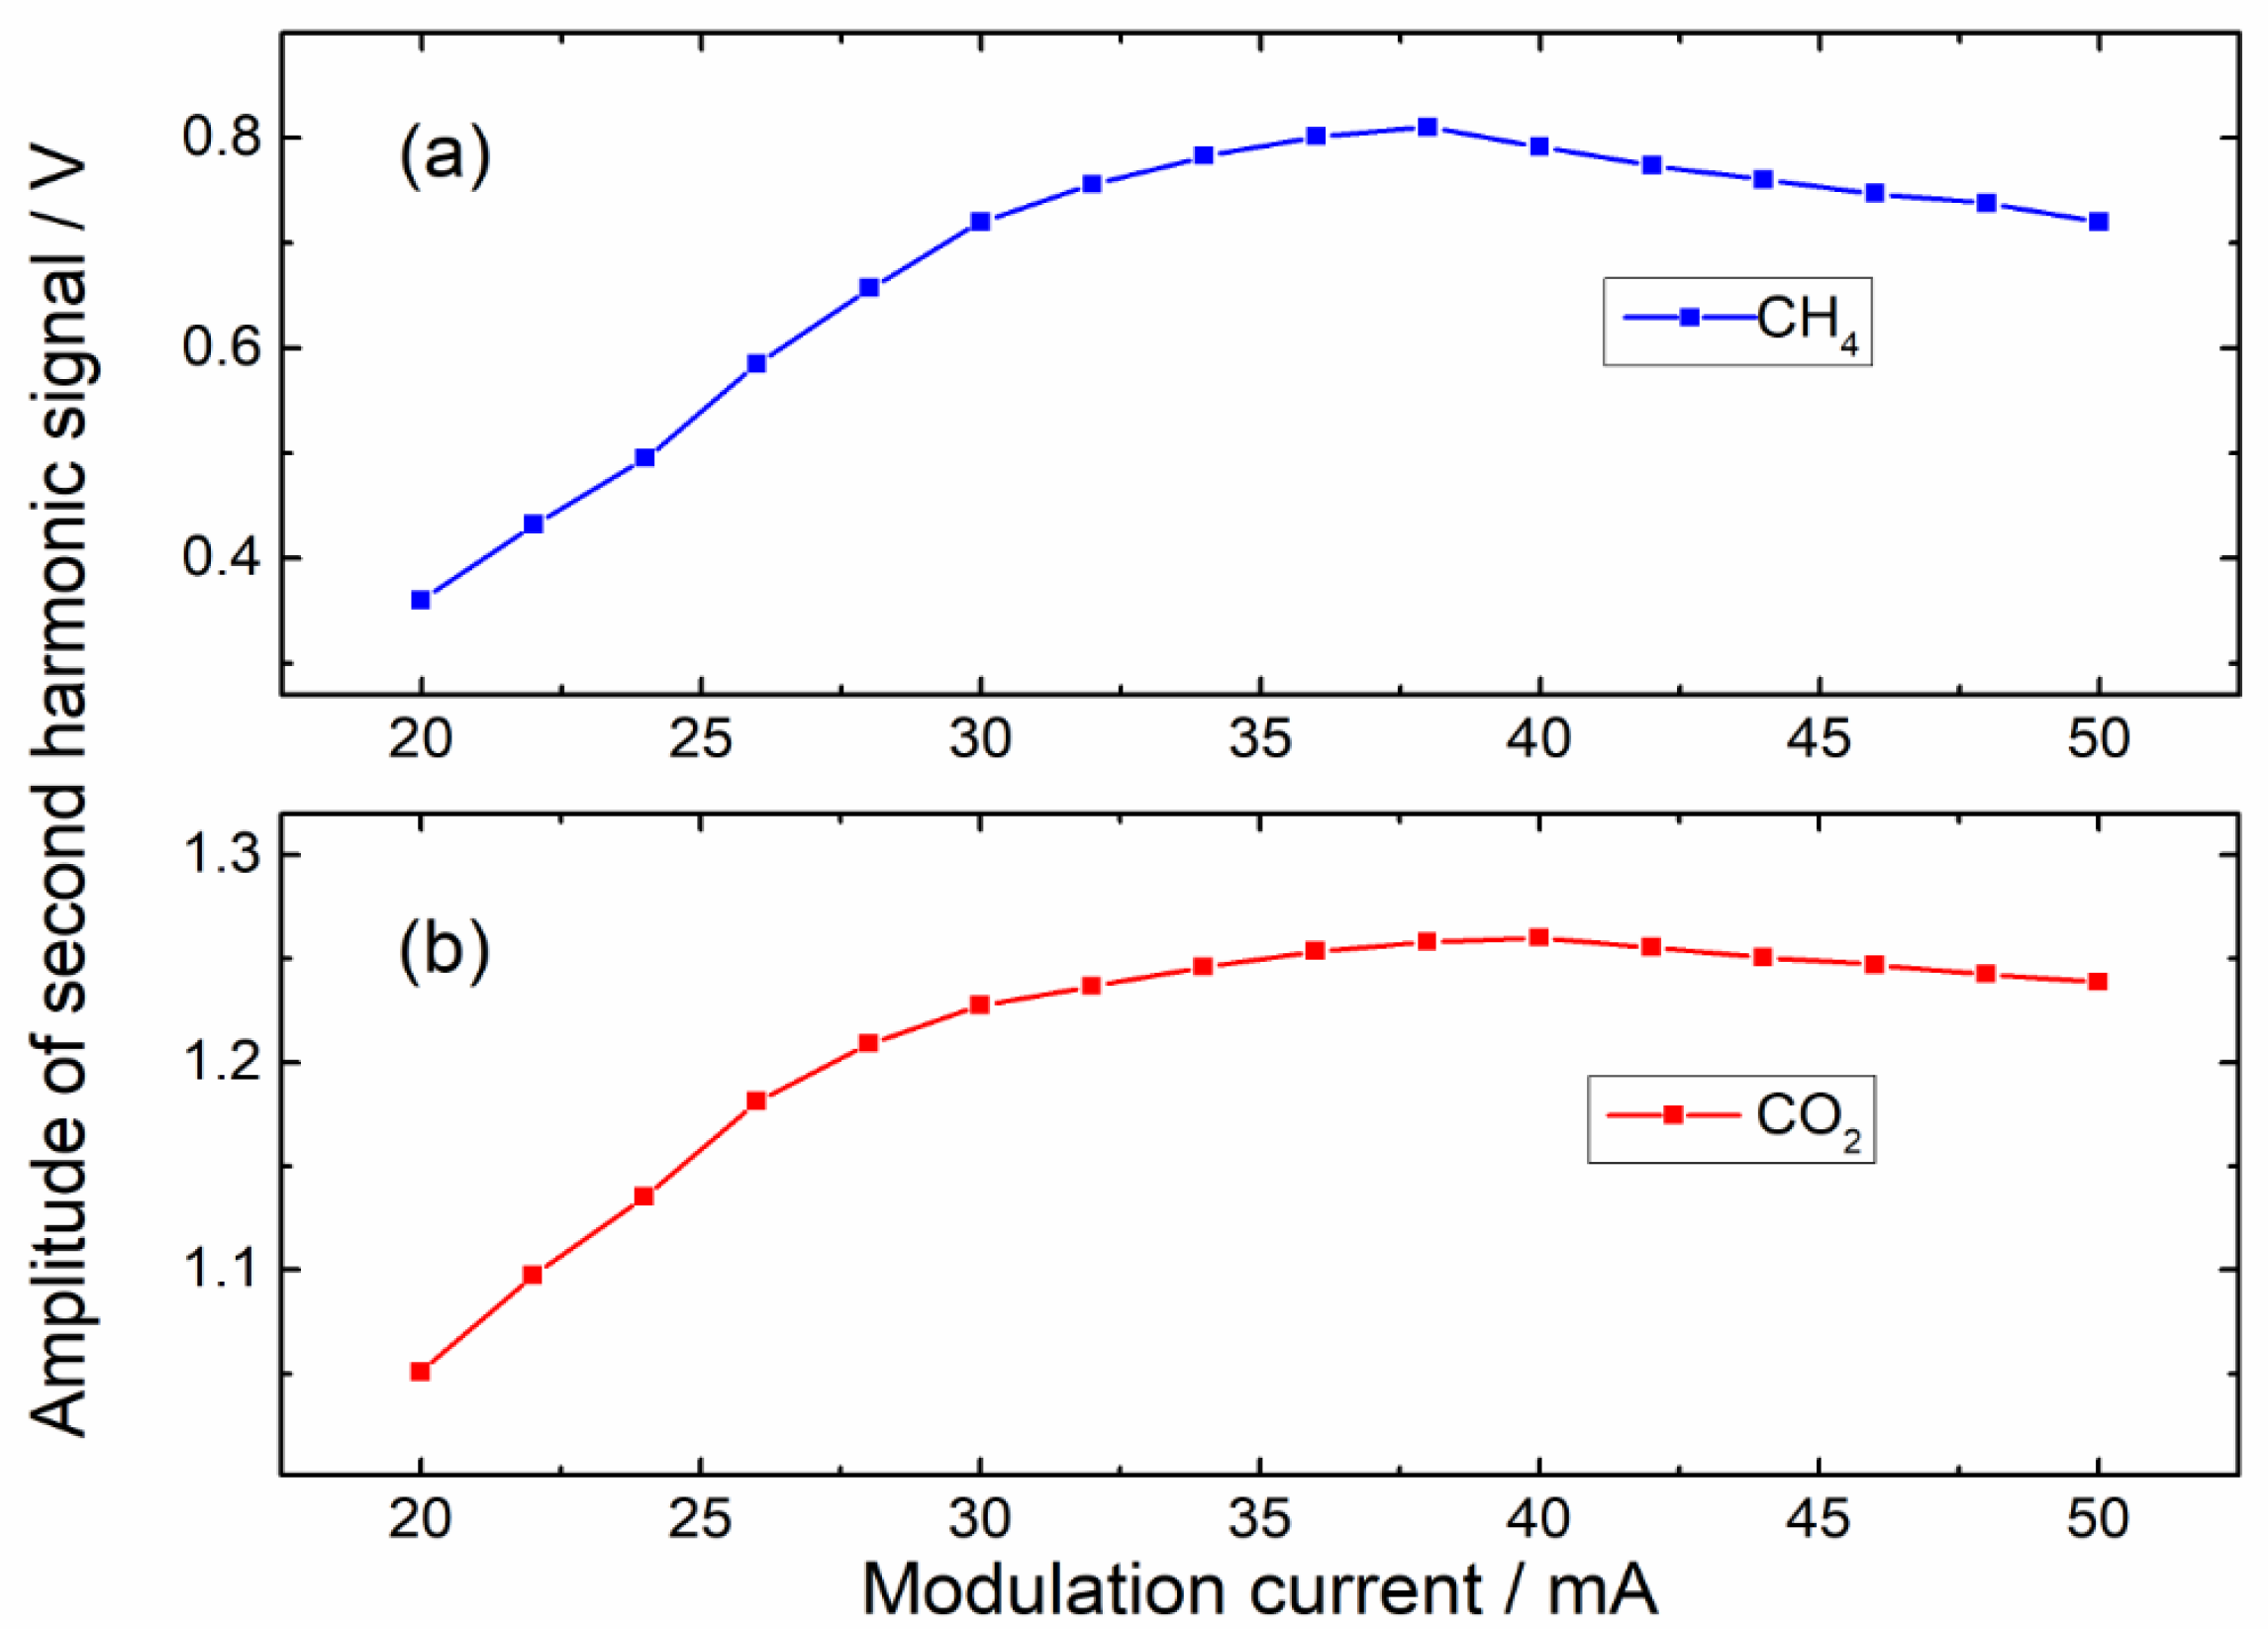
4.2. Modulation Signal Optimization

Since the laser modulation coefficient varied with the modulation current directly, the modulation current should be optimized to improve the amplitudes of 2f components. Two DFB lasers were operated alternately, and the sawtooth ramp signal of 0.1 Hz, superimposed with a sinusoidal modulation signal, was used to modulate laser injection currents. Gas samples of CH4 and CO2 were injected into the photoacoustic cell alternately with a flow rate of 50 mL/min. Lock-in amplifiers were utilized to retrieve 2f signals, and the amplitudes of 2f signals at various modulation currents are depicted in Figure 3. According to the result, modulation currents of 38 mA for CH4 and 40 mA for CO2 were selected in the subsequent experiments.

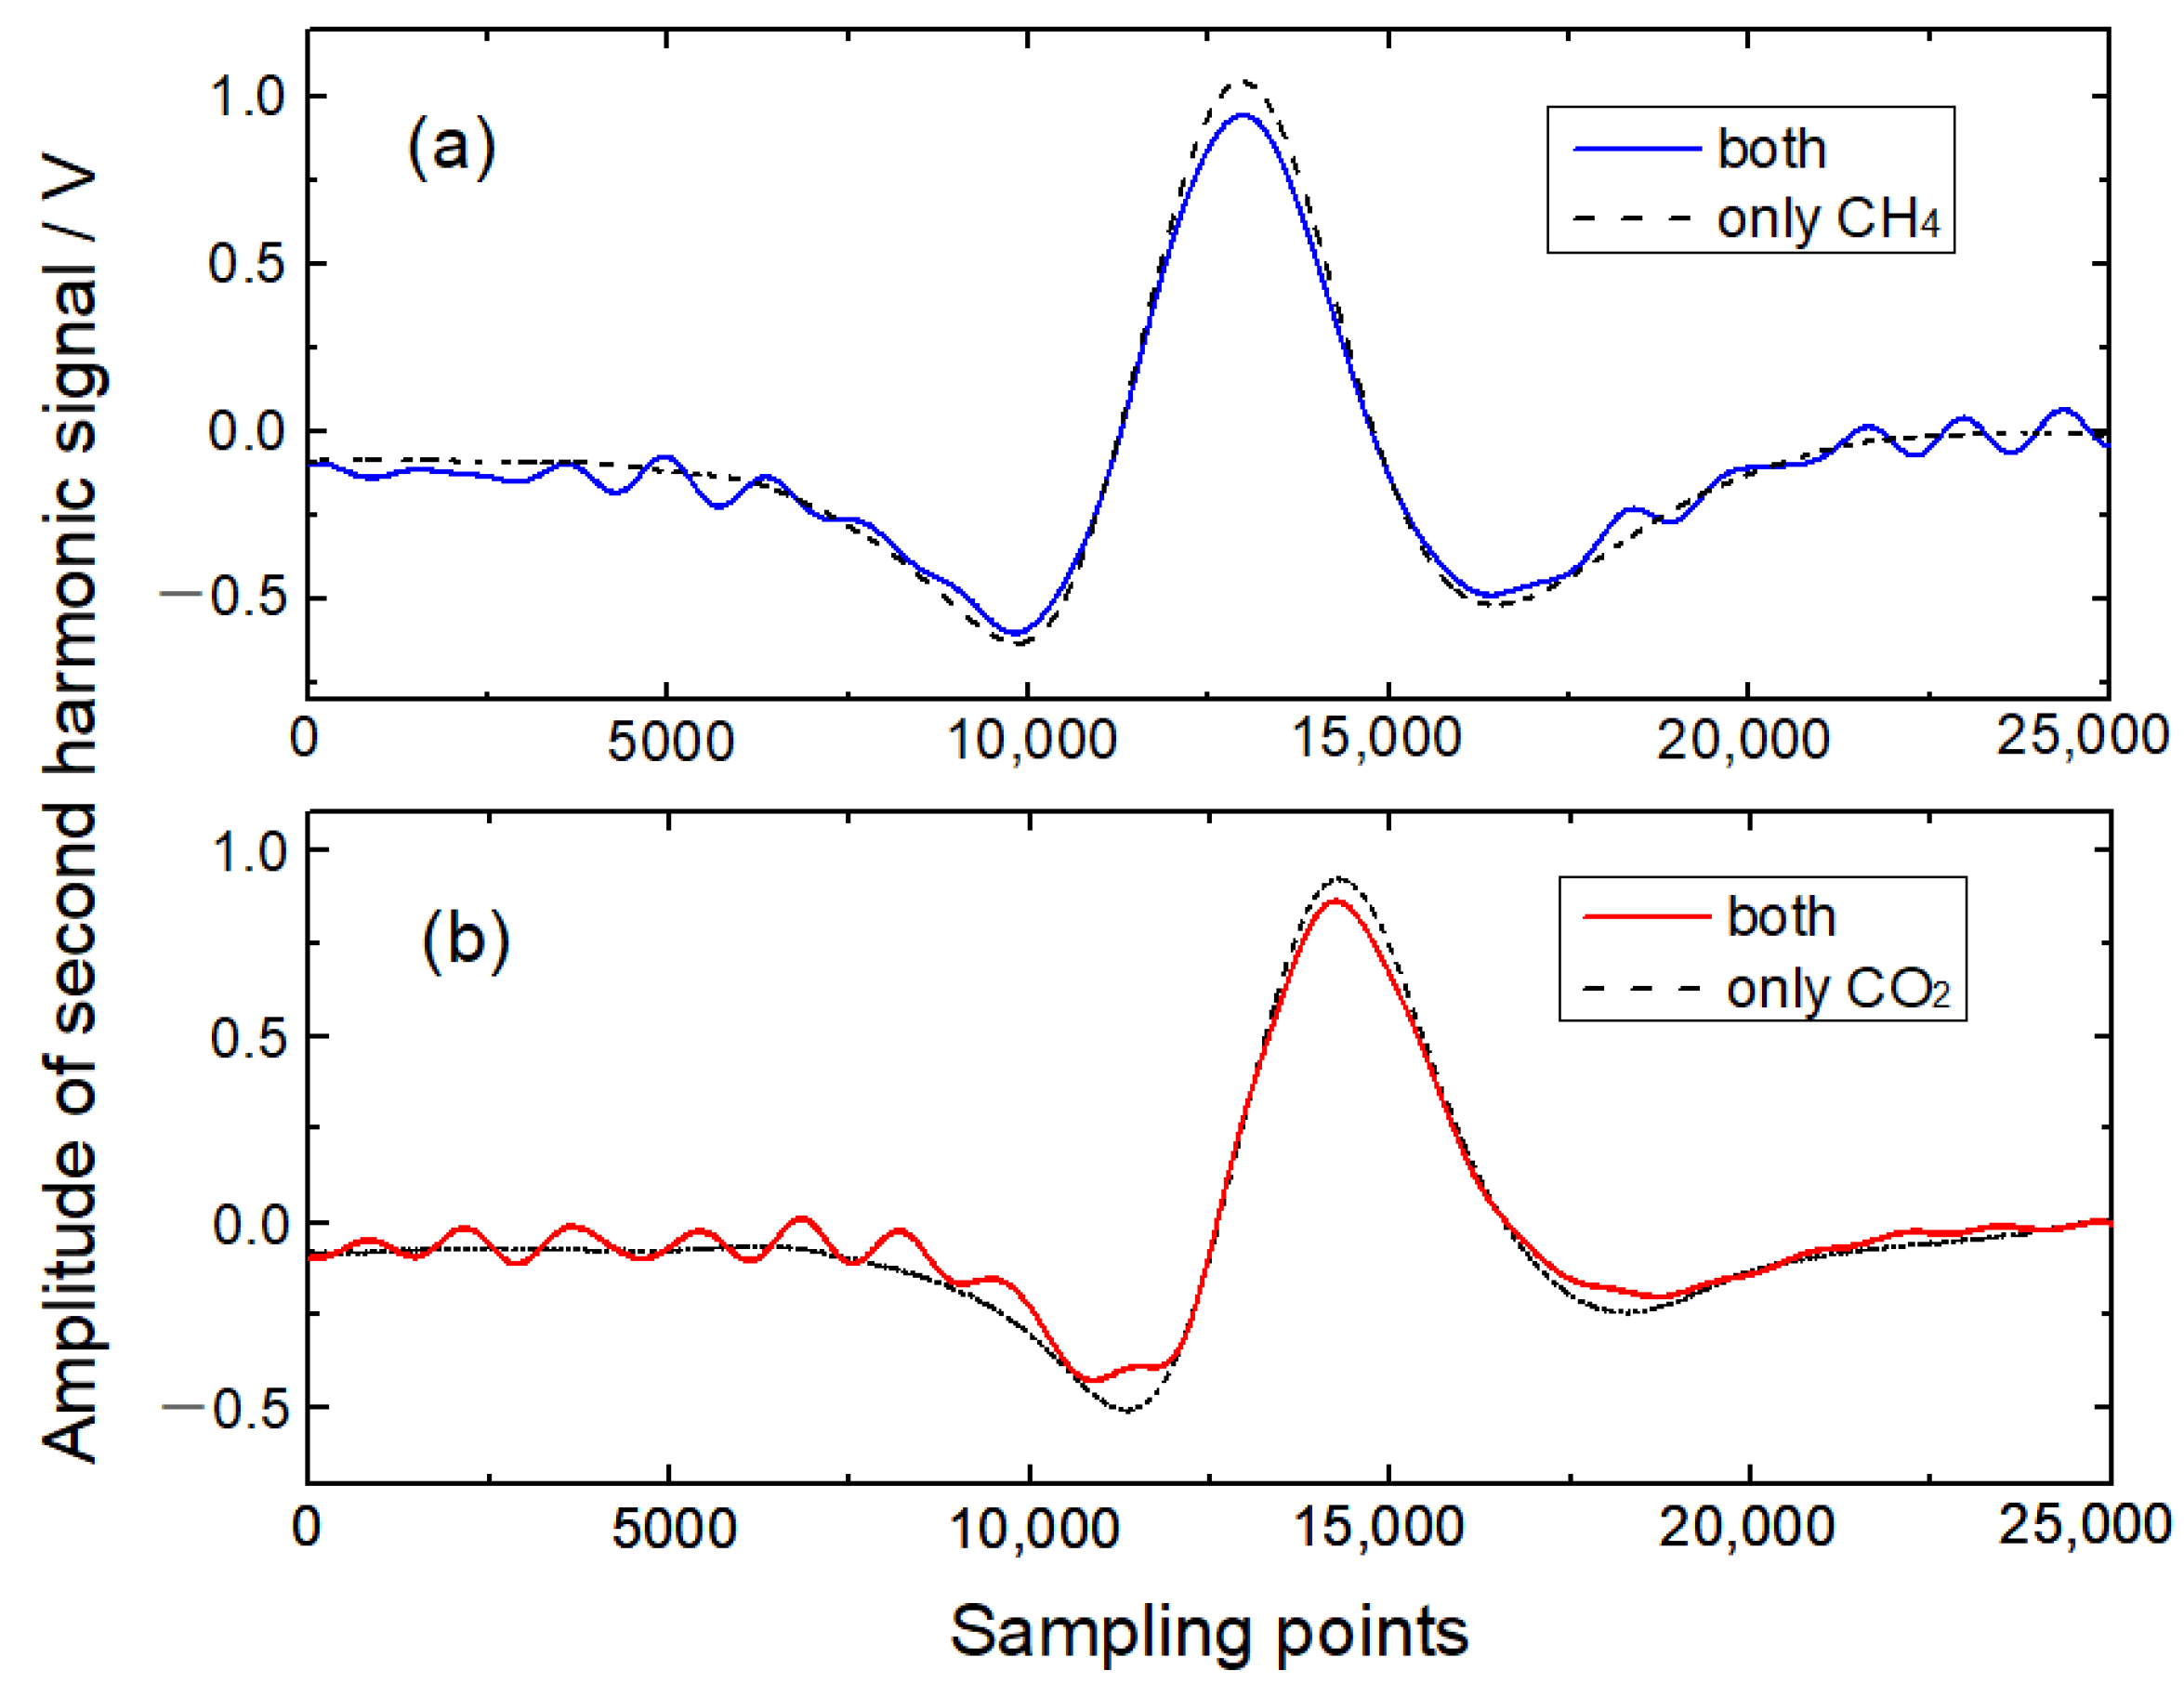
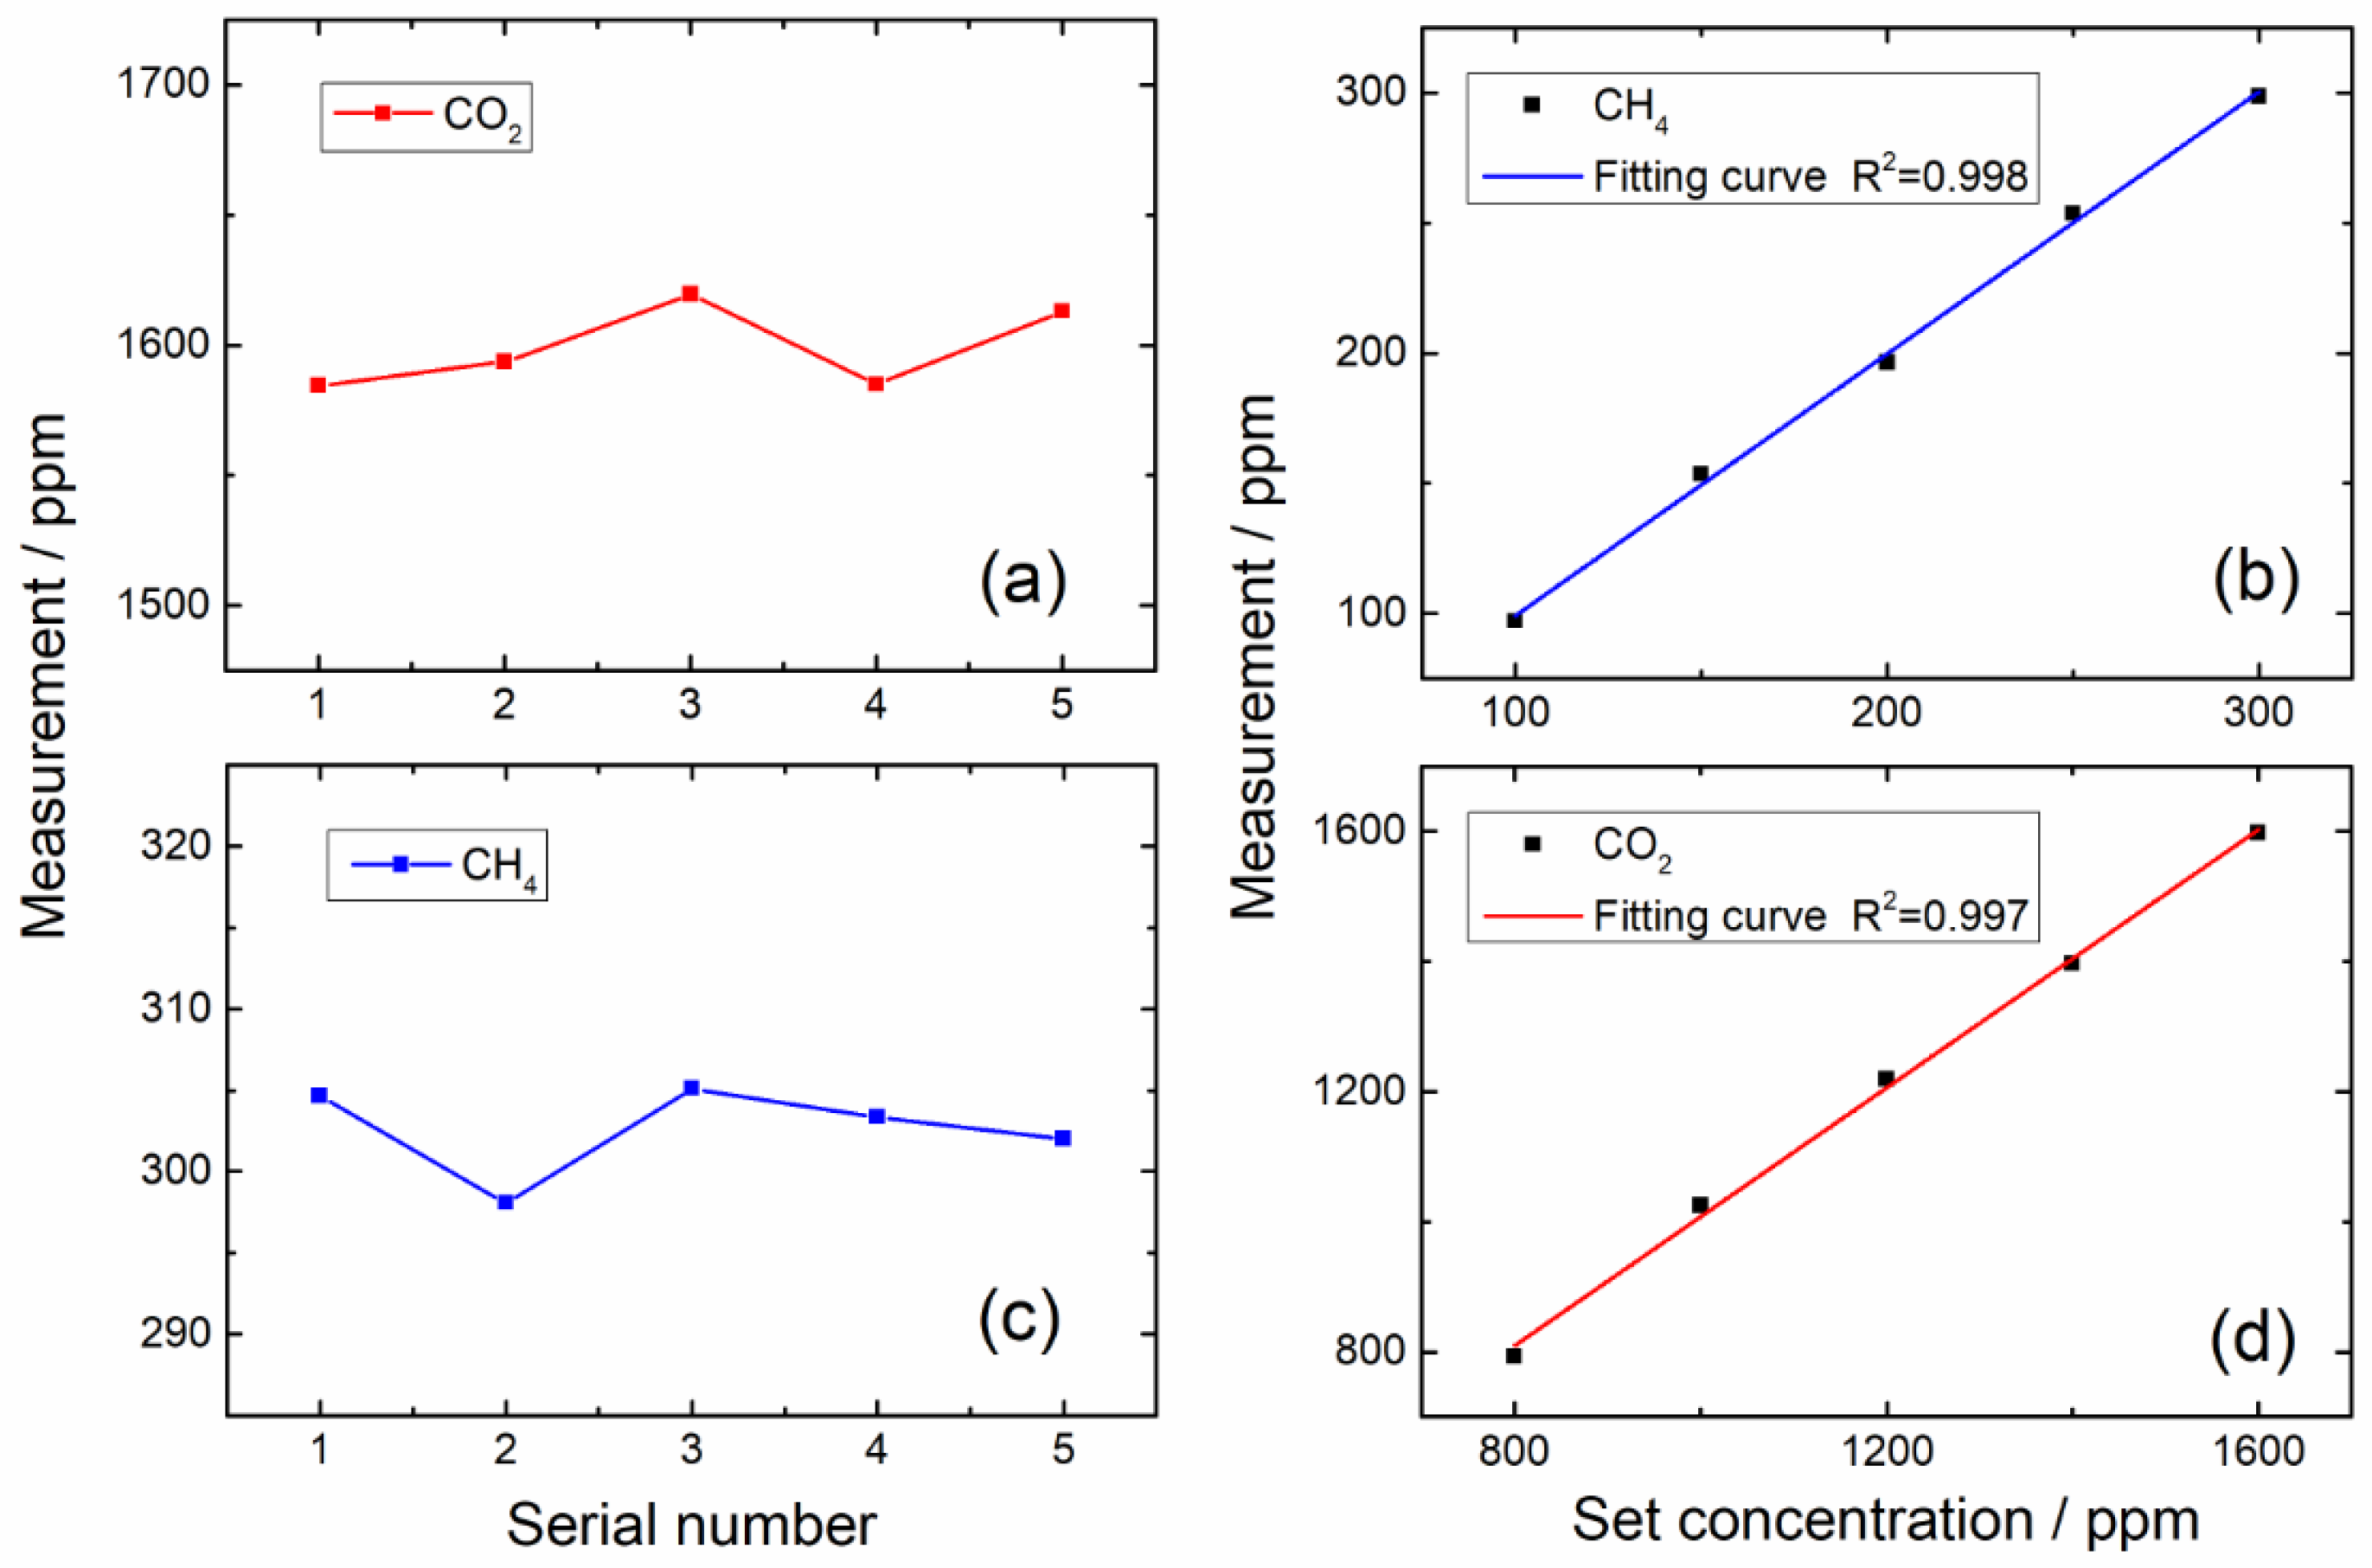
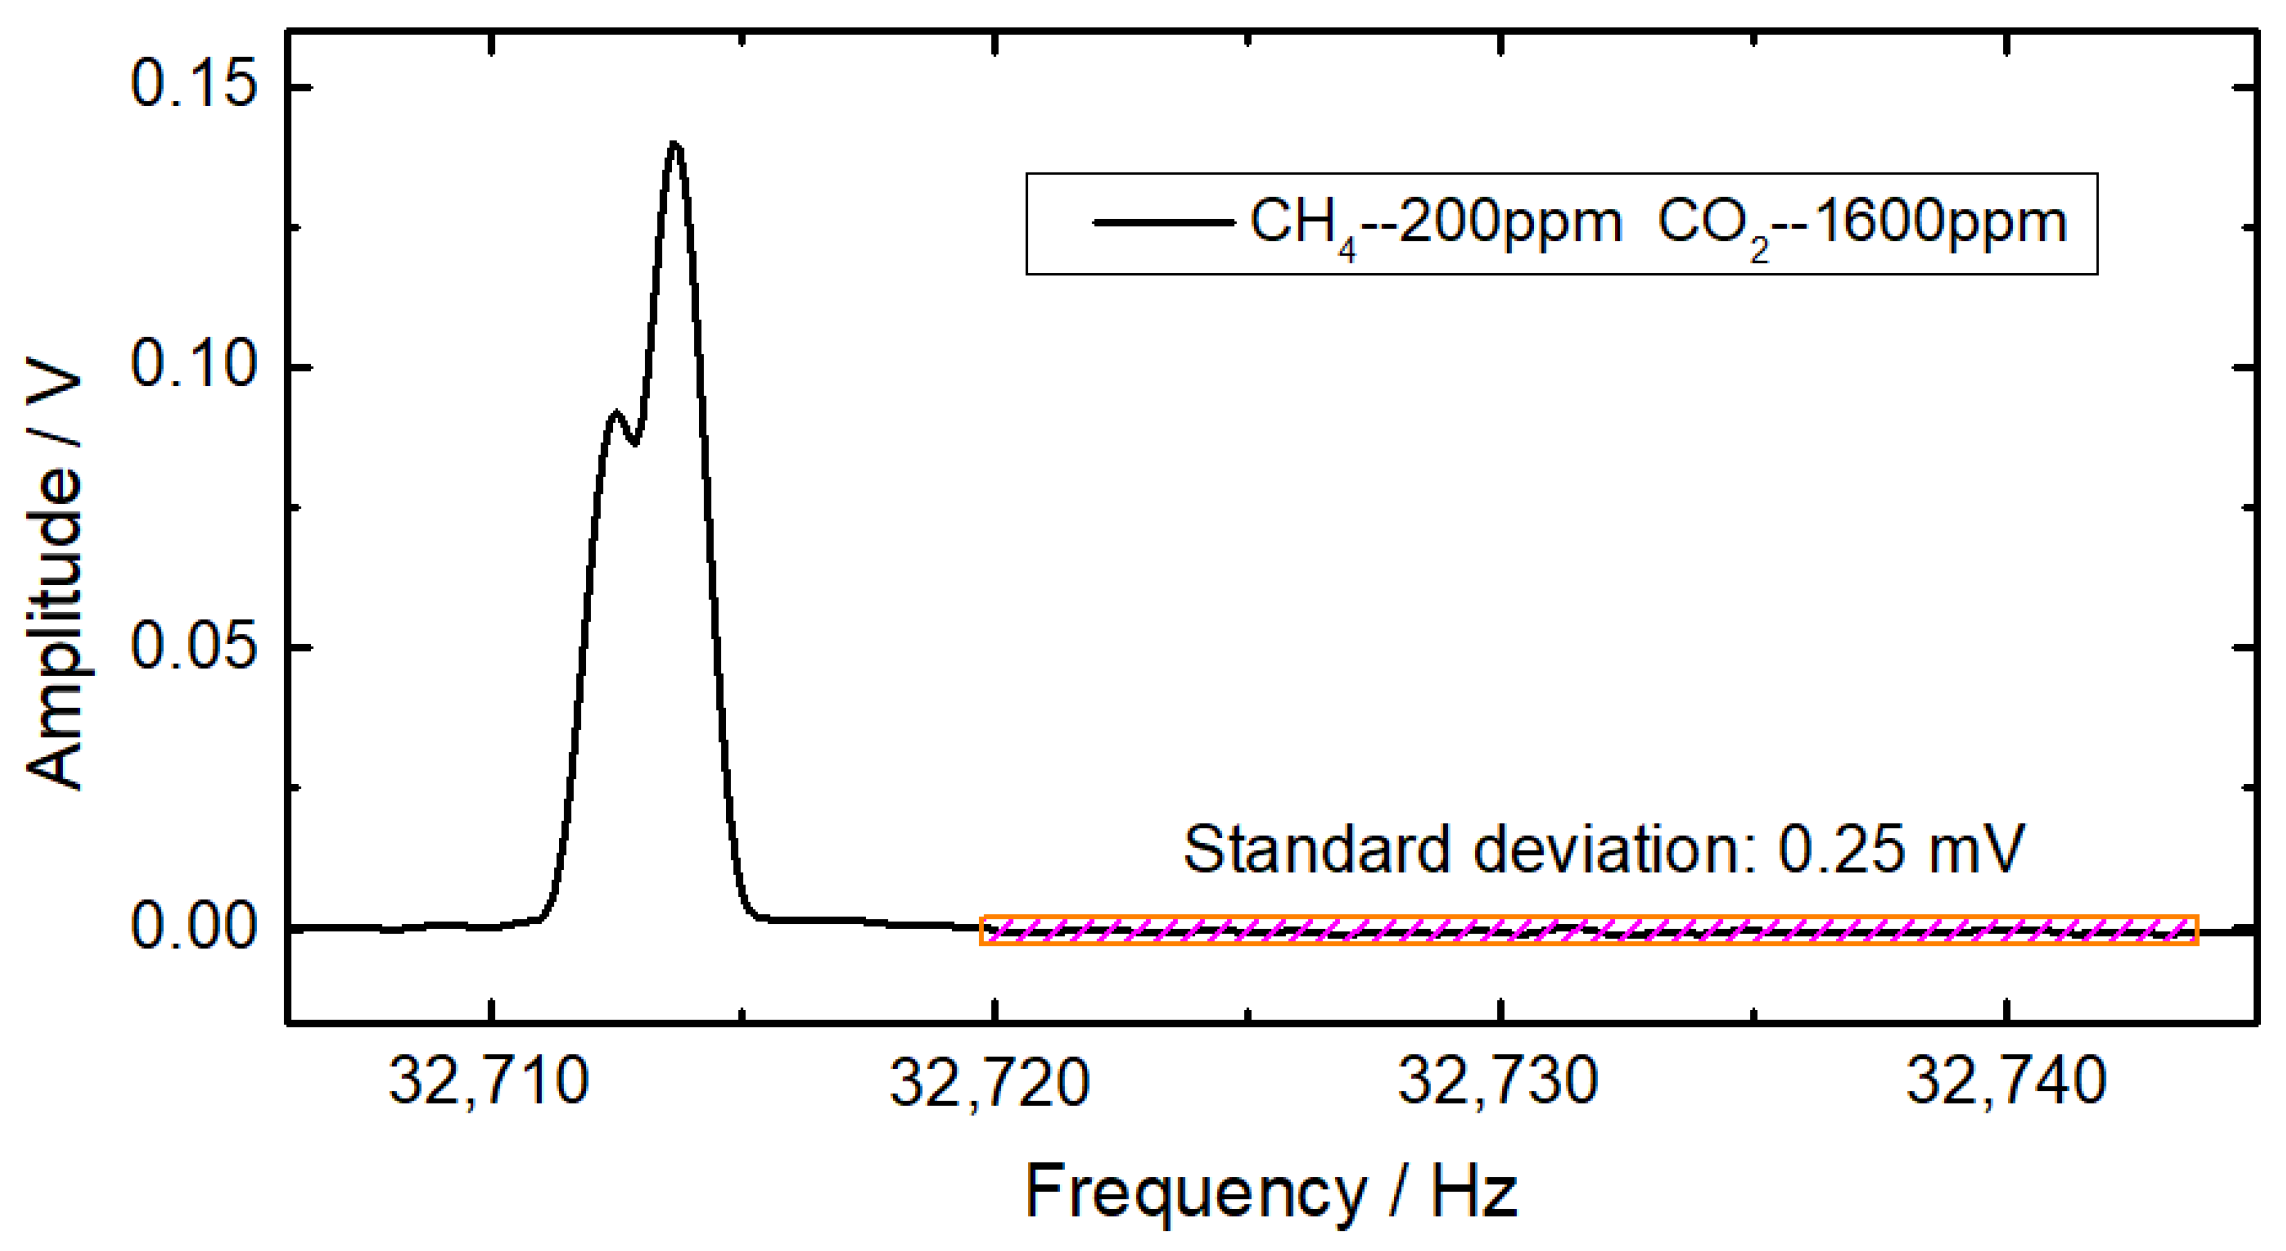
4.3. Time-Domain 2f Signals with Frequency-Division Multiplexing Mode

With the implementation of the frequency-division multiplexing technique, appropriate intervals between modulation frequencies should be determined to optimize the detection limits and avoid interferences. The frequency bandwidth of the QTF is relatively narrow and will decrease sharply at low pressure. Hence, a smaller modulation interval can enable more lasers to work at the same time under the frequency-division multiplexing mode. However, the small modulation interval will cause serious interferences between 2f components of target gases.
In this experiment, modulation frequencies of 16,356.18 Hz for CH4 detection and 16,356.78 Hz for CO2 detection were selected. Modulation signals superimposed with sawtooth ramp signals of 0.1 Hz were used to modulate laser injection currents with the frequency-division multiplexing mode. A gas mixture of 300 ppm CH4 and 1600 ppm CO2 was injected into the photoacoustic cell with a flow rate of 50 mL/min. Lock-in amplifiers were used to demodulate the photoacoustic signals simultaneously, and the time constant was set as 300 ms. As depicted in Figure 4, the time-domain 2f signals are plotted with solid lines when two lasers operate simultaneously and with dotted lines when only a single laser operates. Serious interferences are observed between time-domain 2f signals with a 1.20-Hz interval of demodulation frequencies. The amplitudes of non-absorption wings are 8.1% and 11.1% of the amplitudes of time-domain 2f signals of CH4 and CO2. The corresponding signal-to-noise ratios are 42 and 39, which can lead to weakened detection limits. Furthermore, the interferences could change with different concentrations of gas mixtures. Thus, the time-domain 2f signals demodulated by lock-in amplifiers can hardly satisfy the demand for precise gas detection under the frequency-division multiplexing mode with narrow intervals of modulation frequencies.

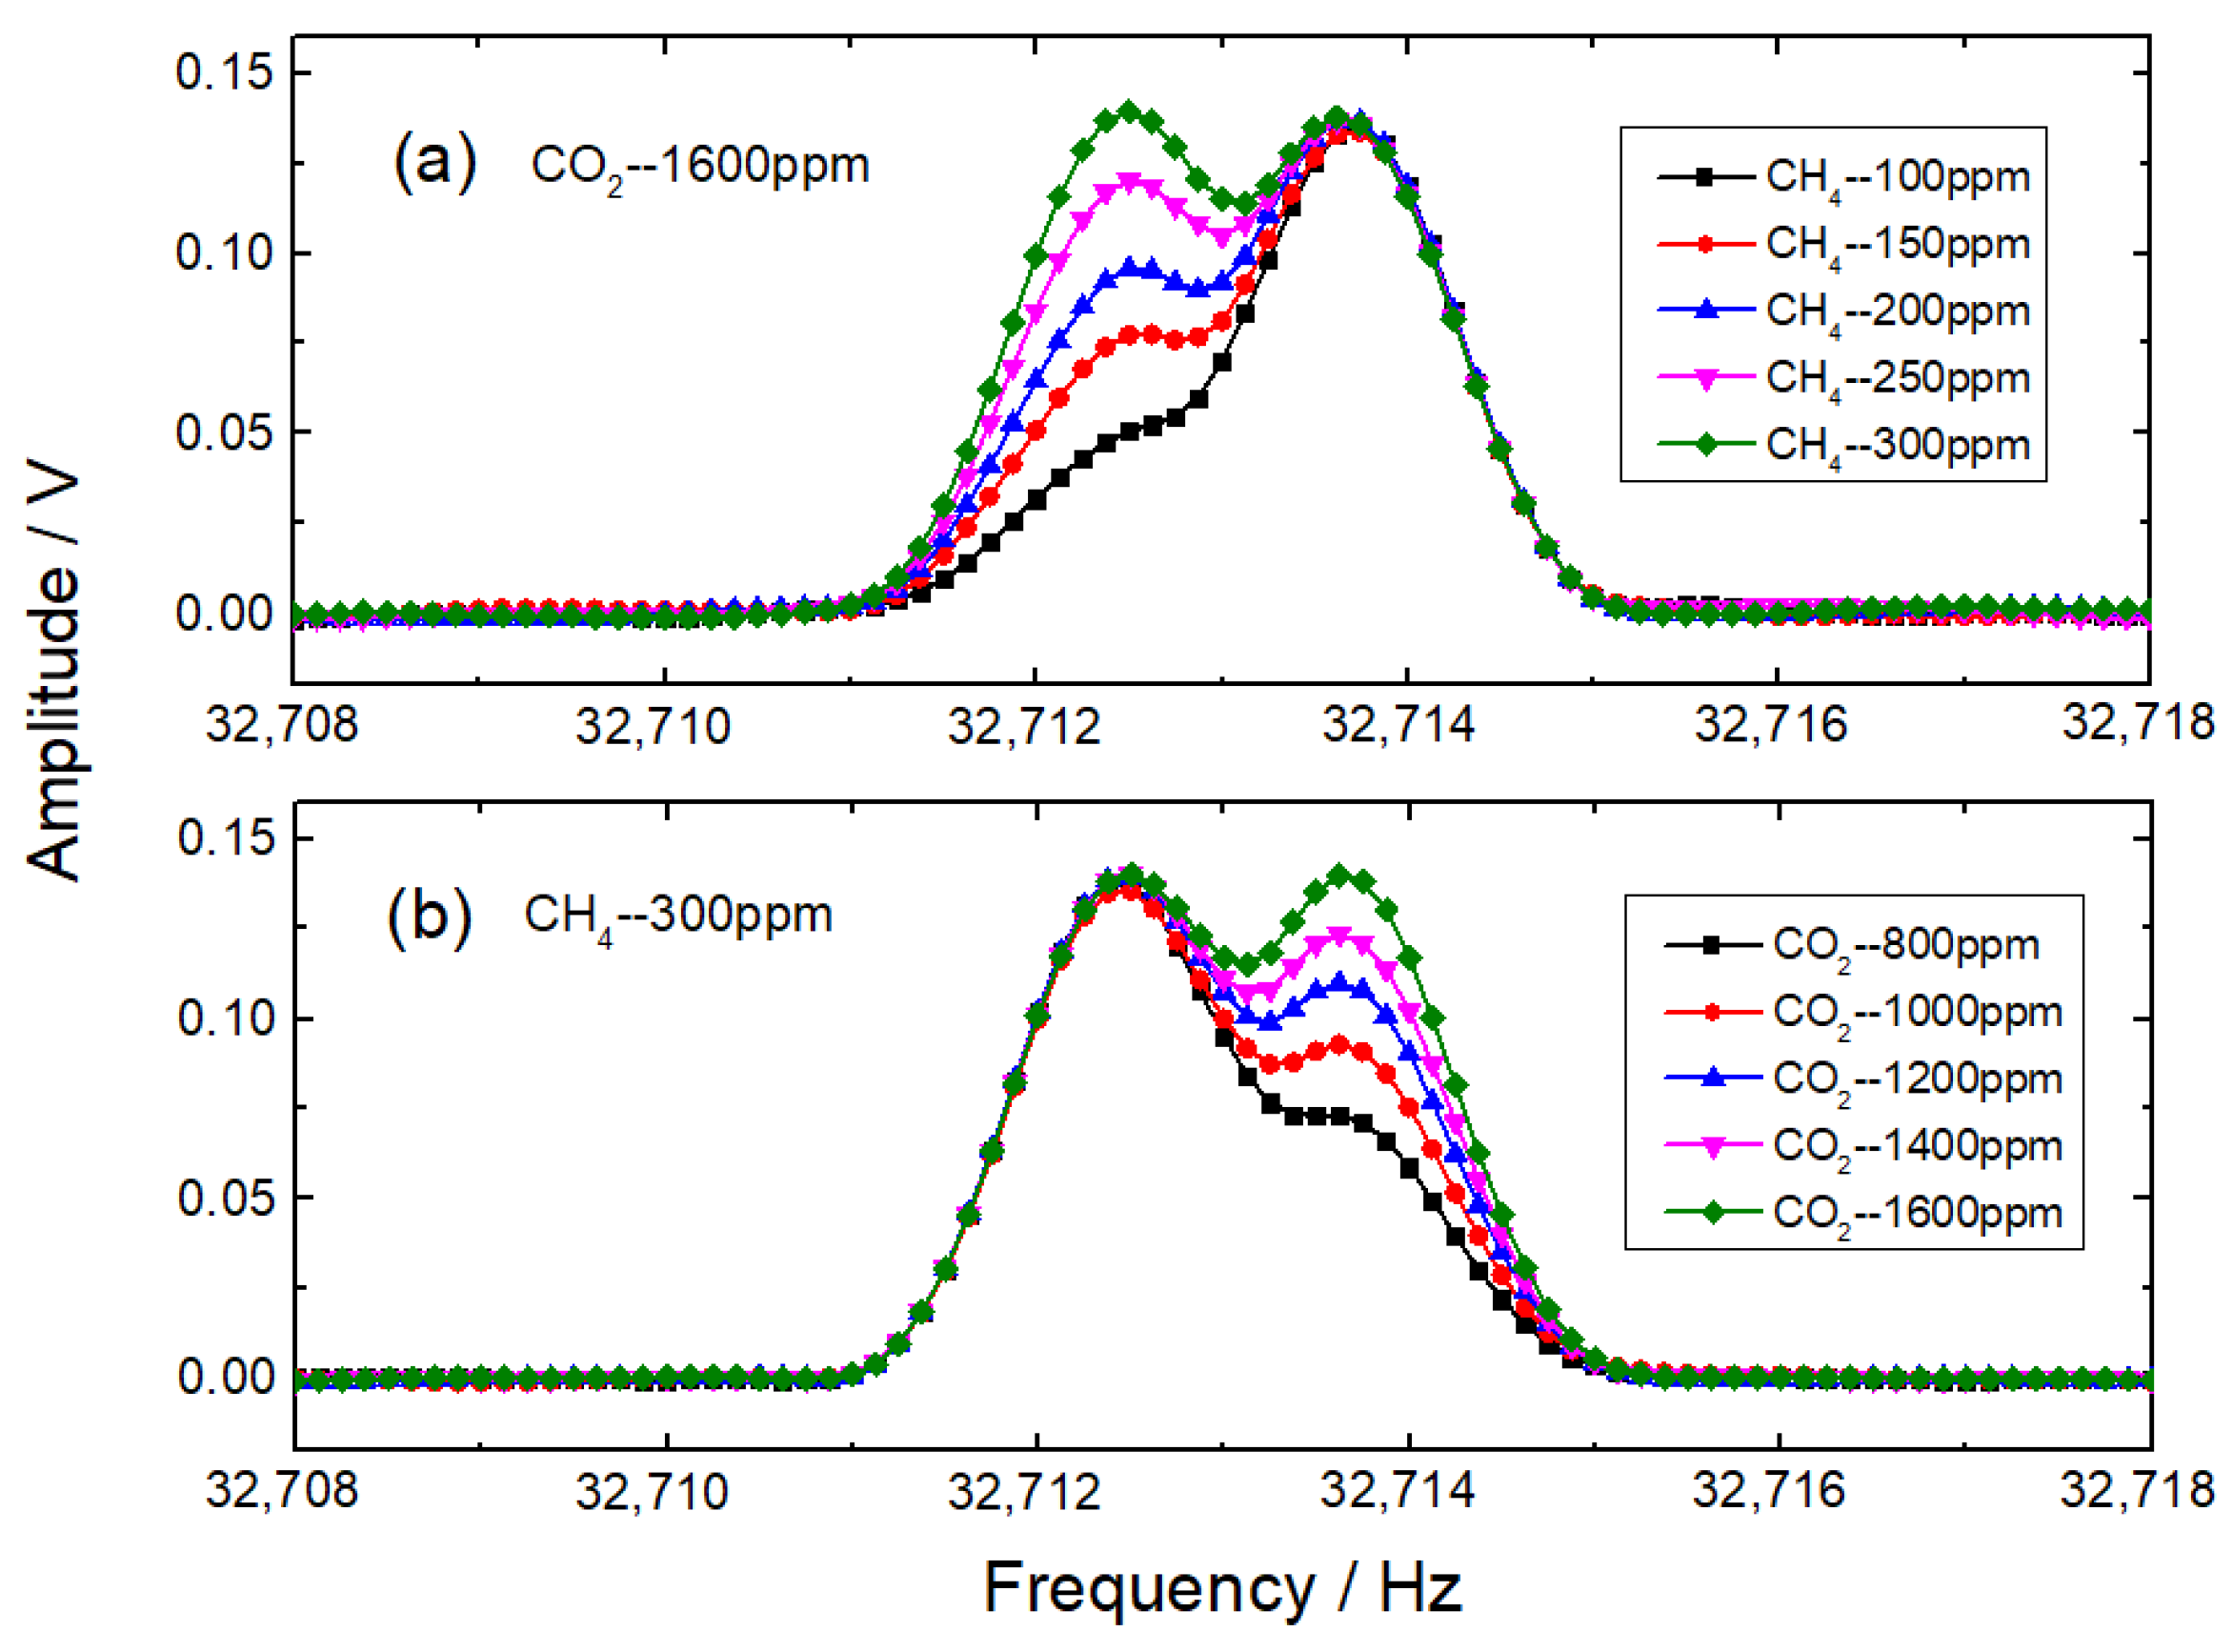
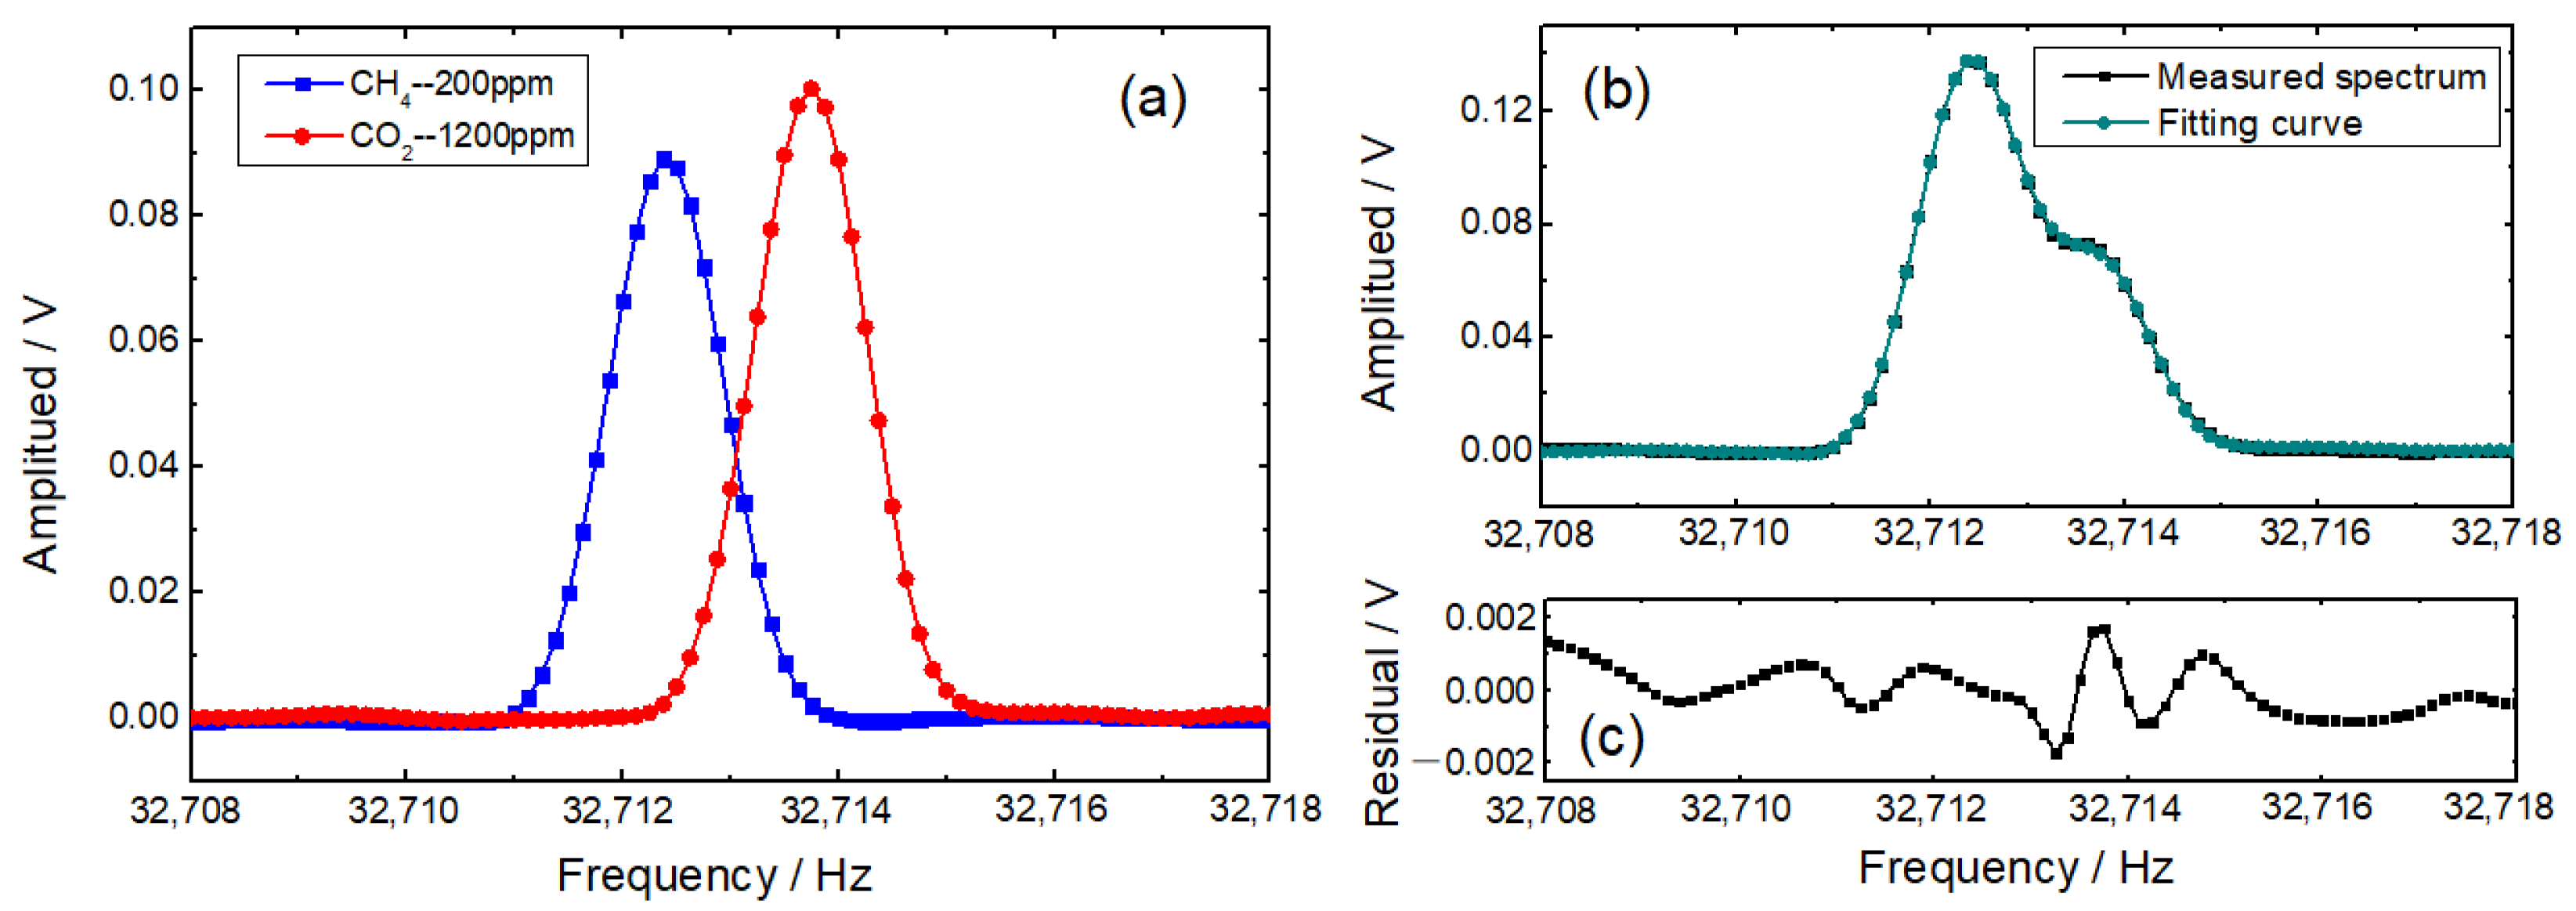
4.4. Frequency-Domain Analysis

To examine the frequency-domain features of photoacoustic signals, gas mixtures of different concentrations were injected into the photoacoustic cell alternately, with a flow rate of 50 mL/min. For the first group of gas mixtures, the CO2 mole fraction was fixed at 1600 ppm, while CH4 mole fractions ranged from 100 ppm to 300 ppm with a step of 50 ppm. For the second group of gas mixtures, the CH4 mole fraction was fixed at 300 ppm, while CO2 mole fractions ranged from 800 to 1600 ppm with a step of 200 ppm. Modulation frequencies of 16,356.18 Hz for CH4 detection and 16,356.78 Hz for CO2 detection were selected, and sawtooth ramp signals were replaced with bias signals. A real-time frequency analyzer was utilized to process raw photoacoustic signals of different gas mixtures with a sampling time of 8 s. The frequency-domain 2f signals were 10 times averaged, and the frequency-domain resolution was 0.125 Hz. Figure 5 demonstrates the experimental results of different gas mixtures. The frequency-domain 2f signals of CH4 and CO2 mutually overlap, and gas concentrations cannot be directly retrieved from the spectra. Since the experimental signals can be treated as the superposition of the frequency-domain 2f signals of CH4 and CO2, multiple linear regressions can be employed to eliminate interferences.
Standard gas samples of 200 ppm CH4 and 1200 ppm CO2 were injected into the photoacoustic cell successively, with a flow rate of 50 mL/min. As depicted in Figure 6a, the frequency-domain 2f signals of CH4 and CO2 are measured individually and are utilized as the basics in the application of multiple linear regressions. Figure 6b demonstrates an excellent fitting result of a gas mixture of 300 ppm CH4 and 800 ppm CO2, which is confirmed by the negligible <1.5% difference shown in Figure 6c.
For the first group of gas mixtures, the calculated mole fractions of CO2 are shown in Figure 7a; the deviations of CO2 measurements are −1.3%, −0.5%, 1.6%, 1.3%, and 1.1% respectively. As shown in Figure 7b, there is a good linear relationship between the best-fit mole fractions of CH4, obtained by the multiple linear regression method, and the calibrated gas samples, with a linear correlation coefficient of 0.998. For the second group of gas mixtures, the calculated mole fractions of CH4 are shown in Figure 7c; the deviations of CH4 measurements are 2.3%, −0.9%, 2.5%, 1.7%, and 1.0%, respectively. As shown in Figure 7d, there is a good linear relationship between the best-fit mole fractions of CO2, obtained by the multiple linear regression method, and the calibrated gas samples, with a linear correlation coefficient of 0.997. Based on the results of multiple linear regressions with various gas mixtures, small deviations and good linear relationships for gas detection can be observed under the frequency-division multiplexing mode with a narrow interval of modulation frequencies.
To evaluate the detection limits of CH4 and CO2, the gas mixture of 200 ppm CH4 and 1600 ppm CO2 was injected into the photoacoustic cell with a flow rate of 50 mL/min, and the profile of the frequency-domain QEPAS signal was averaged over 50 times to enhance the signal-to-noise ratio. The peak values of the frequency-domain 2f signals of CH4 and CO2 were determined with multiple linear regressions. As depicted in Figure 8, the standard deviation of the background is 0.25 mV, which corresponds to the signal-to-noise ratio of 332 for CH4 and 551 for CO2. As a result, the minimum detection limits of CH4 and CO2 are 0.6 ppm and 2.9 ppm, respectively.

5. Conclusions

Since the frequency bandwidth of the QTF is relatively narrow and will decrease sharply at low pressure, a narrower interval of modulation frequencies can enable more lasers to work at the same time with the frequency-division multiplexing mode for QEPAS sensors. However, serious interferences and poor signal-to-noise ratios were observed with time-domain 2f signals demodulated by lock-in amplifiers when modulation frequencies of 16,356.18 and 16,356.78 Hz were utilized for CH4 and CO2 detection with an interval of 0.6 Hz. To retrieve accurate gas concentrations, frequency-domain 2f signals were investigated using a real-time frequency analyzer with a resolution of 0.125 Hz. With the employment of multiple linear regressions, small deviations within 2.5% and good linear relationships for gas detection were observed under the frequency-division multiplexing mode with a 0.6 Hz interval of modulation frequencies. Detection limits of 0.6 ppm for CH4 and 2.9 ppm for CO2 were obtained with the analysis of the signal-to-noise ratio of the frequency-domain 2f signal. For the frequency-domain detection method, an additional frequency analyzer is essential for signal processing. However, a frequency analyzer can retrieve all 2f signals simultaneously under the frequency-division multiplexing mode when multiple gases are detected. With the 0.6 Hz interval, the amplitudes of QEPAS signals will increase substantially since the modulation frequencies are closer to the resonant frequency of the QTF. Additionally, more kinds of target gases can be measured simultaneously under the frequency-division multiplexing mode with the limited bandwidth of the QTF due to the narrow interval. Furthermore, the narrow interval of modulation frequencies can also realize frequency-division multiplexing detection for QEPAS sensors under low pressure despite the ultra-narrow bandwidth of the QTF. Future work will focus on continuous monitoring applications with this method to examine its reliability and accuracy further.

Author Contributions

Conceptualization, X.C. and M.H.; methodology, X.C. and M.H.; software, X.C. and L.Y.; validation, X.C. and H.L.; formal analysis, H.D. and Z.X.; investigation, X.C. and H.D.; resources, H.L. and Z.X.; writing—original draft preparation, X.C.; writing—review and editing, R.K. All authors have read and agreed to the published version of the manuscript.

Funding

This research was supported by the Strategic Priority Research Program of the Chinese Academy of Sciences (XDA22020502), the Foundation from the Key Laboratory of Environmental Optics and Technology (2005DP173065-2021-03), and the National Key Research and Development Project (2019YFB2006003).

Institutional Review Board Statement

Not applicable.

Informed Consent Statement

Not applicable.

Data Availability Statement

The data that support the plots within this paper are available from the corresponding author on request basis.

Conflicts of Interest

The authors declare no conflict of interest.

References

  1. Milde, T.; Hoppe, M.; Tatenguem, H.; Rohling, H.; Schmidtmann, S.; Honsberg, M.; Schade, W.; Sacher, J. QEPAS sensor in a butterfly package and its application. Appl. Opt. 2021, 60, 55–59. [Google Scholar] [CrossRef] [PubMed]
  2. Zhang, H.; Jin, W.L.; Hu, M.P.; Hu, M.; Liang, J.Q.; Wang, Q. Investigation and Optimization of a Line-Locked Quartz Enhanced Spectrophone for Rapid Carbon Dioxide Measurement. Sensors 2021, 21, 5225. [Google Scholar] [CrossRef] [PubMed]
  3. Levy, R.; Duqesnoy, M.; Melkonian, J.M.; Raybaut, M.; Aoust, G. New Signal Processing for Fast and Precise QEPAS Measurements. IEEE Trans. Ultrason. Ferroelectr. Freq. Control 2020, 67, 1230–1235. [Google Scholar] [CrossRef]
  4. Sampaolo, A.; Yu, C.; Wei, T.T.; Zifarelli, A.; Giglio, M.; Patimisco, P.; Zhu, H.; Zhu, H.M.; He, L.; Wu, H.P.; et al. H2S quartz-enhanced photoacoustic spectroscopy sensor employing a liquid-nitrogen-cooled THz quantum cascade laser operating in pulsed mode. Photoacoustics 2021, 21, 100219. [Google Scholar] [CrossRef]
  5. Ma, Y.F. Recent advances in QEPAS and QEPTS based trace gas sensing: A review. Front. Phys. 2020, 8, 268. [Google Scholar] [CrossRef]
  6. Yi, H.M.; Chen, W.D.; Sun, S.W.; Liu, K.; Tan, T.; Gao, X.M. T-shape microresonator-based high sensitivity quartz-enhanced photoacoustic spectroscopy sensor. Opt. Express 2012, 20, 9187–9196. [Google Scholar] [CrossRef]
  7. Dong, L.; Wu, H.P.; Zheng, H.D.; Liu, Y.Y.; Liu, X.L.; Jiang, W.Z.; Zhang, L.; Ma, W.G.; Ren, W.; Yin, W.B.; et al. Double acoustic microresonator quartz-enhanced photoacoustic spectroscopy. Opt. Lett. 2014, 39, 2479–2482. [Google Scholar] [CrossRef]
  8. Johannes, P.W.; Harald, M.; Bernhard, L. Compact quantum cascade laser based quartz-enhanced photoacoustic spectroscopy sensor system for detection of carbon disulfide. Opt. Express 2016, 24, 6559–6571. [Google Scholar]
  9. Giglio, M.; Zifarelli, A.; Sampaolo, A.; Menduni, G.; Elefante, A.; Blanchard, R.; Pfluegl, C.; Witinski, M.F.; Vakhshoori, D.; Wu, H.P.; et al. Broadband detection of methane and nitrous oxide using a distributed-feedback quantum cascade laser array and quartz-enhanced photoacoustic sensing. Photoacoustics 2020, 17, 100159. [Google Scholar] [CrossRef]
  10. Wang, Z.; Wang, Q.; Ching, J.Y.; Wu, J.C.; Zhang, G.F.; Ren, W. A portable low-power QEPAS-based CO2 isotope sensor using a fiber-coupled interband cascade laser. Sens. Actuators B Chem. 2017, 246, 710–715. [Google Scholar] [CrossRef]
  11. Li, Y.; Wang, R.Z.; Tittel, F.K.; Ma, Y.F. Sensitive methane detection based on quartz-enhanced photoacoustic spectroscopy with a high-power diode laser and wavelet filtering. Opt. Lasers Eng. 2020, 132, 106155. [Google Scholar] [CrossRef]
  12. Kosterev, A.A.; Mosely, T.S.; Tittel, F.K. Impact of humidity on quartz-enhanced photoacoustic spectroscopy based detection of HCN. Appl. Phys. B 2006, 85, 295–300. [Google Scholar] [CrossRef]
  13. Ma, Y.F.; Yu, X.; Yu, G.; Li, X.D.; Zhang, J.B.; Chen, D.Y.; Sun, R.; Tittel, F.K. Multi-quartz-enhanced photoacoustic spectroscopy. Appl. Phys. Lett. 2015, 107, 021106. [Google Scholar] [CrossRef] [Green Version]
  14. Dong, L.; Wright, J.; Peters, B.; Ferguson, B.A.; Tittel, F.K.; McWhorter, S. Compact QEPAS sensor for trace methane and ammonia detection in impure hydrogen. Appl. Phys. B 2012, 107, 459–467. [Google Scholar] [CrossRef] [Green Version]
  15. Kosterev, A.; Dong, L.; Thomazy, D.; Tittle, F.K.; Overby, S. QEPAS for chemical analysis of multi-component gas mixtures. Appl. Phys. B 2010, 101, 649–659. [Google Scholar] [CrossRef]
  16. Zhang, Q.D.; Chang, J.; Cong, Z.H.; Sun, J.C.; Wang, Z.L. QEPAS sensor for simultaneous measurements of H2O, CH4, and C2H2 using different QTFs. IEEE Photonics J. 2018, 10, 1–8. [Google Scholar] [CrossRef]
  17. Wu, H.P.; Yin, X.K.; Dong, L.; Pei, K.L.; Sampaolo, A.; Patimisco, P.; Zheng, H.D.; Ma, W.G.; Zhang, L.; Yin, W.B.; et al. Simultaneous dual-gas QEPAS detection based on a fundamental and overtone combined vibration of quartz tuning fork. Appl. Phys. Lett. 2017, 110, 121104. [Google Scholar] [CrossRef] [Green Version]
  18. Liu, H.; Hu, M.; Chen, X.; Deng, H.; Xu, Z.Y.; Wang, Q.; Li, X.; Kan, R.F.; Zhang, X.Y. Sensitive Detection of CH4 and CO2 Using Frequency-Division-Multiplexing Based Quartz-Enhanced Photoacoustic Spectroscopy. Acta Opt. Sin. 2021, 41, 244–250. [Google Scholar]
  19. Liu, Y.H.; Lin, H.Y.; Montano, B.; Zhu, W.G.; Zhong, Y.C.; Kan, R.F.; Yuan, B.; Yu, J.H.; Shao, M.; Zheng, H.D. Integrated near-infrared QEPAS sensor based on a 28 kHz quartz tuning fork for online monitoring of CO2 in the greenhouse. Photoacoustics 2022, 25, 100332. [Google Scholar] [CrossRef]
  20. Wang, Q.; Wang, Z.; Ren, W.; Patimisco, P.; Sampaolo, A.; Spagnolo, V. Fiber-ring laser intracavity QEPAS gas sensor using a 7.2 kHz quartz tuning fork. Sens. Actuators B Chem. 2018, 268, 512–518. [Google Scholar] [CrossRef]
  21. Yi, H.M. Theoretical and Experimental Research of Quartz-Enhanced Photoacoustic Spectroscopy Technique. Ph.D. Thesis, Chinese Academy of Sciences, Beijing, China, 2012. [Google Scholar]
  22. Wei, M.; Liu, J.G.; Kan, R.F.; Wang, W.; Yao, L.; Xu, Z.Y.; Yuan, S.; Dai, Y.H.; Jia, L.Q. Study on Detection of Greenhouse Gases Based on Quantum Cascade Laser. Acta Opt. Sin. 2014, 34, 341–347. [Google Scholar]
Figure 1. Instrument setup.
Sensors 22 04030 g001
Figure 2. Frequency response of the QTF.
Sensors 22 04030 g002
Figure 3. Amplitudes of second harmonics of CH4 and CO2, corresponding to different modulation currents. (a) CH4; (b) CO2.
Sensors 22 04030 g003
Figure 4. Time-domain 2f signals with the frequency-division multiplexing mode. (a) CH4; (b) CO2.
Sensors 22 04030 g004
Figure 5. Frequency-domain 2f signals of different gas mixtures. (a) First group; (b) second group.
Sensors 22 04030 g005
Figure 6. (a) Frequency-domain 2f signals of 200 ppm CH4 and 1200 ppm CO2; (b) a demonstration of multiple linear regression with the gas mixture of 300 ppm CH4 and 800 ppm CO2; (c) fitting residuals.
Sensors 22 04030 g006
Figure 7. Best-fit mole fractions of (a) CH4 and (c) CO2 retrieved with multiple linear regressions. Best-fit mole fractions of (b) CH4 and (d) CO2 as the function of calibrated gas samples.
Sensors 22 04030 g007
Figure 8. Evaluation of detection limits.
Sensors 22 04030 g008
Publisher’s Note: MDPI stays neutral with regard to jurisdictional claims in published maps and institutional affiliations.

