
Validation of Adhesive Single-Lead ECG Device Compared with Holter Monitoring among Non-Atrial Fibrillation Patients


 and
and
Abstract
1. Introduction
2. Materials and Methods
2.1. Study Design and Population
2.2. Ambulatory ECG Monitoring Using an Adhesive Single-Lead ECG and Holter Monitoring
2.3. Parameters of ECG Monitoring
2.4. Statistical Analysis
3. Results
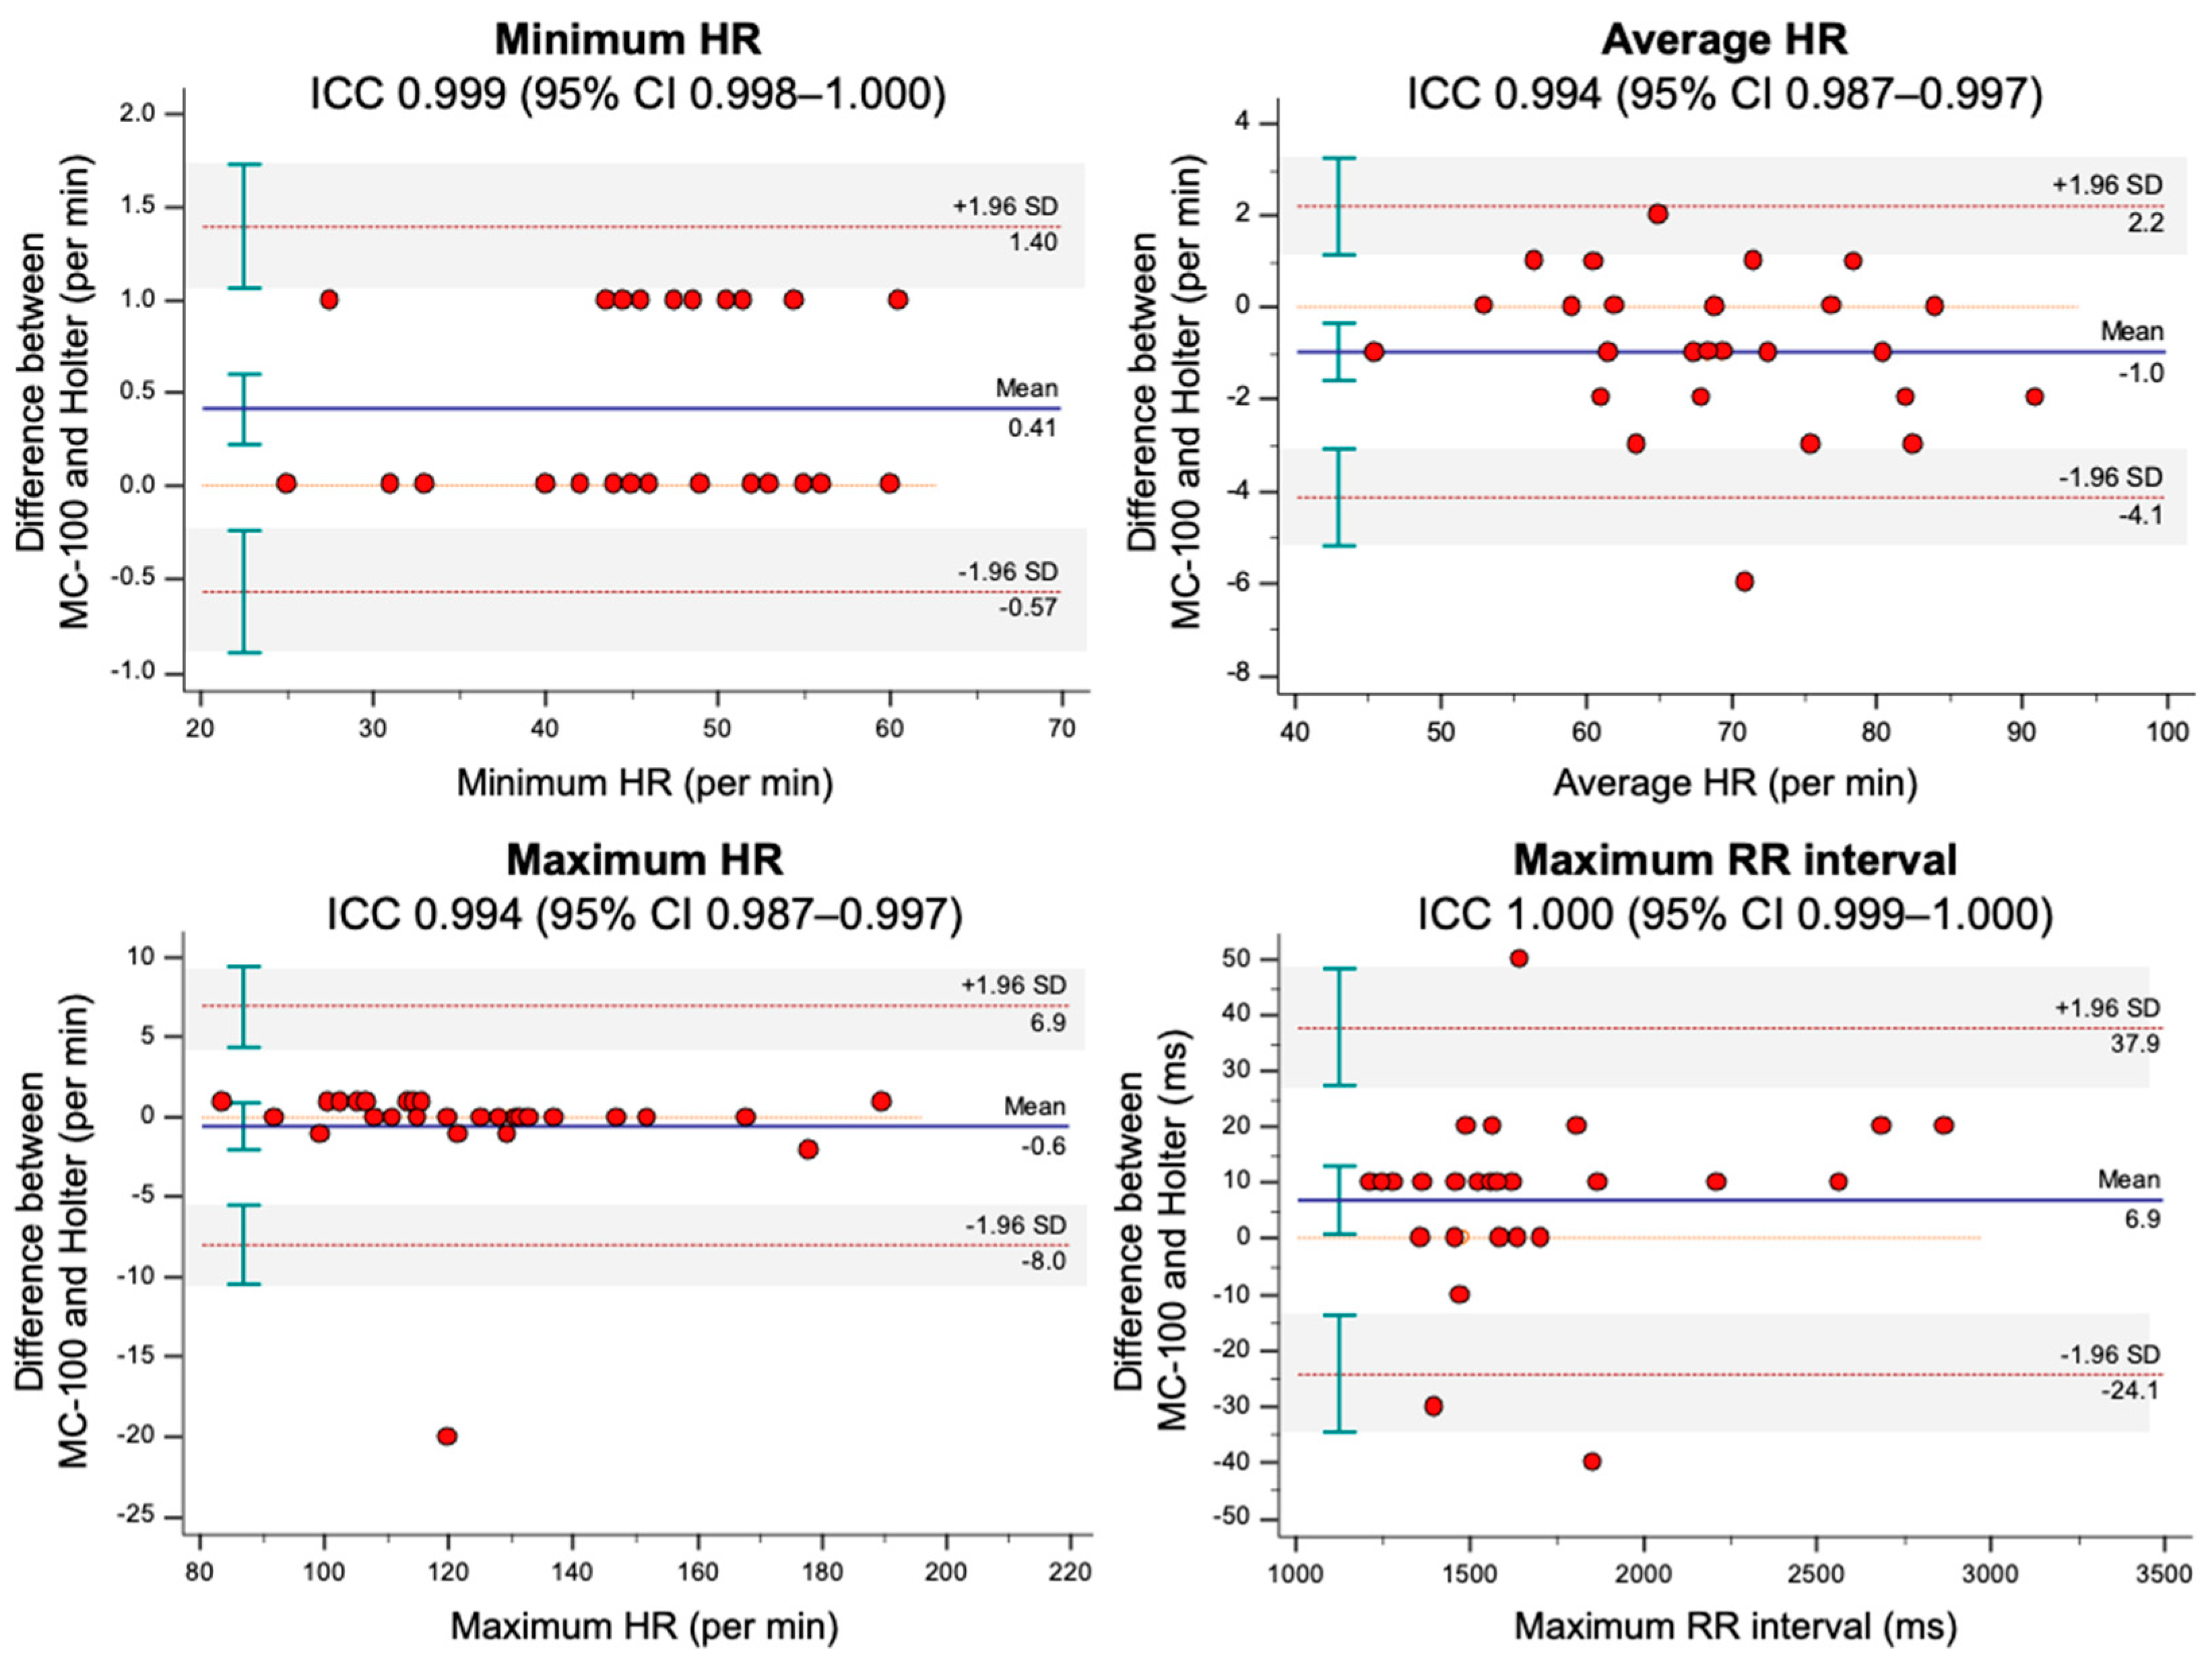
3.1. Comparisons of ECG Monitoring Parameters between the MC-100 and Holter
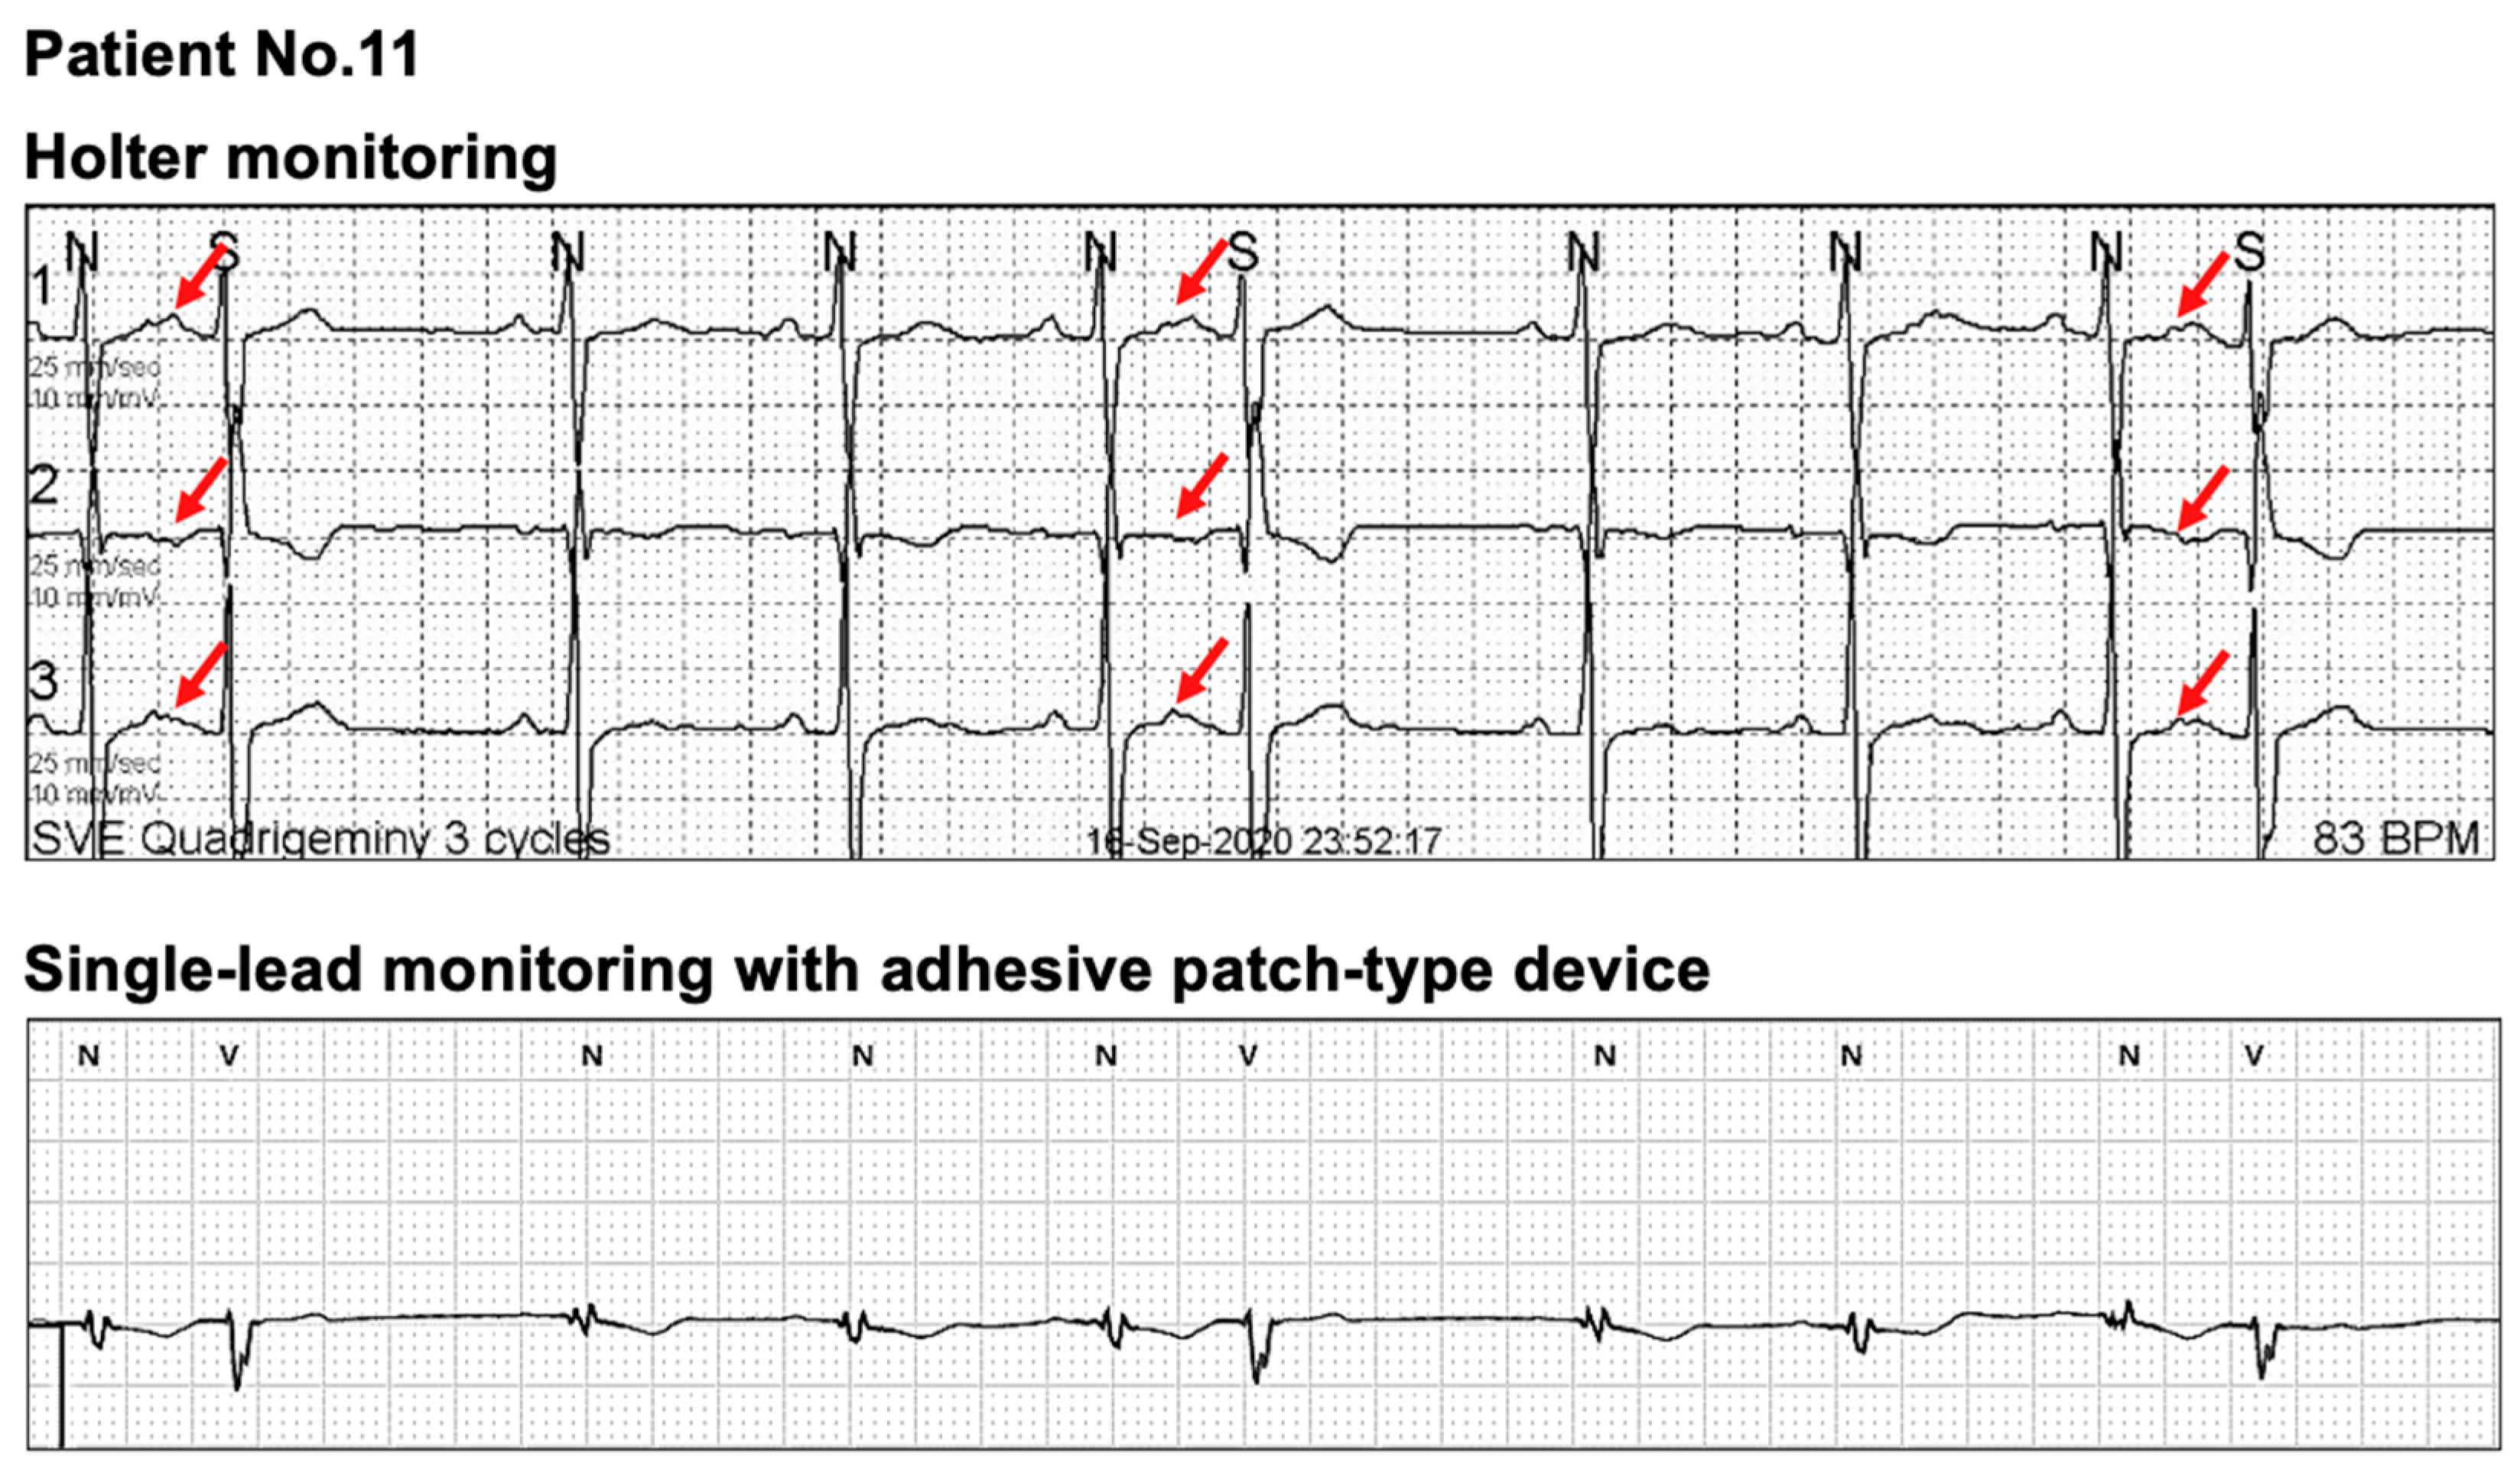
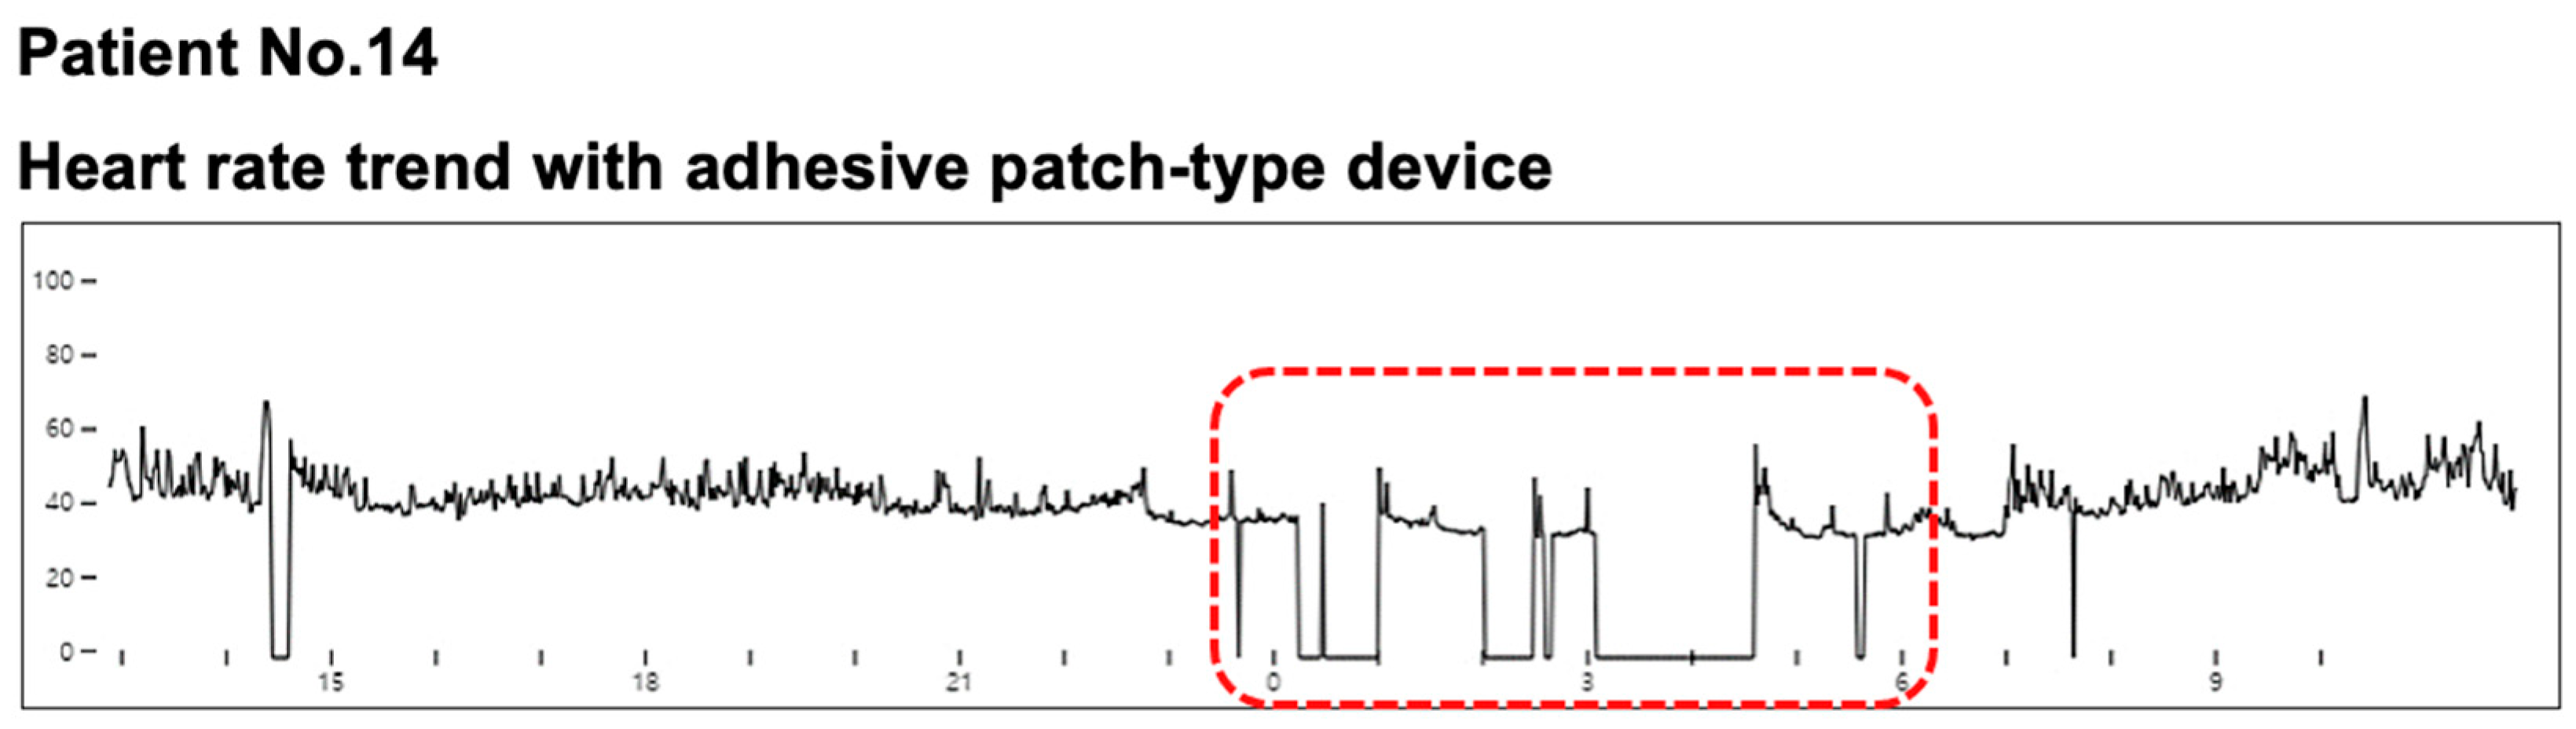
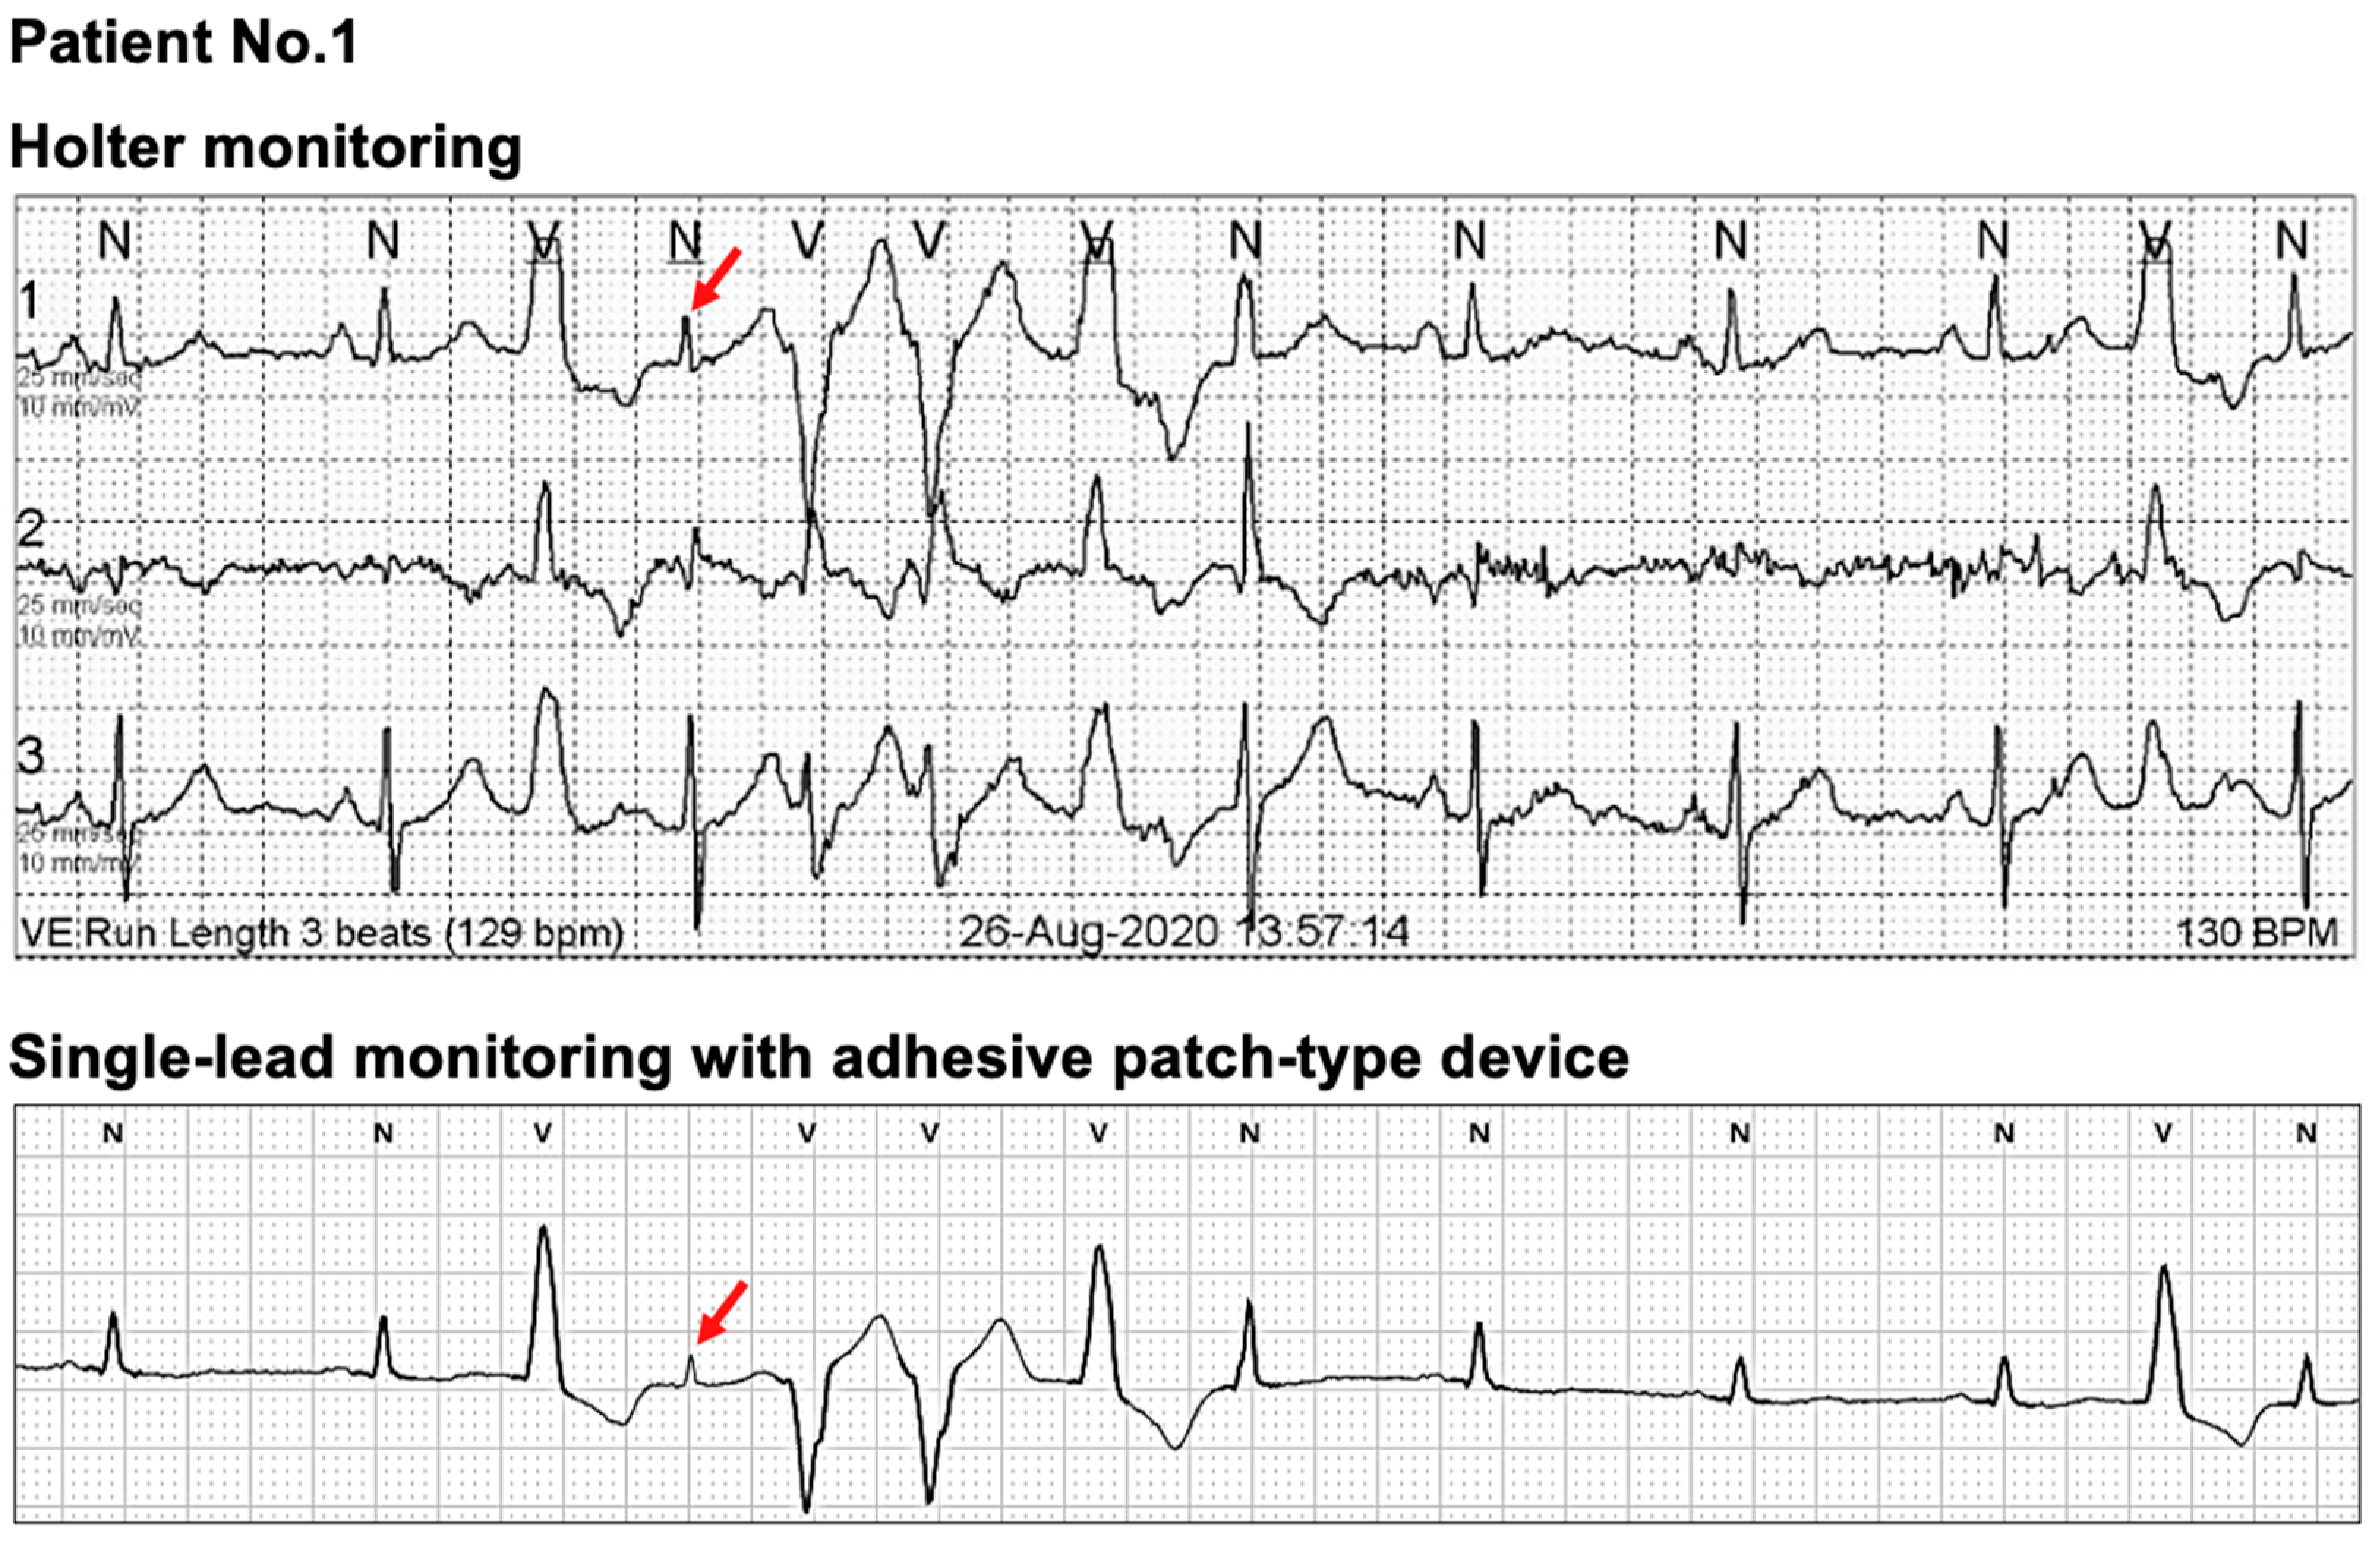
3.2. Comparison of the Clinical Diagnoses Based on Each Device between the Two Monitoring Methods
3.3. Self-Reported Questionnaire on Using the MC-100
4. Discussion
4.1. Current Status of Adhesive Single-Lead ECG Monitoring Device
4.2. Comparisons of the MC-100 and Holter Monitoring
4.3. Differences in ECG Measurements between the MC-100 and Holter
4.4. Limitations in Single-Lead ECG Monitoring
4.5. Limitations and Strengths
5. Conclusions
Author Contributions
Funding
Institutional Review Board Statement
Informed Consent Statement
Data Availability Statement
Conflicts of Interest
References
- Ikeda, T. Current use and future needs of noninvasive ambulatory electrocardiogram monitoring. Intern. Med. 2021, 60, 9–14. [Google Scholar] [CrossRef] [PubMed]
- Shen, W.-K.; Sheldon, R.S.; Benditt, D.G.; Cohen, M.I.; Forman, D.E.; Goldberger, Z.D.; Grubb, B.P.; Hamdan, M.H.; Krahn, A.D.; Link, M.S.; et al. 2017 ACC/AHA/HRS guideline for the evaluation and management of patients with syncope: A report of the American College of Cardiology/American Heart Association Task Force on clinical practice guidelines and the Heart Rhythm Society. Circulation 2017, 136, e60–e122. [Google Scholar]
- Hindricks, G.; Potpara, T.; Dagres, N.; Arbelo, E.; Bax, J.J.; Blomström-Lundqvist, C.; Boriani, G.; Castella, M.; Dan, G.A.; Dilaveris, P.E.; et al. 2020 ESC Guidelines for the diagnosis and management of atrial fibrillation developed in collaboration with the European Association of Cardio-Thoracic Surgery (EACTS). Eur. Heart J. 2021, 42, 546–547. [Google Scholar] [CrossRef] [PubMed]
- Busch, M.C.; Gross, S.; Alte, D.; Kors, J.A.; Völzke, H.; Ittermann, T.; Werner, A.; Krüger, A.; Busch, R.; Dörr, M.; et al. Impact of atrial fibrillation detected by extended monitoring—A population-based cohort study. Ann. Noninvasive Electrocardiol. 2017, 22, e12453. [Google Scholar] [CrossRef] [PubMed]
- Quan, K.J. Palpitation: Extended electrocardiogram monitoring: Which tests to use and when. Med. Clin. N. Am. 2019, 103, 785–791. [Google Scholar] [CrossRef] [PubMed]
- Turakhia, M.P.; Ullal, A.J.; Hoang, D.D.; Than, C.T.; Miller, J.D.; Friday, K.J.; Perez, M.V.; Freeman, J.V.; Wang, P.J.; Heidenreich, P.A. Feasibility of extended ambulatory electrocardiogram monitoring to identify silent atrial fibrillation in high-risk patients: The screening study for undiagnosed atrial fibrillation (STUDY-AF). Clin. Cardiol. 2015, 38, 285–292. [Google Scholar] [CrossRef] [PubMed]
- Steinhubl, S.R.; Waalen, J.; Edwards, A.M.; Ariniello, L.M.; Mehta, R.R.; Ebner, G.S.; Carter, C.; Baca-Motes, K.; Felicione, E.; Sarich, T.; et al. Effect of a home-based wearable continuous ECG monitoring patch on detection of undiagnosed atrial fibrillation: The mSToPS randomized clinical trial. JAMA 2018, 320, 146–155. [Google Scholar] [CrossRef] [PubMed]
- Krahn, A.D.; Klein, G.J.; Skanes, A.C.; Yee, R. Insertable loop recorder use for detection of intermittent arrhythmias. Pacing Clin. Electrophysiol. 2004, 27, 657–664. [Google Scholar] [CrossRef]
- Hindricks, G.; Pokushalov, E.; Urban, L.; Taborsky, M.; Kuck, K.-H.; Lebedev, D.; Rieger, G.; Pürerfellner, H. Performance of a new leadless implantable cardiac monitor in detecting and quantifying atrial fibrillation: Results of the XPECT trial. Circ. Arrhythm. Electrophysiol. 2010, 3, 141–147. [Google Scholar] [CrossRef]
- Brachmann, J.; Morillo, C.A.; Sanna, T.; Di Lazzaro, V.; Diener, H.C.; Bernstein, R.A.; Rymer, M.; Ziegler, P.D.; Liu, S.; Passman, R.S. Uncovering atrial fibrillation beyond short-term monitoring in cryptogenic stroke patients: Three-year results from the cryptogenic stroke and underlying atrial fibrillation trial. Circ. Arrhythm. Electrophysiol. 2016, 9, e003333. [Google Scholar] [CrossRef]
- Chew, D.S.; Rennert-May, E.; Spackman, E.; Mark, D.B.; Exner, D.V. Cost-effectiveness of extended electrocardiogram monitoring for atrial fibrillation after stroke: A systematic review. Stroke 2020, 51, 2244–2248. [Google Scholar] [CrossRef] [PubMed]
- Sana, F.; Isselbacher, E.M.; Singh, J.P.; Heist, E.K.; Pathik, B.; Armoundas, A.A. Wearable devices for ambulatory cardiac monitoring: JACC state-of-the-art review. J. Am. Coll. Cardiol. 2020, 75, 1582–1592. [Google Scholar] [CrossRef] [PubMed]
- Ip, J.E. Wearable devices for cardiac rhythm diagnosis and management. JAMA 2019, 321, 337–338. [Google Scholar] [CrossRef] [PubMed]
- Perez, M.V.; Mahaffey, K.W.; Hedlin, H.; Rumsfeld, J.S.; Garcia, A.; Ferris, T.; Balasubramanian, V.; Russo, A.M.; Rajmane, A.; Cheung, L.; et al. Large-scale assessment of a smartwatch to identify atrial fibrillation. N. Engl. J. Med. 2019, 381, 1909–1917. [Google Scholar] [CrossRef]
- Hwang, J.; Kim, J.; Choi, K.J.; Cho, M.S.; Nam, G.B.; Kim, Y.H. Assessing accuracy of wrist-worn wearable devices in measurement of paroxysmal supraventricular tachycardia heart rate. Korean Circ. J. 2019, 49, 437–445. [Google Scholar] [CrossRef]
- Heckbert, S.R.; Austin, T.R.; Jensen, P.N.; Floyd, J.S.; Psaty, B.M.; Soliman, E.Z.; Kronmal, R.A. Yield and consistency of arrhythmia detection with patch electrocardiographic monitoring: The multi-ethnic study of atherosclerosis. J. Electrocardiol. 2018, 51, 997–1002. [Google Scholar] [CrossRef]
- Nault, I.; André, P.; Plourde, B.; Leclerc, F.; Sarrazin, J.-F.; Philippon, F.; O’Hara, G.; Molin, F.; Steinberg, C.; Roy, K.; et al. Validation of a novel single lead ambulatory ECG monitor—Cardiostat—Compared to a standard ECG Holter monitoring. J. Electrocardiol. 2019, 53, 57–63. [Google Scholar] [CrossRef]
- Karaoğuz, M.R.; Yurtseven, E.; Aslan, G.; Deliormanlı, B.G.; Adıgüzel, Ö.G.M.; Li, K.-M.; Yılmaz, E.N. The quality of ECG data acquisition, and diagnostic performance of a novel adhesive patch for ambulatory cardiac rhythm monitoring in arrhythmia detection. J. Electrocardiol. 2019, 54, 28–35. [Google Scholar] [CrossRef]
- Barrett, P.M.; Komatireddy, R.; Haaser, S.; Topol, S.; Sheard, J.; Encinas, J.; Fought, A.J.; Topol, E.J. Comparison of 24-hour Holter monitoring with 14-day novel adhesive patch electrocardiographic monitoring. Am. J. Med. 2014, 127. [Google Scholar] [CrossRef]
- Bayoumy, K.; Gaber, M.; Elshafeey, A.; Mhaimeed, O.; Dineen, E.H.; Marvel, F.A.; Martin, S.S.; Muse, E.D.; Turakhia, M.P.; Tarakji, K.G.; et al. Smart wearable devices in cardiovascular care: Where we are and how to move forward. Nat. Rev. Cardiol. 2021. [Google Scholar] [CrossRef]
- Giebel, G.D.; Gissel, C. Accuracy of mHealth devices for atrial fibrillation screening: Systematic review. JMIR mHealth uHealth 2019, 7, e13641. [Google Scholar] [CrossRef] [PubMed]
- Yang, T.Y.; Huang, L.; Malwade, S.; Hsu, C.Y.; Chen, Y.C. Diagnostic accuracy of ambulatory devices in detecting atrial fibrillation: Systematic review and meta-analysis. JMIR Mhealth Uhealth 2021, 9, e26167. [Google Scholar] [CrossRef] [PubMed]
- Zhu, H.; Pan, Y.; Wu, F.; Huan, R. Optimized electrode locations for wearable single-lead ECG monitoring devices: A case study using WFEES modules based on the LANS method. Sensors 2019, 19, 4458. [Google Scholar] [CrossRef] [PubMed]
- Bland, J.M.; Altman, D.G. Statistical methods for assessing agreement between two methods of clinical measurement. Lancet 1986, 1, 307–310. [Google Scholar] [CrossRef]
- Stockl, D.; Rodriguez Cabaleiro, D.; Van Uytfanghe, K.; Thienpont, L.M. Interpreting method comparison studies by use of the Bland-Altman plot: Reflecting the importance of sample size by incorporating confidence limits and predefined error limits in the graphic. Clin. Chem. 2004, 50, 2216–2218. [Google Scholar] [CrossRef]
- Bansal, A.; Joshi, R. Portable out-of-hospital electrocardiography: A review of current technologies. J. Arrhythm. 2018, 34, 129–138. [Google Scholar] [CrossRef]
- Al-Alusi, M.A.; Ding, E.; McManus, D.D.; Lubitz, S.A. Wearing your heart on your sleeve: The future of cardiac rhythm monitoring. Curr. Cardiol. Rep. 2019, 21, 158. [Google Scholar] [CrossRef] [PubMed]
- Mehta, D.D.; Nazir, N.T.; Trohman, R.G.; Volgman, A.S. Single-lead portable ECG devices: Perceptions and clinical accuracy compared to conventional cardiac monitoring. J. Electrocardiol. 2015, 48, 710–716. [Google Scholar] [CrossRef]
- Desteghe, L.; Raymaekers, Z.; Lutin, M.; Vijgen, J.; Dilling-Boer, D.; Koopman, P.; Schurmans, J.; Vanduynhoven, P.; Dendale, P.; Heidbuchel, H. Performance of handheld electrocardiogram devices to detect atrial fibrillation in a cardiology and geriatric ward setting. Europace 2017, 19, 29–39. [Google Scholar]
- Wong, K.C.; Klimis, H.; Lowres, N.; von Huben, A.; Marschner, S.; Chow, C.K. Diagnostic accuracy of handheld electrocardiogram devices in detecting atrial fibrillation in adults in community versus hospital settings: A systematic review and meta-analysis. Heart 2020, 106, 1211–1217. [Google Scholar] [CrossRef]
- Pevnick, J.M.; Birkeland, K.; Zimmer, R.; Elad, Y.; Kedan, I. Wearable technology for cardiology: An update and framework for the future. Trends Cardiovasc. Med. 2018, 28, 144–150. [Google Scholar] [CrossRef] [PubMed]
- Ackermans, P.A.; Solosko, T.A.; Spencer, E.C.; Gehman, S.E.; Nammi, K.; Engel, J.; Russell, J.K. A user-friendly integrated monitor-adhesive patch for long-term ambulatory electrocardiogram monitoring. J. Electrocardiol. 2012, 45, 148–153. [Google Scholar] [CrossRef] [PubMed]
- Ramkumar, S.; Nerlekar, N.; D’Souza, D.; Pol, D.J.; Kalman, J.M.; Marwick, T.H. Atrial fibrillation detection using single lead portable electrocardiographic monitoring: A systematic review and meta-analysis. BMJ Open 2018, 8, e024178. [Google Scholar] [CrossRef]
- Cheung, C.C.; Kerr, C.R.; Krahn, A.D. Comparing 14-day adhesive patch with 24-h Holter monitoring. Future Cardiol. 2014, 10, 319–322. [Google Scholar] [CrossRef]
- Jacobs, M.S.; Kaasenbrood, F.; Postma, M.J.; van Hulst, M.; Tieleman, R.G. Cost-effectiveness of screening for atrial fibrillation in primary care with a handheld, single-lead electrocardiogram device in the Netherlands. Europace 2018, 20, 12–18. [Google Scholar] [CrossRef] [PubMed]


| Manufacturer | Seers Technology (Seongnam-si, Gyeonggi-do, Republic of Korea) |
| Product serial number | mobiCARE-MC100 |
| Product appearance |  |
| Size | Width 29 mm, length 120 mm |
| Weight | 8.9 g |
| Measurements | Single-lead electrocardiogram in real-time, heart rate, movement activity |
| Sensors | Electrodes, accelerometers, gyroscopes |
| Connectivity | Bluetooth low energy |
| Heart rate measurement range | From 30 to 240 beat-per-minutes |
| Sampling rate | 256 Hz |
| Battery | Replaceable CR2032H coin cell battery |
| Electrode standard | Medical standard 4.0 mm electrode snaps for electrocardiogram |
| Operating time | Lasting at least 72 h continuously |
| Characteristics | Value |
|---|---|
| Demographic factors | |
| Age, year | 55.1 ± 12.8 |
| Male, % | 14 (48.3) |
| Height, cm | 164.5 ± 6.7 |
| Weight, kg | 66.6 ± 11.1 |
| Body mass index, kg/m2 | 24.5 ± 2.8 |
| Comorbidity | |
| Hypertension | 10 (34.5) |
| Diabetes mellitus | 2 (6.9) |
| Congestive heart failure | 1 (3.4) |
| Peripheral artery disease | 0 (0) |
| Ischemic heart disease | 0 (0) |
| Chronic kidney disease | 2 (6.9) |
| Chronic liver disease | 1 (3.4) |
| Ischemic stroke | 1 (3.4) |
| Indication for ECG monitoring 1 | |
| Suspicious arrhythmia-related symptoms 2 | 11 (37.9) |
| History of arrhythmia | 20 (69.0) |
| Premature atrial contraction | 2 (6.9) |
| Supraventricular tachyarrhythmia | 3 (10.3) |
| Atrial flutter | 1 (3.4) |
| Premature ventricular contraction | 12 (41.4) |
| Idiopathic ventricular tachycardia | 1 (3.4) |
| Second-degree atrioventricular block, Mobitz type 1 | 1 (3.4) |
| Holter | mobiCARE-MC100 | ICC (95% CI) | p-Value for Reliability | p-Value for Mean Difference | |
|---|---|---|---|---|---|
| Total participants, N | 29 | 29 | - | - | - |
| Noise, % | 0.01 ± 0.01 | 0.04 ± 0.05 1 | - | - | 0.024 |
| Total wear time, min 2 | 1403 ± 20 | 1408 ± 20 | - | - | <0.001 |
| Total QRS complexes, N | 96,073 ± 13,922 | 94,910 ± 14,510 | 0.991 (0.982–0.996) | <0.001 | 0.024 |
| Total VEBs, N | 6 (1–948) | 5 (1–1459) | 1.000 (0.999–1.000) | <0.001 | 0.984 |
| Total SVEBs, N | 25 (8–93) | 48 (13–1485) | 0.987 (0.973–0.994) | <0.001 | 0.459 |
| Burden of VEBs, % | 0.01 (0–0.96) | 0.01 (0–1.57) | 1.000 (0.999–1.000) | <0.001 | 0.648 |
| Burden of SVEBs, % | 0.03 (0.01–0.10) | 0.05 (0.01–1.62) | 0.986 (0.970–0.993) | <0.001 | 0.370 |
| Patients with frequent VEBs, N (%) 3 | 4 (13.8) | 4 (13.8) | - | - | >0.999 |
| Patients with frequent SVEBs, N (%) 3 | 2 (6.9) | 1 (3.4) | - | - | 0.317 |
| Minimum HR, beats/min | 45.9 ± 8.6 | 46.3 ± 8.7 | 0.999 (0.998–1.000) | <0.001 | <0.001 |
| Average HR, beats/min | 68.7 ± 10.1 | 69.7 ± 10.5 | 0.994 (0.987–0.997) | <0.001 | 0.003 |
| Maximum HR, beats/min | 123.9 ± 24.7 | 123.3 ± 24.5 | 0.994 (0.987–0.997) | <0.001 | 0.442 |
| Maximum RR interval, ms | 1560 (1460–1755) | 1570 (1465–1765) | 1.000 (0.999–1.000) | <0.001 | <0.001 |
| Patient No. | Holter | MC-100 |
|---|---|---|
| Patient 1 | Frequent PVC 1 | Frequent PVC 1 |
| Patient 2 | Frequent PVC 1 | Frequent PVC 1 |
| Patient 3 | Predominantly SR 2 | Predominantly SR 2 |
| Patient 4 | PAT | PAT |
| Patient 5 | Predominantly SR 2 | Predominantly SR 2 |
| Patient 6 | Predominantly SR 2 | Predominantly SR 2 |
| Patient 7 | Predominantly SR 2 | Predominantly SR 2 |
| Patient 8 | PAT | PAT |
| Patient 9 | Predominantly SR 2 | Predominantly SR 2 |
| Patient 10 | Predominantly SR 2 | Predominantly SR 2 |
| Patient 11 | PAT, frequent PAC 1 | PAT |
| Patient 12 | Frequent PVC 1 | Frequent PVC 1 |
| Patient 13 | Predominantly SR 2 | Predominantly SR 2 |
| Patient 14 | Predominantly SR 2 | Predominantly SR 2 |
| Patient 15 | Predominantly SR 2 | Predominantly SR2 |
| Patient 16 | Second-degree AVB (type 1), NSVT | Second-degree AVB (type 1), NSVT |
| Patient 17 | Predominantly SR 2 | Predominantly SR 2 |
| Patient 18 | Frequent PVC 1, NSVT | Frequent PVC 1, NSVT |
| Patient 19 | Predominantly SR 2 | Predominantly SR 2 |
| Patient 20 | Predominantly SR 2 | Predominantly SR2 |
| Patient 21 | PAT | PAT |
| Patient 22 | Predominantly SR 2 | Predominantly SR 2 |
| Patient 23 | Predominantly SR 2 | Predominantly SR 2 |
| Patient 24 | Predominantly SR 2 | Predominantly SR 2 |
| Patient 25 | SSS | SSS |
| Patient 26 | Predominantly SR 2 | Predominantly SR 2 |
| Patient 27 | Predominantly SR 2 | Predominantly SR 2 |
| Patient 28 | PAT, frequent PAC 1 | PAT, frequent PAC 1 |
| Patient 29 | PAT | PAT |
| Mean ± SD or N (%) | |
|---|---|
| Usability of the adhesive single-lead ECG monitoring device | |
| Did you feel discomfort with the device? (None = 1, Minimal = 2, Some = 3, Much = 4, Very much = 5) | 1.6 ± 1.0 |
| Did you feel skin irritability with the device? (None = 1, Minimal = 2, Some = 3, Much = 4, Very much = 5) | 1.8 ± 1.2 |
| When do you most feel the discomfort of using the device? | |
| During sleep | 3 (10.3) |
| During activity | 9 (31.0) |
| During rest | 0 (0) |
| Did you have detached episode(s) with the device? | 0 (0) |
| Usability of the smartphone application for the monitoring device | |
| Did you check the application for monitoring your ECG? (None = 1, Minimal = 2, Some = 3, Much = 4, Very much = 5) | 2.4 ± 1.3 |
| Did you record an episode with the application when you had symptoms? (None = 1, Minimal = 2, Some = 3, Much = 4, Very much = 5) | 1.7 ± 1.3 |
| Was it easy to record your symptom with the application? (None = 1, Minimal = 2, Some = 3, Much = 4, Very much = 5) | 2.5 ± 1.4 |
| Did you receive alarms from the application for the device disconnection? | 17 (58.6) |
| Overall product evaluation | |
| Do you satisfy with using the device? (None = 1, Minimal = 2, Some = 3, Much = 4, Very much = 5) | 4.1 ± 1.0 |
| Do you satisfy with using the application? (None = 1, Minimal = 2, Some = 3, Much = 4, Very much = 5) | 4.0 ± 1.2 |
| MC-100 | Holter | |
|---|---|---|
| Manufacturer | Seers Technology | Variable |
| Monitoring period | Up to 3 days | Up to 3 days |
| ECG channels | 1 | 3–12, variable |
| Real-time monitoring | Yes | No |
| Weight | 9 g | Typically over 100 g, variable |
| Battery | Replaceable commercial coin cell battery | Mostly built-in, variable |
| Electrodes | Replaceable commercial ECG electrodes | Replaceable commercial ECG electrodes |
| Data storage | User’s smartphone with the application is necessary to monitor and store ECG data. Bluetooth connectivity is required | Built-in memory. Data transmission and processing are processed in the clinic |
| Associated components | Electrodes only | Electrodes, leads, symptom recorder, straps, variable |
Publisher’s Note: MDPI stays neutral with regard to jurisdictional claims in published maps and institutional affiliations. |
© 2021 by the authors. Licensee MDPI, Basel, Switzerland. This article is an open access article distributed under the terms and conditions of the Creative Commons Attribution (CC BY) license (https://creativecommons.org/licenses/by/4.0/).
Share and Cite
Kwon, S.; Lee, S.-R.; Choi, E.-K.; Ahn, H.-J.; Song, H.-S.; Lee, Y.-S.; Oh, S. Validation of Adhesive Single-Lead ECG Device Compared with Holter Monitoring among Non-Atrial Fibrillation Patients. Sensors 2021, 21, 3122. https://doi.org/10.3390/s21093122
Kwon S, Lee S-R, Choi E-K, Ahn H-J, Song H-S, Lee Y-S, Oh S. Validation of Adhesive Single-Lead ECG Device Compared with Holter Monitoring among Non-Atrial Fibrillation Patients. Sensors. 2021; 21(9):3122. https://doi.org/10.3390/s21093122
Chicago/Turabian StyleKwon, Soonil, So-Ryoung Lee, Eue-Keun Choi, Hyo-Jeong Ahn, Hee-Seok Song, Young-Shin Lee, and Seil Oh. 2021. "Validation of Adhesive Single-Lead ECG Device Compared with Holter Monitoring among Non-Atrial Fibrillation Patients" Sensors 21, no. 9: 3122. https://doi.org/10.3390/s21093122
APA StyleKwon, S., Lee, S.-R., Choi, E.-K., Ahn, H.-J., Song, H.-S., Lee, Y.-S., & Oh, S. (2021). Validation of Adhesive Single-Lead ECG Device Compared with Holter Monitoring among Non-Atrial Fibrillation Patients. Sensors, 21(9), 3122. https://doi.org/10.3390/s21093122