
Bi-FPNFAS: Bi-Directional Feature Pyramid Network for Pixel-Wise Face Anti-Spoofing by Leveraging Fourier Spectra

 ,
,  , , , , and
Abstract
1. Introduction
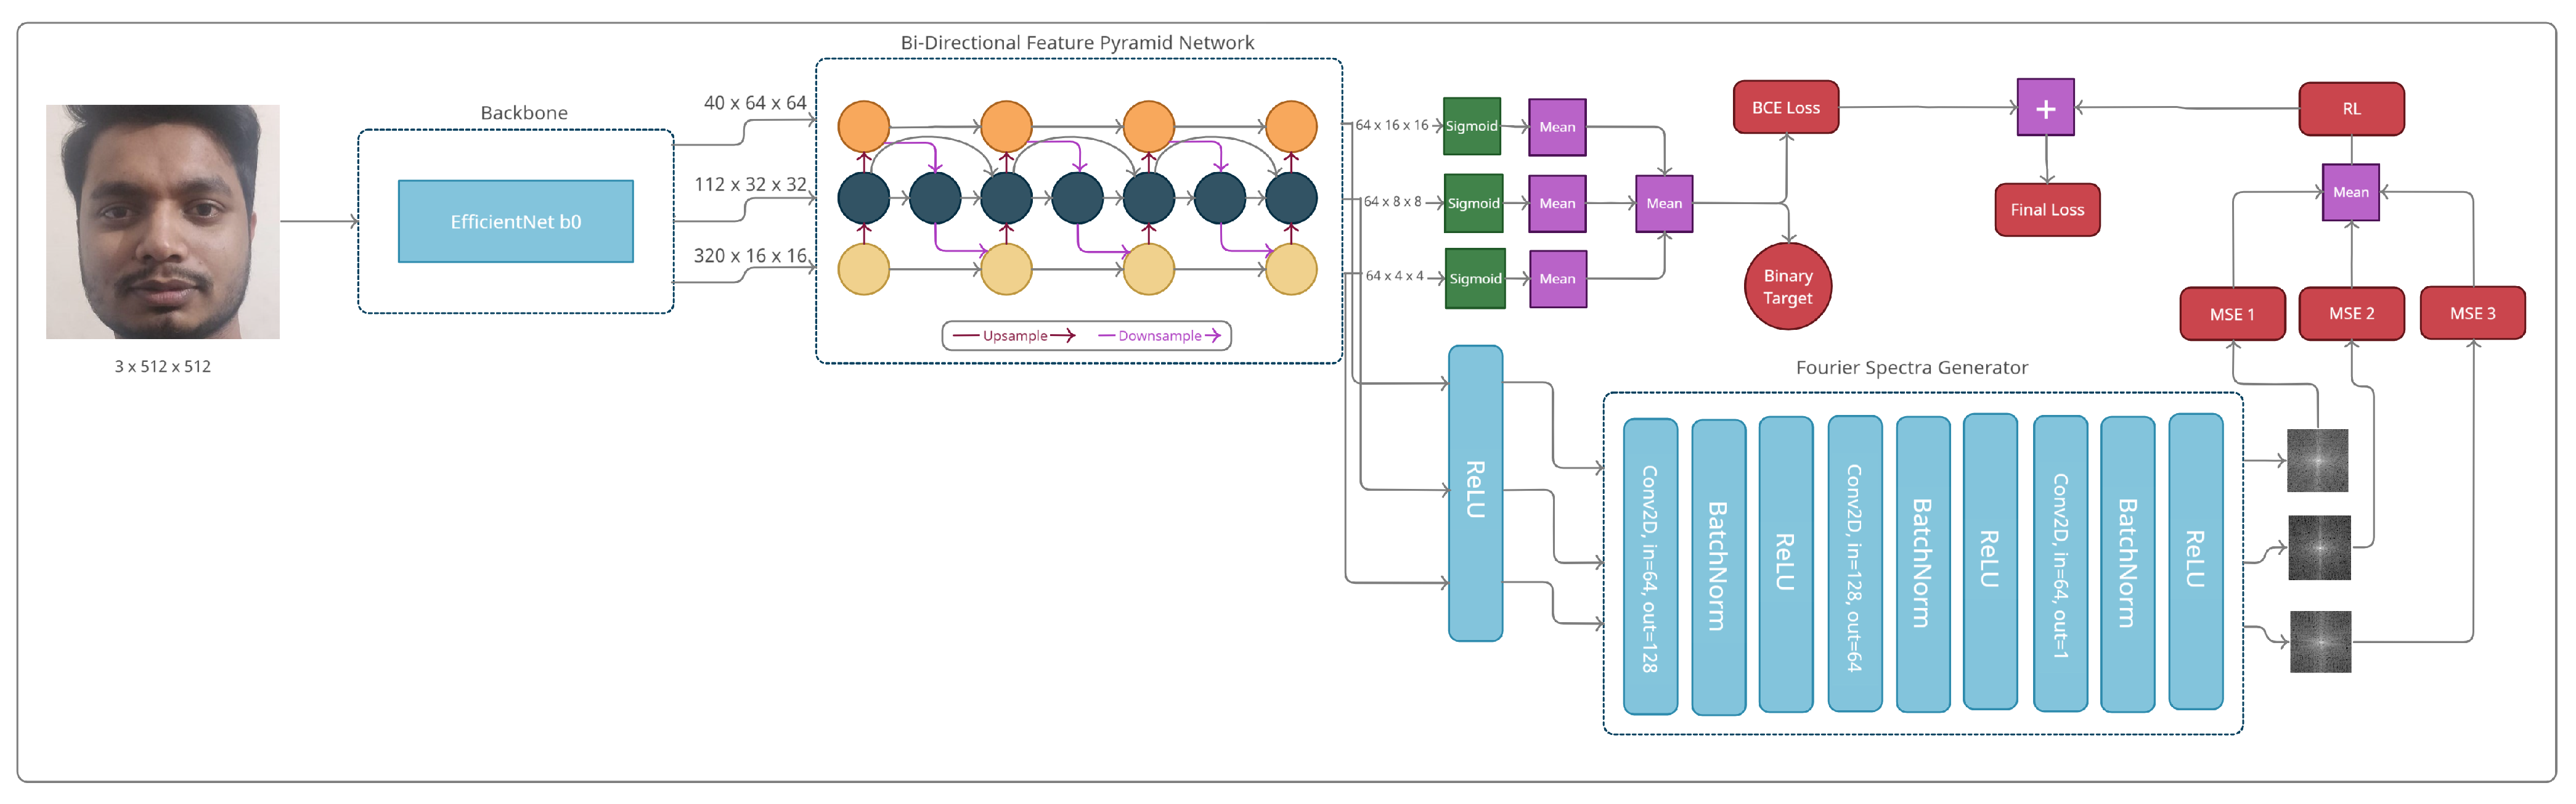
- We propose a multi-scaled approach to face anti-spoofing, Bi-FAS, which uses a bi-directional feature pyramid network.
- We find that among the five different pyramid features, the inclusion of two larger pyramids containing high-level information demonstrates negligible improvements.
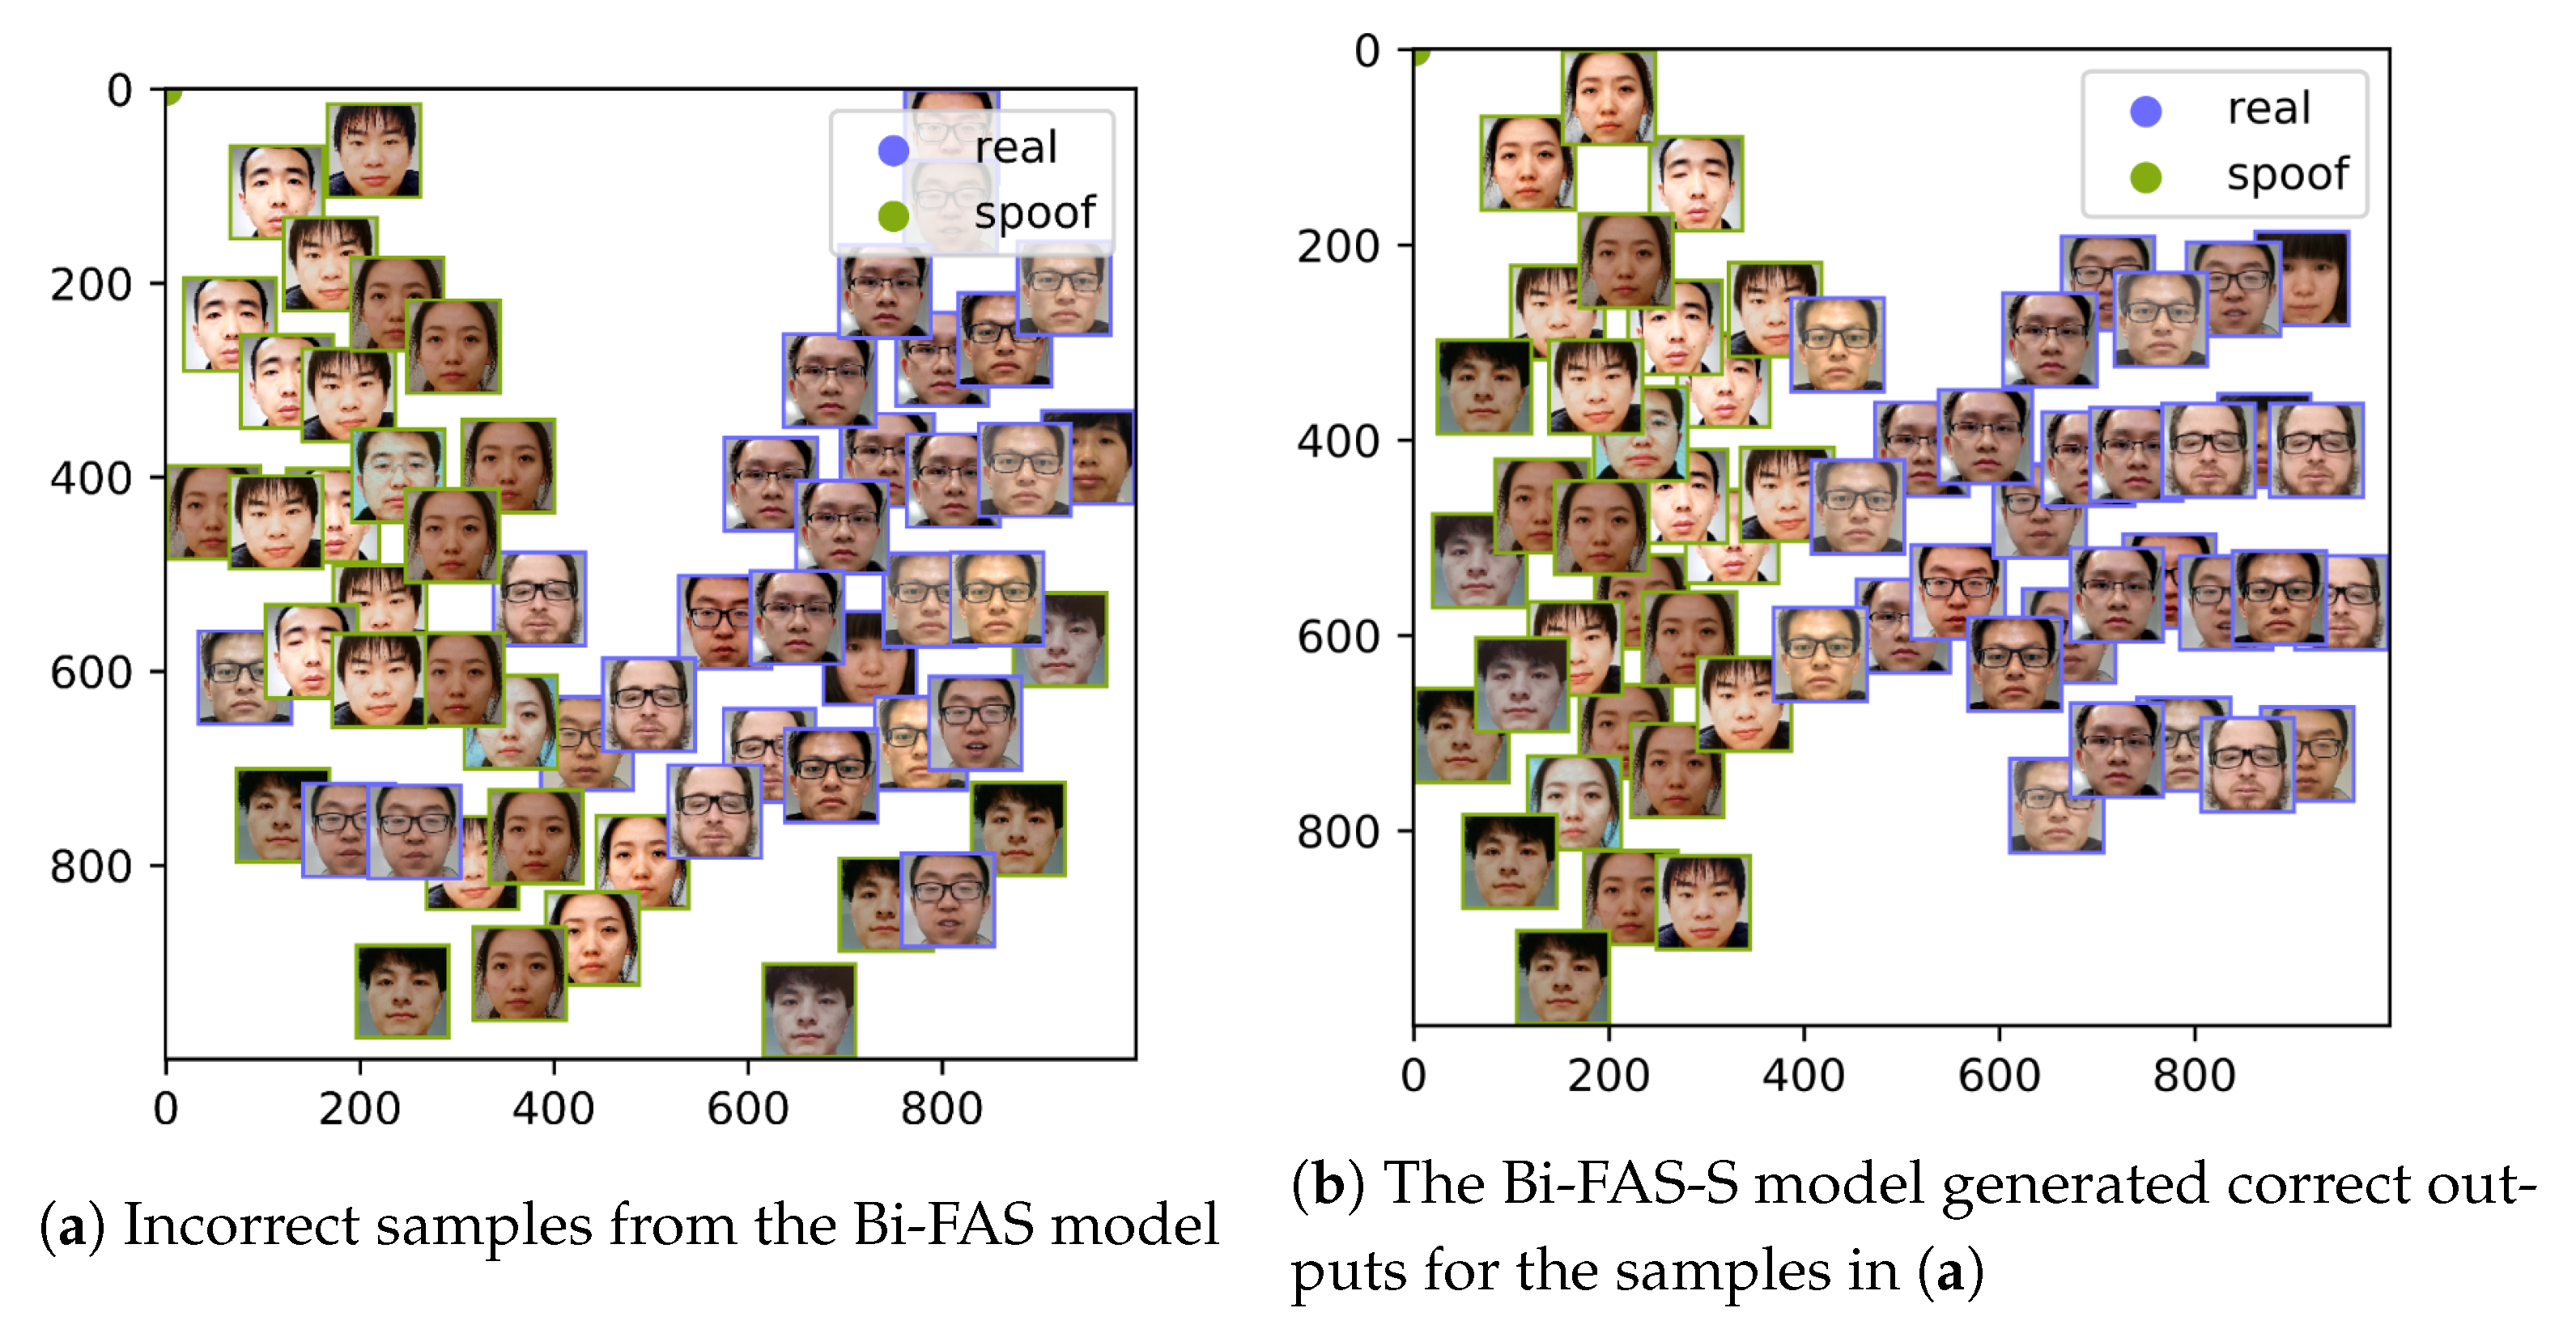
- We extend our previous approach based on BiFPN by introducing a self-supervised branch optimized on the frequency domain using a reconstruction loss. We refer to this model as Bi-FAS-S throughout the rest of this paper.
2. Related Works
2.1. Face Anti-Spoofing
2.2. Pixel-Wise Supervision for FAS
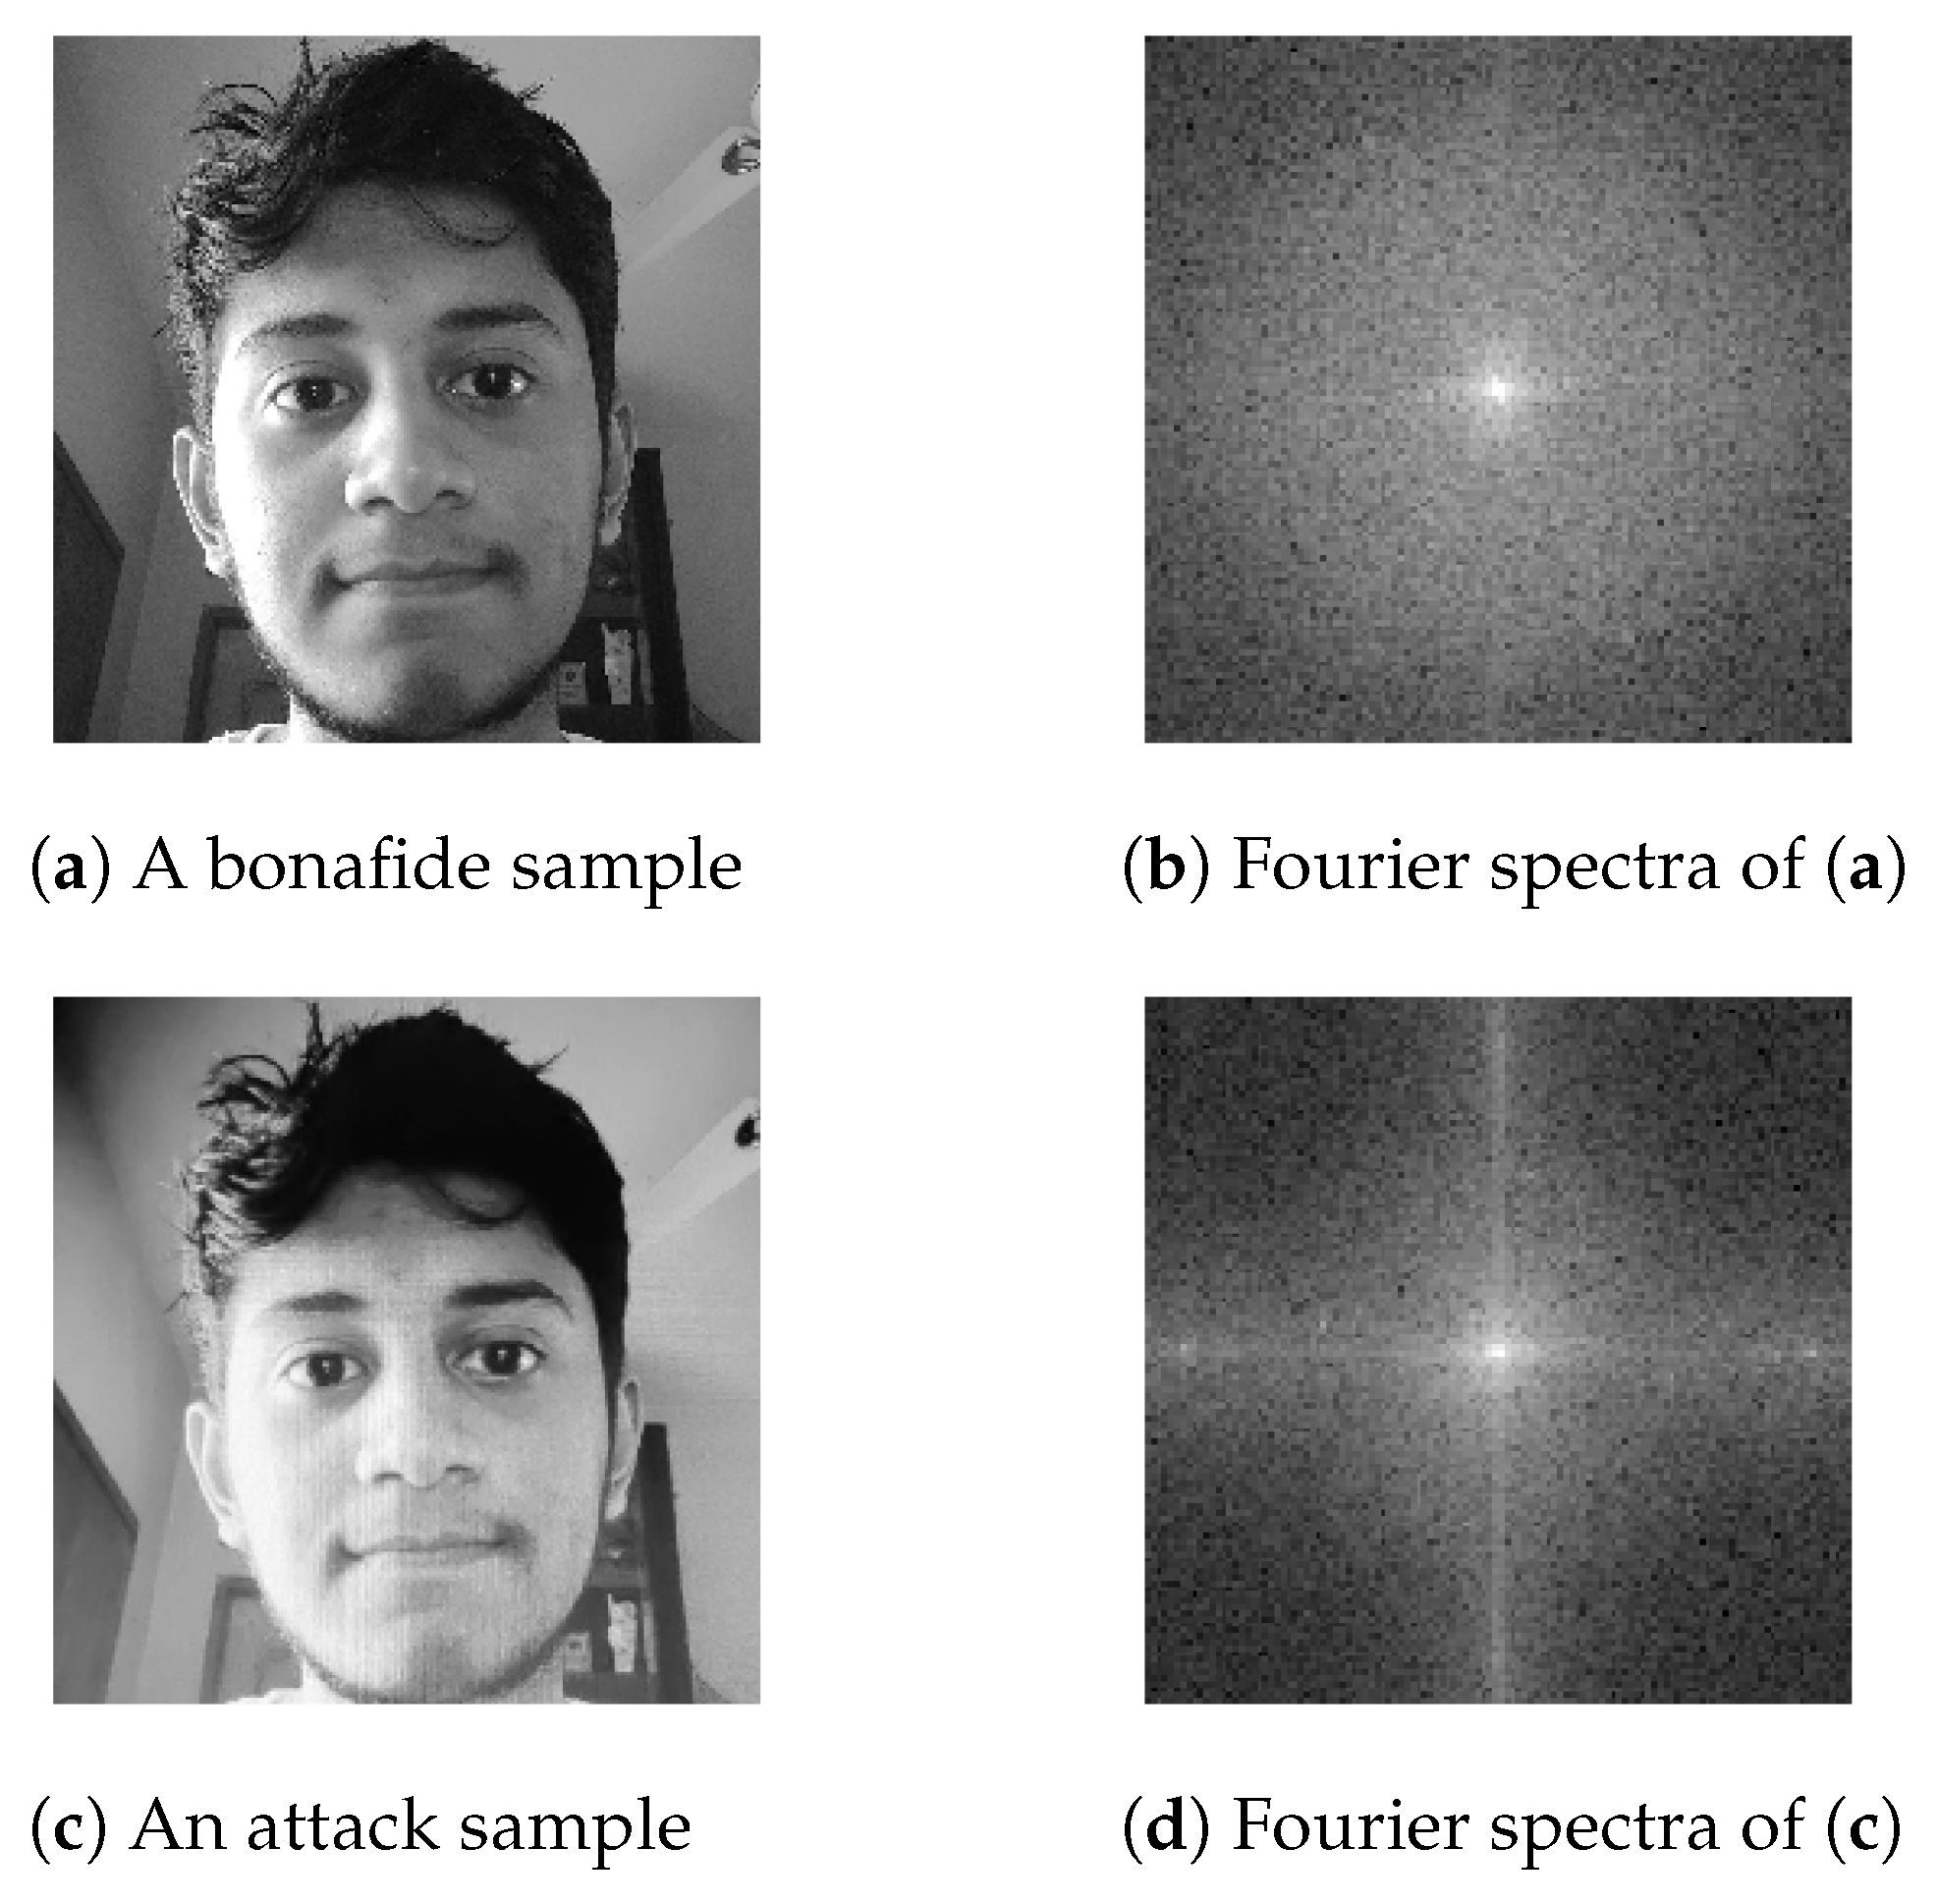
2.3. Fourier-Spectra-Based FAS
2.4. Multi-Scaled Feature Representation
2.5. EfficientDet
3. Materials
3.1. Datasets
- Protocol I evaluates the model’s invariance to different environments; the environments of the training and validation sets are different from the ones in the testing set.
- Protocol II tests if the model is robust to various devices, with dissimilar devices in the training and the testing partitions.
- Protocol III uses tests that consist of phones with various camera resolutions that are different from the resolutions present in the training and testing sets.
- Protocol IV is a composition of all preceding constraints, but also with a smaller training set. This is undoubtedly the most challenging protocol [16] among the four.
3.2. Metrics
4. Methods
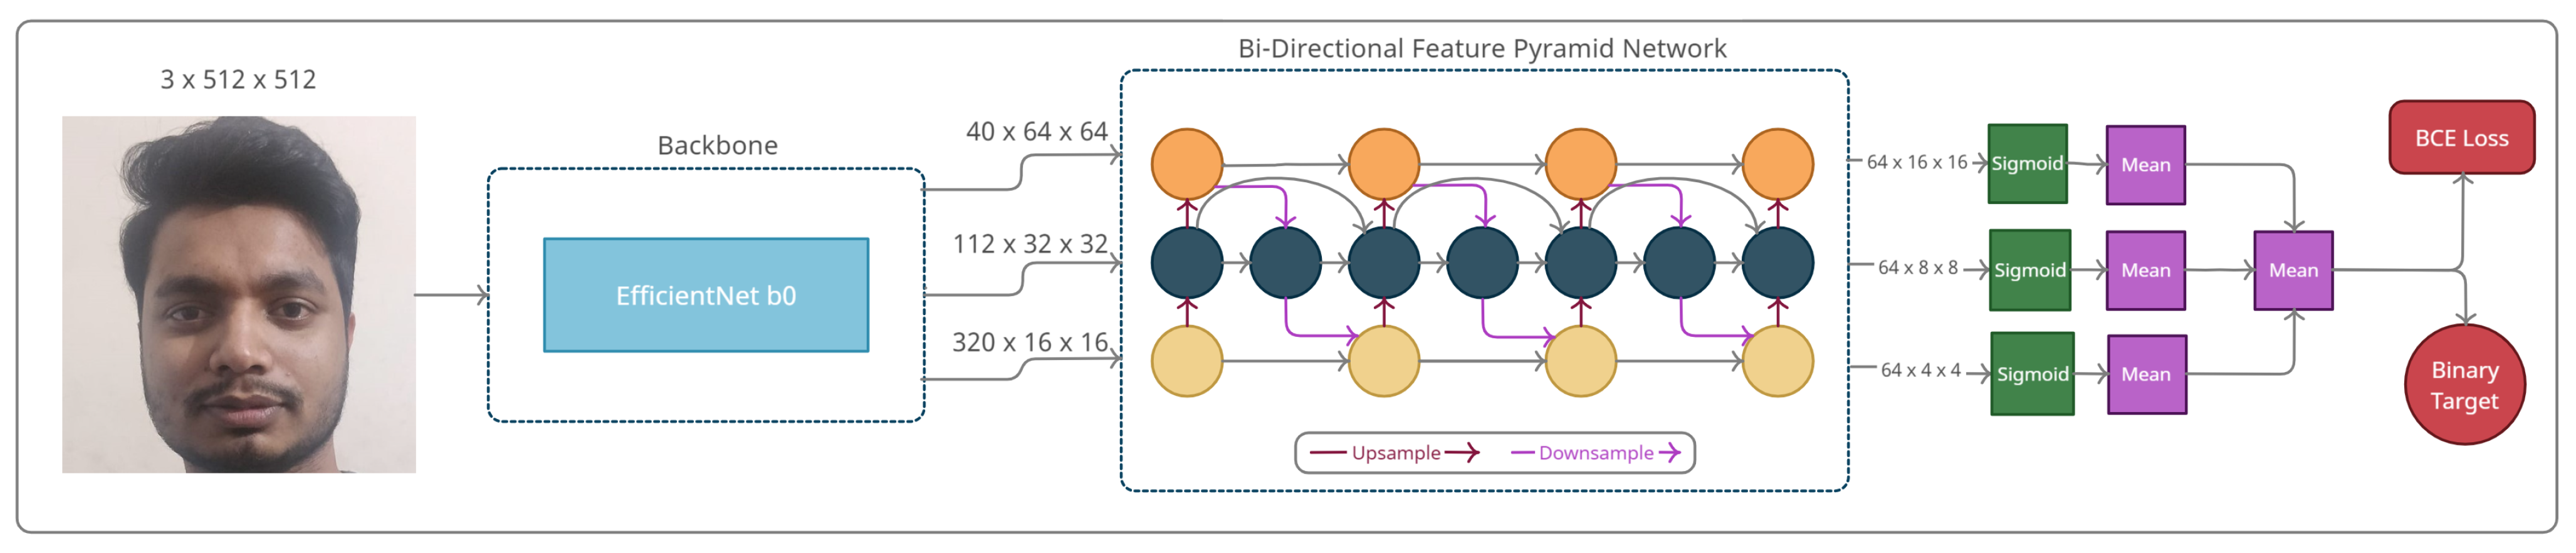
4.1. Pipeline
4.2. Feature Extractor—EfficientNet
4.3. Baseline Model
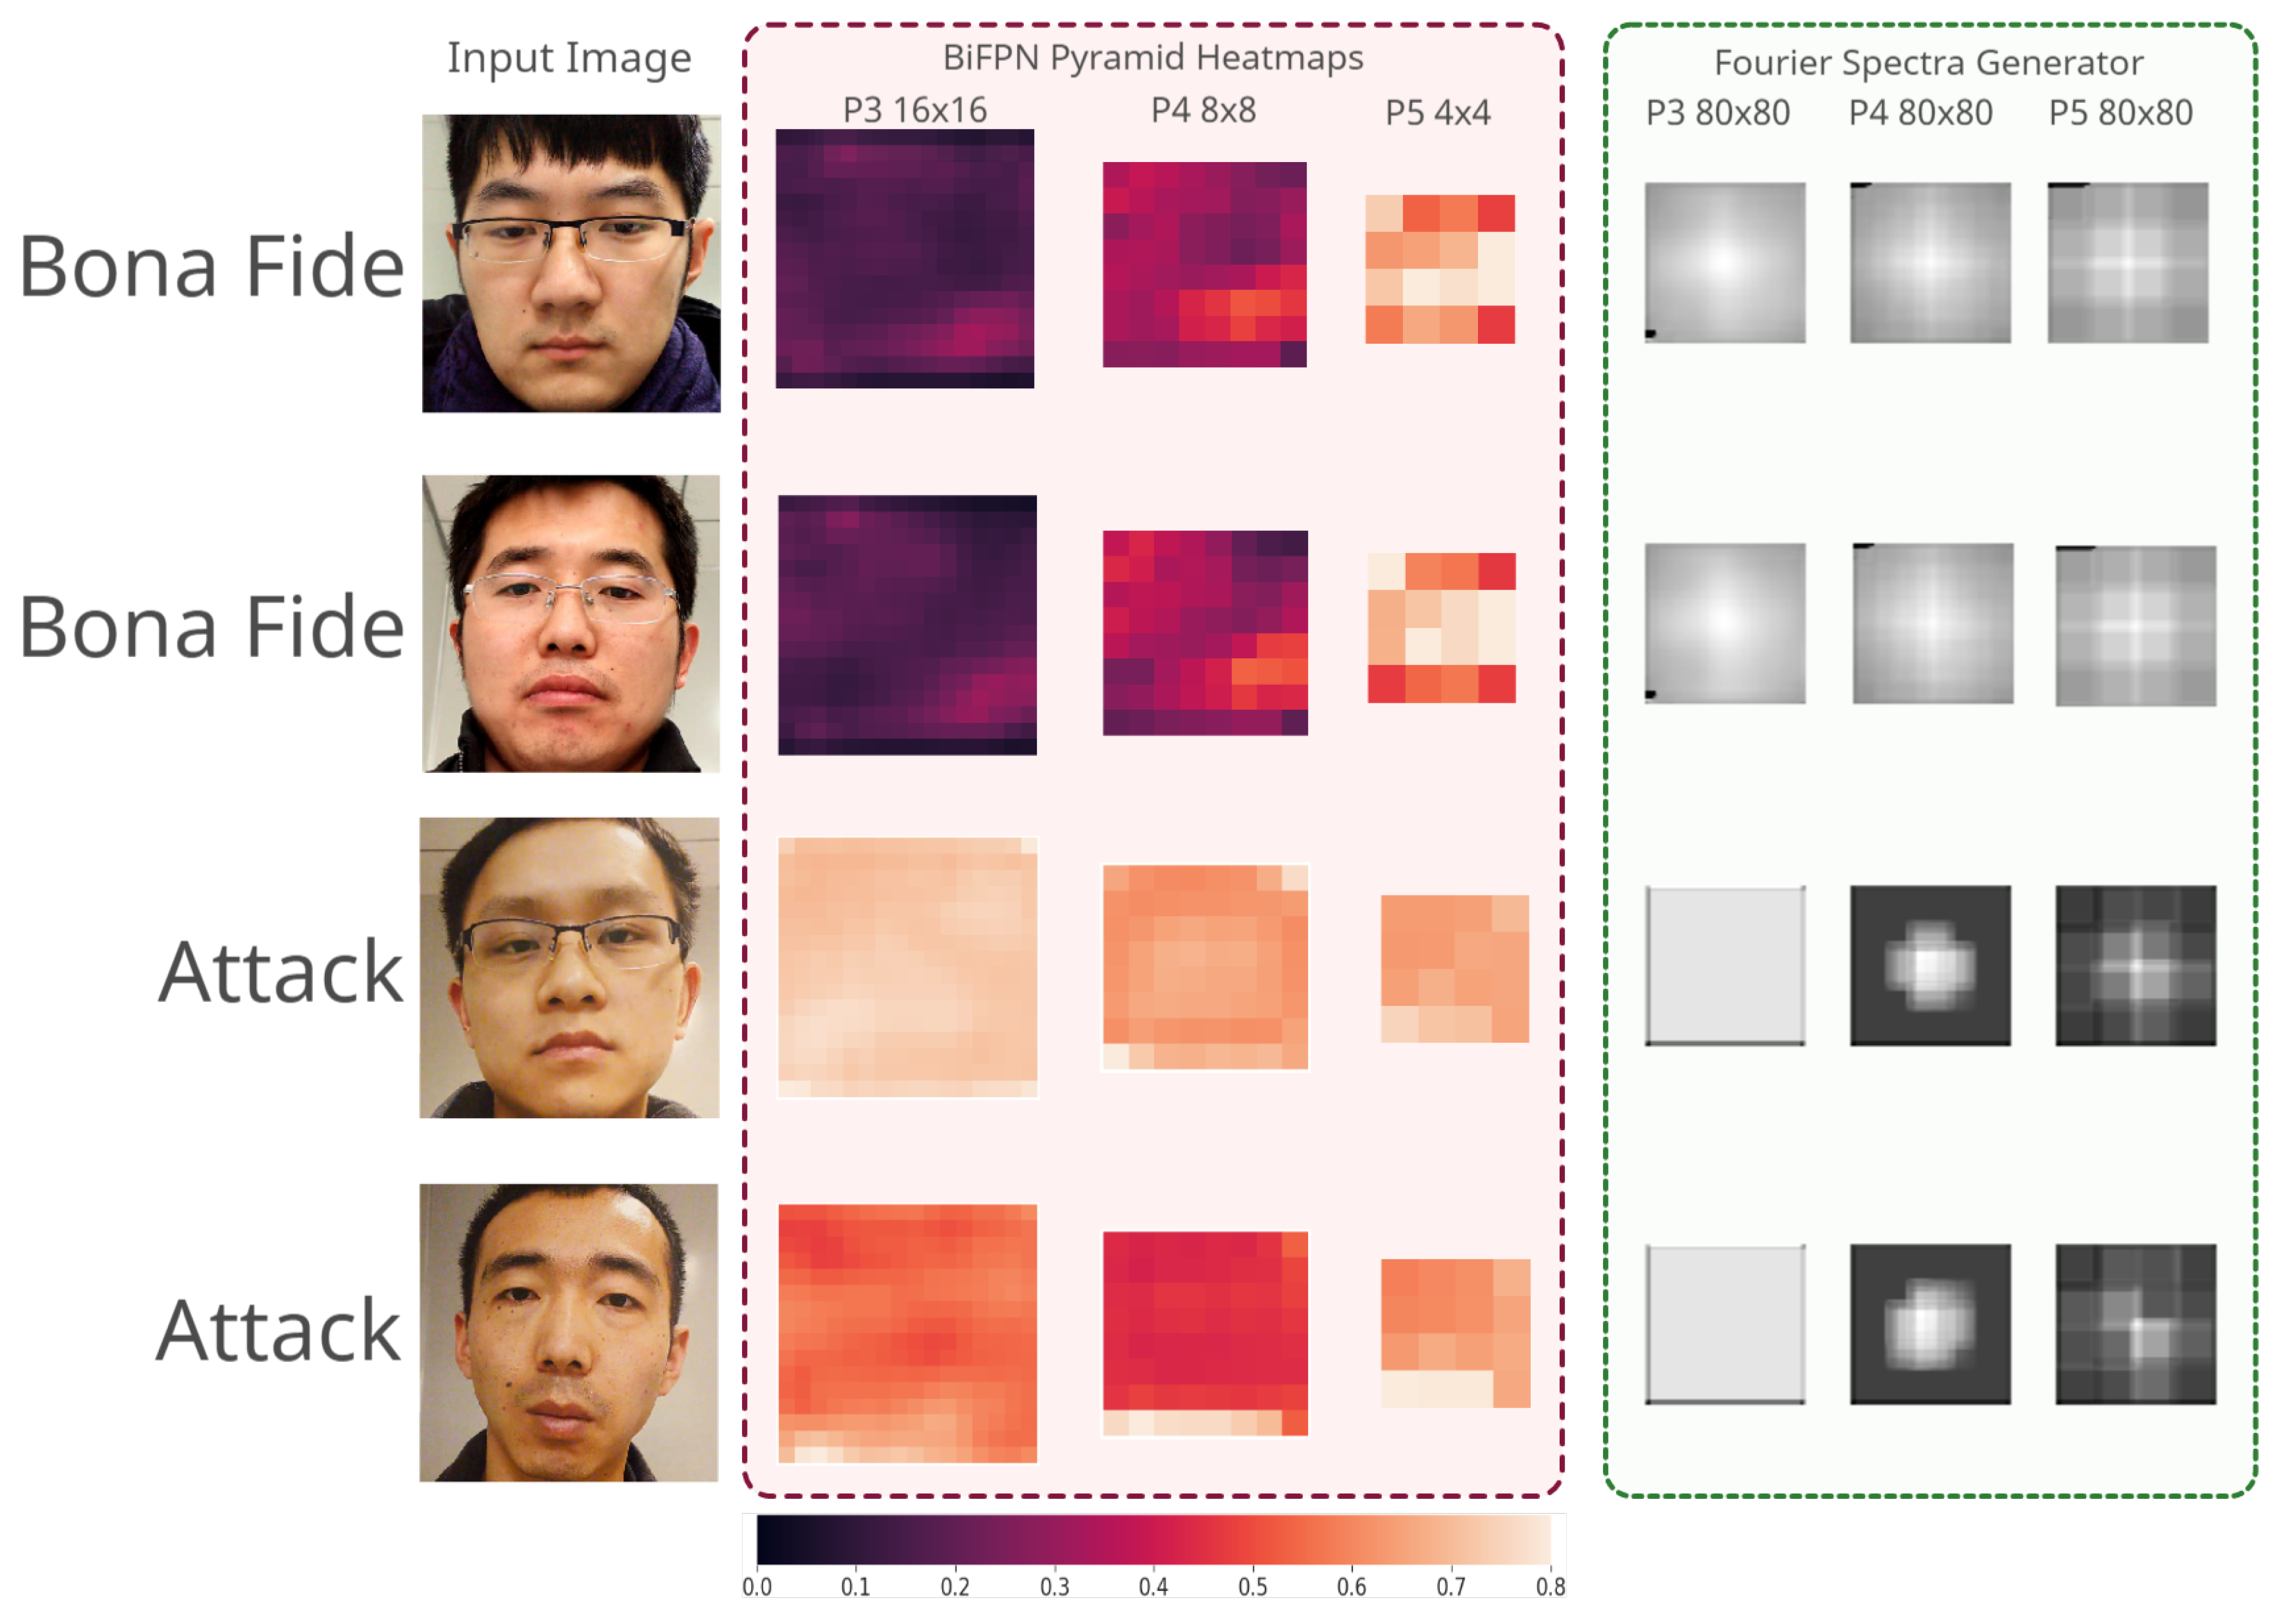
4.4. Self Supervision–Fourier Branch
5. Experiments and Results
5.1. Experimental Setup
5.2. Intra-Dataset Testing
5.3. Inter-Dataset Testing
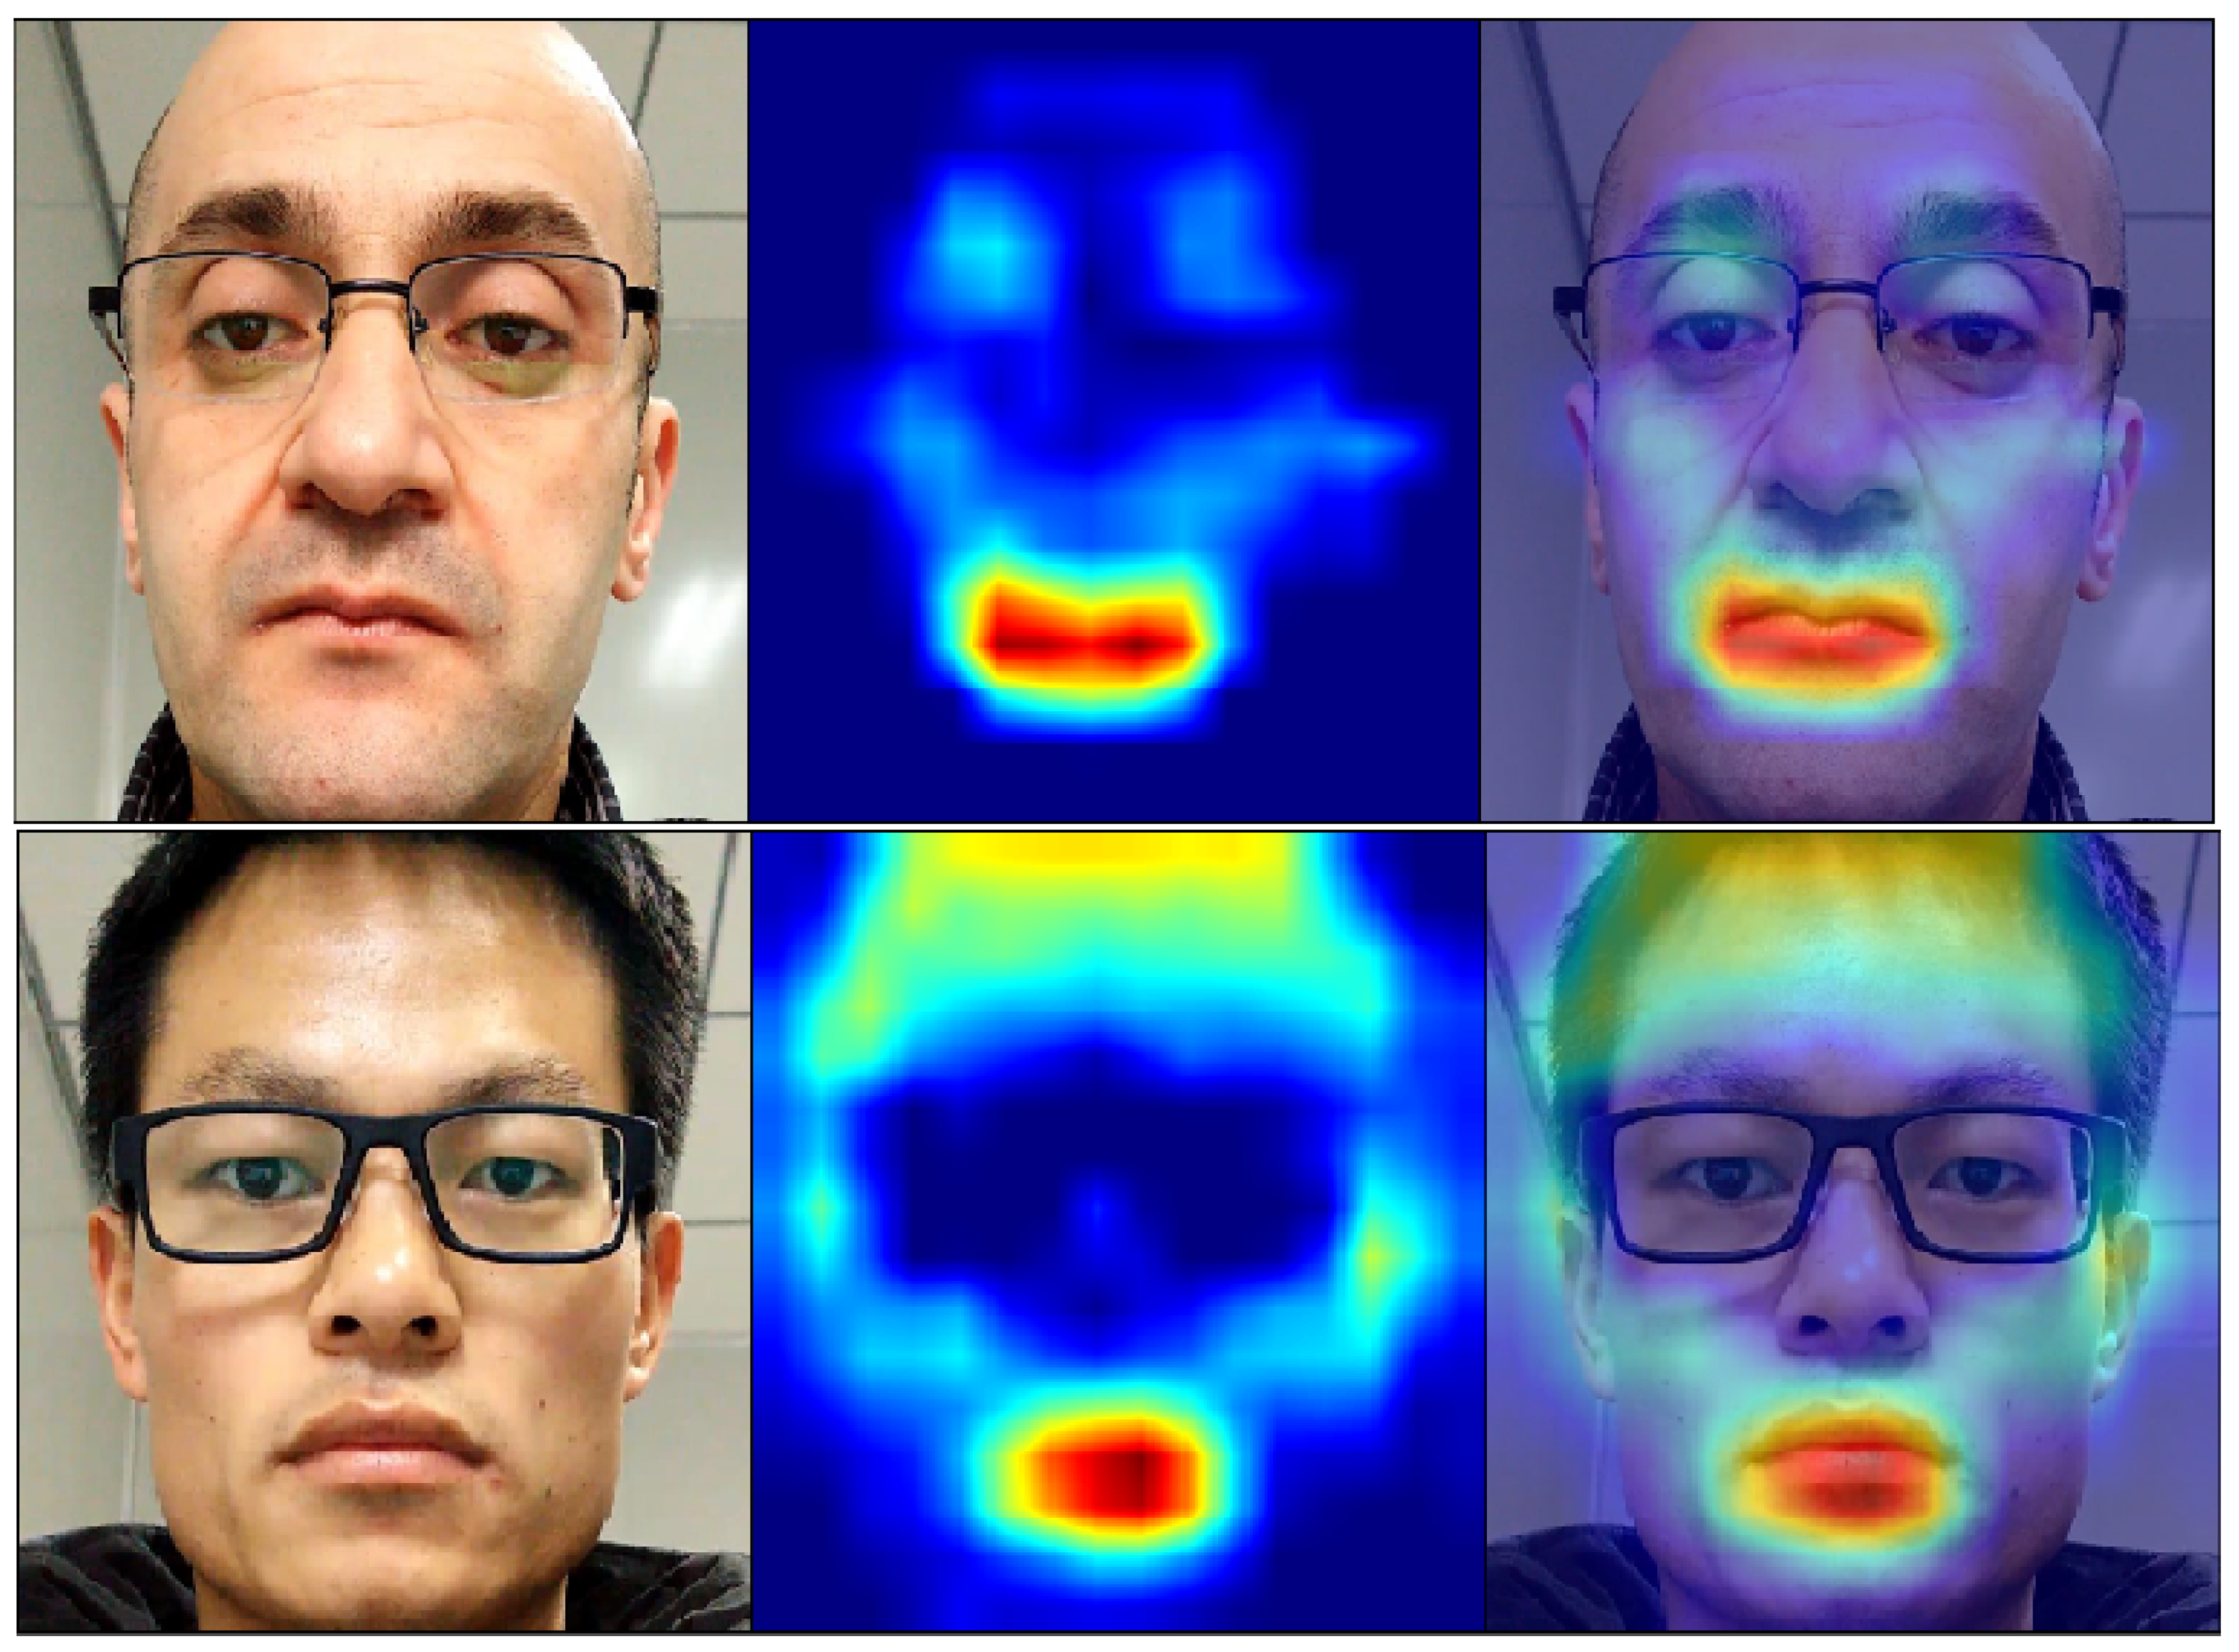
5.4. Result Analysis
6. Discussion
Dataset Issues
7. Conclusions
Author Contributions
Funding
Institutional Review Board Statement
Informed Consent Statement
Data Availability Statement
Acknowledgments
Conflicts of Interest
Appendix A. Evaluation on a Self-Acquired Dataset


| Model | APCER (%) | BPCER (%) | ACER (%) |
|---|---|---|---|
| Bi-FAS | 16.26 | 13.75 | 15.01 |
| Bi-FAS-S | 14.01 | 14.29 | 14.17 |
References
- Deng, J.; Guo, J.; Xue, N.; Zafeiriou, S. ArcFace: Additive Angular Margin Loss for Deep Face Recognition. In Proceedings of the 2019 IEEE/CVF Conference on Computer Vision and Pattern Recognition (CVPR), Long Beach, CA, USA, 15–20 June 2019; pp. 4685–4694. [Google Scholar] [CrossRef]
- Wang, H.; Wang, Y.; Zhou, Z.; Ji, X.; Gong, D.; Zhou, J.; Li, Z.; Liu, W. CosFace: Large Margin Cosine Loss for Deep Face Recognition. In Proceedings of the 2018 IEEE/CVF Conference on Computer Vision and Pattern Recognition, Salt Lake City, UT, USA, 18–23 June 2018; pp. 5265–5274. [Google Scholar] [CrossRef]
- Liu, W.; Wen, Y.; Yu, Z.; Li, M.; Raj, B.; Song, L. SphereFace: Deep Hypersphere Embedding for Face Recognition. In Proceedings of the 2017 IEEE Conference on Computer Vision and Pattern Recognition (CVPR), Honolulu, HI, USA, 21–26 July 2017; pp. 6738–6746. [Google Scholar] [CrossRef]
- Patel, K.; Han, H.; Jain, A.K. Secure Face Unlock: Spoof Detection on Smartphones. IEEE Trans. Inf. Forensics Secur. 2016, 11, 2268–2283. [Google Scholar] [CrossRef]
- Mirjalili, V.; Ross, A. Soft biometric privacy: Retaining biometric utility of face images while perturbing gender. In Proceedings of the 2017 IEEE International Joint Conference on Biometrics (IJCB), Seoul, Korea, 27–29 August 2007; pp. 564–573. [Google Scholar] [CrossRef]
- Costa-Pazo, A.; Bhattacharjee, S.; Vazquez-Fernandez, E.; Marcel, S. The Replay-Mobile Face Presentation-Attack Database. In Proceedings of the 2016 International Conference of the Biometrics Special Interest Group (BIOSIG), Darmstadt, Germany, 21–23 September 2016; pp. 1–7. [Google Scholar] [CrossRef]
- Erdogmus, N.; Marcel, S. Spoofing Face Recognition With 3D Masks. IEEE Trans. Inf. Forensics Secur. 2014, 9, 1084–1097. [Google Scholar] [CrossRef]
- Määttä, J.; Hadid, A.; Pietikäinen, M. Face spoofing detection from single images using micro-texture analysis. In Proceedings of the 2011 International Joint Conference on Biometrics (IJCB), Washington, DC, USA, 11–13 October 2011; pp. 1–7. [Google Scholar] [CrossRef]
- Komulainen, J.; Hadid, A.; Pietikäinen, M. Context based face anti-spoofing. In Proceedings of the 2013 IEEE Sixth International Conference on Biometrics: Theory, Applications and Systems (BTAS), Arlington, VA, USA, 29 September–2 October 2013; pp. 1–8. [Google Scholar] [CrossRef]
- de Freitas Pereira, T.; Anjos, A.; De Martino, J.M.; Marcel, S. Can face anti-spoofing countermeasures work in a real world scenario? In Proceedings of the 2013 International Conference on Biometrics (ICB), Madrid, Spain, 4–7 June 2013; pp. 1–8. [Google Scholar] [CrossRef]
- Boulkenafet, Z.; Komulainen, J.; Hadid, A. Face Antispoofing Using Speeded-Up Robust Features and Fisher Vector Encoding. IEEE Signal Process. Lett. 2017, 24, 141–145. [Google Scholar] [CrossRef]
- Chingovska, I.; Anjos, A.; Marcel, S. On the effectiveness of local binary patterns in face anti-spoofing. In Proceedings of the 2012 BIOSI—Proceedings of the International Conference of Biometrics Special Interest Group (BIOSIG), Darmstadt, Germany, 6–7 September 2012; pp. 1–7. [Google Scholar]
- Ramachandran, V.; Nandi, S. Detecting ARP Spoofing: An Active Technique. In Information Systems Security; Jajodia, S., Mazumdar, C., Eds.; Springer: Berlin/Heidelberg, Germany, 2005; pp. 239–250. [Google Scholar]
- Boulkenafet, Z.; Komulainen, J.; Li, L.; Feng, X.; Hadid, A. Oulu-npu: A mobile face presentation attack database with real-world variations. In Proceedings of the 2017 12th IEEE International Conference on Automatic Face & Gesture Recognition (FG 2017), Washington, DC, USA, 30 May–3 June 2017; pp. 612–618. [Google Scholar]
- Krizhevsky, A.; Sutskever, I.; Hinton, G.E. ImageNet Classification with Deep Convolutional Neural Networks. Commun. ACM 2017, 60, 84–90. [Google Scholar] [CrossRef]
- George, A.; Marcel, S. Deep Pixel-wise Binary Supervision for Face Presentation Attack Detection. In Proceedings of the 2019 International Conference on Biometrics (ICB), Crete, Greece, 4–7 June 2019; pp. 1–8. [Google Scholar] [CrossRef]
- Hossain, M.S.; Rupty, L.; Roy, K.; Hasan, M.; Sengupta, S.; Mohammed, N. A-DeepPixBis: Attentional Angular Margin for Face Anti-Spoofing 2020. Available online: http://www.dicta2020.org/wp-content/uploads/2020/09/53_CameraReady.pdf (accessed on 12 December 2020).
- Yu, Z.; Li, X.; Shi, J.; Xia, Z.; Zhao, G. Revisiting Pixel-Wise Supervision for Face Anti-Spoofing. arXiv 2020, arXiv:2011.12032. [Google Scholar]
- He, K.; Zhang, X.; Ren, S.; Sun, J. Deep Residual Learning for Image Recognition. In Proceedings of the 2016 IEEE Conference on Computer Vision and Pattern Recognition (CVPR), Las Vegas, NV, USA, 27–30 June 2016; pp. 770–778. [Google Scholar] [CrossRef]
- Lin, T.; Dollár, P.; Girshick, R.; He, K.; Hariharan, B.; Belongie, S. Feature Pyramid Networks for Object Detection. In Proceedings of the 2017 IEEE Conference on Computer Vision and Pattern Recognition (CVPR), Honolulu, HI, USA, 21–26 July 2017; pp. 936–944. [Google Scholar] [CrossRef]
- Tan, M.; Le, Q. EfficientNet: Rethinking Model Scaling for Convolutional Neural Networks. In Proceedings of the 36th International Conference on Machine Learning, Long Beach, CA, USA, 9–15 June 2019; pp. 6105–6114. [Google Scholar]
- Atoum, Y.; Liu, Y.; Jourabloo, A.; Liu, X. Face anti-spoofing using patch and depth-based CNNs. In Proceedings of the 2017 IEEE International Joint Conference on Biometrics (IJCB), Seoul, Korea, 27–29 August 2007; pp. 319–328. [Google Scholar] [CrossRef]
- Li, J.; Wang, Y.; Tan, T.; Jain, A.K. Live face detection based on the analysis of fourier spectra. In Biometric Technology for Human Identification; International Society for Optics and Photonics: Orlando, FL, USA, 2004; Volume 5404, pp. 296–303. [Google Scholar]
- Yang, J.; Lei, Z.; Liao, S.; Li, S.Z. Face liveness detection with component dependent descriptor. In Proceedings of the 2013 International Conference on Biometrics (ICB), Madrid, Spain, 4–7 June 2013; pp. 1–6. [Google Scholar] [CrossRef]
- Dalal, N.; Triggs, B. Histograms of oriented gradients for human detection. In Proceedings of the 2005 IEEE Computer Society Conference on Computer Vision and Pattern Recognition (CVPR’05), San Diego, CA, USA, 20–26 June 2005; Volume 1, pp. 886–893. [Google Scholar]
- Peixoto, B.; Michelassi, C.; Rocha, A. Face liveness detection under bad illumination conditions. In Proceedings of the 2011 18th IEEE International Conference on Image Processing, Brussels, Belgium, 11–14 September 2011; pp. 3557–3560. [Google Scholar] [CrossRef]
- Tan, X.; Li, Y.; Liu, J.; Jiang, L. Face liveness detection from a single image with sparse low rank bilinear discriminative model. In Proceedings of the European Conference on Computer Vision, Crete, Greece, 5–11 September 2010; pp. 504–517. [Google Scholar]
- Manjunath, B.S.; Ma, W.Y. Texture features for browsing and retrieval of image data. IEEE Trans. Pattern Anal. Mach. Intell. 1996, 18, 837–842. [Google Scholar] [CrossRef]
- Cortes, C.; Vapnik, V. Support-vector networks. Mach. Learn. 1995, 20, 273–297. [Google Scholar] [CrossRef]
- Sun, L.; Pan, G.; Wu, Z.; Lao, S. Blinking-based live face detection using conditional random fields. In International Conference on Biometrics; Springer: Berlin/Heidelberg, Germany, 2007; pp. 252–260. [Google Scholar]
- Moriyama, T.; Kanade, T.; Cohn, J.F.; Xiao, J.; Ambadar, Z.; Gao, J.; Imamura, H. Automatic recognition of eye blinking in spontaneously occurring behavior. In Proceedings of the Object Recognition Supported by User Interaction for Service Robots, Quebec City, QC, Canada, 11–15 August 2002; Volume 4, pp. 78–81. [Google Scholar]
- de Freitas Pereira, T.; Komulainen, J.; Anjos, A.; De Martino, J.M.; Hadid, A.; Pietikäinen, M.; Marcel, S. Face liveness detection using dynamic texture. EURASIP J. Image Video Process. 2014, 2014, 2. [Google Scholar] [CrossRef]
- Yu, Z.; Zhao, C.; Wang, Z.; Qin, Y.; Su, Z.; Li, X.; Zhou, F.; Zhao, G. Searching central difference convolutional networks for face anti-spoofing. In Proceedings of the IEEE/CVF Conference on Computer Vision and Pattern Recognition, Seattle, WA, USA, 14–19 June 2020; pp. 5295–5305. [Google Scholar]
- Huang, G.; Liu, Z.; Van Der Maaten, L.; Weinberger, K.Q. Densely connected convolutional networks. In Proceedings of the IEEE Conference on Computer Vision and Pattern Recognition, Honolulu, HI, USA, 21–26 July 2017; pp. 4700–4708. [Google Scholar]
- Ren, S.; He, K.; Girshick, R.; Sun, J. Faster r-cnn: Towards real-time object detection with region proposal networks. IEEE Trans. Pattern Anal. Mach. Intell. 2016, 39, 1137–1149. [Google Scholar] [CrossRef] [PubMed]
- He, K.; Gkioxari, G.; Dollár, P.; Girshick, R. Mask r-cnn. In Proceedings of the IEEE International Conference on Computer Vision, Venice, Italy, 22–29 October 2017; pp. 2961–2969. [Google Scholar]
- Wang, K.; Liew, J.H.; Zou, Y.; Zhou, D.; Feng, J. Panet: Few-shot image semantic segmentation with prototype alignment. In Proceedings of the IEEE International Conference on Computer Vision, Seoul, Korea, 27–28 October 2019; pp. 9197–9206. [Google Scholar]
- Ghiasi, G.; Lin, T.Y.; Le, Q.V. Nas-fpn: Learning scalable feature pyramid architecture for object detection. In Proceedings of the IEEE Conference on Computer Vision and Pattern Recognition, Long Beach, CA, USA, 15–20 June 2019; pp. 7036–7045. [Google Scholar]
- Tan, M.; Pang, R.; Le, Q.V. Efficientdet: Scalable and efficient object detection. In Proceedings of the IEEE/CVF Conference on Computer Vision and Pattern Recognition, Seattle, WA, USA, 13–19 June 2020; pp. 10781–10790. [Google Scholar]
- Xie, S.; Girshick, R.; Dollár, P.; Tu, Z.; He, K. Aggregated Residual Transformations for Deep Neural Networks. In Proceedings of the 2017 IEEE Conference on Computer Vision and Pattern Recognition (CVPR), Honolulu, HI, USA, 21–26 July 2017; pp. 5987–5995. [Google Scholar] [CrossRef]
- Sandler, M.; Howard, A.; Zhu, M.; Zhmoginov, A.; Chen, L. MobileNetV2: Inverted Residuals and Linear Bottlenecks. In Proceedings of the 2018 IEEE/CVF Conference on Computer Vision and Pattern Recognition, Salt Lake City, UT, USA, 18–22 June 2018; pp. 4510–4520. [Google Scholar] [CrossRef]
- Standard, I. Information Technology—Biometric Presentation Attack Detection—Part 1: Framework; ISO: Geneva, Switzerland, 2016. [Google Scholar]
- Reid, P. Biometrics for Network Security; Prentice Hall: Hoboken, NJ, USA, 2004. [Google Scholar]
- Deng, J.; Guo, J.; Ververas, E.; Kotsia, I.; Zafeiriou, S. RetinaFace: Single-Shot Multi-Level Face Localisation in the Wild. In Proceedings of the IEEE/CVF Conference on Computer Vision and Pattern Recognition, Seattle, WA, USA, 13–19 June 2020; pp. 5203–5212. [Google Scholar]
- Deng, J.; Dong, W.; Socher, R.; Li, L.J.; Li, K.; Fei-Fei, L. Imagenet: A large-scale hierarchical image database. In Proceedings of the 2009 IEEE Conference on Computer Vision and Pattern Recognition, Miami, FL, USA, 20–25 June 2009; pp. 248–255. [Google Scholar]
- Ioffe, S.; Szegedy, C. Batch normalization: Accelerating deep network training by reducing internal covariate shift. arXiv 2015, arXiv:1502.03167. [Google Scholar]
- Glorot, X.; Bengio, Y. Understanding the difficulty of training deep feedforward neural networks. In Proceedings of the Thirteenth International Conference on Artificial Intelligence and Statistics, Sardinia, Italy, 13–15 May 2010; pp. 249–256. [Google Scholar]
- Boulkenafet, Z.; Komulainen, J.; Akhtar, Z.; Benlamoudi, A.; Samai, D.; Bekhouche, S.E.; Ouafi, A.; Dornaika, F.; Taleb-Ahmed, A.; Qin, L.; et al. A competition on generalized software-based face presentation attack detection in mobile scenarios. In Proceedings of the 2017 IEEE International Joint Conference on Biometrics (IJCB), Seoul, Korea, 27–29 August 2007; pp. 688–696. [Google Scholar]
- Liu, Y.; Jourabloo, A.; Liu, X. Learning deep models for face anti-spoofing: Binary or auxiliary supervision. In Proceedings of the IEEE Conference on Computer Vision and Pattern Recognition, Salt Lake City, UT, USA, 18–22 June 2018; pp. 389–398. [Google Scholar]
- Galbally, J.; Marcel, S.; Fierrez, J. Image quality assessment for fake biometric detection: Application to iris, fingerprint, and face recognition. IEEE Trans. Image Process. 2013, 23, 710–724. [Google Scholar] [CrossRef] [PubMed]
- Yu, Z.; Wan, J.; Qin, Y.; Li, X.; Li, S.Z.; Zhao, G. NAS-FAS: Static-Dynamic Central Difference Network Search for Face Anti-Spoofing. IEEE Trans. Pattern Anal. Machine Intell. 2020. [Google Scholar] [CrossRef] [PubMed]
- Maaten, L.V.D.; Hinton, G. Visualizing data using t-SNE. J. Mach. Learn. Res. 2008, 9, 2579–2605. [Google Scholar]
- Selvaraju, R.R.; Cogswell, M.; Das, A.; Vedantam, R.; Parikh, D.; Batra, D. Grad-cam: Visual explanations from deep networks via gradient-based localization. In Proceedings of the IEEE International Conference on Computer Vision, Venice, Italy, 22–29 October 2017; pp. 618–626. [Google Scholar]


| Protocol | Subset | Session | Phones | User | # Attacks Created Using | # Real Videos | # Attack Videos | # All Videos |
|---|---|---|---|---|---|---|---|---|
| I | Train | Session 1,2 | 6 Phones | 1–20 | Printer 1,2; Display 1,2 | 240 | 960 | 1200 |
| Dev | Session 1,2 | 6 Phones | 21–35 | Printer 1,2; Display 1,2 | 180 | 720 | 900 | |
| Test | Session 3 | 6 Phones | 36–55 | Printer 1,2; Display 1,2 | 120 | 480 | 600 | |
| II | Train | Session 1,2.3 | 6 Phones | 1–20 | Printer 1; Display 1 | 360 | 720 | 1080 |
| Dev | Session 1,2.3 | 6 Phones | 21–35 | Printer 1; Display 1 | 270 | 540 | 810 | |
| Test | Session 1,2.3 | 6 Phones | 36–55 | Printer 2; Display 2 | 360 | 720 | 1080 | |
| III | Train | Session 1,2.3 | 5 Phones | 1–20 | Printer 1,2; Display 1,2 | 300 | 1200 | 1500 |
| Dev | Session 1,2.3 | 5 Phones | 21–35 | Printer 1,2; Display 1,2 | 225 | 900 | 1125 | |
| Test | Session 1,2.3 | 1 Phones | 36–55 | Printer 1,2; Display 1,2 | 60 | 240 | 300 | |
| IV | Train | Session 1,2 | 5 Phones | 1–20 | Printer 1; Display 1 | 200 | 400 | 600 |
| Dev | Session 1,2 | 5 Phones | 21–35 | Printer 1; Display 1 | 150 | 300 | 450 | |
| Test | Session 3 | 1 Phones | 36–55 | Printer 2; Display 2 | 20 | 40 | 60 |
| Pyramid | Resolution |
|---|---|
| 64 × 64 × 64 | |
| 64 × 32 × 32 | |
| 64 × 16 × 16 | |
| 64 × 8 × 8 | |
| 64 × 4 × 4 |
| Protocol | Model | APCER (%) | BPCER (%) | ACER (%) |
|---|---|---|---|---|
| CPqD [48] | 2.9 | 10.8 | 6.9 | |
| GRADIANT [48] | 1.3 | 12.5 | 6.9 | |
| FAS-BAS [49] | 1.6 | 1.6 | 1.6 | |
| IQM-SVM [50] | 19.17 | 30.83 | 25.0 | |
| 1 | LBP-SVM [16] | 12.92 | 51.67 | 32.29 |
| DeepPixBiS [16] | 0.83 | 0.0 | 0.42 | |
| A-DeepPixBis [17] | 1.19 | 0.31 | 0.75 | |
| Bi-FAS (ours) | 2.92 | 3.33 | 3.12 | |
| Bi-FAS-S (ours) | 3.13 | 0.83 | 1.97 | |
| MixedFASNet [48] | 9.7 | 2.5 | 6.1 | |
| FAS-BAS [49] | 2.7 | 2.7 | 2.7 | |
| GRADIANT [48] | 3.1 | 1.9 | 2.5 | |
| IQM-SVM [50] | 12.5 | 16.94 | 14.72 | |
| 2 | LBP-SVM [16] | 30 | 20.28 | 25.14 |
| DeepPixBiS [16] | 11.39 | 0.56 | 5.97 | |
| A-DeepPixBis [17] | 4.35 | 1.29 | 2.82 | |
| Bi-FAS (ours) | 2.36 | 1.11 | 1.73 | |
| Bi-FAS-S (ours) | 1.67 | 1.11 | 1.39 | |
| MixedFASNet [48] | ||||
| GRADIANT [48] | ||||
| FAS-BAS [49] | ||||
| IQM-SVM [50] | ||||
| 3 | LBP-SVM [16] | |||
| DeepPixBiS [16] | ||||
| A-DeepPixBis [17] | ||||
| Bi-FAS (ours) | ||||
| Bi-FAS-S (ours) | 0.69 ± 0.68 | 0.28 ± 0.68 | 0.49 ± 0.63 | |
| MassyHNU [48] | ||||
| GRADIANT [48] | ||||
| FAS-BAS [49] | ||||
| IQM-SVM [50] | ||||
| 4 | LBP-SVM [16] | |||
| DeepPixBiS [16] | ||||
| A-DeepPixBis [17] | 3.86 ± 4.04 | |||
| Bi-FAS (ours) | ||||
| Bi-FAS-S (ours) | 2.50 ± 3.16 | 3.33 ± 4.08 | 2.92 ± 3.41 |
| Model | EER (%) | HTER (%) |
|---|---|---|
| IQM-SVM [50] | 1.2 | 3.9 |
| LBP-SVM [16] | 6.2 | 12.1 |
| DeepPixBiS [16] | 0.0 | 0.0 |
| A-DeepPixBis(binary output) [17] | 0.0 | 0.0 |
| A-DeepPixBis(feature map) [17] | 0.0 | 0.0 |
| Bi-FAS (ours) | 0.0 | 0.0 |
| Bi-FAS-S (ours) | 0.0 | 0.0 |
| Trained on OULU | Trained on Replay-Mobile | |||
|---|---|---|---|---|
| Model | Tested on OULU | Tested on Replay-Mobile | Tested on OULU | Tested on Replay-Mobile |
| IQM-SVM [50] | 24.6 | 31.6 | 3.9 | 42.3 |
| LBP-SVM [16] | 32.2 | 35.0 | 12.1 | 43.6 |
| DeepPixBiS [16] | 0.4 | 12.4 | 22.7 | 0.0 |
| A-DeepPixBis [17] | 0.7 | 9.35 | 25.57 | 0.0 |
| Bi-FAS (ours) | 3.12 | 18.91 | 18.33 | 0.0 |
| Bi-FAS-S (ours) | 1.97 | 11.97 | 21.24 | 0.0 |
Publisher’s Note: MDPI stays neutral with regard to jurisdictional claims in published maps and institutional affiliations. |
© 2021 by the authors. Licensee MDPI, Basel, Switzerland. This article is an open access article distributed under the terms and conditions of the Creative Commons Attribution (CC BY) license (https://creativecommons.org/licenses/by/4.0/).
Share and Cite
Roy, K.; Hasan, M.; Rupty, L.; Hossain, M.S.; Sengupta, S.; Taus, S.N.; Mohammed, N. Bi-FPNFAS: Bi-Directional Feature Pyramid Network for Pixel-Wise Face Anti-Spoofing by Leveraging Fourier Spectra. Sensors 2021, 21, 2799. https://doi.org/10.3390/s21082799
Roy K, Hasan M, Rupty L, Hossain MS, Sengupta S, Taus SN, Mohammed N. Bi-FPNFAS: Bi-Directional Feature Pyramid Network for Pixel-Wise Face Anti-Spoofing by Leveraging Fourier Spectra. Sensors. 2021; 21(8):2799. https://doi.org/10.3390/s21082799
Chicago/Turabian StyleRoy, Koushik, Md. Hasan, Labiba Rupty, Md. Sourave Hossain, Shirshajit Sengupta, Shehzad Noor Taus, and Nabeel Mohammed. 2021. "Bi-FPNFAS: Bi-Directional Feature Pyramid Network for Pixel-Wise Face Anti-Spoofing by Leveraging Fourier Spectra" Sensors 21, no. 8: 2799. https://doi.org/10.3390/s21082799
APA StyleRoy, K., Hasan, M., Rupty, L., Hossain, M. S., Sengupta, S., Taus, S. N., & Mohammed, N. (2021). Bi-FPNFAS: Bi-Directional Feature Pyramid Network for Pixel-Wise Face Anti-Spoofing by Leveraging Fourier Spectra. Sensors, 21(8), 2799. https://doi.org/10.3390/s21082799