Abstract
Atrial fibrillation is the most common type of cardiac arrhythmia in clinical practice. Currently, catheter ablation for pulmonary-vein isolation is a well-established treatment for maintaining sinus rhythm when antiarrhythmic drugs do not succeed. Unfortunately, arrhythmia recurrence after catheter ablation remains common, with estimated rates of up to 45%. A better understanding of factors leading to atrial-fibrillation recurrence is needed. Hence, the aim of this study is to characterize changes in the atrial propagation pattern following pulmonary-vein isolation, and investigate the relation between such characteristics and atrial-fibrillation recurrence. Fifty patients with paroxysmal atrial fibrillation who had undergone catheter ablation were included in this study. Time-segment and vectorcardiogram-loop-morphology analyses were applied to characterize P waves extracted from 1 min long 12-lead electrocardiogram segments before and after the procedure, respectively. Results showed that P-wave vectorcardiogram loops were significantly less round and more planar, P waves and PR intervals were significantly shorter, and heart rate was significantly higher after the procedure. Differences were larger for patients who did not have arrhythmia recurrences at 2 years of follow-up; for these patients, the pre- and postprocedure P waves could be identified with 84% accuracy.
1. Introduction
Atrial fibrillation (AF) is supraventricular tachyarrhythmia with ineffective atrial conduction due to uncoordinated atrial electrical activation. Its symptoms include palpitations, dyspnea, fatigue, and chest pain. AF is the most common type of sustained cardiac arrhythmia, and estimated prevalence is between 2% and 4% in adults, with a lifetime risk of 1 in 3 in the European Union [1]. AF is traditionally stratified into five types on the basis of the presentation, duration, and spontaneous termination of arrhythmia episodes: first diagnosed, paroxysmal, persistent, long-standing persistent, and permanent AF. Catheter ablation for pulmonary-vein isolation (PVI) is the recommended treatment to permanently restore the sinus rhythm when antiarrhythmic drugs fail [2]. Success rates for PVI are up to 80%, specially for patients with paroxysmal AF for whom recurrence rates are significantly lower after the procedure [3].
In order to personalize treatment, it is desirable to predict PVI outcome. Previous studies showed that patient characteristics such as large left atrial diameters [4] can predict time to recurrence, which is a major determinant of outcome [5,6]. Other studies focused on analyzing atrial electrical activity in the electrocardiogram (ECG). Such analysis can provide information on the atrial substrate and may be used to identify the spontaneous reconnection of previously isolated pulmonary veins after catheter ablation, which can predict arrhythmia recurrence [7]. A decrease in F-wave amplitude was shown to be associated with AF recurrence after ablation [8]. Some studies focused on the spectral content of F waves, of which the dominant frequency was found to significantly decrease during catheter ablation [9], and their related spectral features are useful in predicting the procedure outcome [10]. Further, a decrease in P-wave area is associated with AF recurrence [11,12,13].
Nonetheless, it is P-wave duration that was indicated by most references as the clinical feature that is able to predict AF recurrence after pulmonary-vein isolation [14,15,16,17]. Shortened P-wave duration is associated with a successful PVI outcome and lower rates of AF recurrence. However, despite the growing knowledge in the field, the identification of changes induced in the atrial substrate that yield a successful PVI are of paramount importance for the clinical management of the arrhythmia [18,19].
In this work, we characterize atrial activity (focusing on P waves) before and after PVI by noninvasive ways, and provide analytical evidence that this procedure modifies the atrial substrate [20]. We analyze spatial ECG information manifested as vectorcardiographic loops of P waves of patients with paroxysmal AF. Thus, morphological changes and time measurements related to atrial activity are described to reveal how these changes are associated with successful PVI outcome and AF recurrence [21].
The purpose of the present study is to analyze changes in P-wave loop morphology following PVI, and investigate the relation between such changes and AF recurrence. Further, we investigate if combining P-wave loop morphology with other ECG-derived characteristics improves characterization.
2. Materials and Methods
2.1. Dataset
Fifty subjects with paroxysmal AF who had undergone PVI at the arrhythmia unit of the Hospital Universitari i Politècnic La Fe in Valencia, Spain were included in this study. A standard 12-lead ECG was acquired at 1000 Hz sampling frequency throughout the procedure using a Labsystem Pro EP Recording System. ECG recording continued for at least 30 min after successfully finishing catheter ablation. Recurrence information was obtained at a 2 year follow-up: 39 subjects maintained sinus rhythm and 11 subjects suffered AF recurrences. Details on the population cohort are shown in Table 1.

Table 1.
Baseline characteristics of study population. Hypertension defined as systolic blood pressure above 140 mmHg or diastolic blood pressure above 90 mmHg. Diabetes mellitus defined as serum fasting glucose ≥7.0 mmol/L or on medications. Hypercholesterolemia defined as cholesterol ≥6.4 mmol/L or treatment with lipid-lowering drugs. Structural heart disease defined as left ventricular hypertrophy <15 mm, left ventricular ejection fraction (LVEF) <50%, moderate or greater degrees of valvulopathy, significant coronary artery disease, or the presence of primary myocardial diseases. Detailed information about antiarrhythmic drugs is also included.
For the present study, one 60 s segment before the procedure and one 60 s segment after the procedure were extracted from ECG recordings for analysis. The segments were selected as close as possible to the beginning and end of the recording, respectively, provided that the patients were in sinus rhythm and that signal quality was sufficient.
2.2. Signal Preprocessing
First, the ECG was filtered in order to remove power-line interference and baseline wander using notch filtering at 50 Hz and cubic splines, respectively [22].
P-wave boundaries were automatically delineated using the multilead wavelet-based approach presented in [23,24]. This method enhances the delineation system based on single lead [25] by projecting the wavelet transform obtained from vectorcardiographic loops into a direction that optimizes signal/noise ratio, and so the delineation. The detected P-wave onset and offset points were manually reviewed, and in cases where automatic detection had failed, the points were manually corrected.
P waves of insufficient signal quality were identified on the basis of cross-correlation. For each recording, a P-wave template was obtained as the average of all P waves in the recording. P waves with cross-correlation below 0.9 to the corresponding P-wave template were considered to be of insufficient signal quality and excluded from further analysis.
2.3. P-Wave Loop Characterization
A vectorcardiogram (VCG) was synthesized from the 12-lead ECG of each P-wave using the Kors matrix [26], thus obtaining three orthogonal Frank leads (X,Y,Z). The Kors matrix was chosen since recent references [27,28] showed that better estimates for spatial angles are yielded when synthesizing VCG by Kors rather than using the inverse Dower matrix [29].
For each P wave, three eigenvalues were obtained by applying singular-value decomposition to the matrix formed by the three orthogonal VCG leads expressed in mV. These three eigenvalues are related to the dimensions of the P-wave loop in the 3D space. If we denote these eigenvalues as , where and , we can define two morphology parameters:
Parameter quantifies the loop’s roundness, with larger values corresponding to rounder loops, and smaller values to more ellipsoidal loops. The second parameter, , quantifies the loop’s planarity, with smaller values for more planar loops, i.e., loops that can mostly be fitted to a plane. takes values in the [0–1] range, whereas takes values in the range of [0–0.5].
2.4. Main Propagation Direction
The main direction of propagation in each recording was estimated by the dominant vector of the average P-wave loop. First, the spatial and time alignments of P-wave loops were performed by scaling, rotating, and applying time synchronization according to the method presented in [30]. These three transformations can be described by
where is a positive parameter that controls scaling, Q is a 3 × 3 matrix that controls the rotational changes of the heart, and models the time synchronization by time shift . Z and denote the 3 and the 3 matrices containing in each row L or samples of the observed loop and reference loop, respectively. Reference was defined as the loop corresponding to the P wave with the maximal amplitude in lead V1. This loop is associated to a specific point in the respiratory cycle, and we aimed to align all loops to this point (see [30] for a detailed explanation of optimal estimates for the different alignment parameters and the alignment process).
The average P-wave loop was obtained from the aligned P-wave loops, and the dominant vector was extracted using eigenvalue decomposition; the eigenvector associated with the first eigenvalue was considered to be main direction of propagation . Changes in the main direction of propagation were quantified by the angle difference between before and after PVI, denoted .
2.5. Time Intervals
Furthermore, changes in P-wave duration, and intervals in response to PVI were investigated. P-wave duration was obtained using the P-wave onset and offset, determined as described in Section 2.2. The interval was obtained as the time between P-wave onset and QRS onset [31].The position of the R peak was determined from the detected QRS complexes using a wavelet-transform delineation technique [25]. RR interval was obtained as the time between subsequent R peaks.
2.6. Statistical and Cluster Analyses
Features characterizing individual P-wave loops and time intervals were averaged to obtain an estimate of the overall characteristics in each recording; averages are denoted as . Further, the intrarecording variation of the features was quantified by mean absolute deviation (MAD). For each set of data , MAD was obtained as , where is the mean of the dataset.
The recording averages and MAD of the features pre- and post-PVI are presented as gross mean ± standard deviation, and gross median and interquartile range, respectively, depending on the Shapiro–Wilk normality test. Further, a paired Student’s t-test or Wilcoxon–Mann–Whitney test, respectively, was applied to determine if differences were significant.
Moreover, cluster analysis was performed to investigate if P-wave loop-morphology and time-interval characteristics could be combined to better characterize differences pre- and post-PVI. K-means++ [32] with a squared Euclidean distance metric was used for this task. The final chosen centroids were obtained after averaging the results of several different randomized seeds, and the leave-one-out approach to perform classification.
Classification performance was assessed by means of different measures:
- sensitivity: proportion of pre-PVI features correctly identified as such;
- specificity: proportion of post-PVI features correctly identified as such;
- precision: proportion of pre-PVI features correctly classified with respect to the total number identified as such; and
- accuracy: proportion of correctly classified (both pre- and post-PVI) with respect to their total number.
3. Results
3.1. P-Wave Loop Characteristics
Figure 1 illustrates an example of P-wave loops before and after PVI for two patients, one with AF recurrence and one without AF recurrence. After PVI, elongation of the first diagonal of the P-wave loop could be observed, corresponding to an increase in . Further, the P-wave loop was less round and more planar after PVI, corresponding to a decrease in and , respectively. Changes were more prominent for the patient without AF recurrence.
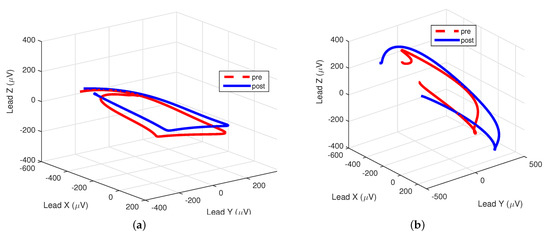
Figure 1.
Pre- and post- pulmonary-vein isolation (PVI) loops for two different patients. (a) Patient with atrial-fibrillation (AF) recurrence during follow-up: = 0.32 vs. 0.29, = 0.11 vs. 0.10, respectively. (b) Patient without AF recurrence during follow-up: = 0.34 vs. 0.28, = 0.13 vs. 0.10, respectively.
The average and MAD of the P-wave loop characteristics pre- and post-PVI for all patients are summarized in Table 2. Results indicate that was significantly larger post-PVI, and that and were significantly smaller post-PVI.
Table 2.
Pre- and post-PVI morphological features, and average mean absolute deviation (MAD) about mean for the whole study population (50 subjects). Data are mean ± standard deviation or median (interquartile range). * p-value < 0.05 by paired Student’s t-test or Wilcoxon–Mann–Whitney test.
Results also indicate that the P-wave loops within each recording were fairly similar, as quantified by the MAD of the features. Further, the MAD of was significantly lower post-PVI, indicating that P-wave loop roundness was more regular after the procedure. Figure 2 depicts an example of the box plots for the morphological loop features of a patient, comparing pre- and post-PVI features in order to illustrate within-patient variation.
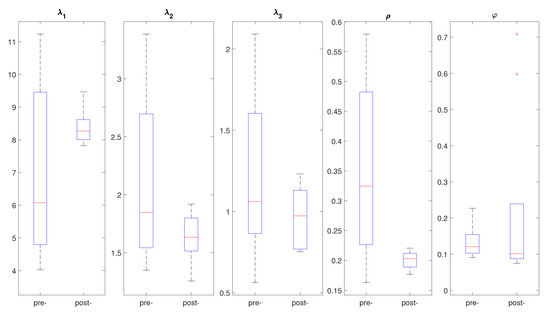
Figure 2.
Example of box plots for different morphological features of P-wave loops under study comparing pre- and post-PVI distribution for a patient included in the study.
There was significant positive correlation between and , as shown in Figure 3. This means that P-wave loops that were rounder were generally also less planar (since lower values for stand for more planar loops). No other correlations between P-wave loop characteristics were found.
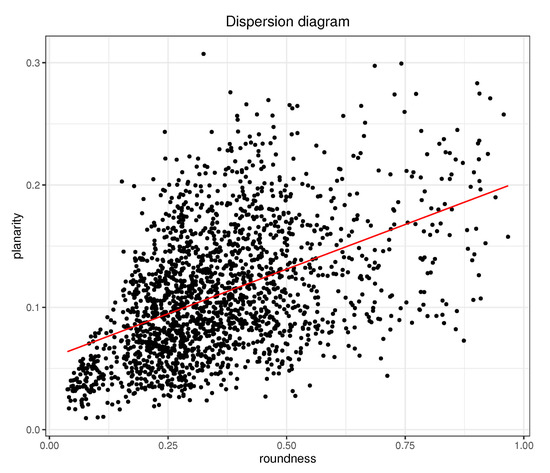
Figure 3.
Dispersion diagram for and for dataset including all analyzed P waves of the study. Pearson correlation is 0.47.
3.2. Time Intervals
ECG-derived time measurements were also measured. Table 3 shows the average and MAD of P-wave duration, interval, and intervals for pre- and post-PVI, as well as the significance p value test. Results indicate that, even though all measurements were shorter after the procedure, there were no statistically significant differences unless for the interval, which significantly decreased.
Table 3.
Pre- and post-PVI time-interval measurements, and average MAD about mean for the whole study population (50 subjects). Data are mean ± standard deviation or median (interquartile range). * p-value < 0.05 by paired Student’s t-test or Wilcoxon–Mann–Whitney test.
Similar to what was found for morphological characteristics, MAD also decreased after PVI, which reflected the reduction of the dispersion associated with a more regular signal after the procedure.
3.3. Cluster Analysis
Table 4 individually details the classification performance for each P-wave loop morphology and time-interval feature, and for the combination of features that maximizes global accuracy. The best individual classification performance was achieved for the PR interval, followed by P-wave duration. Among P-wave characteristics, provided the best classification performance.
Table 4.
Classification results when differentiating pre- and post-PVI using the different features, and the combination that maximizes global accuracy.
Overall best classification performance was achieved when combining time-interval features with P-wave loop morphology features. By combining the , , PR interval, RR interval, and P-wave duration characteristics, classification accuracy increased up to 84%, indicating that the features provide complementary information. Adding more features did not improve accuracy.
3.4. Differences between Patient Groups
Changes in P-wave loop characteristics, time intervals, and main direction of propagation for the group of patients with and without AF recurrence, respectively, are summarized in Table 5. In the group of patients with no AF recurrence, , , , and -wave duration significantly decreased, whereas significantly increased. For the group of patients with AF recurrence, on the other hand, , and significantly decreased.
Table 5.
Average changes following PVI for subset of patients who had AF recurrences (11 subjects) and those who did not have AF recurrence (39 subjects) along 2 years of follow-up. * p-value < 0.05 by paired Student’s t-test or Wilcoxon–Mann–Whitney test.
Classification performance for the group of patients without AF recurrence was 84%, while it was slightly smaller for the group with AF recurrence (81%). Classification results for individual features were remarkably better for patients who did not have AF recurrence, thus reflecting the success of the procedure.
4. Discussion
Several characteristics were analyzed to characterize modifications induced by catheter ablation for PVI on P-wave loops extracted from the VCG of patients with paroxysmal AF. Results showed that the first eigenvalue associated to matrices corresponding to P-wave loops significantly increased after catheter ablation. In particular, this behavior was consistent in patients for whom no AF recurrence appeared, while the first eigenvalue changed in the opposite way (decreased) for patients with recurrence. This increment of is consistent with previous works that found that P-wave amplitude measured on lead V1 is larger after PVI [12], and lower in patients with AF recurrence than in those without [33].
Linked to this feature was the loop-roundness measurement (), which was also notably smaller after catheter ablation and for patients without arrhythmia recurrence. Regarding intrapatient variation, Table 2 also shows that all parameters presented less mean absolute deviation after catheter ablation, despite the only feature that significantly differed being loop roundness. In this manner, changes in morphology (less round loops) could be used as the predictor of a successful procedure. Moreover, there is direct correlation between the increment of and the decrement of (Equation (1)). The increment of is in line with obtained results in previous studies that showed an increment of P-wave amplitudes and P-wave areas after PVI in ECG recordings [12,13] and simulations [34,35].
Similar to roundness, planarity () also showed a significant decrement after PVI, especially for patients without AF recurrence. Equation (2) also showed negative correlation between and , which reflected that higher values of suggest lower values of (i.e., more planar loops). Some works indicated that more planar loops of ventricular activity come from healthier subjects [36], and the same behavior is expected for AF patients for whom more planar loops are linked to more organized AF and decreased loop variability [21]. Presented results agree with these previous works, obtaining loops that were mostly contained in a two-dimensional plane. Furthermore, when comparing both morphology measurements (planarity and roundness in Figure 3), there was positive correlation between them, so that less round loops also seemed to be more planar.
Many recent references showed that P-wave duration decreases once catheter ablation ends [11,14,15,17,18,37], and heart rate increases (RR interval decreases) [38,39,40]. Our results are in line with these previous references. In our case, PR interval was the single feature that provided the best classification into pre- and post-PVI (see Table 4).This could be due to its connection with P-wave duration since they behave similarly: shorter P waves were observed after PVI [11], and longer PR intervals wee associated with longer P waves, with a significant predictive value of AF recurrence, and advanced left atrium remodeling due to AF [41].
We propose the combination of P-wave loop morphology measurements (roundness and planarity) and time features (RR interval, PR interval, and P-wave duration) to achieve better performance. Table 4 strengthens this premise since it shows that the combination of the five proposed features improves the characterization of pre- and post-PVI P waves.
Therefore, the presented work may help to characterize changes induced by pulmonary-vein isolation in atrial electric propagation, and how these changes are related to AF recurrence. It aimed at revealing AF recurrence by analyzing noninvasive recordings. Thus, regular checkups may allow for clinicians to manage arrhythmia progression in advance and improve AF treatment. Future work will focus on how different ablation sources may affect the different studied parameters [42,43], and will prospectively analyze how previous AF burden affects ablation outcome [3] with a larger cohort of patients.
5. Conclusions
The aim of the current study was to characterize P-wave loops from VCG before and after catheter ablation for pulmonary-vein isolation in paroxysmal AF patients. The use of morphology (roundness and planarity) with time measurements such as RR intervals and P-wave duration/PR intervals showed that P-wave analysis may reveal changes in the atrial propagation pattern due to the procedure, and may also help to predict AF recurrence outcome.
Author Contributions
Conceptualization, N.O. and Ó.C.; methodology, N.O. and F.S.; software, N.O.; validation, N.O.; data curation, Ó.C.; writing—original-draft preparation, N.O.; writing—review and editing, N.O. and F.S.; funding acquisition, N.O. All authors have read and agreed to the published version of the manuscript.
Funding
N. Ortigosa acknowledges the support from Spanish Ministerio de Ciencia, Innovación, y Universidades en El Marco del Programa Estatal de Promoción del Talento y su Empleabilidad en I+D+i -Subprograma Estatal de Movilidad- under grant CAS19/00168, from Generalitat Valenciana under grant Prometeo/2017/102, and from Spanish MINECO under grant MTM2016-76647-P. F. Sandberg acknowledges the support from the Swedish Research Council (grant VR2019-04272) and the Crafoord Foundation (grant 20200605).
Institutional Review Board Statement
The study was conducted according to the guidelines of the Declaration of Helsinki, and approved by the Ethics Committee of Hospital Universitari i Politècnic La Fe.
Informed Consent Statement
Informed consent was obtained from all subjects involved in the study.
Data Availability Statement
The data presented in this study are available on request from the corresponding author. The data are not publicly available due to ethical and privacy issues.
Conflicts of Interest
The funders had no role in the design of the study; in the collection, analyses, or interpretation of data; in the writing of the manuscript, or in the decision to publish the results.
References
- Hindricks, G.; Potpara, T.; Dagres, N.; Arbelo, E.; Bax, J.J.; Blomström-Lundqvist, C.; Boriani, G.; Castella, M.; Dan, G.-A.; Dilaveris, P.E.; et al. 2020 ESC Guidelines for the diagnosis and management of atrial fibrillation developed in collaboration with the European Association for Cardio-Thoracic Surgery (EACTS). Eur. Heart J. 2020, 29. [Google Scholar] [CrossRef]
- January, C.T.; Wann, L.S.; Calkins, H.; Chen, L.Y.; Cigarroa, J.E.; Cleveland, J.C.; Ellinor, P.T.; Ezekowitz, M.D.; Field, M.E.; Furie, K.L.; et al. 2019 AHA/ACC/HRS Focused Update of the 2014 AHA/ACC/HRS Guideline for the Management of Patients with Atrial Fibrillation: A Report of the American College of Cardiology/American Heart Association Task Force on Clinical Practice Guidelines and the Heart Rhythm Society in Collaboration with the Society of Thoracic Surgeons. Circulation 2019, 140, e125–e151. [Google Scholar] [CrossRef]
- Andrade, J.G.; Deyell, M.W.; Verma, A.; Macle, L.; Champagne, J.; Leong-Sit, P.; Novak, P.; Badra-Verdu, M.; Sapp, J.; Khairy, P.; et al. Association of Atrial Fibrillation Episode Duration with Arrhythmia Recurrence Following Ablation. JAMA Netw. Open 2020, 3, e208748. [Google Scholar] [CrossRef]
- Bavishi, A.A.; Kaplan, R.M.; Peigh, G.; Diaz, C.L.; Baman, J.R.; Trivedi, A.; Wasserlauf, J.; Shen, M.J.; Sattayaprasert, P.; Chicos, A.B.; et al. Patient characteristics as predictors of recurrence of atrial fibrillation following cryoballoon ablation. Pacing Clin. Electrophysiol. 2019, 42, 694–704. [Google Scholar] [CrossRef] [PubMed]
- Gaztañaga, L.; Frankel, D.; Kohari, M.; Kondapalli, L.; Zado, E.; Marchlinski, F. Time to recurrence of atrial fibrillation influences outcome following catheter ablation. Heart Rhythm 2013, 10, 2–9. [Google Scholar] [CrossRef] [PubMed]
- Sultan, A.; Lüker, J.; Andresen, D.; Kuck, K.; Hoffmann, E.; Brachmann, J.; Steven, D. Predictors of Atrial Fibrillation Recurrence after Catheter Ablation: Data from the German Ablation Registry. Sci. Rep. 2017, 7, 16678. [Google Scholar] [CrossRef] [PubMed]
- Efremidis, M.; Letsas, L.; Giannopoulos, G.; Lioni, L.; Vlachos, K.; Asvestas, D.; Karlis, D.; Kareliotis, V.; Geladari, H.; Sideris, A.; et al. Early pulmonary vein reconnection as a predictor of left atrial ablation outcomes for paroxysmal atrial fibrillation. Europace 2015, 17, 741–746. [Google Scholar] [CrossRef] [PubMed]
- Cheng, Z.; Deng, H.; Cheng, K.; Chen, T.; Gao, P.; Yu, M.; Fang, Q. The Amplitude of Fibrillatory Waves on Leads aVF and V1Predicting the Recurrence of Persistent Atrial Fibrillation Patients Who Underwent Catheter Ablation. Ann. Noninvasive Electrocardiol. 2013, 18, 352–358. [Google Scholar] [CrossRef] [PubMed]
- Henriksson, M.; García-Alberola, A.; Goya, R.; Vadillo, A.; Melgarejo-Meseguer, F.M.; Sandberg, F.; Sörnmo, L. Changes in f-wave characteristics during cryoballoon catheter ablation. Physiol. Measur. 2018, 39, 105001. [Google Scholar] [CrossRef] [PubMed]
- Alcaraz, R.; Hornero, F.; Rieta, J. Electrocardiographic Spectral Features for Long-Term Outcome Prognosis of Atrial Fibrillation Catheter Ablation. Ann. Biomed. Eng. 2016, 44, 3307–3318. [Google Scholar] [CrossRef]
- Beeumen, K.V.; Houben, R.; Tavernier, R.; Ketels, S.; Duytschaever, M. Changes in P-wave area and P-wave duration after circumferential pulmonary vein isolation. Europace 2010, 12, 798–804. [Google Scholar] [CrossRef]
- Ortigosa, N.; Cano, O. P-wave Analysis in Paroxysmal Atrial Fibrillation Patients before and after Pulmonary Vein Isolation. Comput. Cardiol. 2017, 44, 1–4. [Google Scholar] [CrossRef]
- Ortigosa, N.; Ayala, G.; Cano, O. Variation of P-wave indices in paroxysmal atrial fibrillation patients before and after catheter ablation. Biomed. Signal Process. Control 2021, 66, 102500. [Google Scholar] [CrossRef]
- Nakatani, Y.; Sakamoto, T.; Yamaguchi, Y.; Tsujino, Y.; Kataoka, N.; Kinugawa, K. Coefficient of variation of P-wave duration measured using an automated measurement system predicts recurrence of atrial fibrillation. J. Electrocardiol. 2019, 53, 79–84. [Google Scholar] [CrossRef]
- Knecht, S.; Pradella, M.; Reichlin, T.; Muhl, A.; Bossard, M.; Stieltjes, B.; Conen, D.; Bremerich, J.; Osswald, S.; Kuhne, M.; et al. Left atrial anatomy, atrial fibrillation burden, and P-wave duration-relationships and predictors for single-procedure success after pulmonary vein isolation. Europace 2018, 20, 271–278. [Google Scholar] [CrossRef] [PubMed]
- Lim, T.W.; Wu, G.; Ross, D.L.; Thomas, S.P. P-wave Measurements and Electrical Reconnection of the Posterior Left Atrium after Catheter Ablation for Atrial Fibrillation. Pacing Clin. Electrophysiol. 2010, 33, 1324–1334. [Google Scholar] [CrossRef]
- Pranata, R.; Yonas, E.; Vania, R. Prolonged P-wave duration in sinus rhythm pre-ablation is associated with atrial fibrillation recurrence after pulmonary vein isolation-A systematic review and meta-analysis. Ann. Noninvasive Electrocardiol. 2019, 24. [Google Scholar] [CrossRef]
- Garvanski, I.; Simova, I.; Angelkov, L.; Matveev, M. Predictors of Recurrence of AF in Patients After Radiofrequency Ablation. Eur. Cardiol. Rev. 2019, 14, 165–168. [Google Scholar] [CrossRef]
- Dretzke, J.; Chuchu, N.; Agarwal, R.; Herd, C.; Chua, W.; Fabritz, L.; Takwoingi, Y. Predicting recurrent atrial fibrillation after catheter ablation: A systematic review of prognostic models. Europace 2020, 22, 748–760. [Google Scholar] [CrossRef]
- Stafford, P. Will my ablation work? Check the P-wave. Europace 2013, 15, 159–160. [Google Scholar] [CrossRef] [PubMed]
- Richter, U.; Stridh, M.; Bollmann, A.; Husser, D.; Sörnmo, L. Spatial characteristics of atrial fibrillation electrocardiograms. J. Electrocardiol. 2008, 41, 165–172. [Google Scholar] [CrossRef] [PubMed]
- Meyer, C.R.; Keiser, H.N. Electrocardiogram baseline noise estimation and removal using cubic splines and state-space computation techniques. Comput. Biomed. Res. 1977, 10, 459–470. [Google Scholar] [CrossRef]
- Almeida, R.; Martínez, J.; Rocha, A.; Laguna, P. Multilead ECG delineation using spatially projected leads from wavelet transform loops. IEEE Trans. Biomed. Eng. 2009, 56, 1996–2005. [Google Scholar] [CrossRef] [PubMed]
- Almeida, R.; Martínez, J.; Rocha, A.; Laguna, P. P Wave Delineation Using Spatially Projected Leads from Wavelet Transform Loops. Comput. Cardiol. 2010, 37, 1003–1006. [Google Scholar]
- Martínez, J.; Almeida, R.; Olmos, S.; Rocha, A.; Laguna, P. A wavelet-based ECG delineator evaluation on standard databases. IEEE Trans. Biomed. Eng. 2004, 51, 570–581. [Google Scholar] [CrossRef] [PubMed]
- Kors, J.; van Herpen, G.; Sittig, A.; van Bemmel, J. Reconstruction of the Frank vectorcardiogram from standard electrocardiographic leads: Diagnostic comparison of different methods. Eur. Heart J. 1990, 11, 1083–1092. [Google Scholar] [CrossRef]
- Jaros, R.; Martinek, R.; Danys, L. Comparison of Different Electrocardiography with Vectorcardiography Transformations. Sensors 2019, 19, 3072. [Google Scholar] [CrossRef] [PubMed]
- Man, S.; Algra, A.; Schreurs, C.; Borleffs, C.J.W.; Scherptong, R.W.; Van Erven, L.; Swenne, C.A. Influence of the vectorcardiogram synthesis matrix on the power of the electrocardiogram-derived spatial QRS-T angle to predict arrhythmias in patients with ischemic heart disease and systolic left ventricular dysfunction. J. Electrocardiol. 2011, 44, 410–415. [Google Scholar] [CrossRef] [PubMed]
- Dower, G.; Machado, H.; Osborne, J. On deriving the electrocardiogram from vectorcadiographic leads. Eur. Heart J. 1980, 3, 87–95. [Google Scholar]
- Sörnmo, L. Vectorcardiographic loop alignment and morphologic beat-to-beat. IEEE Trans. Biomed. Eng. 1998, 45, 1401–1413. [Google Scholar] [CrossRef]
- Surawicz, B.; Knilans, T. Electrocardiography in Clinical Practice; Saunders: Philadelphia, PA, USA, 2008. [Google Scholar]
- Arthur, D.; Vassilvitskii, S. K-Means: The Advantages of Careful Seeding. In Proceedings of the Eighteenth Annual ACM-SIAM Symposium on Discrete Algorithms, New Orleans, LA, USA, 7–9 January 2007; pp. 1027–1035. [Google Scholar]
- Nakatani, Y.; Sakamoto, T.; Yamaguchi, Y.; Tsujino, Y.; Kataoka, N.; Kinugawa, K. P-wave vector magnitude predicts recurrence of atrial fibrillation after catheter ablation in patients with persistent atrial fibrillation. Ann. Noninvasive Electrocardiol. 2019, 24. [Google Scholar] [CrossRef]
- Saha, M.; Conte, G.; Caputo, M.; Regoli, F.; Krause, R.; Auricchio, A.; Jacquemet, V. Changes in P-wavemorphology after pulmonary vein isolation: Insights from computer simulations. Europace 2016, 18, iv23–iv34. [Google Scholar]
- Yamashita, S.; Date, T.; Yamane, T.; Matsuo, S.; Ito, K.; Narui, R.; Hioki, M.; Tanigawa, S.-I.; Nakane, T.; Tokuda, M.; et al. Noninvasive vectorcardiographic evaluation of pulmonary vein–atrial reconnection after pulmonary vein isolation for atrial fibrillation. Heart Rhythm 2011, 8, 1398–1403. [Google Scholar] [CrossRef]
- Sedaghat, G.; Ghafoori, E.; Waks, J.W.; Kabir, M.M.; Shvilkin, A.; Josephson, M.E.; Tereshchenko, L.G. Quantitative Assessment of Vectorcardiographic Loop Morphology. J. Electrocardiol. 2016, 49, 154–163. [Google Scholar] [CrossRef] [PubMed]
- Censi, F.; Corazza, I.; Reggiani, E.; Calcagnini, G.; Mattei, E.; Triventi, M.; Boriani, G. P-wave Variability and Atrial Fibrillation. Sci. Rep. 2016, 6, 1–7. [Google Scholar] [CrossRef]
- Nilsson, B.; Chen, X.; Pehrson, S.; Hilden, J.; Svendsen, J. Increased resting heart rate following radiofrequency catheter ablation for atrial fibrillation. Europace 2005, 7, 415–420. [Google Scholar] [CrossRef]
- Yu, H.T.; Kim, T.H.; Uhm, J.S.; Kim, J.Y.; Joung, B.; Lee, M.H.; Pak, H.N. Prognosis of high sinus heart rate after catheter ablation for atrial fibrillation. Europace 2017, 19, 1132–1139. [Google Scholar] [CrossRef] [PubMed]
- Kang, K.W.; Kim, T.H.; Park, J.; Uhm, J.S.; Joung, B.; Hwang, C.; Lee, M.H.; Pak, H.N. Long-Term Changes in Heart Rate Variability After Radiofrequency Catheter Ablation for Atrial Fibrillation: 1-Year Follow-Up Study with Irrigation Tip Catheter. J. Cardiovasc. Electrophysiol. 2014, 25, 693–700. [Google Scholar] [CrossRef]
- Park, J.; Kim, T.H.; Lee, J.S.; Park, J.K.; Uhm, J.S.; Joung, B.; Lee, M.H.; Pak, H.N. Prolonged PR Interval Predicts Clinical Recurrence of Atrial Fibrillation After Catheter Ablation. J. Am. Heart Assoc. 2014, 3. [Google Scholar] [CrossRef] [PubMed]
- Swanson, D.K. Clinical outcomes differ among different ablation technologies used for surgical atrial fibrillation therapy. Sci. Iran. 2011, 18, 1469–1475. [Google Scholar] [CrossRef][Green Version]
- You, L.; Yao, L.; Zhou, B.; Jin, L.; Yin, H.; Wu, J.; Yin, G.; Yang, Y.; Zhang, C.; Liu, Y.; et al. Effects of different ablation strategies on long-term left atrial function in patients with paroxysmal atrial fibrillation: A single-blind randomized controlled trial. Sci. Rep. 2019, 9. [Google Scholar] [CrossRef] [PubMed]


Publisher’s Note: MDPI stays neutral with regard to jurisdictional claims in published maps and institutional affiliations. |
© 2021 by the authors. Licensee MDPI, Basel, Switzerland. This article is an open access article distributed under the terms and conditions of the Creative Commons Attribution (CC BY) license (http://creativecommons.org/licenses/by/4.0/).