
On the Use of Large Interactive Displays to Support Collaborative Engagement and Visual Exploratory Tasks


Abstract
:1. Introduction
2. Related Work
2.1. Collaborative Learning with Large Displays
2.2. Workspace/Display Arrangement and Collaborative Coupling
2.3. Shared vs. Non-Shared View and Control
3. Solid Visualization Tool
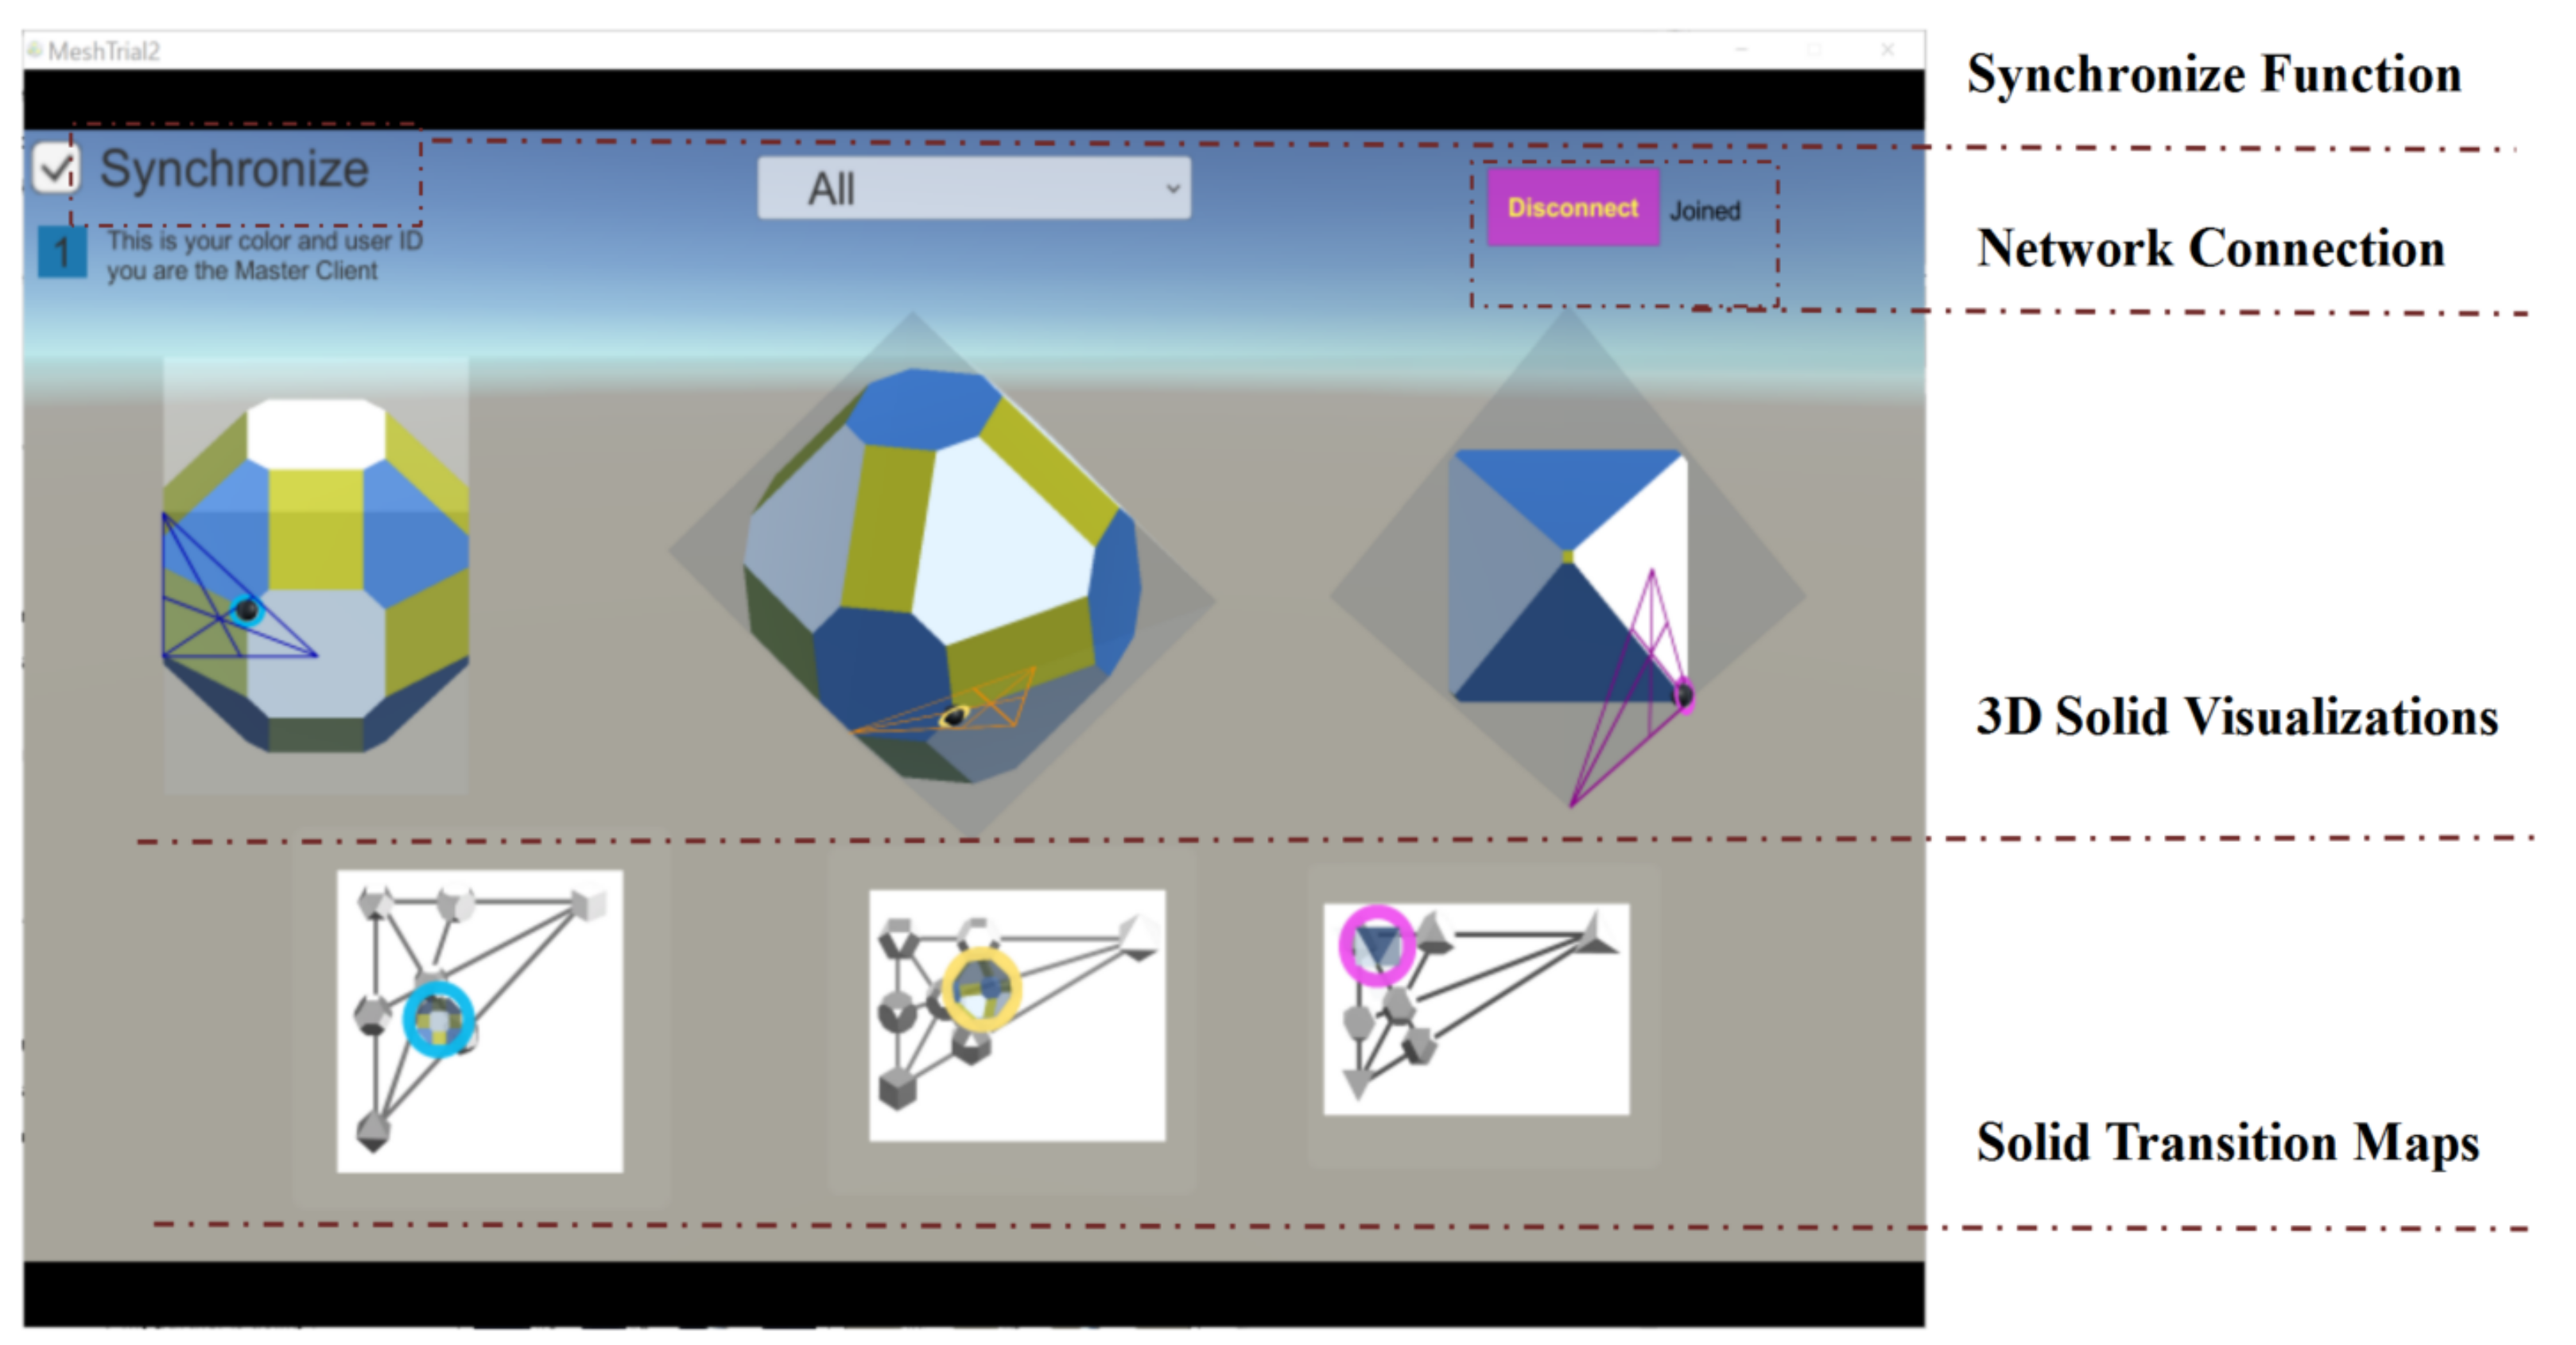
3.1. Visualization Tool Overview
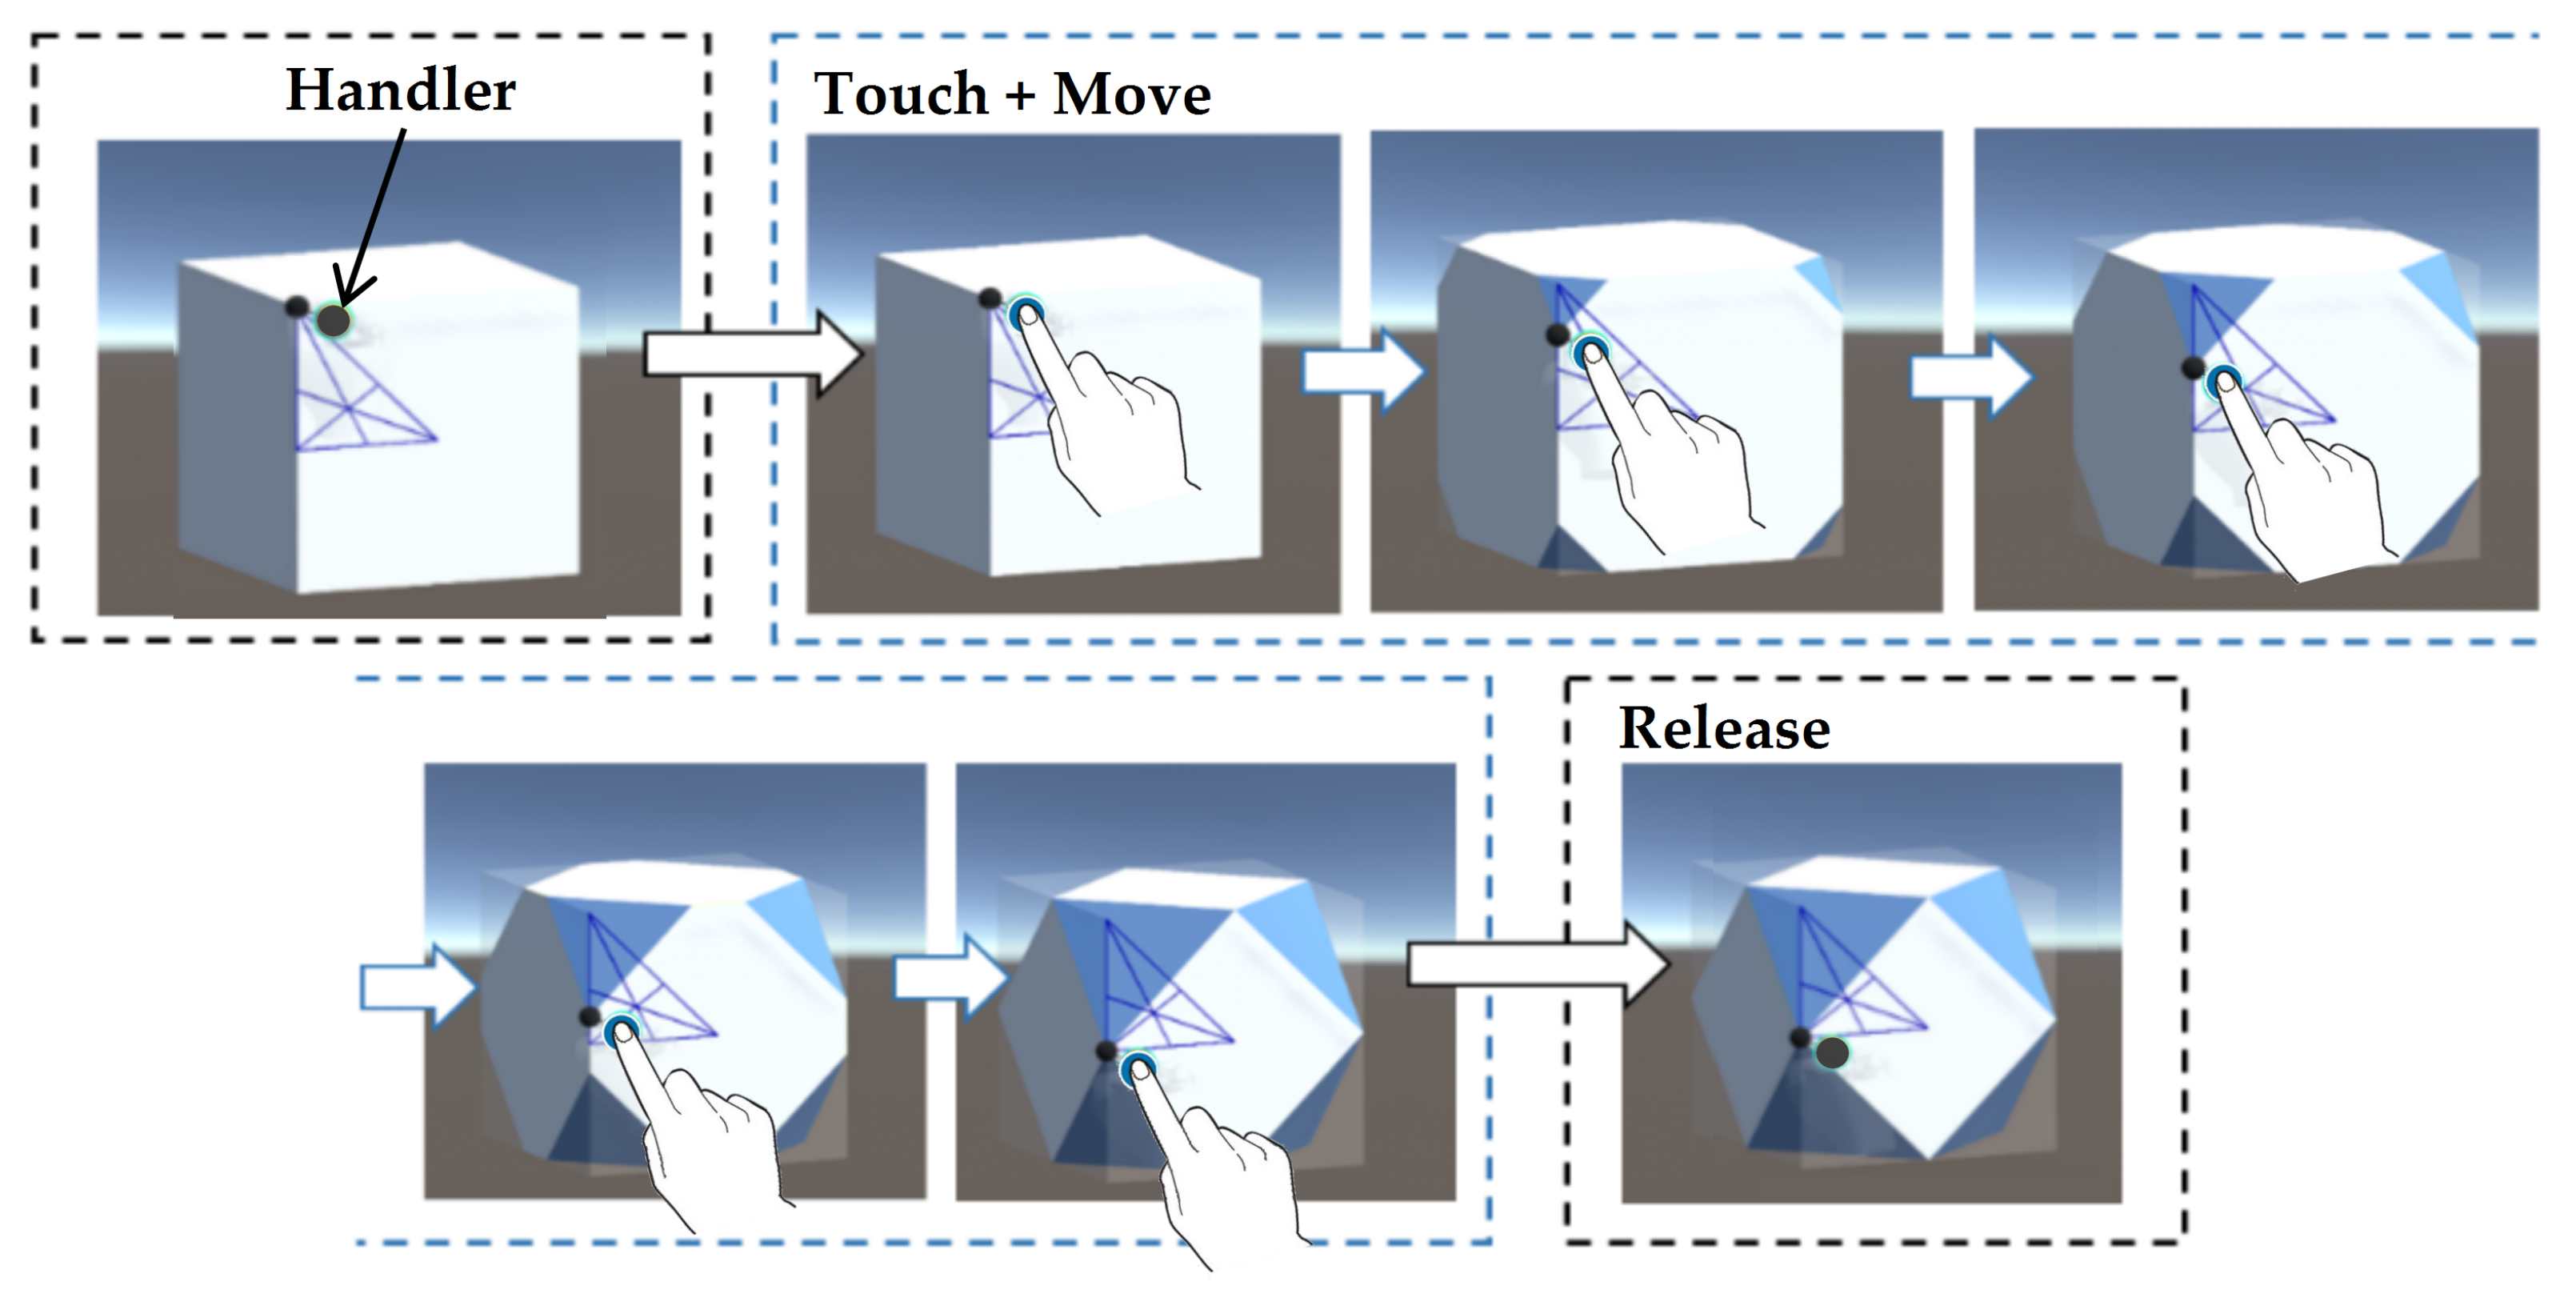
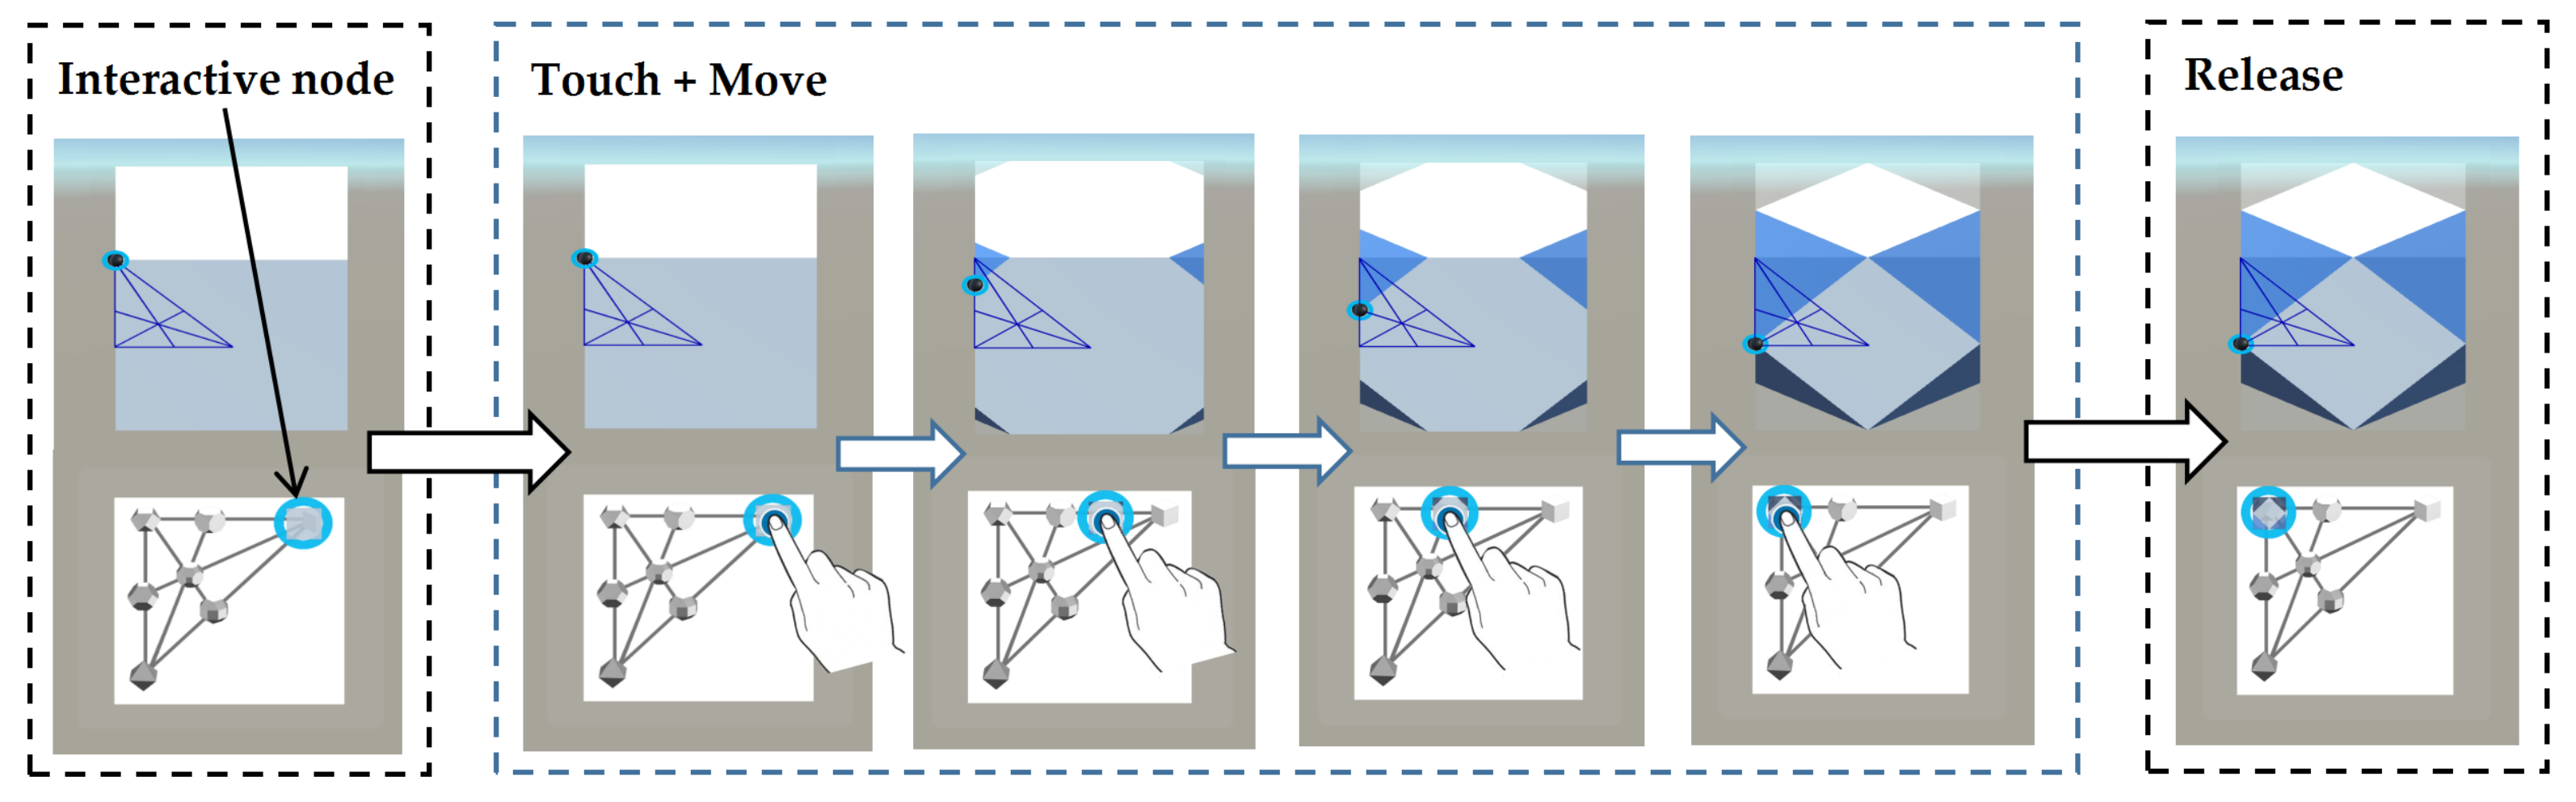
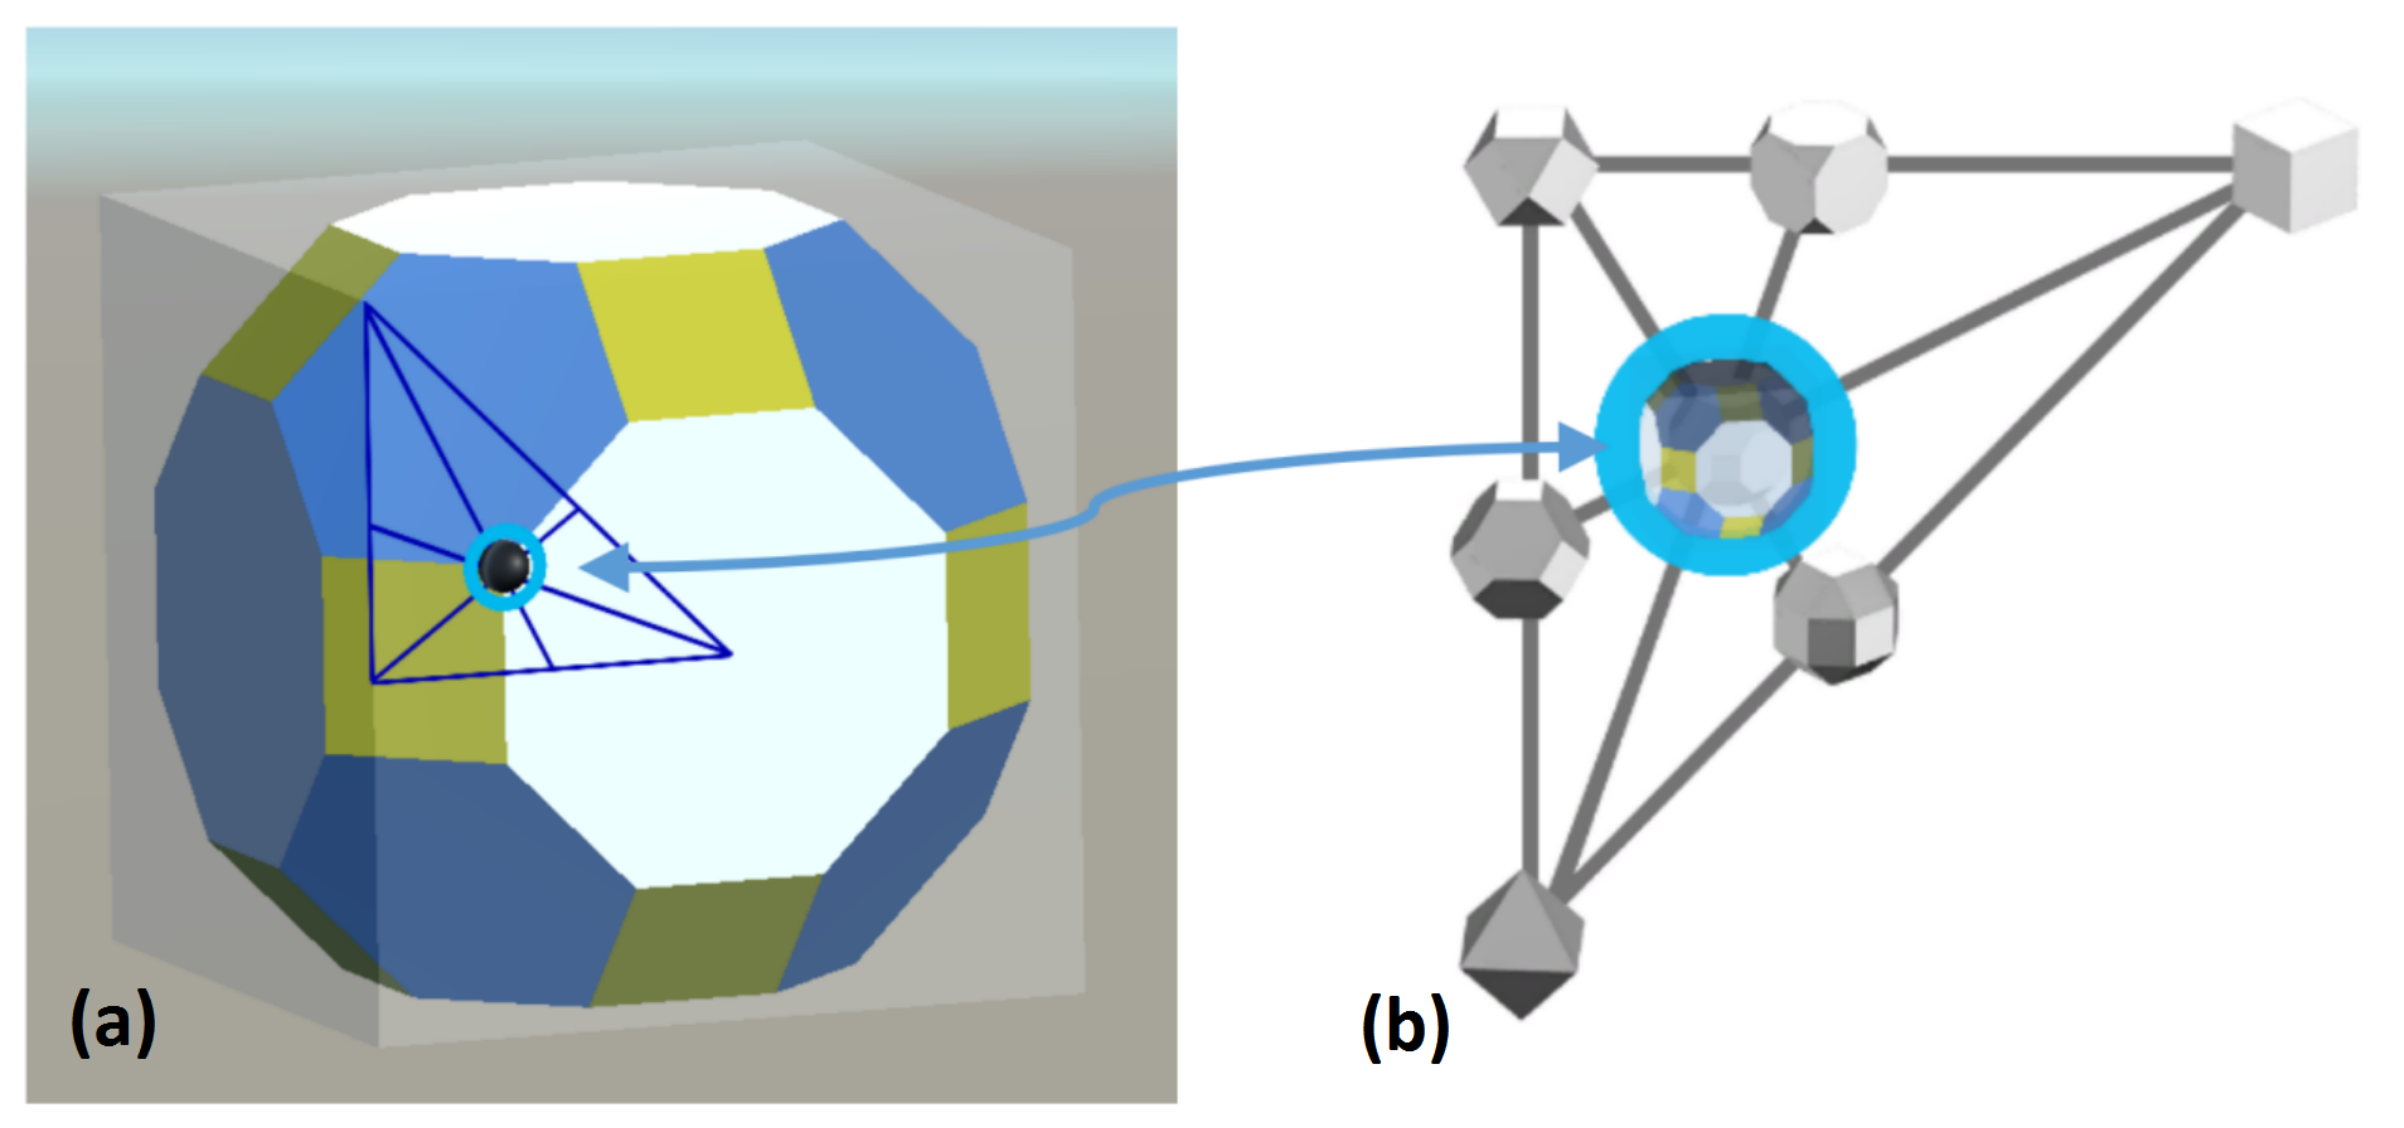
3.2. Interactive Morphing of the Solids
3.3. Dynamic-Linking of Multiple Visualizations
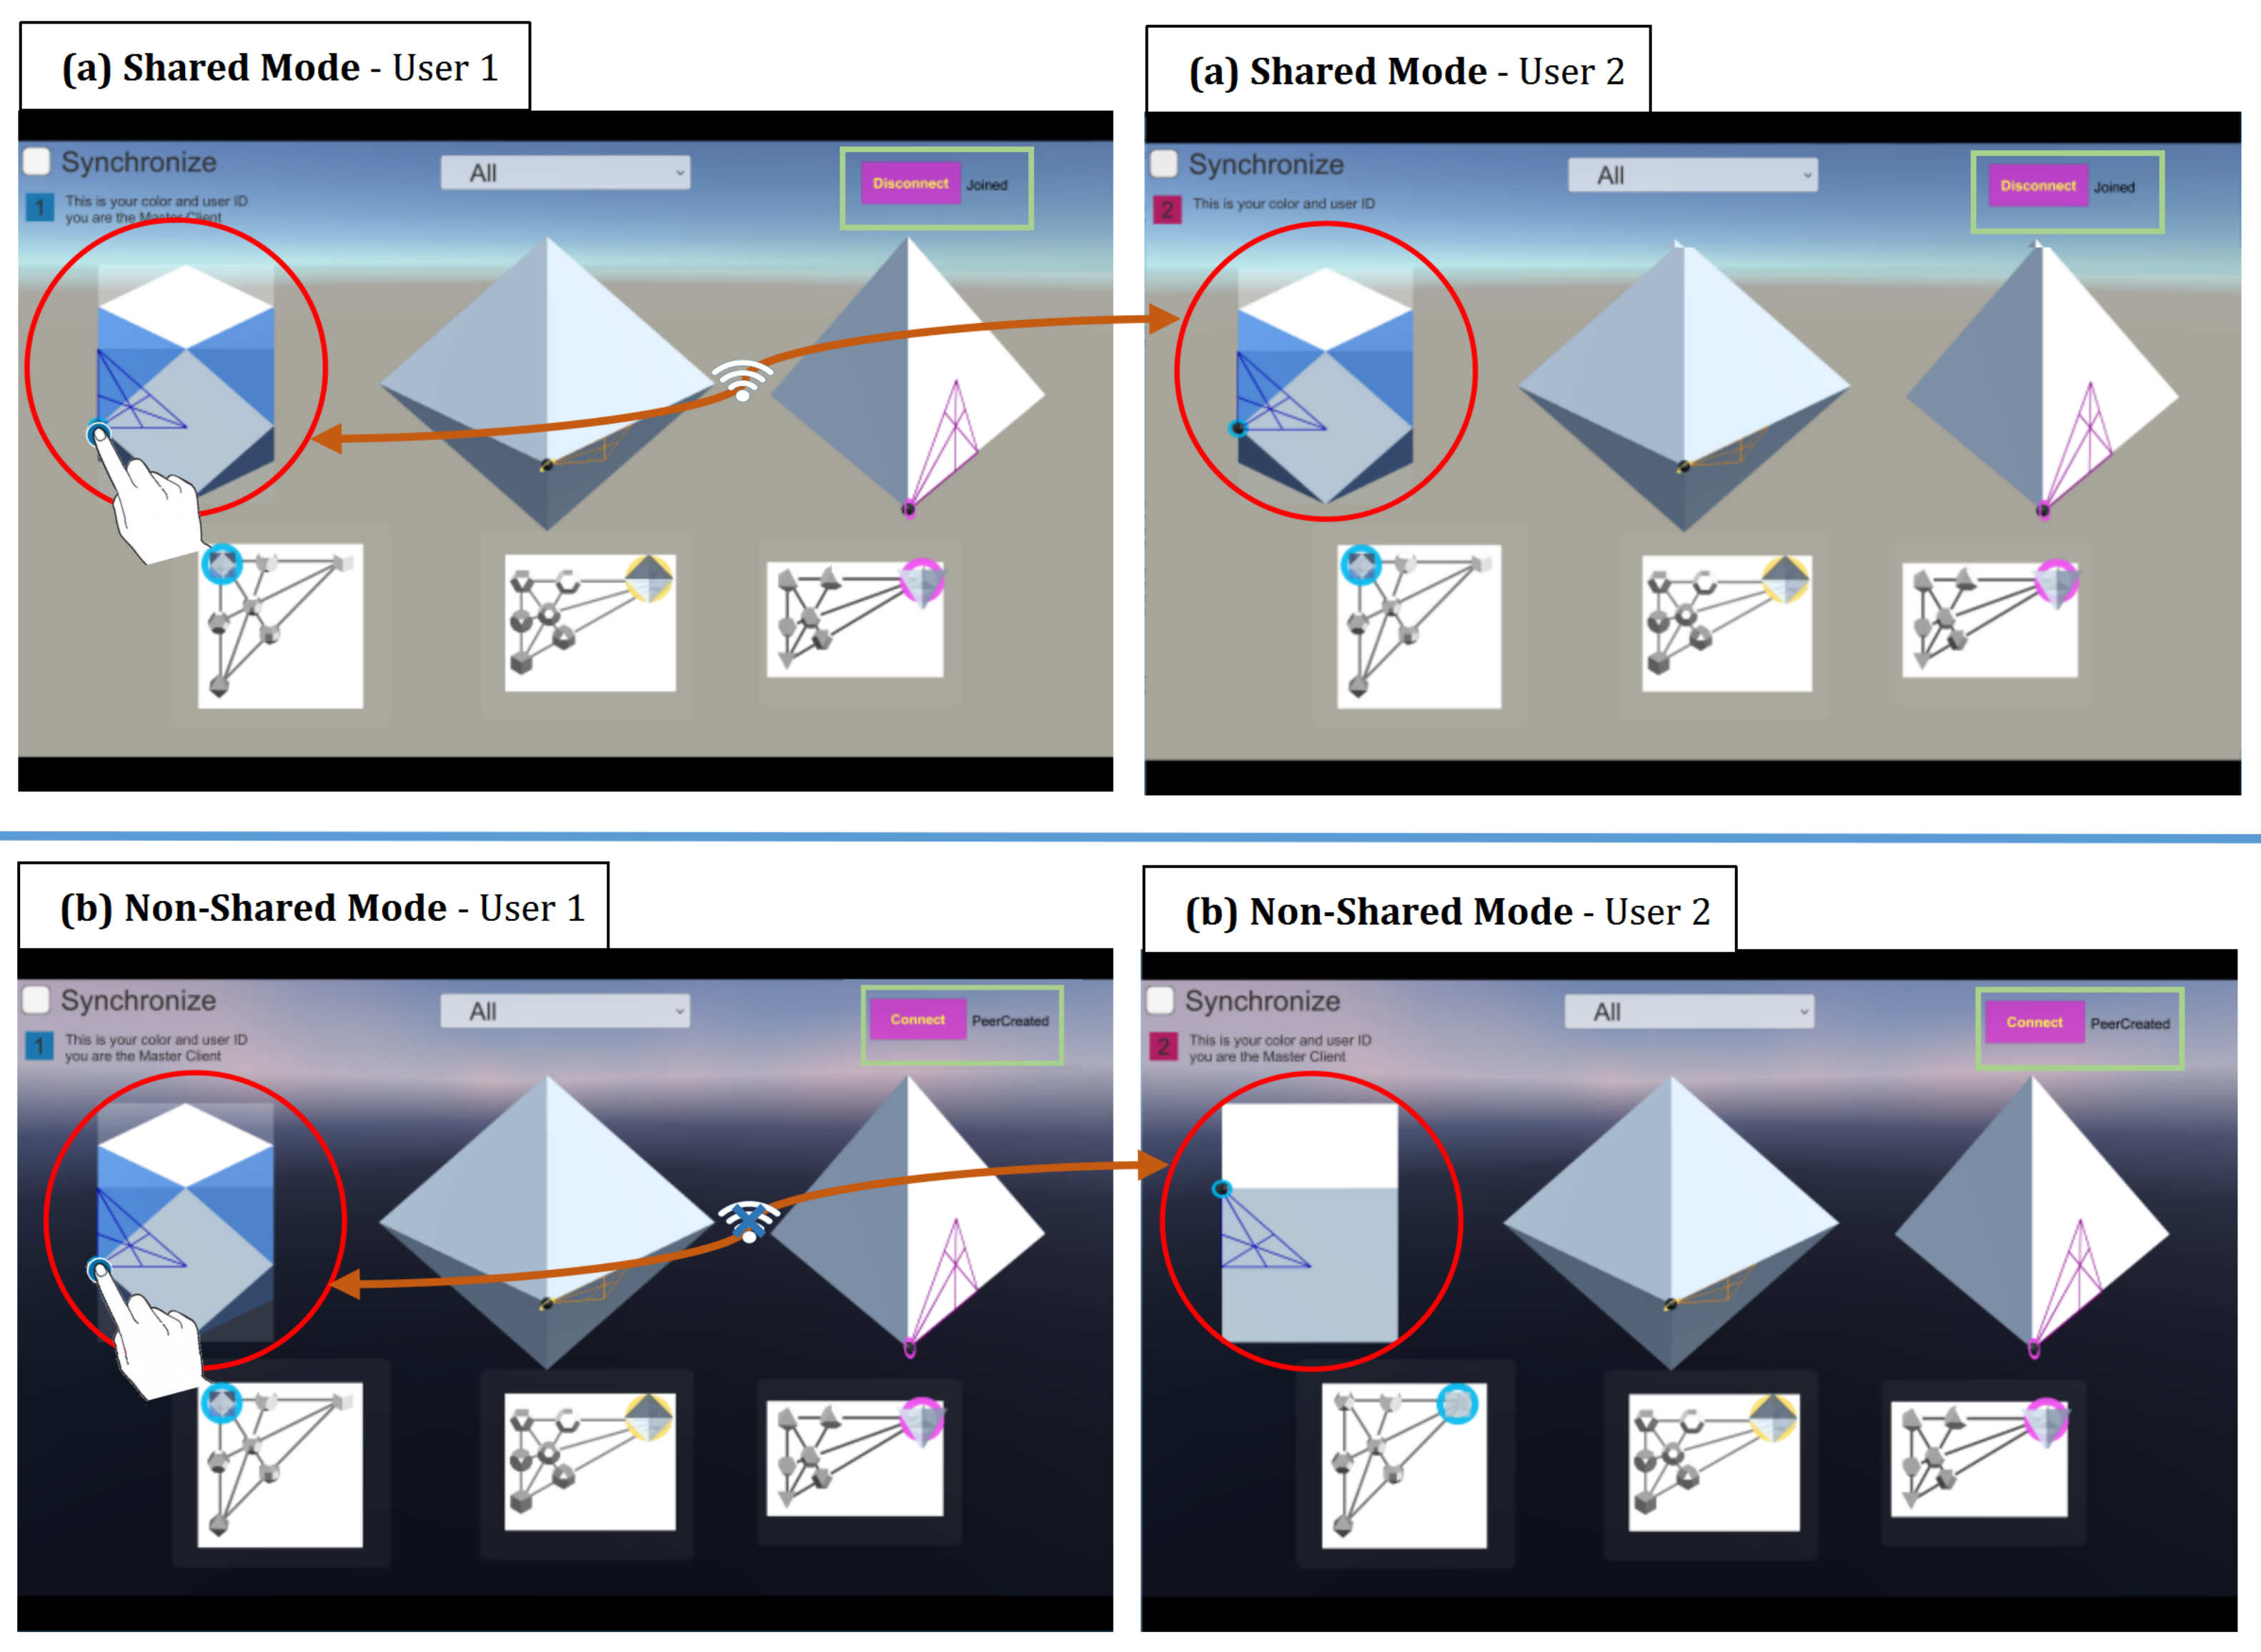
3.4. Shared and Non-Shared Control and View across Multiple Displays
4. User Study
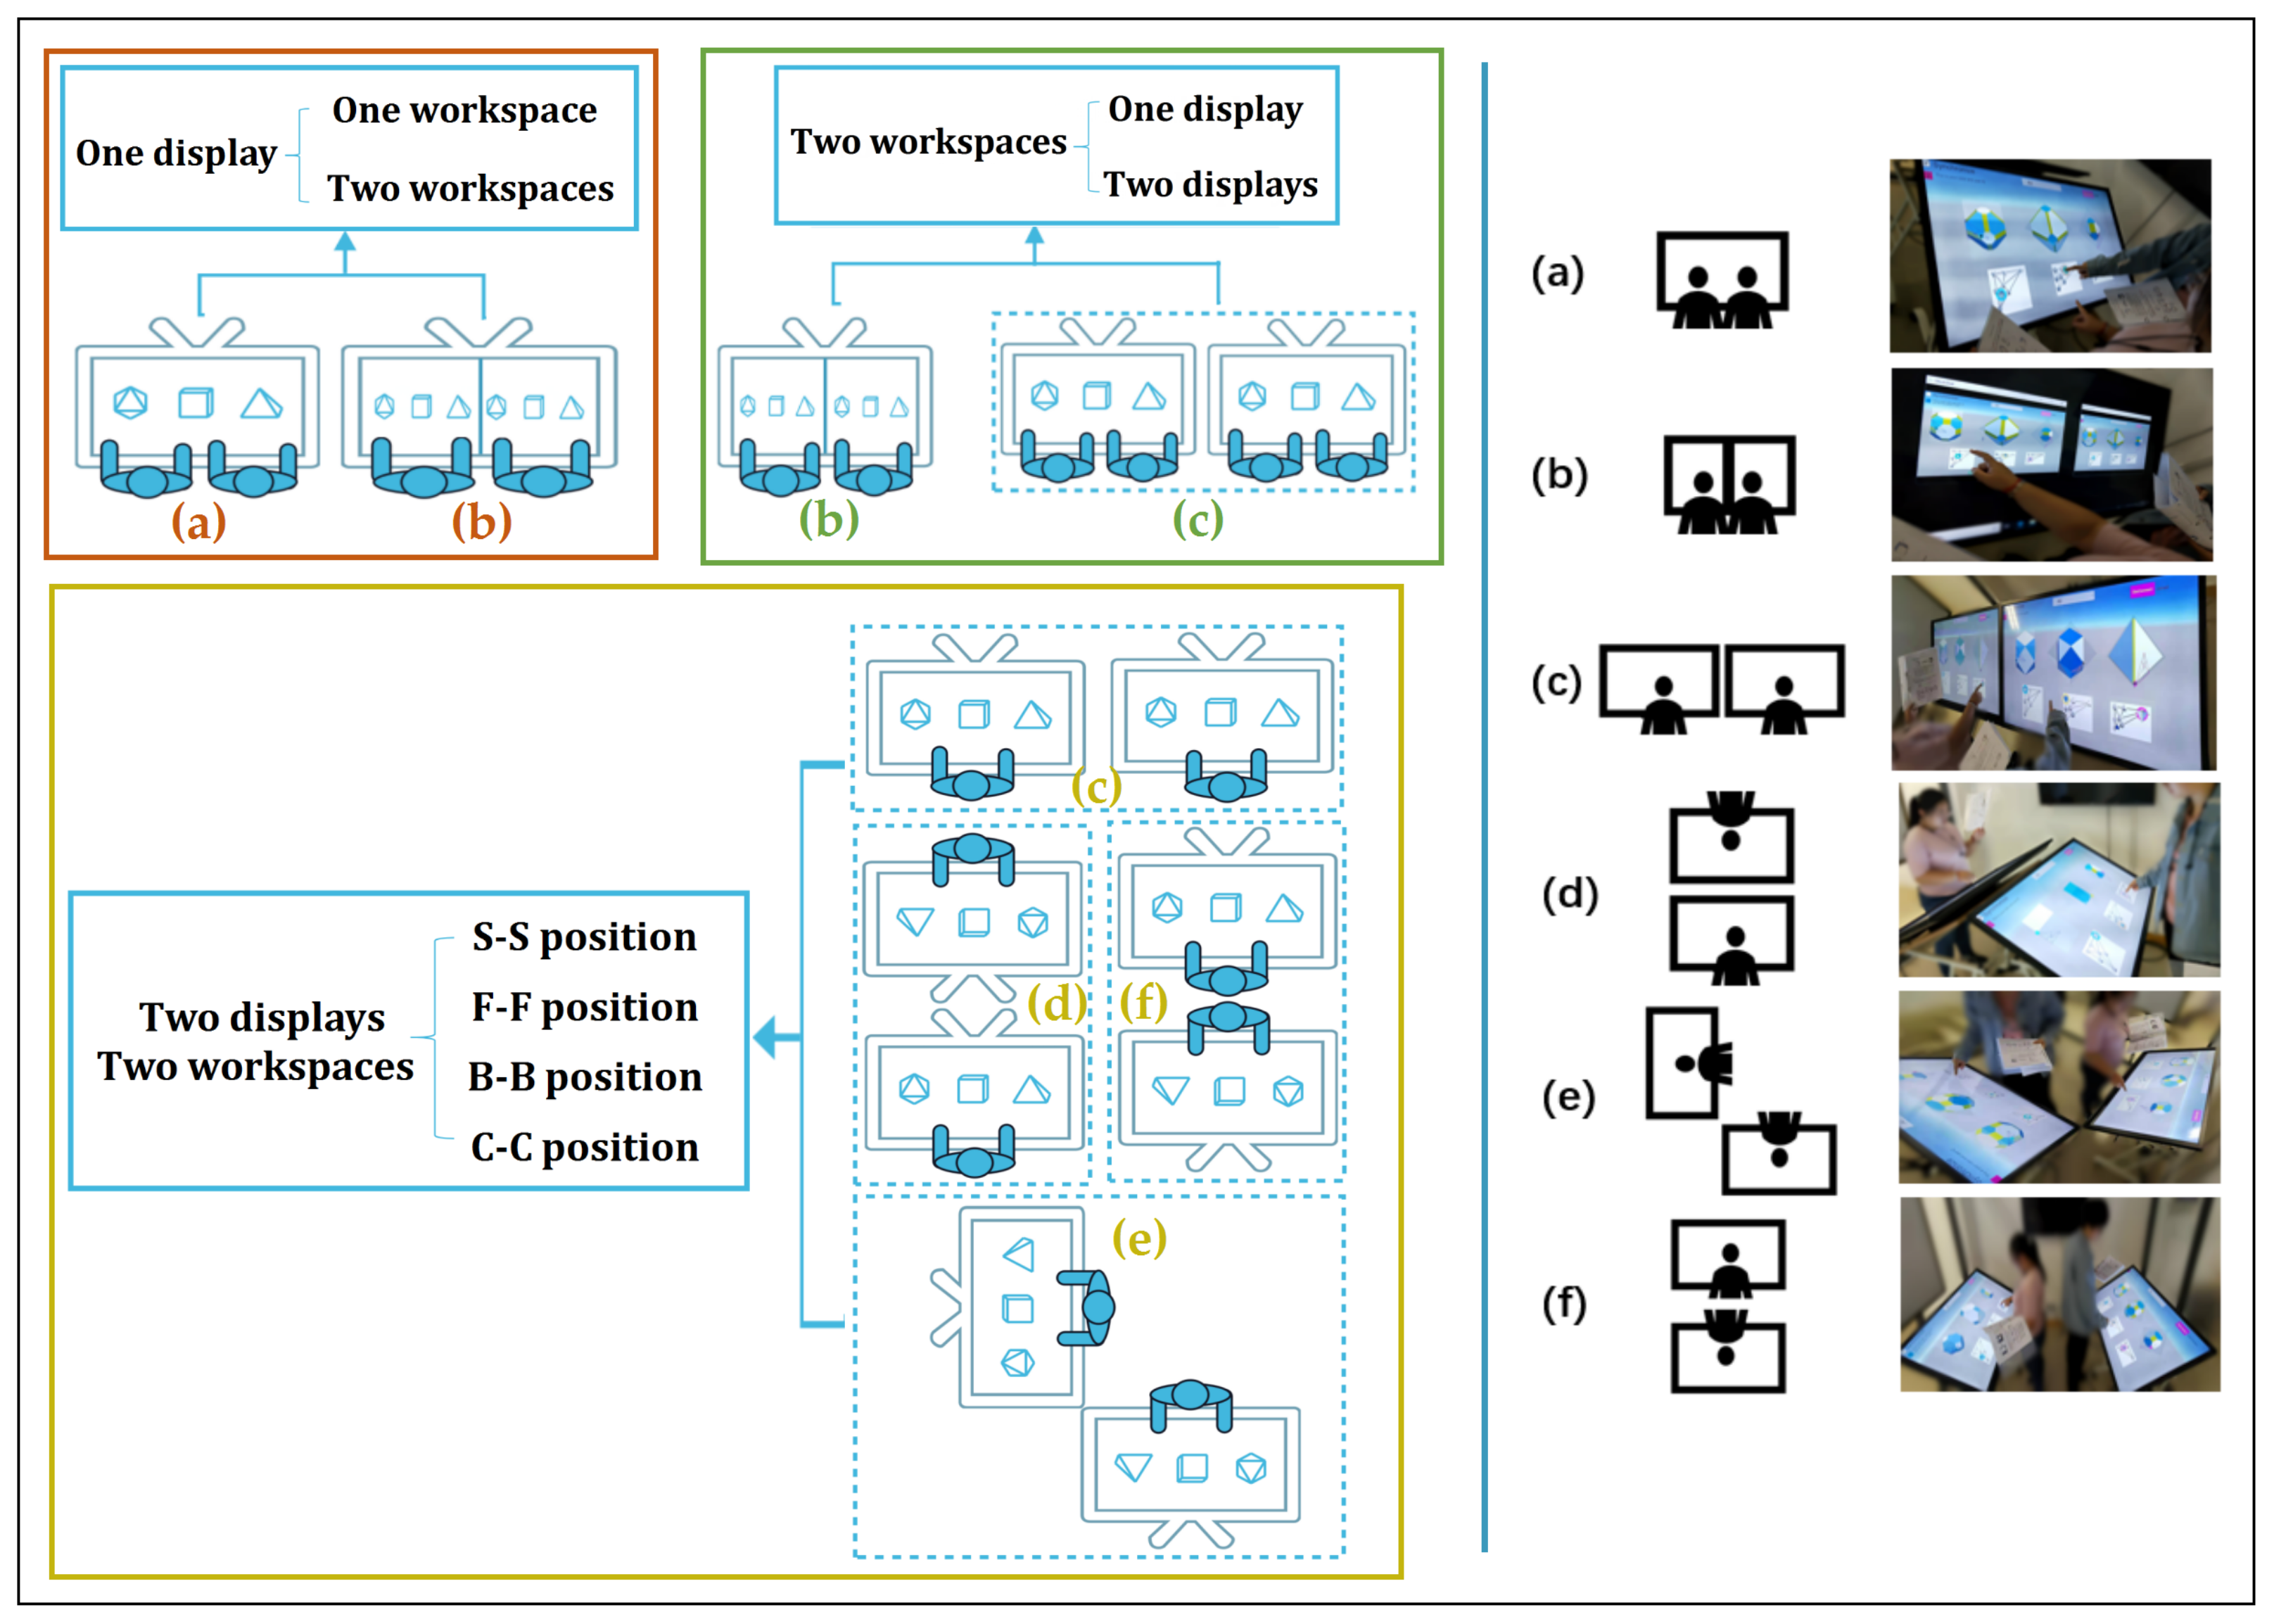
4.1. Experimental Design
4.2. Hypotheses
4.3. Participants
4.4. Apparatus
4.5. Tasks and Procedure
4.5.1. Pre- and Post-Experiment Test
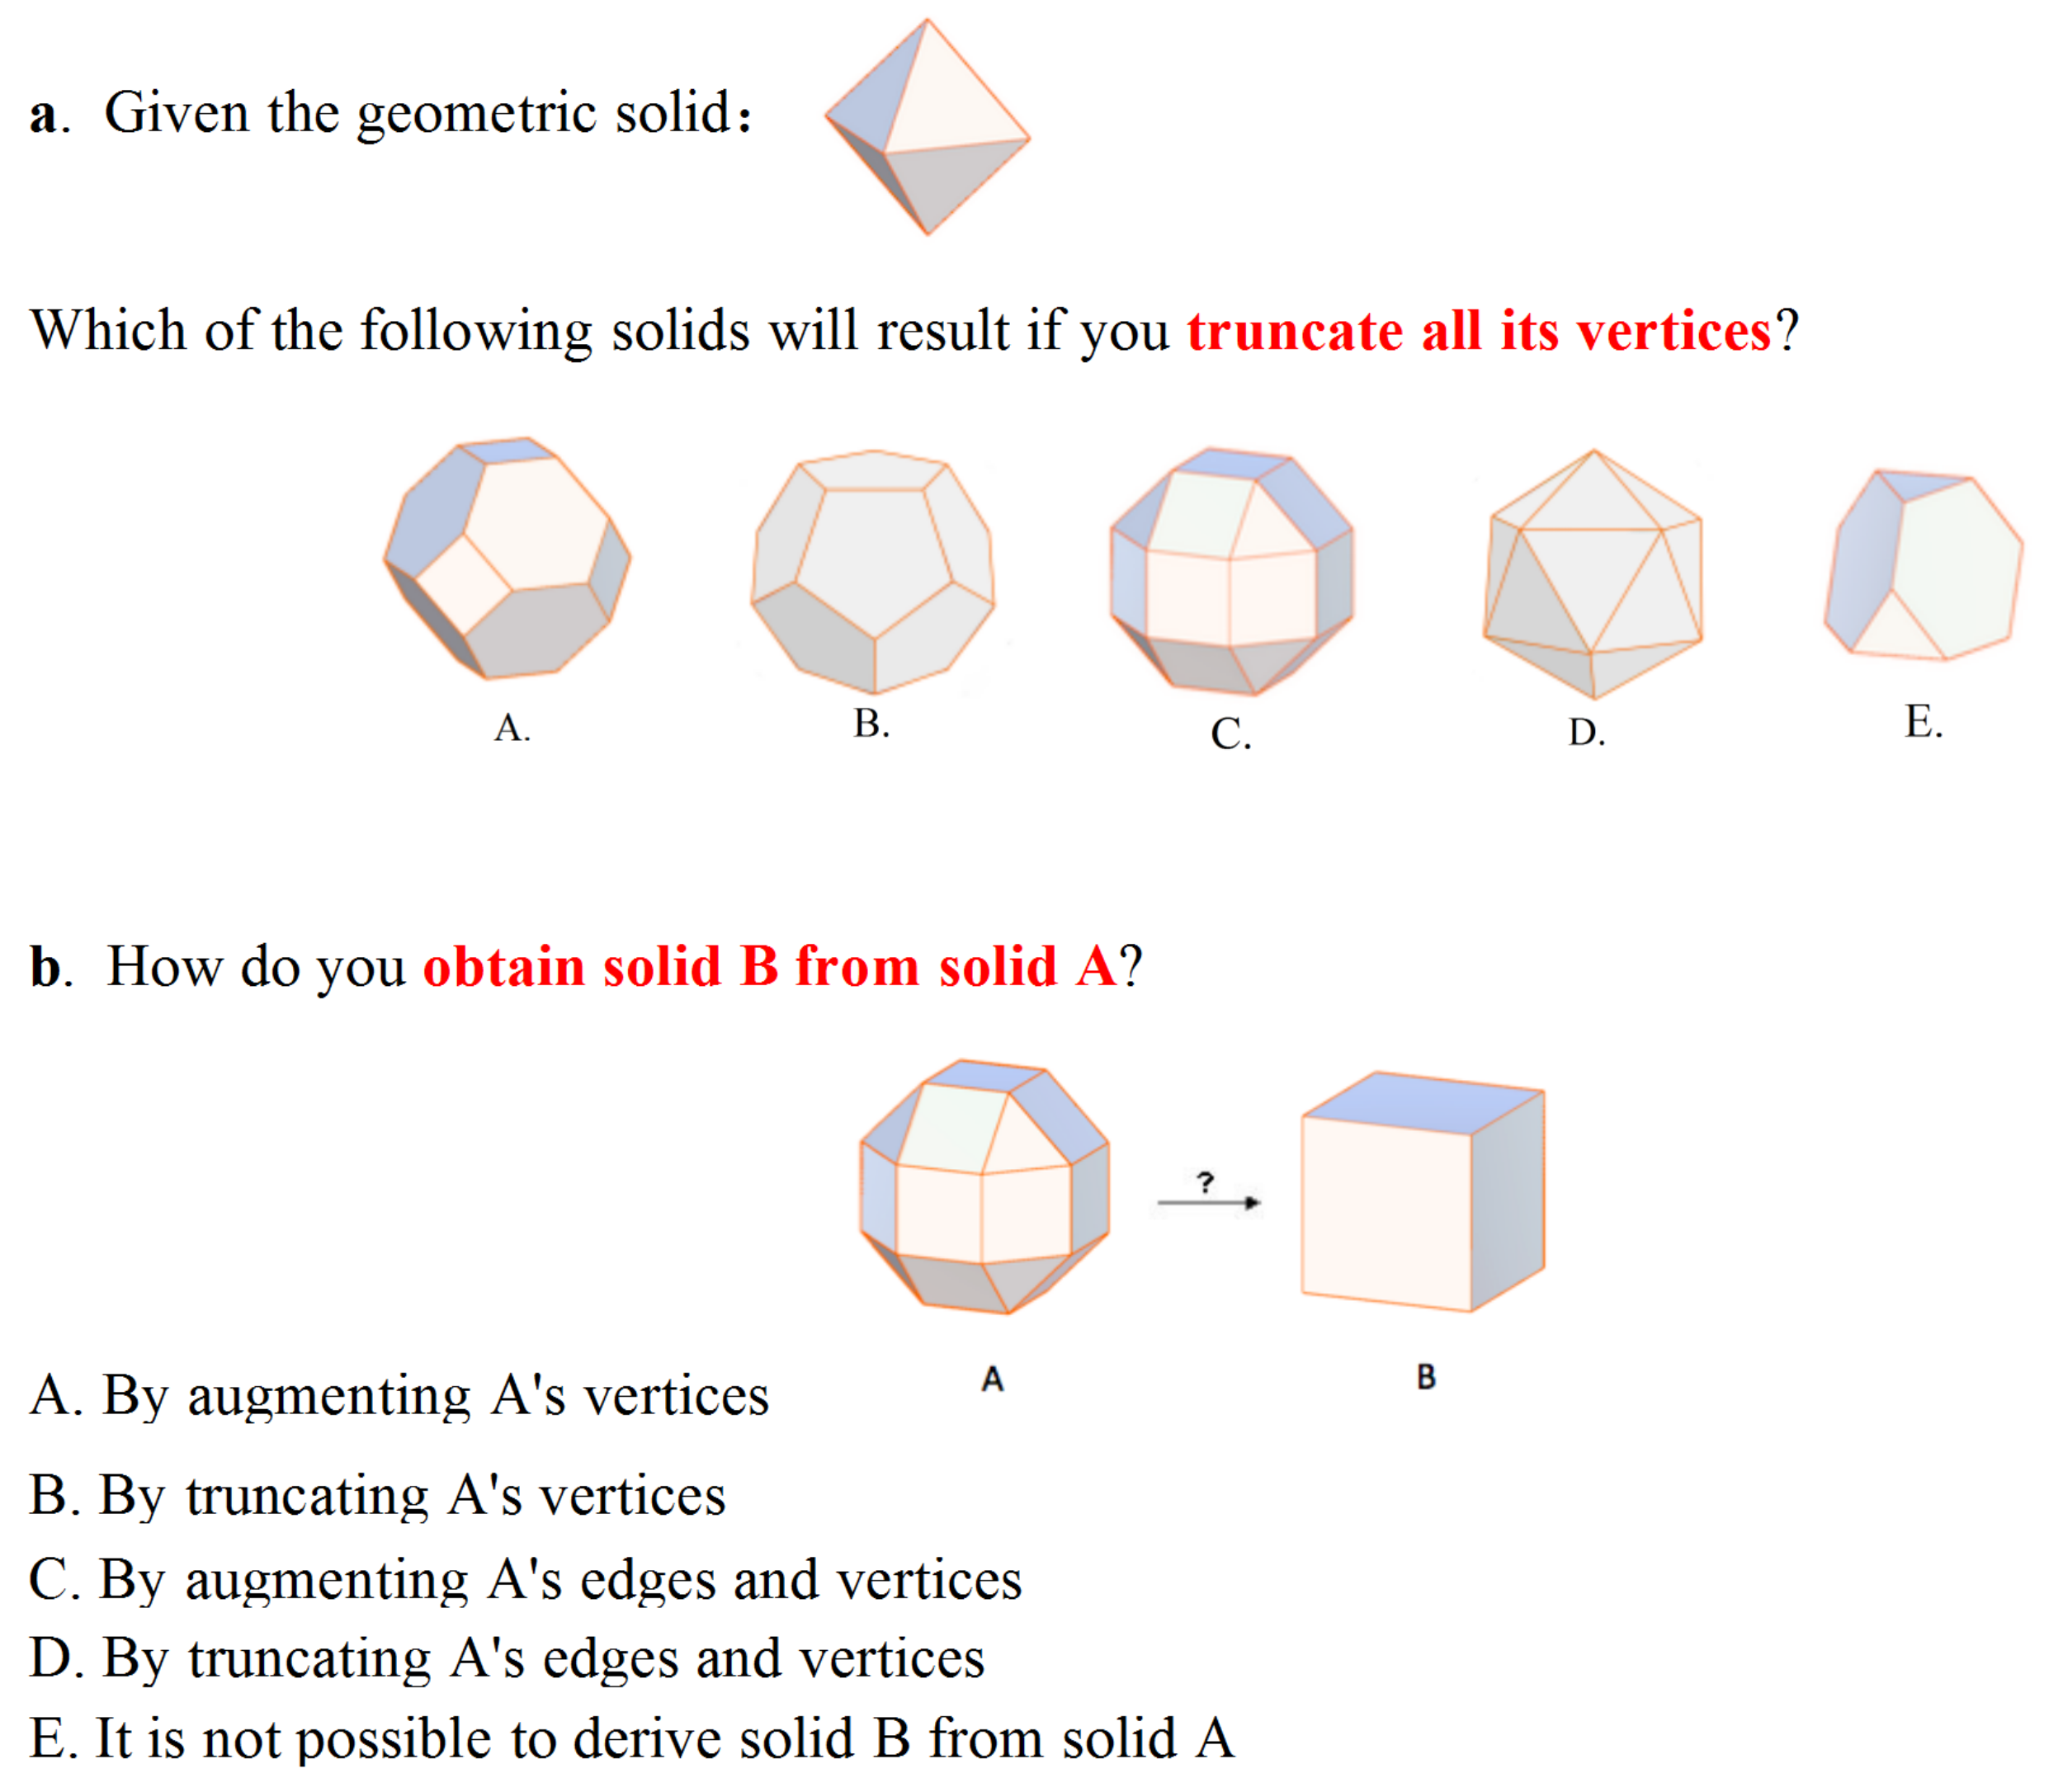
4.5.2. Collaborative Tasks
4.5.3. Procedure
4.6. Data Analysis
5. Results
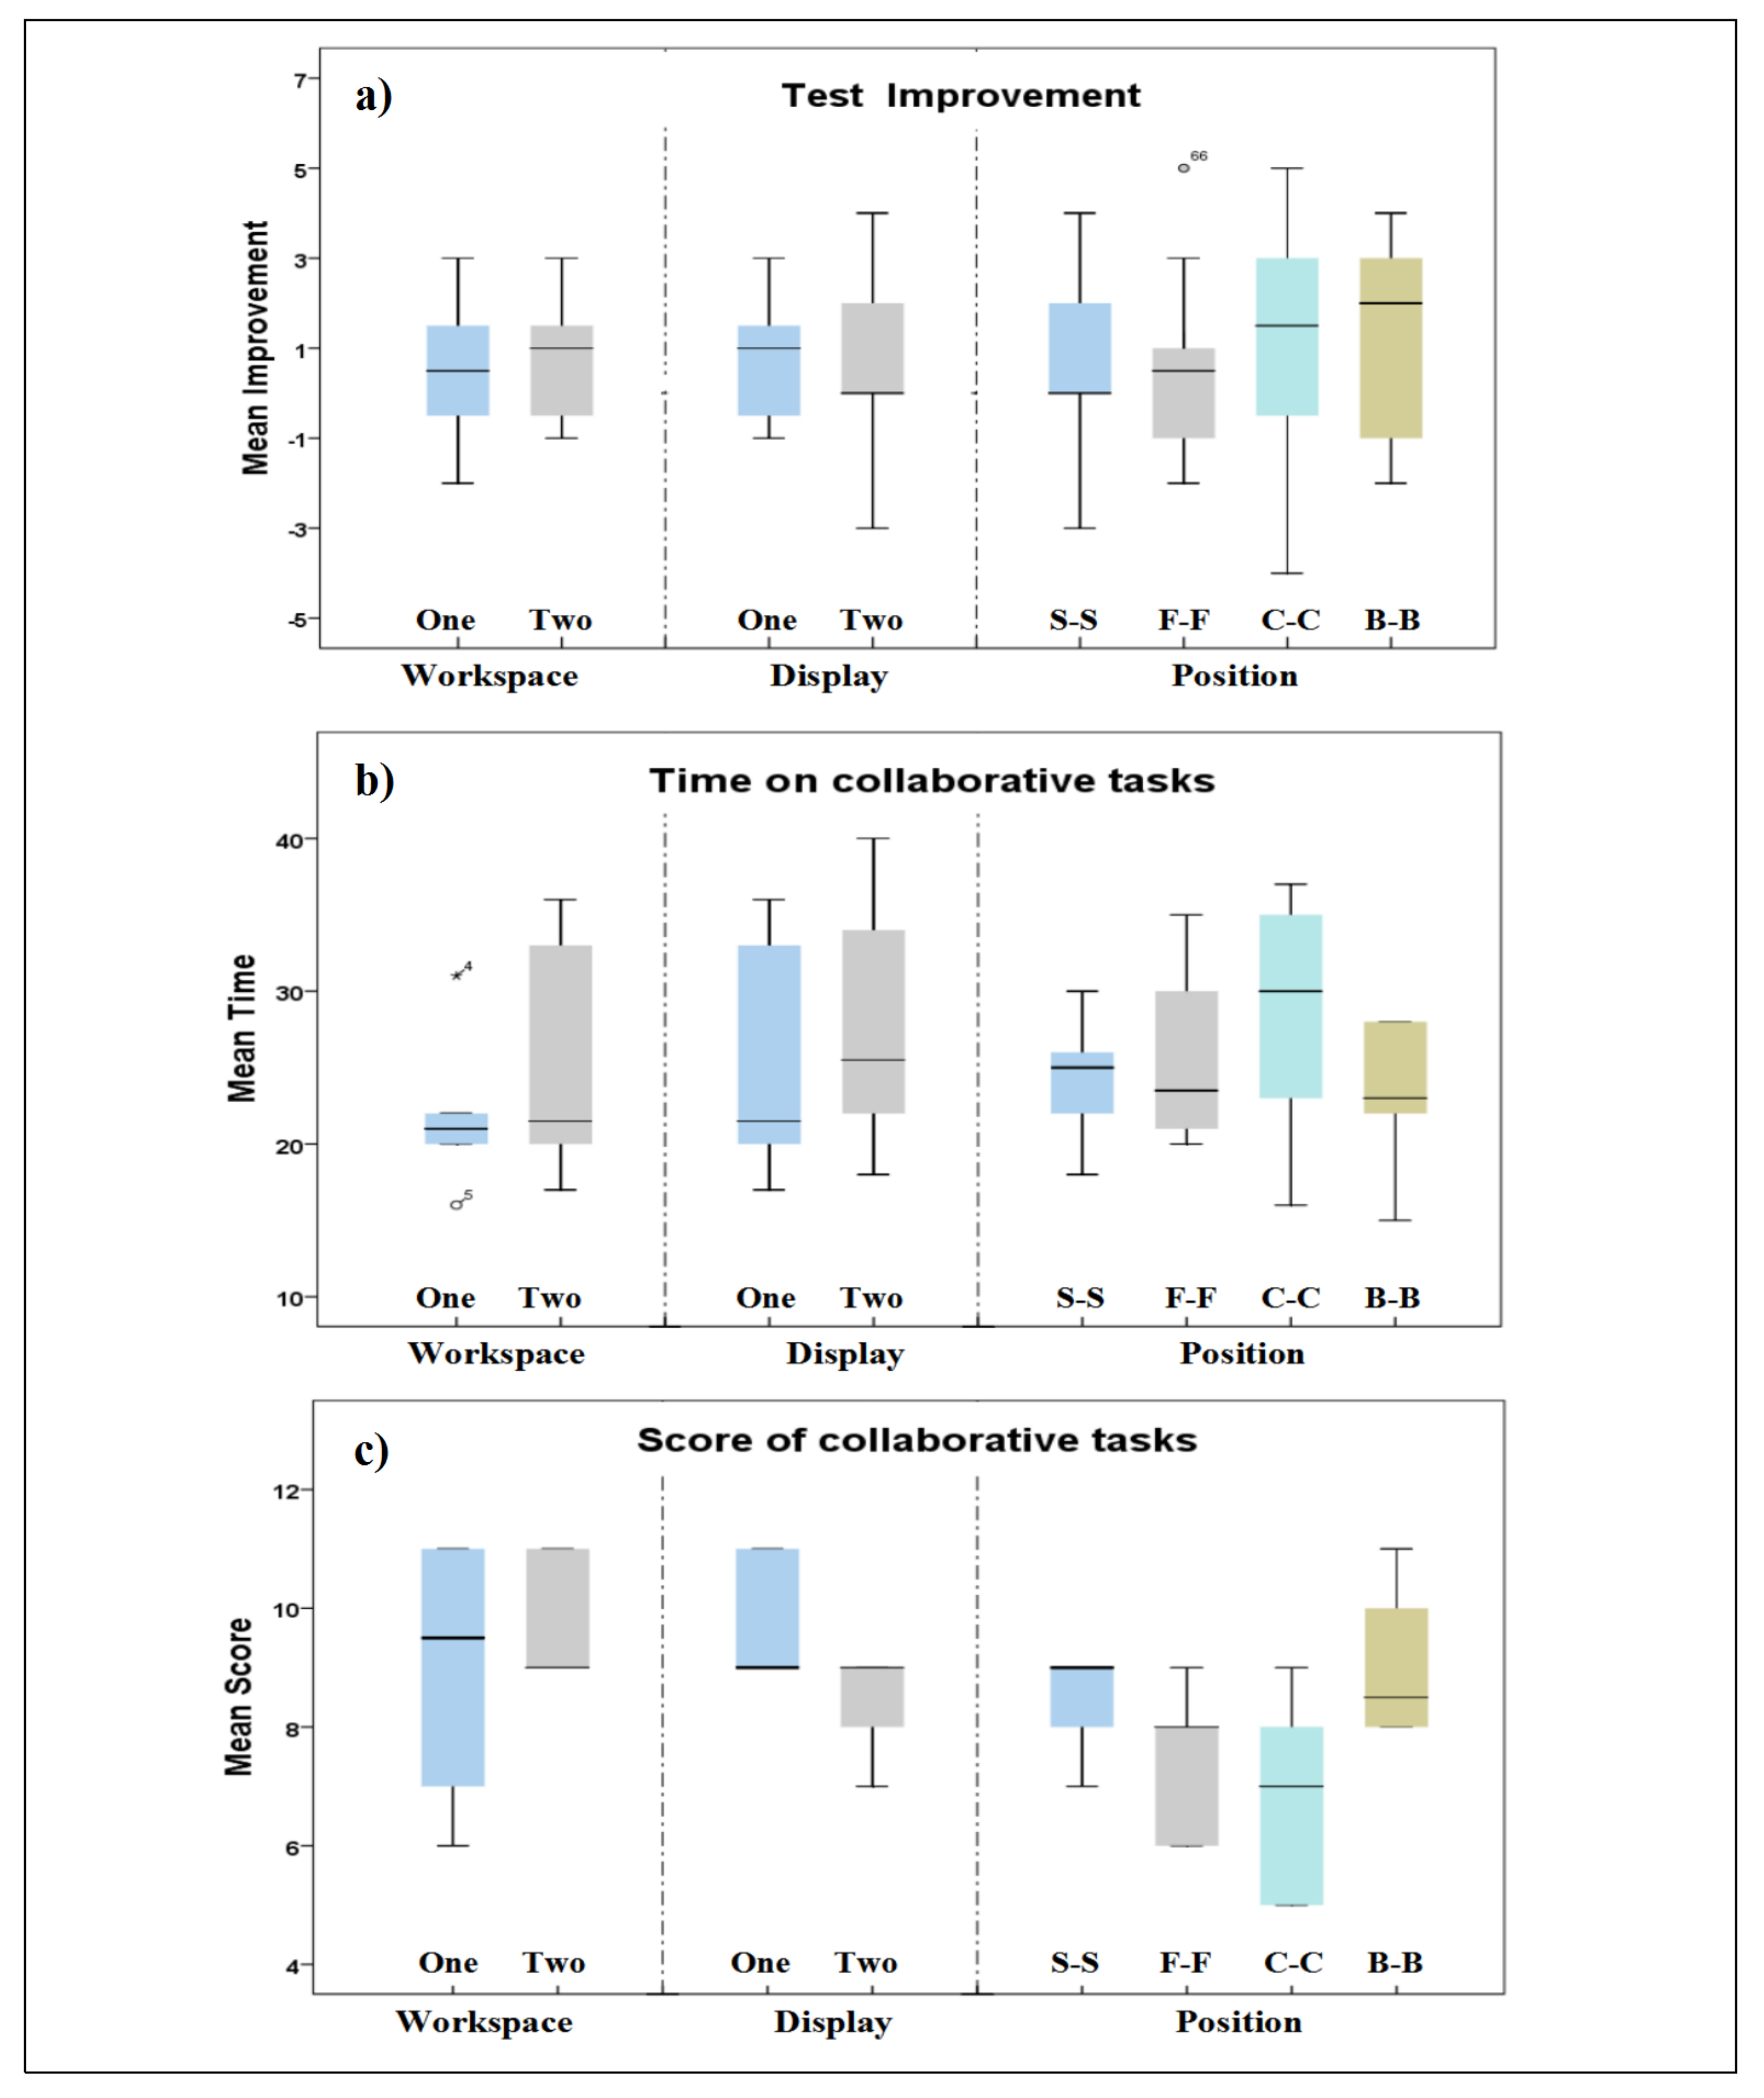
5.1. Pre- and Post-Experiment Test
5.2. Completion Time and Scores on Collaborative Tasks
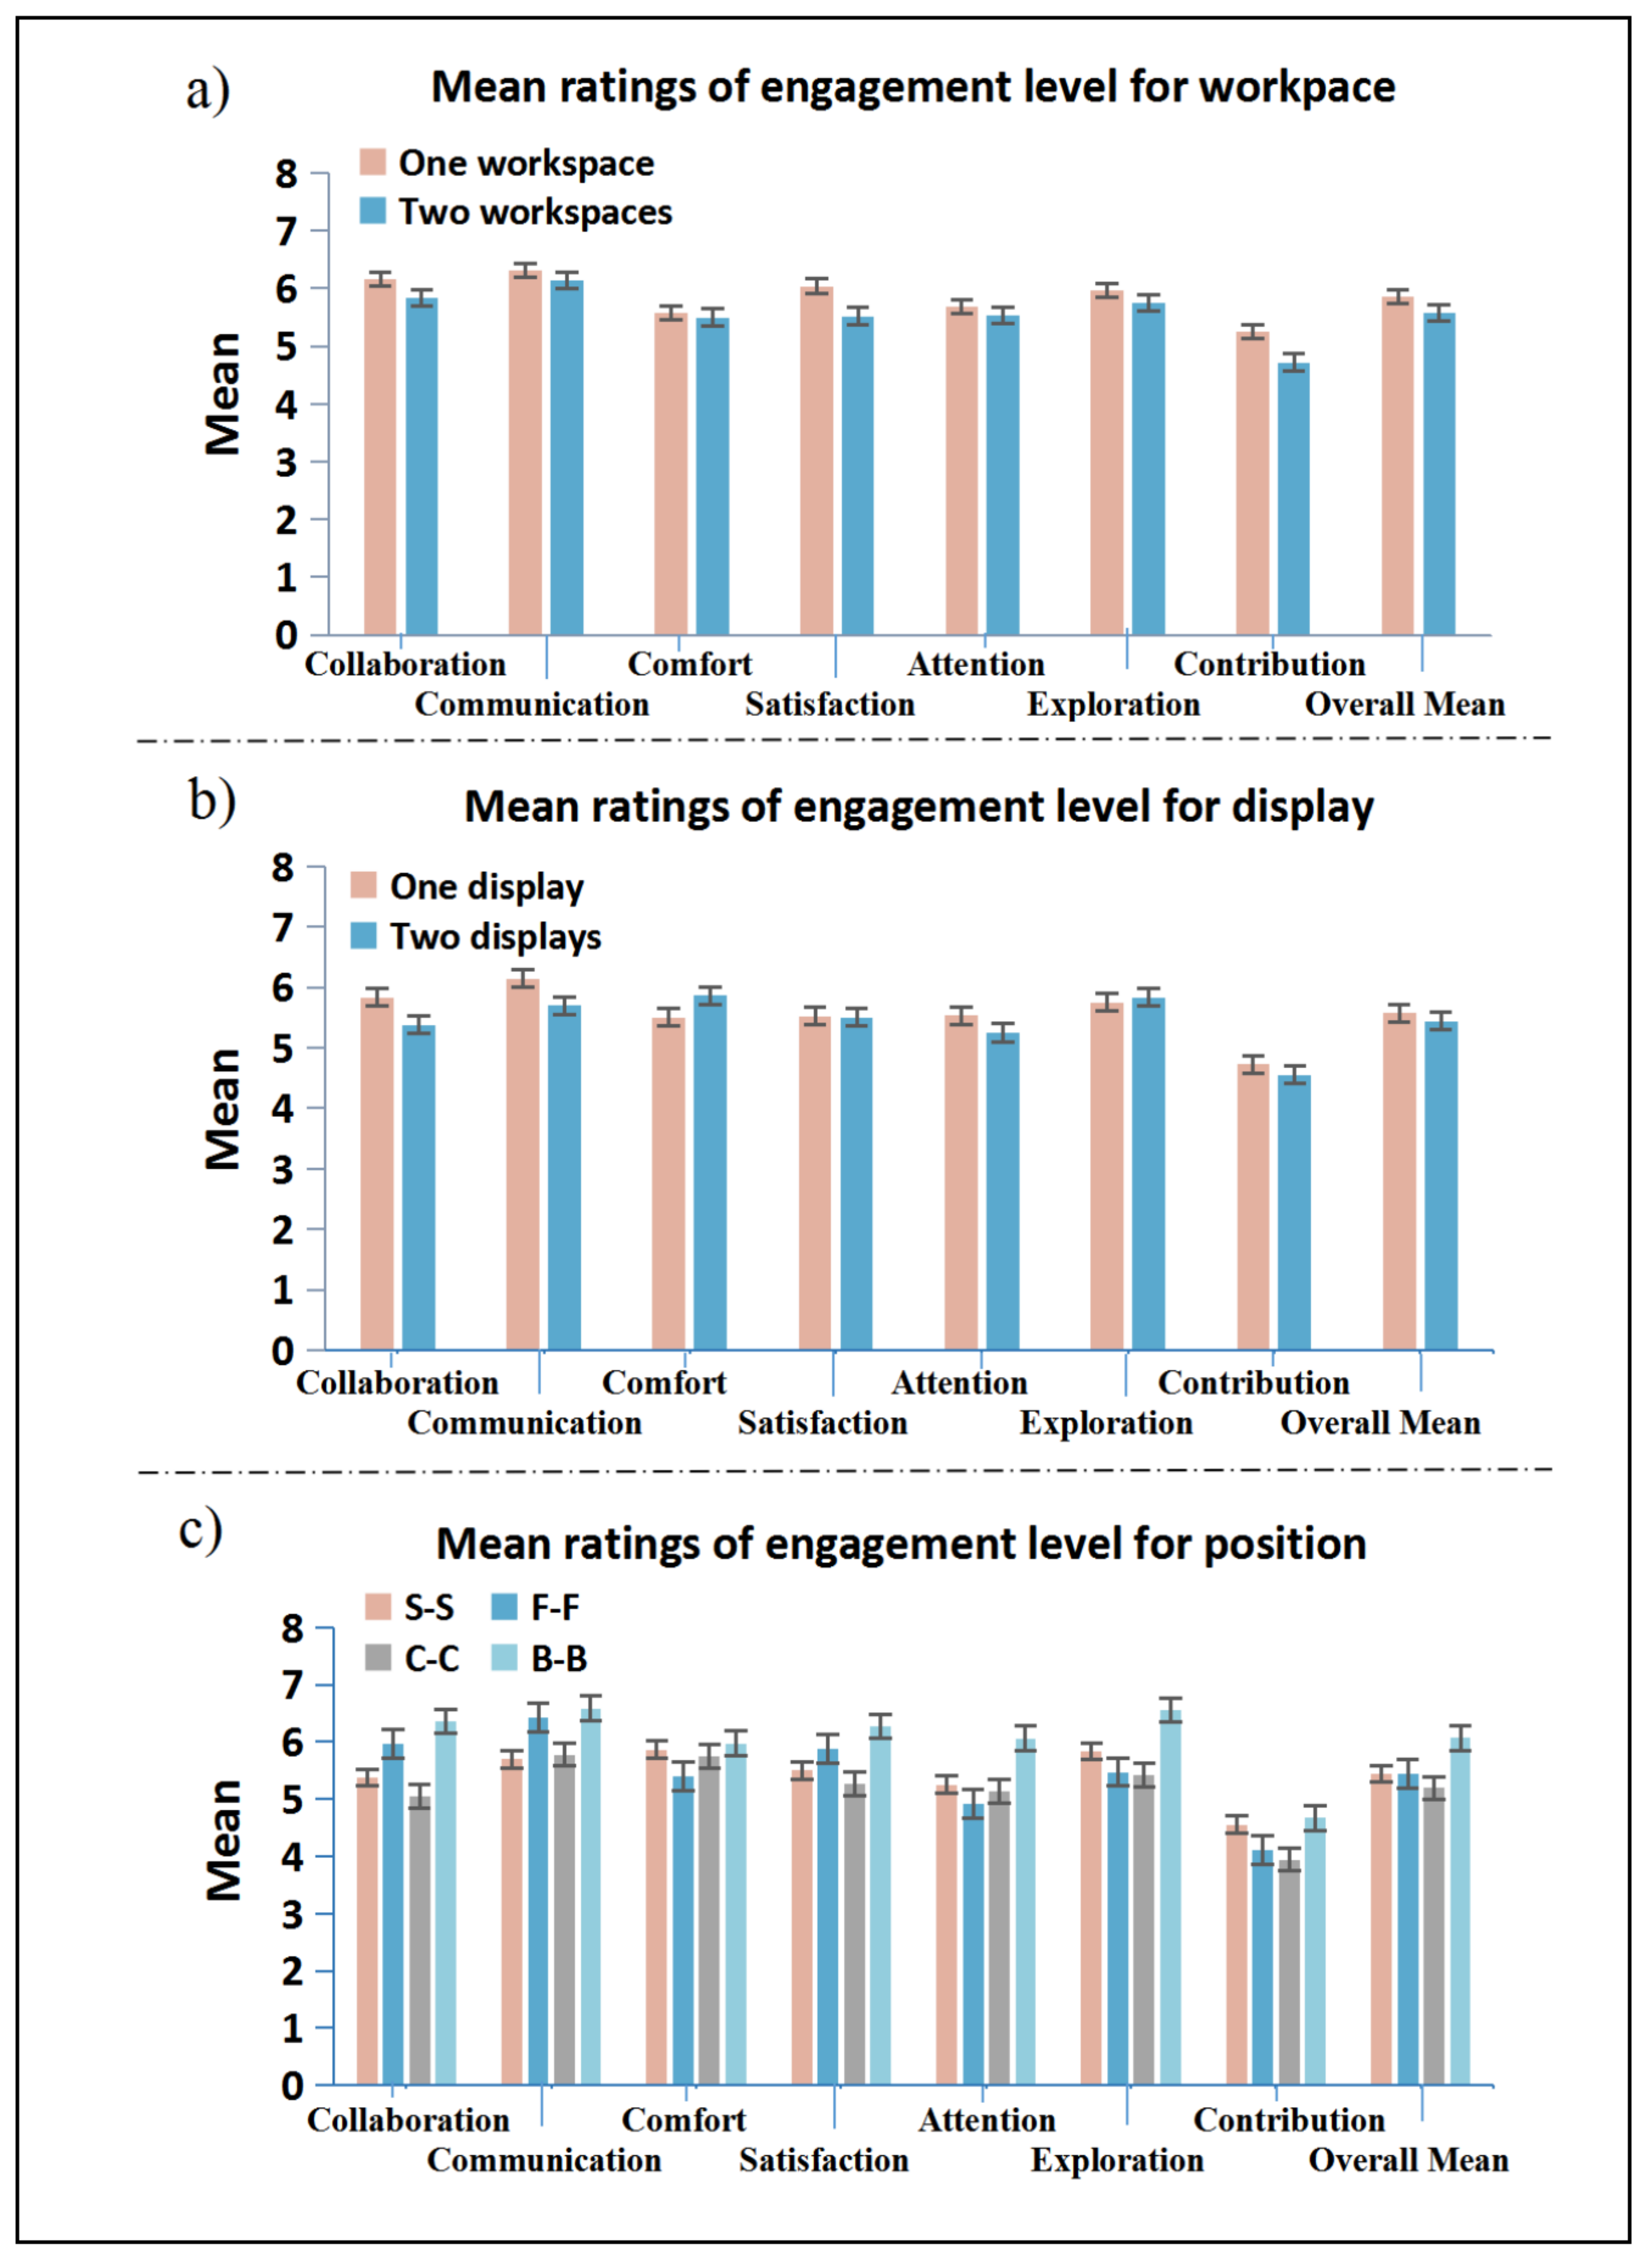
5.3. Perceived Engagement Levels during Collaboration
5.4. Participants’ Preference on Shared and Non-Shared View/Interaction
5.5. Subjective Feedback
6. Discussion
6.1. Workspace(s)
6.2. Display(s)
6.3. Position Arrangement(s)
6.4. Collaborative Modes and Behaviors
6.5. Recommendations
- When considering the number of workspaces to provide to users, if the goal is to improve learning efficiency and engagement level in collaborative tasks, sharing one workspace could be chosen to support such learning tasks. This could be beneficial for improving task efficiency in collaborative learning settings. However, if the goal is to support knowledge acquisition, using separate workspaces might be a better choice.
- When considering the number of displays to provide to users, allowing multiple users (e.g., as the pairs in our study) to have a shared display would lead to better learning outcomes and engagement level rather than providing multiple separate displays during collaboration.
- When considering the position arrangements to give to users, the Back-to-Back position would provide them with higher performance and engagement levels on collaborative learning tasks. Instead, the corner-to-corner position might be not beneficial in this type of scenario.
- When considering the collaborative modes (shared and non-shared interactions), it is useful to provide a function for allowing users to freely choose whether to share or not to share the view/control of their workspace during the collaboration process. Regardless of their position arrangements, it helps to enhance users’ engagement level and the exploration process considering visual information.
7. Limitations and Future Work
8. Conclusions
Author Contributions
Funding
Institutional Review Board Statement
Informed Consent Statement
Data Availability Statement
Conflicts of Interest
Abbreviations
| CSCL | Computer-supported collaborative learning |
| VR | Virtual Reality |
| AR | Augmented Reality |
| STM | Solid transition maps |
| S-S | Side-by-Side |
| F-F | Face-to-Face |
| C-C | Corner-to-Corner |
| B-B | Back-to-Back |
| M | mean |
| SD | standard deviation |
| SE | standard error |
| ANOVA | analysis of variance |
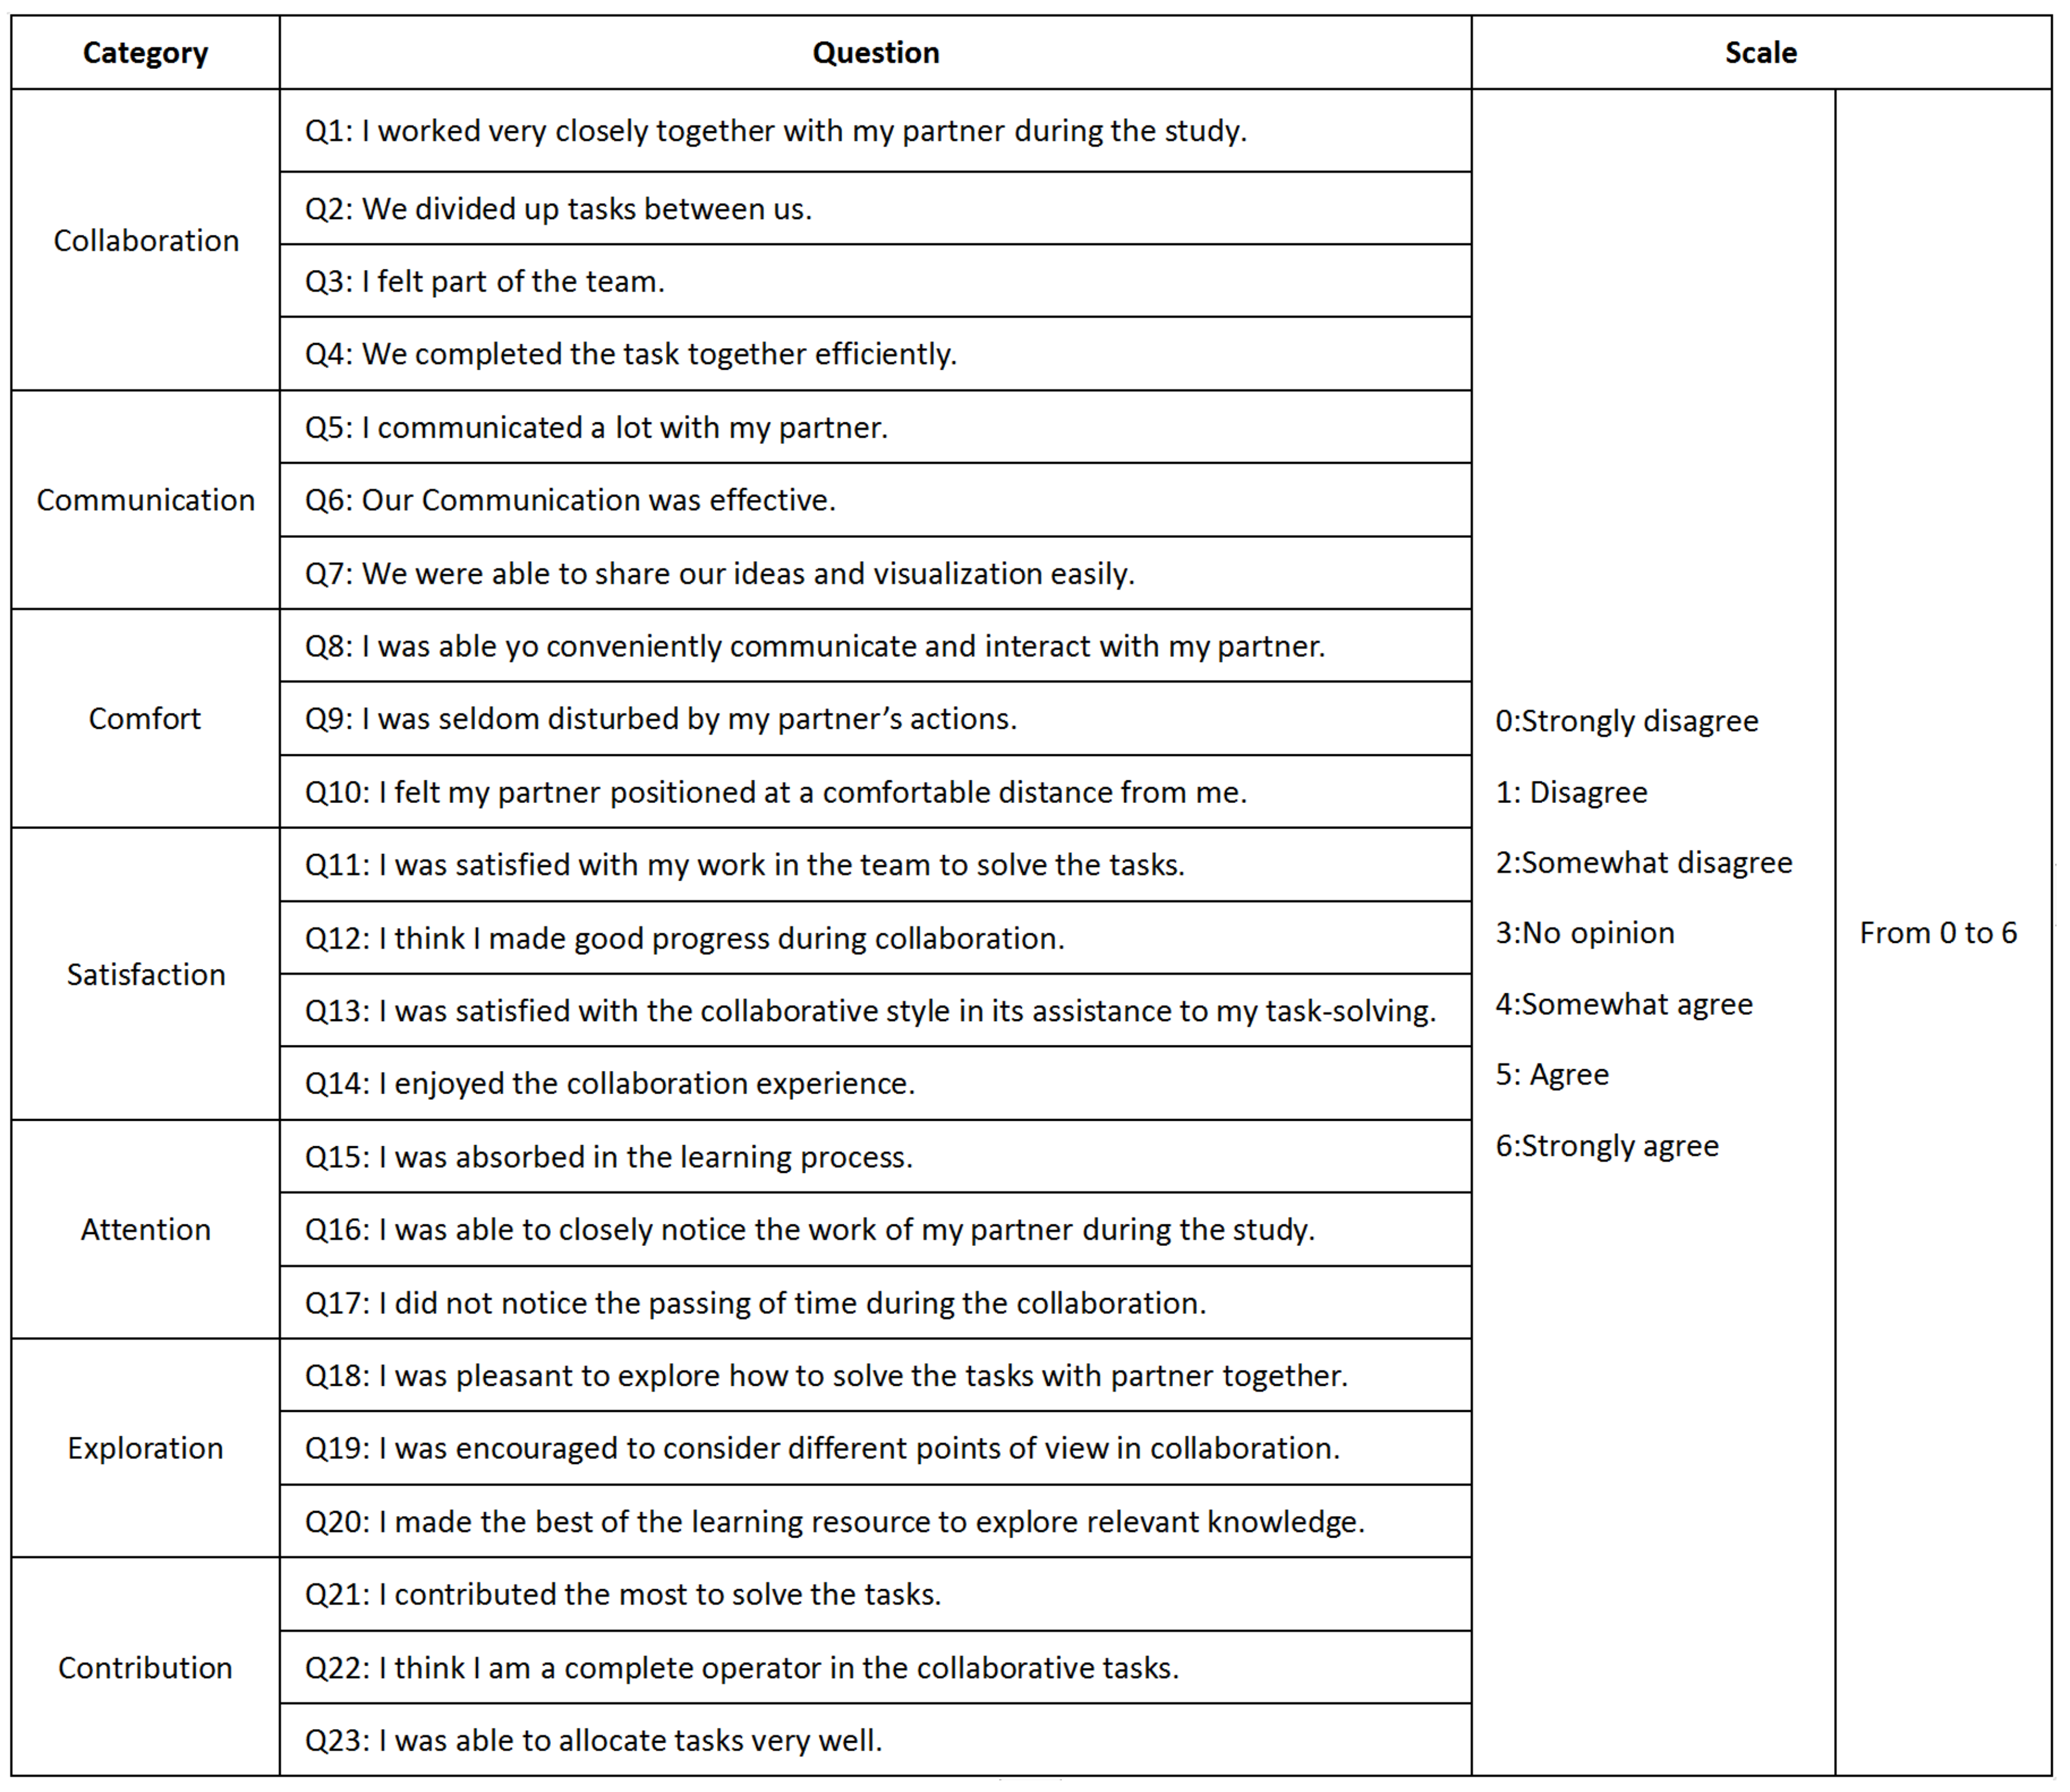
Appendix A. The User Engagement Questionnaire with 23 7-Scale Likert Questions

References
- Bruffee, K.A. Collaborative learning and the “conversation of mankind”. Coll. Engl. 1984, 46, 635–652. [Google Scholar] [CrossRef]
- Dillenbourg, P. What do You Mean by Collaborative Learning? In Collaborative Learning: Cognitive and Computational Approaches; Advances in Learning and Instruction Series; Elsevier Science: Madison Square Station, NY, USA, 1999; pp. 1–19. [Google Scholar]
- Chen, L.; Liang, H.N.; Lu, F.; Wang, J.; Chen, W.; Yue, Y. Effect of Collaboration Mode and Position Arrangement on Immersive Analytics Tasks in Virtual Reality: A Pilot Study. Appl. Sci. 2021, 11, 10473. [Google Scholar] [CrossRef]
- Laal, M.; Ghodsi, S.M. Benefits of collaborative learning. Procedia-Soc. Behav. Sci. 2012, 31, 486–490. [Google Scholar] [CrossRef] [Green Version]
- Cen, L.; Ruta, D.; Powell, L.; Hirsch, B.; Ng, J. Quantitative approach to collaborative learning: Performance prediction, individual assessment, and group composition. Int. J. Comput.-Support. Collab. Learn. 2016, 11, 187–225. [Google Scholar] [CrossRef]
- Al-Rahmi, W.M.; Zeki, A.M. A model of using social media for collaborative learning to enhance learners’ performance on learning. J. King Saud Univ.-Comput. Inf. Sci. 2017, 29, 526–535. [Google Scholar] [CrossRef] [Green Version]
- Liang, H.N.; Lu, F.; Shi, Y.; Nanjappan, V.; Papangelis, K. Evaluating the effects of collaboration and competition in navigation tasks and spatial knowledge acquisition within virtual reality environments. Future Gener. Comput. Syst. 2019, 95, 855–866. [Google Scholar] [CrossRef]
- Zagermann, J.; Pfeil, U.; Rädle, R.; Jetter, H.C.; Klokmose, C.; Reiterer, H. When tablets meet tabletops: The effect of tabletop size on around-the-table collaboration with personal tablets. In Proceedings of the 2016 CHI Conference on Human Factors in Computing Systems, San Jose, CA, USA, 7–12 May 2016; pp. 5470–5481. [Google Scholar]
- Jakobsen, M.R.; Hornbæk, K. Up close and personal: Collaborative work on a high-resolution multitouch wall display. ACM Trans. Comput.-Hum. Interact. (TOCHI) 2014, 21, 1–34. [Google Scholar] [CrossRef]
- Chen, L.; Liu, Y.; Li, Y.; Yu, L.; Gao, B.; Caon, M.; Yue, Y.; Liang, H.N. Effect of visual cues on pointing tasks in co-located augmented reality collaboration. In Proceedings of the ACM Symposium on Spatial User Interaction (SUI), Online, 9–10 November 2021; pp. 1–12. [Google Scholar]
- Scott, S.D.; Grant, K.D.; Mandryk, R.L. System Guidelines for Co-Located, Collaborative Work on a Tabletop Display; ECSCW 2003; Springer: Berlin/Heidelberg, Germany, 2003; pp. 159–178. [Google Scholar]
- Vogt, K.; Bradel, L.; Andrews, C.; North, C.; Endert, A.; Hutchings, D. Co-located collaborative sensemaking on a large high-resolution display with multiple input devices. In IFIP Conference on Human-Computer Interaction; Springer: Berlin/Heidelberg, Germany, 2011; pp. 589–604. [Google Scholar]
- Paul, C.L.; Bradel, L. Size matters: The effects of interactive display size on interaction zone expectations. In Proceedings of the 2018 International Conference on Advanced Visual Interfaces—AVI’18, Castiglione della Pescaia, Grosseto, Italy, 29 May–1 June 2018; pp. 1–5. [Google Scholar]
- Kruger, R.; Carpendale, S.; Scott, S.D.; Greenberg, S. Roles of orientation in tabletop collaboration: Comprehension, coordination and communication. Comput. Support. Coop. Work (CSCW) 2004, 13, 501–537. [Google Scholar] [CrossRef] [Green Version]
- Alallah, F.; Jin, D.; Irani, P. OA-graphs: Orientation agnostic graphs for improving the legibility of charts on horizontal displays. In Proceedings of the ACM International Conference on Interactive Tabletops and Surfaces—ITS’10, Saarbrücken, Germany, 7–10 November 2010; pp. 211–220. [Google Scholar]
- Isenberg, P.; Fisher, D.; Paul, S.A.; Morris, M.R.; Inkpen, K.; Czerwinski, M. Co-located collaborative visual analytics around a tabletop display. IEEE Trans. Vis. Comput. Graph. 2011, 18, 689–702. [Google Scholar] [CrossRef] [PubMed] [Green Version]
- Liu, C.C.; Kao, L.C. Do handheld devices facilitate face-to-face collaboration? Handheld devices with large shared display groupware to facilitate group interactions. J. Comput. Assist. Learn. 2007, 23, 285–299. [Google Scholar] [CrossRef]
- Sinha, S.; Rogat, T.K.; Adams-Wiggins, K.R.; Hmelo-Silver, C.E. Collaborative group engagement in a computer-supported inquiry learning environment. Int. J. Comput.-Support. Collab. Learn. 2015, 10, 273–307. [Google Scholar] [CrossRef]
- Guillomía, M.A.; Artigas, J.I.; Falcó, J.L. Cognitive Accessibility and Support in Special Education. Sensors 2021, 21, 4871. [Google Scholar] [CrossRef] [PubMed]
- Praharaj, S.; Scheffel, M.; Schmitz, M.; Specht, M.; Drachsler, H. Towards automatic collaboration analytics for group speech data using learning analytics. Sensors 2021, 21, 3156. [Google Scholar] [CrossRef] [PubMed]
- Garcia-Sanjuan, F.; Jurdi, S.; Jaen, J.; Nacher, V. Evaluating a tactile and a tangible multi-tablet gamified quiz system for collaborative learning in primary education. Comput. Educ. 2018, 123, 65–84. [Google Scholar] [CrossRef]
- Chen, L.; Liang, H.N.; Lu, F.; Papangelis, K.; Man, K.L.; Yue, Y. Collaborative behavior, performance and engagement with visual analytics tasks using mobile devices. Hum.-Cent. Comput. Inf. Sci. 2020, 10, 1–24. [Google Scholar] [CrossRef]
- Tissenbaum, M.; Berland, M.; Lyons, L. DCLM framework: Understanding collaboration in open-ended tabletop learning environments. Int. J. Comput.-Support. Collab. Learn. 2017, 12, 35–64. [Google Scholar] [CrossRef]
- Cardoso, J.; Ribeiro, J.M. Tangible VR Book: Exploring the Design Space of Marker-Based Tangible Interfaces for Virtual Reality. Appl. Sci. 2021, 11, 1367. [Google Scholar] [CrossRef]
- Yotam, H.; Twersky, D. Distributed spatial Sensemaking on the augmented reality sandbox. Int. J. Comput.-Support. Collab. Learn. 2020, 15, 115–141. [Google Scholar]
- Czerwinski, M.; Robertson, G.; Meyers, B.; Smith, G.; Robbins, D.; Tan, D. Large display research overview. In Proceedings of the 2006 CHI Conference Extended Abstracts on Human Factors in Computing Systems—CHI EA, Montréal, QC, Canada, 22–27 April 2006; pp. 69–74. [Google Scholar]
- Butscher, S.; Hubenschmid, S.; Müller, J.; Fuchs, J.; Reiterer, H. Clusters, trends, and outliers: How immersive technologies can facilitate the collaborative analysis of multidimensional data. In Proceedings of the 2018 CHI Conference on Human Factors in Computing Systems—CHI’16, Montreal, QC, Canada, 21–26 April 2018; pp. 1–12. [Google Scholar]
- Sharma, K.; Leftheriotis, I.; Giannakos, M. Utilizing Interactive Surfaces to Enhance Learning, Collaboration and Engagement: Insights from Learners’ Gaze and Speech. Sensors 2020, 20, 1964. [Google Scholar] [CrossRef] [PubMed] [Green Version]
- Bradel, L.; Endert, A.; Koch, K.; Andrews, C.; North, C. Large high resolution displays for co-located collaborative sensemaking: Display usage and territoriality. Int. J. Hum.-Comput. Stud. 2013, 71, 1078–1088. [Google Scholar] [CrossRef]
- Wallace, J.R.; Scott, S.D.; MacGregor, C.G. Collaborative sensemaking on a digital tabletop and personal tablets: Prioritization, comparisons, and tableaux. In Proceedings of the SIGCHI Conference on Human Factors in Computing Systems—CHI’13, Paris, France, 27 April–2 May 2013; pp. 3345–3354. [Google Scholar]
- Bause, I.M.; Brich, I.R.; Wesslein, A.K.; Hesse, F.W. Using technological functions on a multi-touch table and their affordances to counteract biases and foster collaborative problem solving. Int. J. Comput.-Support. Collab. Learn. 2018, 13, 7–33. [Google Scholar] [CrossRef]
- Kharrufa, A.; Leat, D.; Olivier, P. Digital mysteries: Designing for learning at the tabletop. In Proceedings of the ACM International Conference on Interactive Tabletops and Surfaces—ITS’10, Saarbrücken, Germany, 7–10 November 2010; pp. 197–206. [Google Scholar]
- Antle, A.N.; Bevans, A.; Tanenbaum, T.J.; Seaborn, K.; Wang, S. Futura: Design for collaborative learning and game play on a multi-touch digital tabletop. In Proceedings of the Fifth International Conference on Tangible, Embedded, and Embodied Interaction—TEI’10, Cambridge, MA, USA, 24–27 January 2010; pp. 93–100. [Google Scholar]
- Schnaubert, L.; Bodemer, D. Providing different types of group awareness information to guide collaborative learning. Int. J. Comput.-Support. Collab. Learn. 2019, 14, 7–51. [Google Scholar] [CrossRef]
- Martinez-Maldonado, R. A handheld classroom dashboard: Teachers’ perspectives on the use of real-time collaborative learning analytics. Int. J. Comput.-Support. Collab. Learn. 2019, 14, 383–411. [Google Scholar] [CrossRef]
- Dillon, A.; Richardson, J.; McKnight, C. The effects of display size and text splitting on reading lengthy text from screen. Behav. Inf. Technol. 1990, 9, 215–227. [Google Scholar] [CrossRef]
- Bruijn, D.D.; Mul, S.D.; Oostendorp, H.V. The influence of screen size and text layout on the study of text. Behav. Inf. Technol. 1992, 11, 71–78. [Google Scholar] [CrossRef]
- Czerwinski, M.; Smith, G.; Regan, T.; Meyers, B.; Robertson, G.G.; Starkweather, G.K. Toward characterizing the productivity benefits of very large displays. Interact 2003, 3, 9–16. [Google Scholar]
- Mandryk, R.L.; Scott, S.D.; Inkpen, K.M. Display factors influencing co-located collaboration. Comference Suppl. ACM CSCW 2002, 2, 10. [Google Scholar]
- Strijbos, J.W. Assessment of (computer-supported) collaborative learning. IEEE Trans. Learn. Technol. 2010, 4, 59–73. [Google Scholar] [CrossRef] [Green Version]
- Bly, S.A. A use of drawing surfaces in different collaborative settings. In Proceedings of the 1988 ACM Conference on Computer-Supported Cooperative Work—CSCW’88, Portland, OR, USA, 26–28 September 1988; pp. 250–256. [Google Scholar]
- Inkpen, K.; Hawkey, K.; Kellar, M.; Mandryk, R.; Parker, K.; Reilly, D.; Scott, S.; Whalen, T. Exploring display factors that influence co-located collaboration: Angle, size, number, and user arrangement. Proc. HCI Int. 2005, 2005, 1–10. [Google Scholar]
- Hawkey, K.; Kellar, M.; Reilly, D.; Whalen, T.; Inkpen, K.M. The proximity factor: Impact of distance on co-located collaboration. In Proceedings of the 2005 International ACM SIGGROUP Conference on Supporting Group Work—CSCW’05, Banff, AB, Canada, 4–8 November 2005; pp. 31–40. [Google Scholar]
- Tang, A.; Tory, M.; Po, B.; Neumann, P.; Carpendale, S. Collaborative coupling over tabletop displays. In Proceedings of the SIGCHI Conference on Human Factors in Computing Systems—CHI’06, Montréal, QC, Canada, 22–27 April 2006; pp. 1181–1190. [Google Scholar]
- Liu, C.; Chapuis, O.; Beaudouin-Lafon, M.; Lecolinet, E. Shared interaction on a wall-sized display in a data manipulation task. In Proceedings of the 2016 CHI Conference on Human Factors in Computing Systems—CHI’16, San Jose, CA, USA, 7–12 May 2016; pp. 2075–2086. [Google Scholar]
- Ha, V.; Inkpen, K.M.; Mandryk, R.L.; Whalen, T. Direct intentions: The effects of input devices on collaboration around a tabletop display. In Proceedings of the First IEEE International Workshop on Horizontal Interactive Human-Computer Systems— ITS’06, Adelaide, Australia, 5–7 January 2006; pp. 177–184. [Google Scholar]
- Balakrishnan, A.D.; Fussell, S.R.; Kiesler, S. Do visualizations improve synchronous remote collaboration? In Proceedings of the SIGCHI Conference on Human Factors in Computing Systems—CHI’08, Florence, Italy, 5–10 April 2008; pp. 1227–1236. [Google Scholar]
- Greenberg, S. Sharing views and interactions with single-user applications. ACM SIGOIS Bull. 1990, 11, 227–237. [Google Scholar] [CrossRef]
- Isenberg, P.; Elmqvist, N.; Scholtz, J.; Cernea, D.; Ma, K.L.; Hagen, H. Collaborative visualization: Definition, challenges, and research agenda. Inf. Vis. 2011, 10, 310–326. [Google Scholar] [CrossRef] [Green Version]
- Huang, Z.; Zhu, Y.; Mao, X.; Su, T.; Fu, X.; Fei, G. coisTable: An Individual-and-Spatial-Aware Tabletop System for Co-located Collaboration. In Proceedings of the 2020 6th International Conference on Dependable Systems and Their Applications—DSA’20, Xi’an, China, 28–29 November 2020; pp. 91–99. [Google Scholar]
- Chung, H.; North, C. SAViL: Cross-display visual links for sensemaking in display ecologies. Pers. Ubiquitous Comput. 2018, 22, 409–431. [Google Scholar] [CrossRef]
- Kraut, R.E.; Gergle, D.; Fussell, S.R. The use of visual information in shared visual spaces: Informing the development of virtual co-presence. In Proceedings of the 2002 ACM Conference on Computer Supported Cooperative Work—CSCW’02, New Orleans, LA, USA, 16–20 November 2002; pp. 31–40. [Google Scholar]
- Larsen-Ledet, I.; Korsgaard, H. Territorial functioning in collaborative writing. Comput. Support. Coop. Work (CSCW) 2019, 28, 391–433. [Google Scholar] [CrossRef]
- Scott, S.D.; Carpendale, M.S.T.; Inkpen, K. Territoriality in collaborative tabletop workspaces. In Proceedings of the 2004 ACM Conference on Computer Supported Cooperative Work—CSCW’04, Chicago, IL, USA, 6–10 November 2004; pp. 294–303. [Google Scholar]
- Xu, Y.; Wang, L.; Xu, Y.; Qiu, S.; Xu, M.; Meng, X. Cross-device task interaction framework between the smart watch and the smart phone. Pers. Ubiquitous Comput. 2019, 25, 1039–1049. [Google Scholar] [CrossRef]
- Russell, D.M.; Drews, C.; Sue, A. Social aspects of using large public interactive displays for collaboration. In International Conference on Ubiquitous Computing; Springer: Berlin/Heidelberg, Germany, 2002; pp. 229–236. [Google Scholar]
- Russell, D.M. Large interactive public displays: Use patterns, support patterns, community patterns. In Public, Community and Situated Displays; Springer: Dordrecht, The Netherlands, 2003; pp. 3–17. [Google Scholar]
- Phelps, E.; Damon, W. Problem solving with equals: Peer collaboration as a context for learning mathematics and spatial concepts. J. Educ. Psychol. 1989, 81, 639. [Google Scholar] [CrossRef]
- Liang, H.N.; Sedig, K. Can interactive visualization tools engage and support pre-university students in exploring non-trivial mathematical concepts? Comput. Educ. 2010, 54, 972–991. [Google Scholar] [CrossRef]
- Sedig, K.; Liang, H.N. Learner-information interaction: A macro-level framework characterizing visual cognitive tools. J. Interact. Learn. Res. 2008, 19, 147–173. [Google Scholar]
- Liang, H.N.; Sedig, K. Role of interaction in enhancing the epistemic utility of 3D mathematical visualizations. Int. J. Comput. Math. Learn. 2010, 15, 191–224. [Google Scholar] [CrossRef]
- Lu, F.; Yu, D.; Liang, H.N.; Chen, W.; Papangelis, K.; Ali, N.M. Evaluating Engagement Level and Analytical Support of Interactive Visualizations in Virtual Reality Environments. In Proceedings of the 2018 IEEE International Symposium on Mixed and Augmented Reality—ISMAR’18, Munich, Germany, 16–20 October 2018; pp. 143–152. [Google Scholar] [CrossRef]
- Unity. Unity Real-Time Development Platform|3D, 2D VR & AR Engine. Available online: https://unity.com/ (accessed on 18 November 2021).
- Sedig, K.; Rowhani, S.; Liang, H.N. Designing interfaces that support formation of cognitive maps of transitional processes: An empirical study. Interact. Comput. 2005, 17, 419–452. [Google Scholar] [CrossRef]
- Ballas, J.A.; Heitmeyer, C.L.; Pérez-Quiñones, M.A. Evaluating two aspects of direct manipulation in advanced cockpits. In Proceedings of the SIGCHI Conference on Human Factors in Computing Systems—CHI’92, Monterey, CA, USA, 3–7 May 1992; pp. 127–134. [Google Scholar]
- Sedig, K.; Parsons, P.; Liang, H.N.; Morey, J. Supporting sensemaking of complex objects with visualizations: Visibility and complementarity of interactions. Informatics 2016, 3, 20. [Google Scholar] [CrossRef] [Green Version]
- Sedig, K.; Liang, H.N. Interactivity of Visual Mathematical Representations: Factors Affecting Learning and Cognitive Processes. J. Interact. Learn. Res. 2006, 17, 179–212. [Google Scholar]
- Roberts, J.C. State of the art: Coordinated & multiple views in exploratory visualization. In Proceedings of the Fifth International Conference on Coordinated and Multiple Views in Exploratory Visualization—CMV’07, Zurich, Switzerland, 2 July 2007; pp. 61–71. [Google Scholar]
- Carini, R.M.; Kuh, G.D.; Klein, S.P. Student engagement and student learning: Testing the linkages. Res. High. Educ. 2006, 47, 1–32. [Google Scholar] [CrossRef]
- Christenson, S.L.; Reschly, A.L.; Wylie, C. Handbook of Research on Student Engagement; Springer Science & Business Media: Berlin/Heidelberg, Germany, 2012. [Google Scholar]
- Hung, Y.H.; Parsons, P. Assessing user engagement in information visualization. In Proceedings of the 2017 CHI Conference Extended Abstracts on Human Factors in Computing Systems—CHI’17, Denver, CO, USA, 6–11 May 2017; pp. 1708–1717. [Google Scholar]
- Wallace, J.R.; Iskander, N.; Lank, E. Creating your bubble: Personal space on and around large public displays. In Proceedings of the 2016 CHI Conference on Human Factors in Computing Systems—CHI’16, San Jose, CA, USA, 7–12 May 2016; pp. 2087–2092. [Google Scholar]
- Buisine, S.; Besacier, G.; Aoussat, A.; Vernier, F. How do interactive tabletop systems influence collaboration? Comput. Hum. Behav. 2012, 28, 49–59. [Google Scholar] [CrossRef] [Green Version]
- Chan, C.K.; Chan, Y.Y. Students’ views of collaboration and online participation in Knowledge Forum. Comput. Educ. 2011, 57, 1445–1457. [Google Scholar] [CrossRef]
- O’hara, K.; Sellen, A. A comparison of reading paper and on-line documents. In Proceedings of the ACM SIGCHI Conference on Human Factors in Computing Systems—CHI’97, Atlanta, GA, USA, 22–27 May 1997; pp. 335–342. [Google Scholar]
- Rodden, T.; Rogers, Y.; Halloran, J.; Taylor, I. Designing novel interactional workspaces to support face to face consultations. In Proceedings of the SIGCHI Conference on Human Factors in Computing Systems—CHI’03, Fort Lauderdale, FL, USA, 5–10 April 2003; pp. 57–64. [Google Scholar]
- Martikainen, S.; Wikström, V.; Falcon, M.; Saarikivi, K. Collaboration face-to-face and in virtual reality-Empathy, social closeness, and task load. In Proceedings of the Conference Companion Publication of the 2019 on Computer Supported Cooperative Work and Social Computing, Kunming, China, 16–18 August 2019; pp. 299–303. [Google Scholar]
- Ens, B.; Lanir, J.; Tang, A.; Bateman, S.; Lee, G.; Piumsomboon, T.; Billinghurst, M. Revisiting collaboration through mixed reality: The evolution of groupware. Int. J. Hum.-Comput. Stud. 2019, 131, 81–98. [Google Scholar] [CrossRef]
- Yu, D.; Liang, H.N.; Lu, X.; Fan, K.; Ens, B. Modeling Endpoint Distribution of Pointing Selection Tasks in Virtual Reality Environments. ACM Trans. Graph. (TOG) 2019, 38, 1–13. [Google Scholar] [CrossRef] [Green Version]
- Xu, W.; Liang, H.N.; Chen, Y.; Li, X.; Yu, K. Exploring Visual Techniques for Boundary Awareness During Interaction in Augmented Reality Head-Mounted Displays. In Proceedings of the 2020 IEEE Conference on Virtual Reality and 3D User Interfaces—VR’20, Atlanta, GA, USA, 27 March–1 April 2020; pp. 204–211. [Google Scholar]
- Nanjappan, V.; Liang, H.N.; Lu, F.; Papangelis, K.; Yue, Y.; Man, K. User-elicited dual-hand interactions for manipulating 3D objects in virtual reality environments. Hum. Cent. Comput. Inf. Sci. 2018, 8, 1–16. [Google Scholar] [CrossRef]
- Yu, D.; Lu, X.; Shi, R.; Liang, H.N.; Dingler, T.; Velloso, E.; Goncalves, J. Gaze-Supported 3D Object Manipulation in Virtual Reality. In Proceedings of the 2021 CHI Conference on Human Factors in Computing Systems—CHI’21, Online, 8–13 May 2021; pp. 1–13. [Google Scholar]
- Monteiro, D.; Liang, H.N.; Wang, X.; Xu, W.; Tu, H. Design and Development of a Low-Cost Device for Weight and Center of Gravity Simulation in Virtual Reality. In Proceedings of the 2021 International Conference on Multimodal Interaction—ICMI’21, Montréal, QC, Canada, 18–22 October 2021; pp. 453–460. [Google Scholar]
- Liang, H.N.; Williams, C.; Semegen, M.; Stuerzlinger, W.; Irani, P. User-Defined Surface+motion Gestures for 3d Manipulation of Objects at a Distance through a Mobile Device. In Proceedings of the 10th Asia Pacific Conference on Computer Human Interaction—APCHI’12, Matsue-City, Japan, 28–31 August 2012; pp. 299–308. [Google Scholar]
- Liang, H.N.; Williams, C.; Semegen, M.; Stuerzlinger, W.; Irani, P. An investigation of suitable interactions for 3D manipulation of distant objects through a mobile device. Int. J. Innov. Comput. Inf. Control 2013, 9, 4737–4752. [Google Scholar]


| Display | Workspace | Position | Participants |
|---|---|---|---|
| 1 | 1 | S-S | 12 (6 pairs) |
| 2 | S-S | 12 (6 pairs) | |
| 2 | 2 | S-S | 12 (6 pairs) |
| 2 | F-F | 12 (6 pairs) | |
| 2 | C-C | 12 (6 pairs) | |
| 2 | B-B | 12 (6 pairs) |
| Measurement | Variable | Key Results | p-Value (ANOVA) | ||
|---|---|---|---|---|---|
| Workspace | Display | Position | |||
| Performance metrics | Test improvement | – | insig. | insig. | insig. |
| Time on collaborative tasks | * One single display might be useful than multiple displays for improving learning outcomes during collaboration (P = 0.047). * B-B got higher scores than C-C (P = 0.045). | insig. | 0.047 | 0.032 | |
| Score on collaborative tasks | – | insig. | insig. | insig. | |
| Subjective surveys | Engagement level | * B-B is better than C-C (P = 0.041). | insig. | insig. | 0.044 |
| - Collaboration | * B-B is better than C-C (P = 0.012). | insig. | insig. | 0.009 | |
| - Satisfaction | * One shared workspace might be more satisfactory than separate workspaces (P = 0.066). * B-B is better than C-C (P = 0.042). | 0.066 | insig. | 0.037 | |
| - Exploration | * B-B is better than C-C (P = 0.025). * B-B is better than F-F (P = 0.038). | insig. | insig. | 0.016 | |
| - Communication | – | insig. | insig. | insig. | |
| - Comfort | – | insig. | insig. | insig. | |
| - Attention | – | insig. | insig. | 0.054 | |
| - Contribution | – | insig. | insig. | insig. | |
| User preference | Position arrangement | * B-B (38.33%) was the most popular choice. | – | – | – |
| Collaborative mode | * More participants preferred switching between the two modes (53%). * Shared mode was preferred choice (60%). | – | – | – | |
| Variables | Time/mins | Score/Points | |
|---|---|---|---|
| Workspace | One | M = 21.833, SD = 4.997, SE = 2.040 | M = 9.00, SD = 2.098, SE = 0.856 |
| Two | M = 24.500, SD = 7.176, SE = 2.930 | M = 9.67, SD = 1.033, SE = 0.422 | |
| Display | One | M = 24.833, SD = 7.731, SE = 3.156 | M = 9.667, SD = 1.033, SE = 0.422 |
| Two | M = 27.500, SD = 8.093, SE = 3.304 | M = 8.500, SD = 0.837, SE = 0.342 | |
| Position | S-S | M = 24.333, SD = 3.033, SE = 1.647 | M = 8.500, SD = 0.837, SE = 0.342 |
| F-F | M = 25.500, SD = 3.891, SE = 2.405 | M = 7.500, SD = 1.225, SE = 0.500 | |
| C-C | M = 28.500, SD = 4.432, SE = 2.442 | M = 6.833, SD = 1.602, SE = 0.654 | |
| B-B | M = 23.167, SD = 2.834, SE = 1.977 | M = 9.000, SD = 1.265, SE = 0.298 | |
| Condition | S Mode | NS Mode | NSS Mode | SNS Mode |
|---|---|---|---|---|
| One display with one workspace (S-S) | - | - | - | - |
| One display with two workspaces (S-S) | 0 | 4 | 2 | 0 |
| Two displays with separate workspace (S-S) | 0 | 1 | 3 | 2 |
| Two displays with separate workspace (F-F) | 2 | 0 | 1 | 3 |
| Two displays with separate workspace (C-C) | 3 | 0 | 1 | 2 |
| Two displays with separate workspace (B-B) | 4 | 0 | 0 | 2 |
| Overall | 9 | 5 | 7 | 9 |
| 14 | 16 | |||
Publisher’s Note: MDPI stays neutral with regard to jurisdictional claims in published maps and institutional affiliations. |
© 2021 by the authors. Licensee MDPI, Basel, Switzerland. This article is an open access article distributed under the terms and conditions of the Creative Commons Attribution (CC BY) license (https://creativecommons.org/licenses/by/4.0/).
Share and Cite
Chen, L.; Liang, H.-N.; Wang, J.; Qu, Y.; Yue, Y. On the Use of Large Interactive Displays to Support Collaborative Engagement and Visual Exploratory Tasks. Sensors 2021, 21, 8403. https://doi.org/10.3390/s21248403
Chen L, Liang H-N, Wang J, Qu Y, Yue Y. On the Use of Large Interactive Displays to Support Collaborative Engagement and Visual Exploratory Tasks. Sensors. 2021; 21(24):8403. https://doi.org/10.3390/s21248403
Chicago/Turabian StyleChen, Lei, Hai-Ning Liang, Jialin Wang, Yuanying Qu, and Yong Yue. 2021. "On the Use of Large Interactive Displays to Support Collaborative Engagement and Visual Exploratory Tasks" Sensors 21, no. 24: 8403. https://doi.org/10.3390/s21248403
APA StyleChen, L., Liang, H.-N., Wang, J., Qu, Y., & Yue, Y. (2021). On the Use of Large Interactive Displays to Support Collaborative Engagement and Visual Exploratory Tasks. Sensors, 21(24), 8403. https://doi.org/10.3390/s21248403