
A Review of Data Gathering Methods for Evaluating Socially Assistive Systems

 ,
,  , ,
, ,
Abstract
1. Introduction
2. Method
2.1. Data Collection
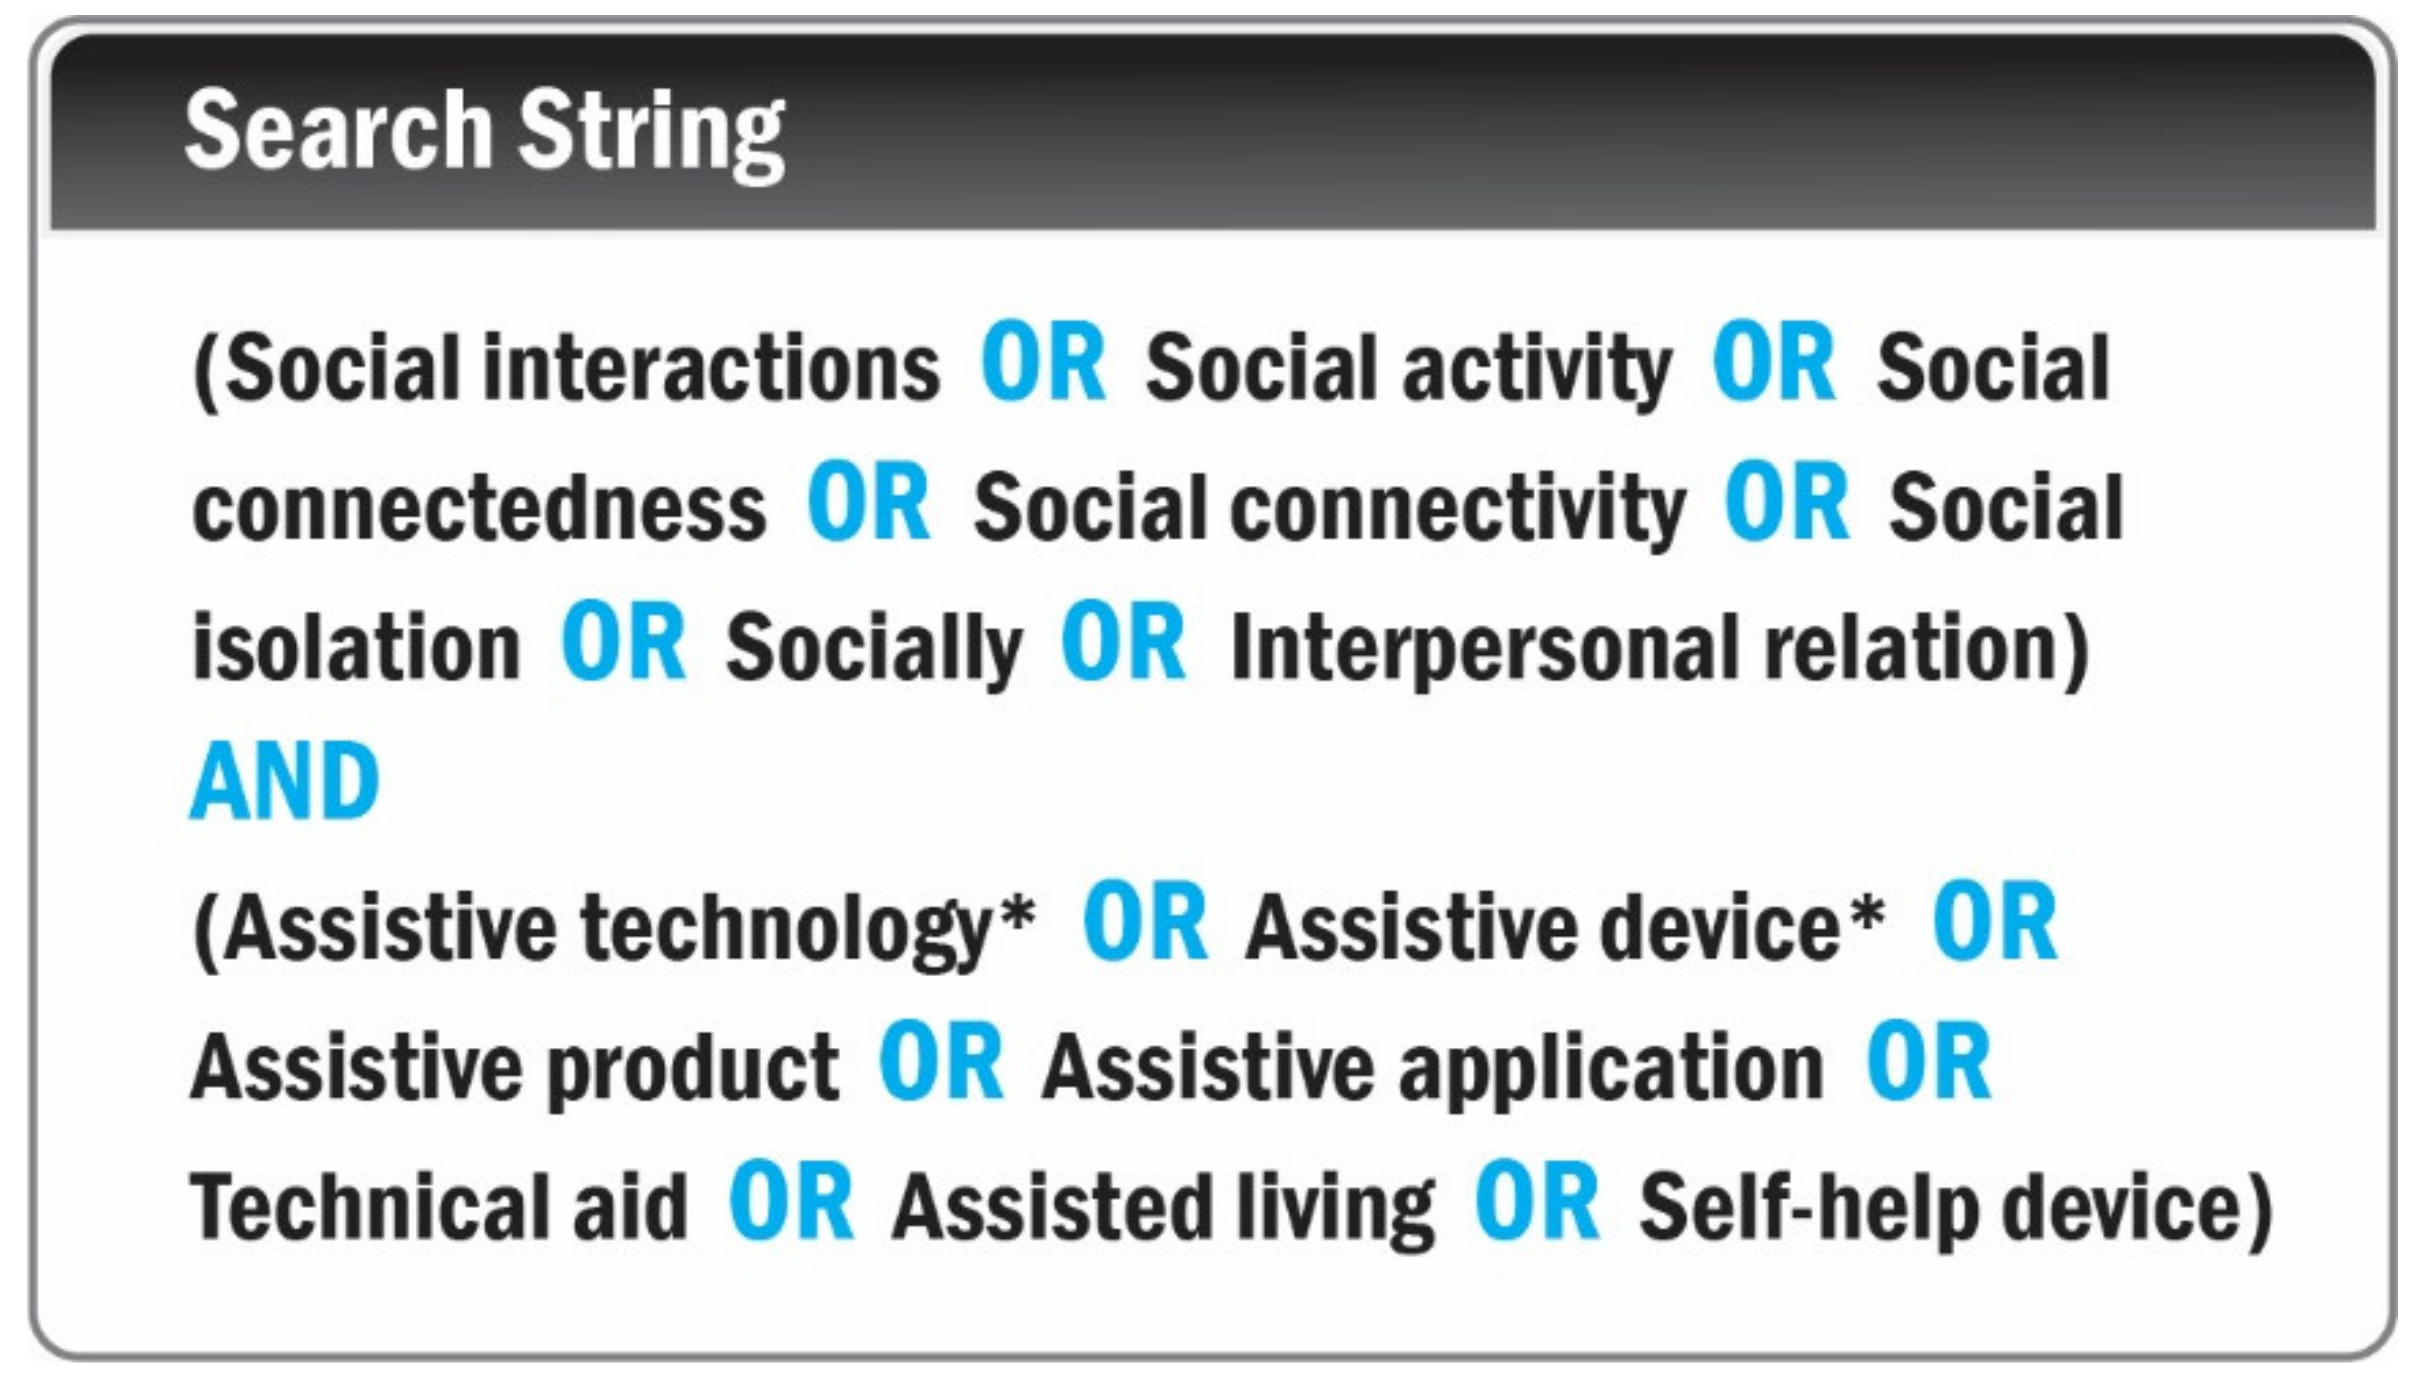
2.1.1. Search Terms
2.1.2. Databases Searched
2.2. Article Selection
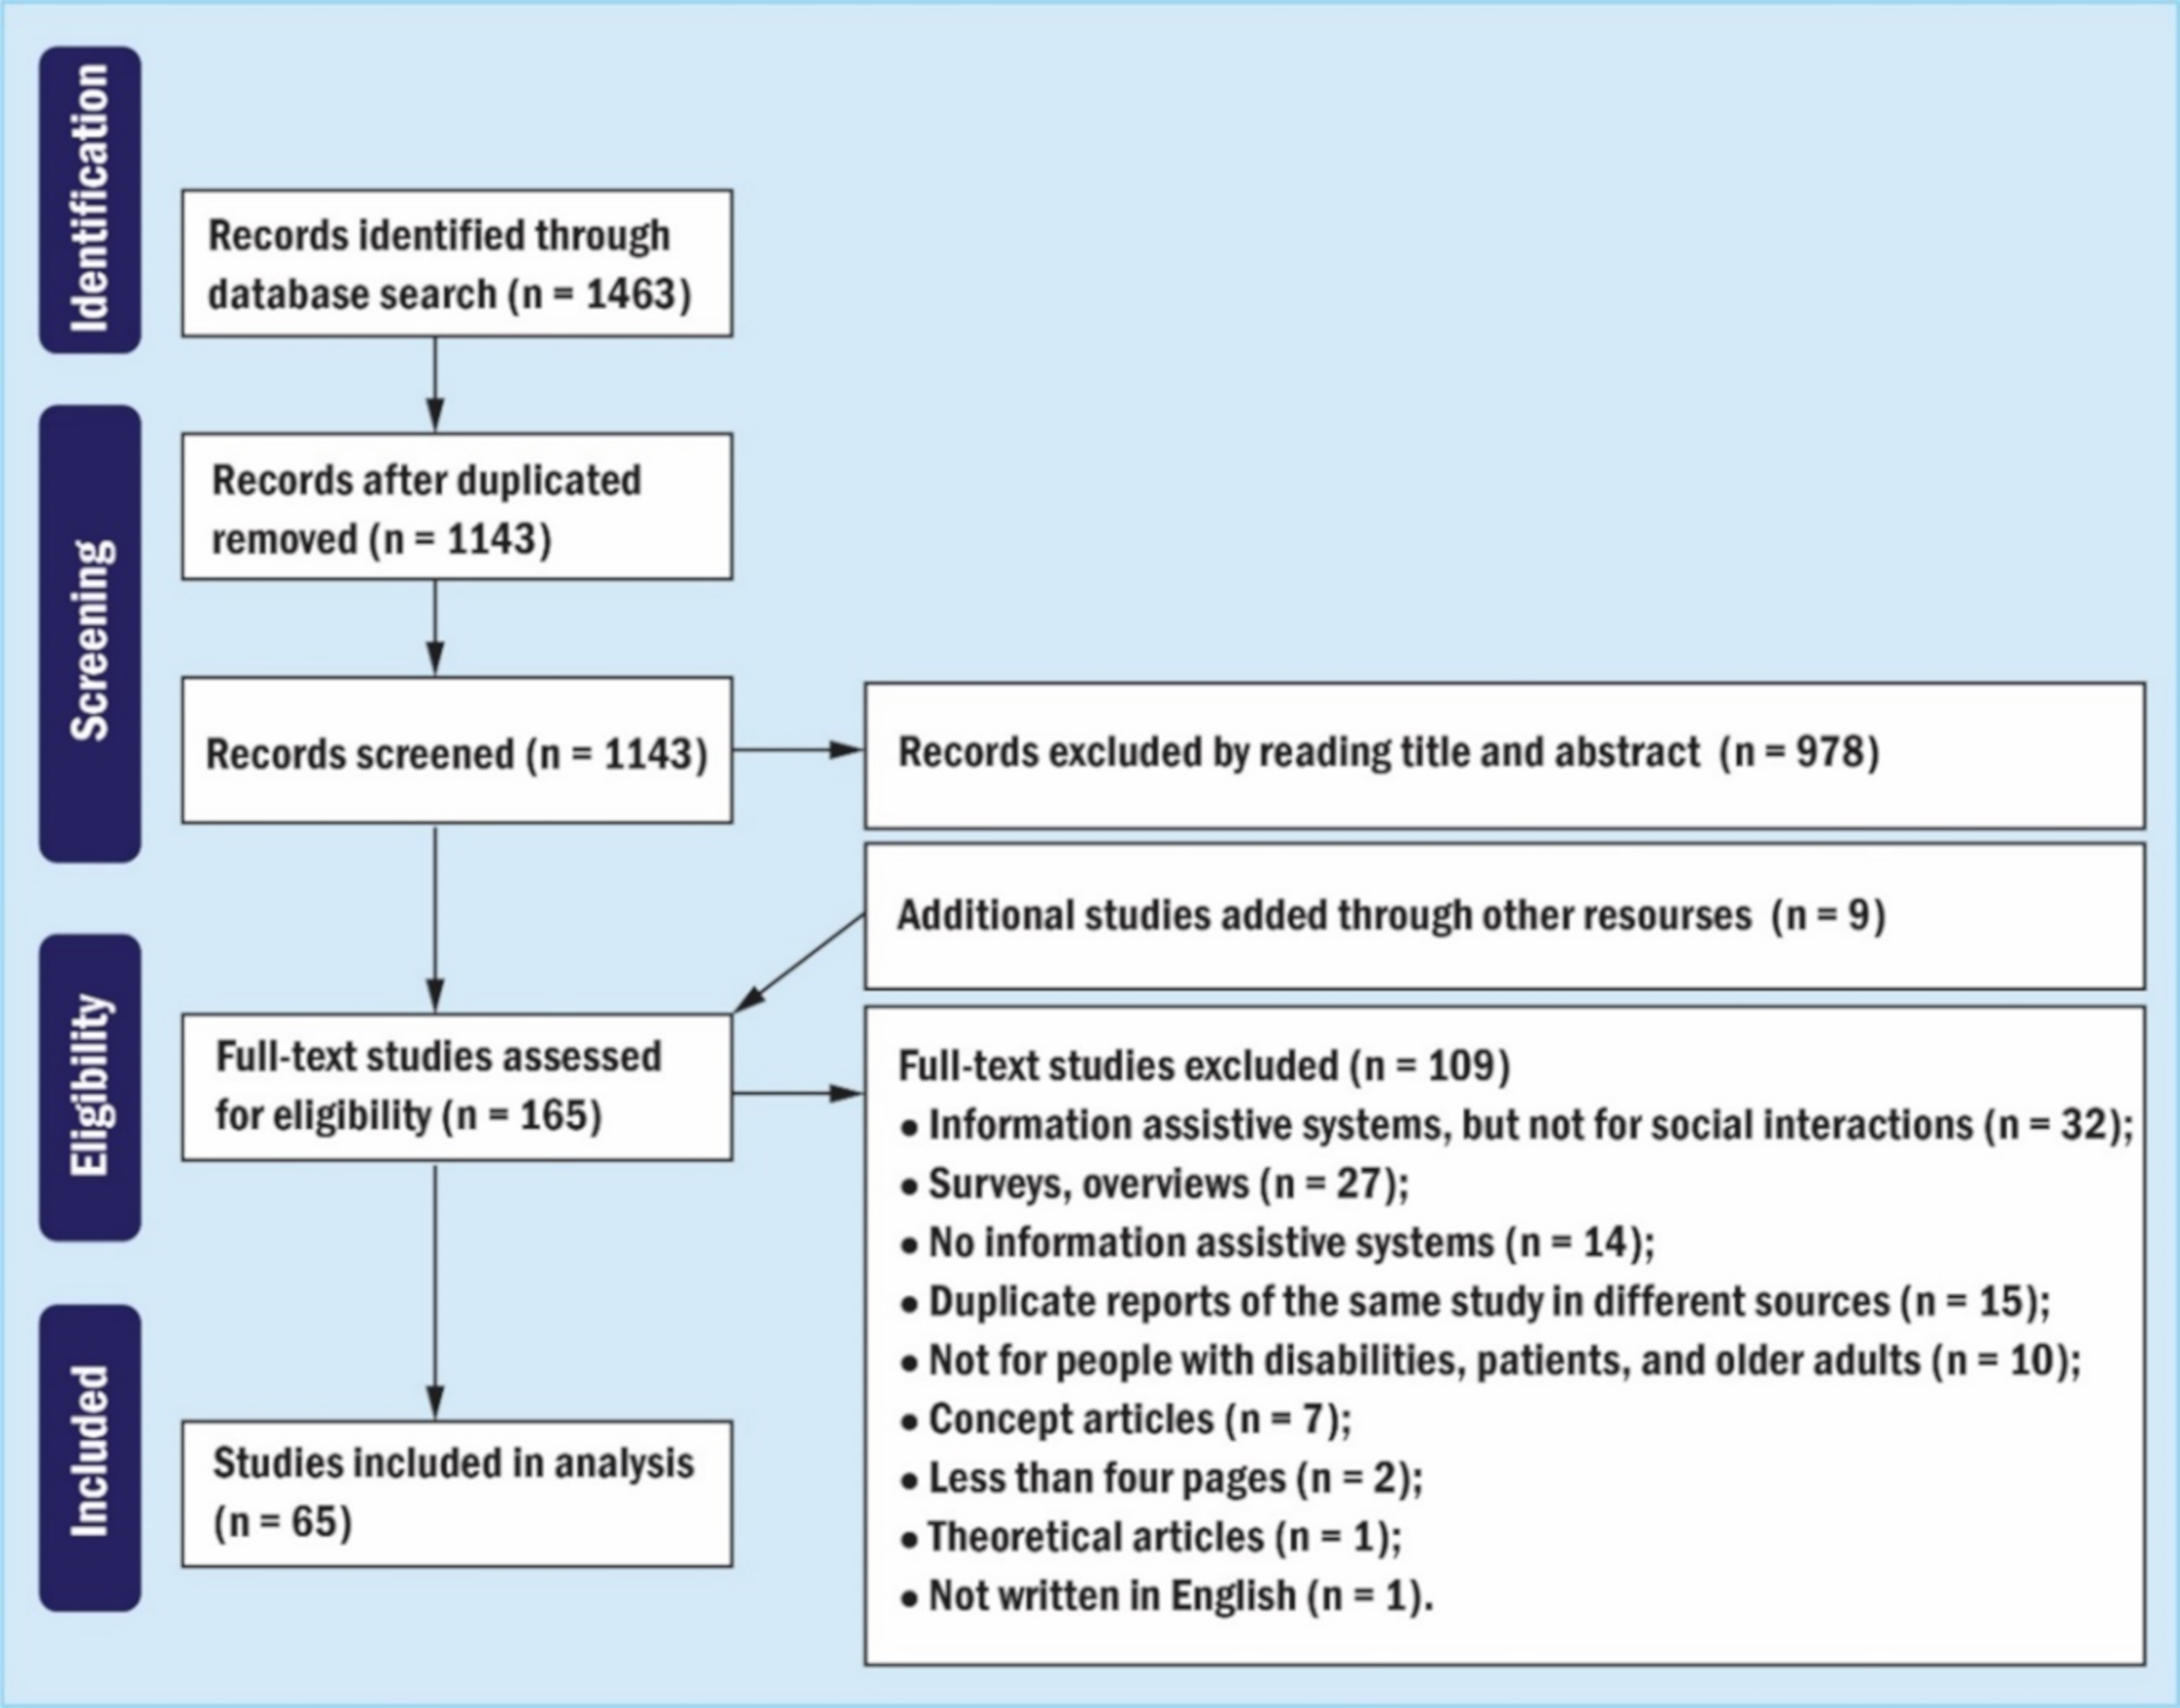
- A computerized search strategy (Figure 1) was conducted for the period from October 2019 to July 2021.
- S.Q. removed duplicates and evaluated titles and abstracts against the inclusion and exclusion criteria.
- According to our inclusion and exclusion criteria, two independent coders (S.Q. and P.C.A.) conducted the full-text review. Finally, discrepancies were resolved by discussions between two coders.
2.3. Data Analysis
3. Results
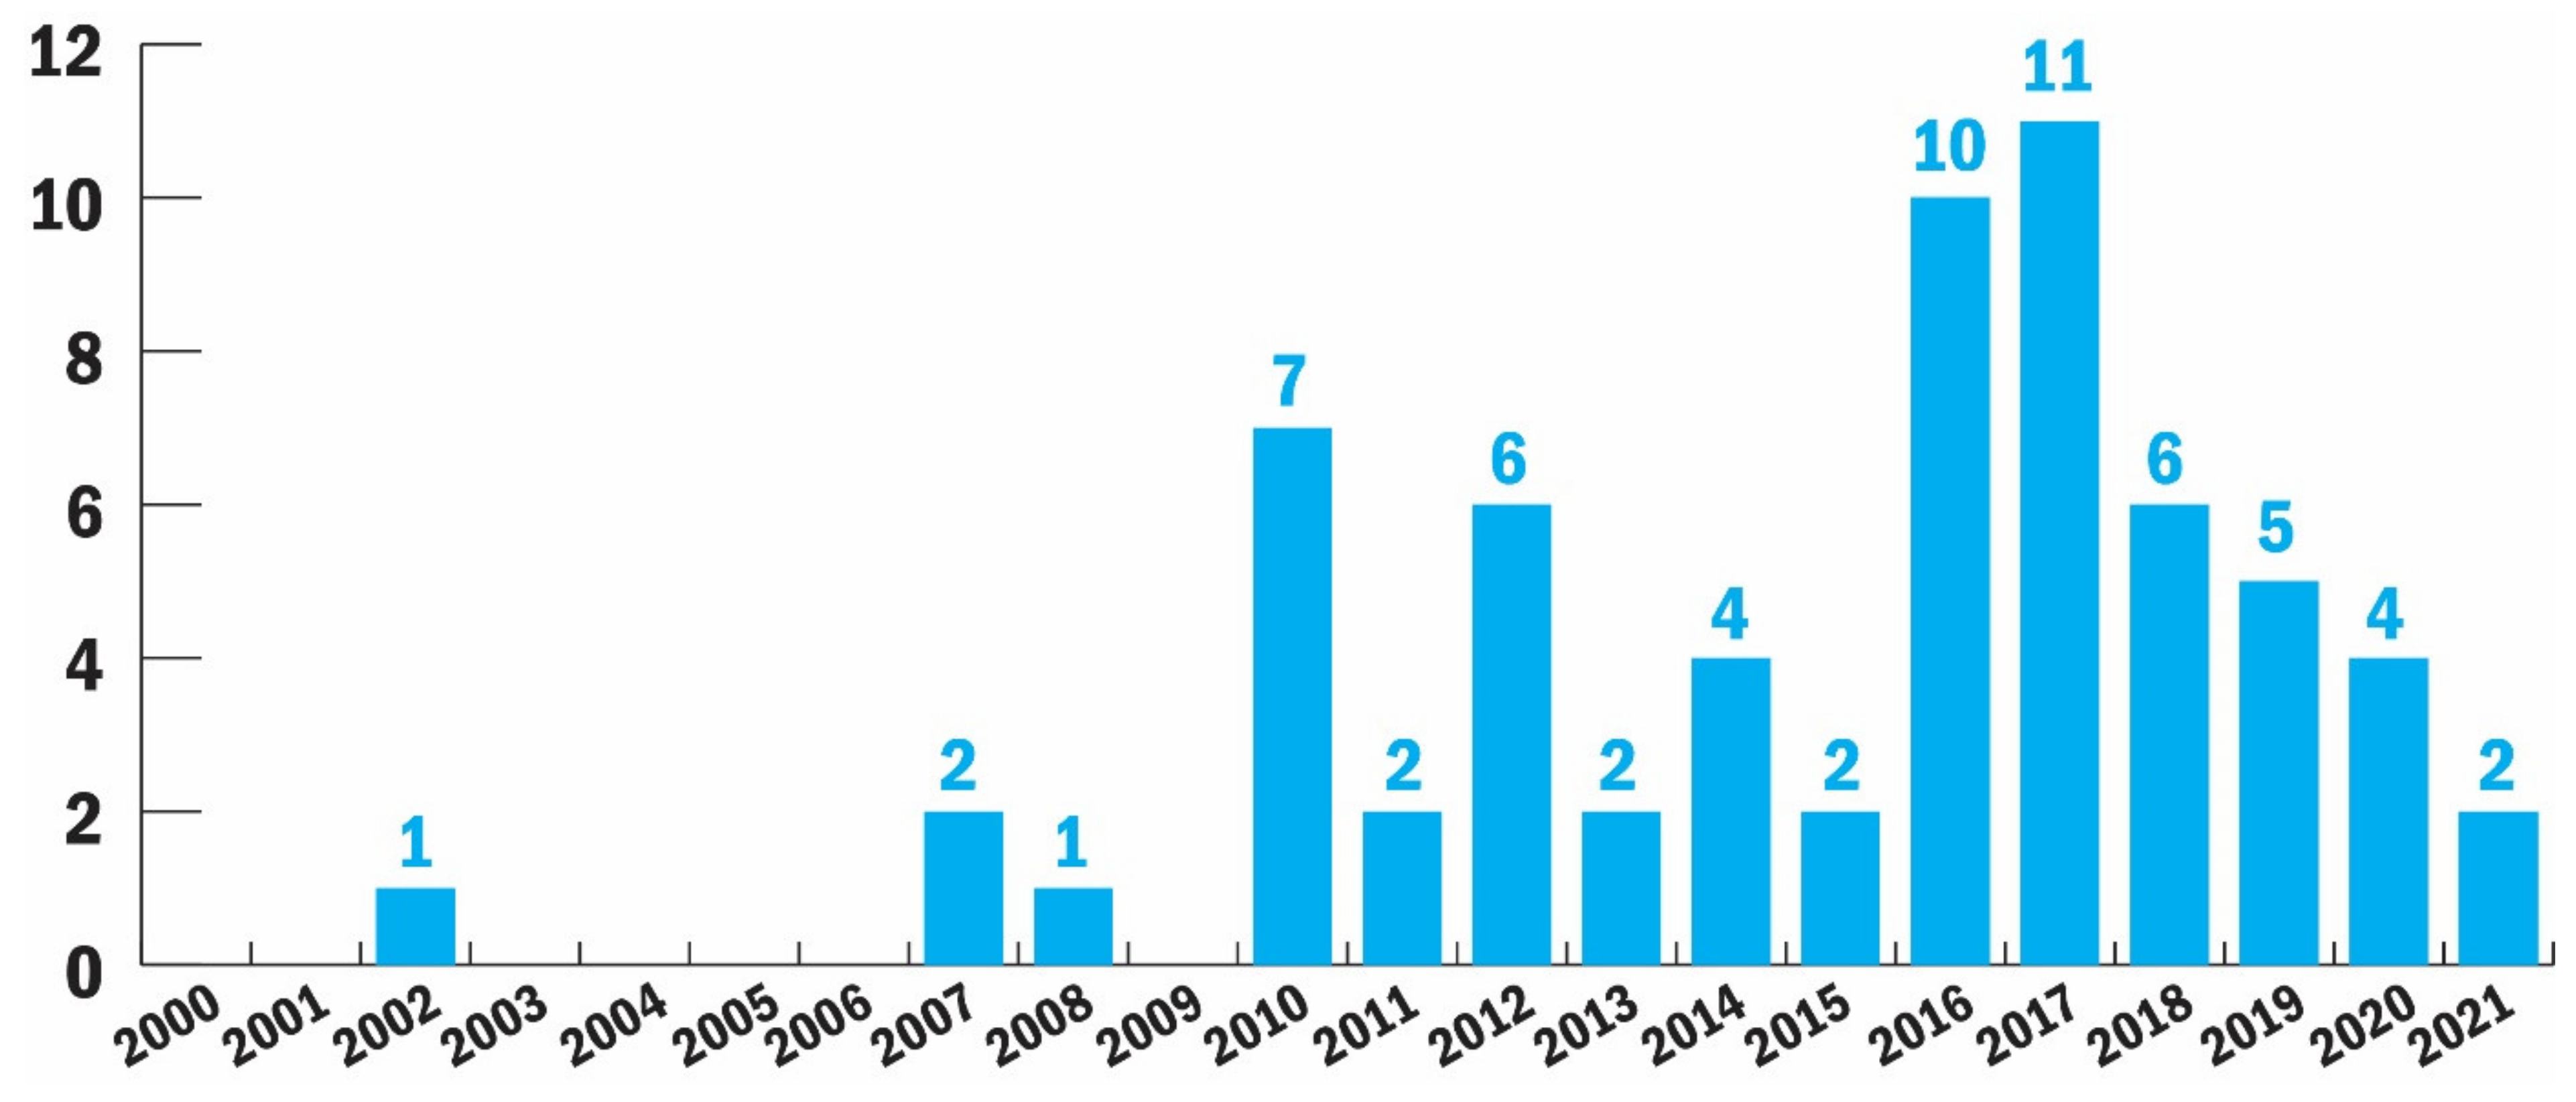
3.1. Overview
3.2. Target Users
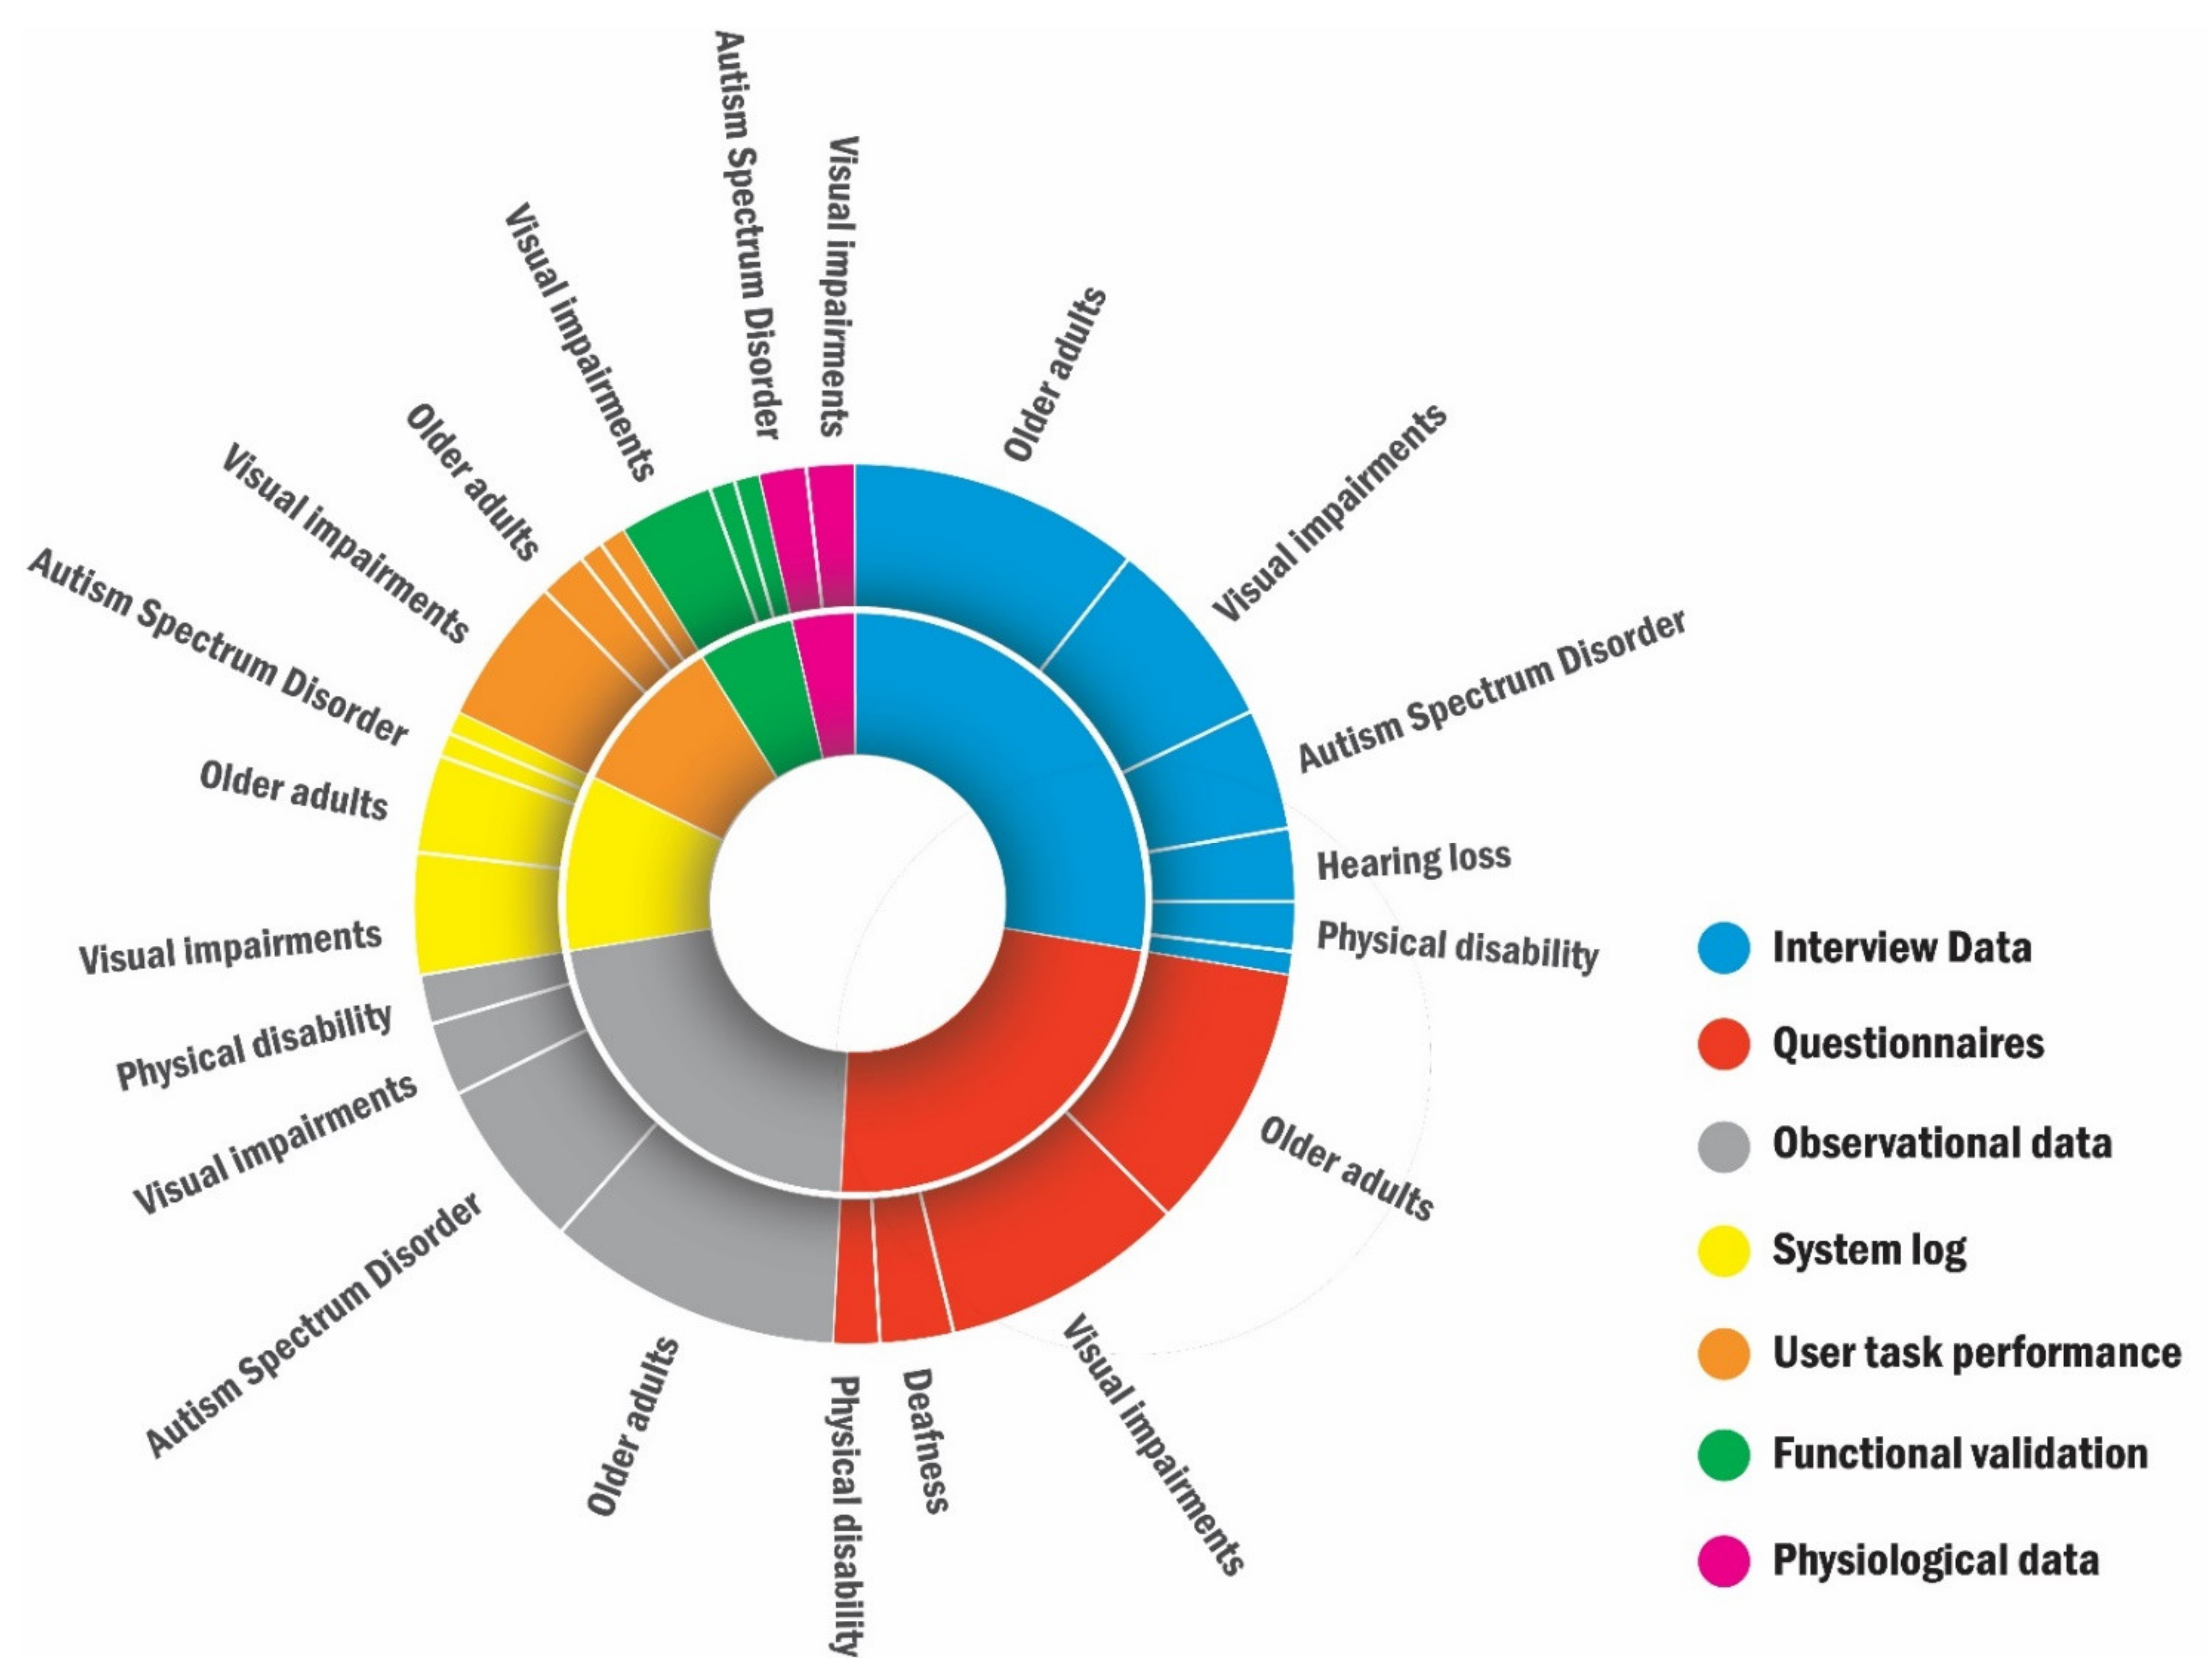
3.3. Data Gathering
3.3.1. Interview Data
3.3.2. Questionnaires
3.3.3. Observational Data
3.3.4. System Log
3.3.5. User Task Performance
3.3.6. Functional Validation
3.3.7. Physiological Data
4. Discussion
4.1. Insights for Target Users
4.2. Insights for Data Gathering
5. Conclusions
Author Contributions
Funding
Institutional Review Board Statement
Informed Consent Statement
Data Availability Statement
Acknowledgments
Conflicts of Interest
Appendix A

| No. | References | Research Purpose | Target Users | Methods of Data Gathering |
|---|---|---|---|---|
| 1 | Hine and Arnott, 2002, [49] | Design a communication service for people with speech or language impairment to enhance their social interactions when living independently. | People with speech or language impairment (non-speaking people) | Informal observation (usability and usefulness) |
| 2 | Miller et al., 2007, [45] | Design a semitransparent video interface to follow discourse at meetings in both collocated and remote settings. | People with deafness | Interview: feedback from interviews after demo sessions |
| 3 | Vincent et al., 2007, [46] | Use new assistive technology to evaluate the social participation of people with deafness. | People with deafness | Questionnaires (i.e., social participation, functional communication in activities of daily living, user satisfaction) |
| 4 | Nguyen et al., 2008, [50] | Design an interface for people who have physical disabilities and use communication systems by speech-generating devices to make calls and send messages. | People with physical disabilities | Questionnaires: (1) Canadian Occupational Performance Measure tool (COPM8); (2) Equipment Usability Questionnaire. |
| 5 | Dadlani et al., 2010, [63] | Use an electronic picture frame to monitor older adults at home with unobtrusive sensors, and collect data about their health, to provide social connectedness to caregivers. | Older adults | 1. Interviews 2. Questionnaires: (1) Awareness, connectedness, thinking of each other, usefulness, esthetics, novelty, and fun (2) Privacy, obligations, expectations, and distraction |
| 6 | Hirano et al., 2010, [40] | Design an interactive and collaborative visual scheduling system to help children with ASD to understand, structure, and predict activities in their daily lives. | Children with ASD | 1. Observations of classroom activities (field notes, photographs and videos) 2. Weekly interviews |
| 7 | Krishna et al., 2010, [32] | Develop an assistive technology for blind people, providing them with body rocking feedback and helping them access the facial expressions of their interaction partners. | Blind people | 1. Functional validation, detection rate of body rocking 2. User task performance, recognize facial expressions by vibrotactile pattern |
| 8 | McDaniel et al., 2010, [79] | Design novel tactile rhythms to convey the social cue of interpersonal distance (proxemics) for blind people. | Blind people | User task performance: users’ recognition accuracies of tactile rhythms |
| 9 | Brok and Barakova, 2010, [42] | Design a tangible multiagent system of interactive blocks to establish cooperative play between children with ASD and their caregivers. | Children with ASD | Observation (the participants’ behaviors and interactions with the system) |
| 10 | Astell et al., 2010, [74] | Develop a multimedia touch screen system to test whether it can meet the needs of both people with dementia and caregivers to engage in mutually satisfying interactions. | Older adults with dementia | Observation (verbal and nonverbal behaviors) |
| 11 | Shim et al., 2010, [61] | An online social gaming environment designed for older adults, to support social interaction through text and voice-based communications. | Older adults | 1. Questionnaires (relationship strength between partners) 2. Observation (participants’ behaviors) 3. Interviews (user experience, effectiveness of the system, relationships with social partners) |
| 12 | Black et al., 2011, [55] | Design a personal narrative system for children with SSPI. | Children with SSPI | System log (voice recordings from home and school) |
| 13 | Gilfeather-Crowley et al., 2011, [88] | Design an enhanced social awareness (ESA) network to assist blind people to identify friends and initiate social contact when their friends are approaching them. | Blind people | Functional validation (recognition error) |
| 14 | Escobedo et al., 2012, [39] | Develop a mobile assistive application for children with ASD to extend the social curriculum training and support real-life social situations. | Children with ASD | 1. Interviews 2. Observation: (1) Feld notes and video transcripts (2) Video analysis (interactions, social missteps, and topic of conversations) |
| 15 | Fuchsberger et al., 2012, [17] | Requirement analysis of an online platform to enhance the intergenerational interactions between geographically distant grandparents and grandchildren. | Older adults | 1. Questionnaires: (1) System Usability Scale (2) Self-developed items regarding their engagement 2. Observation (the types of usability issues based on think-aloud protocol and observer protocol) 3. User task performance: (1) Task success (2) Predefined steps for fulfilling the tasks (3) Level of assistance |
| 16 | Hermann et al., 2012, [77] | Design a wearable device to represent head movements as sound, aiming at assisting blind people to perceive head gestures. | Blind people | 1. User task performance: (1) Accuracy (associate sound with head gestures) (2) Differences between sonification types 2. Questionnaires (the participants’ preferences and expected performances of sonification). |
| 17 | Wu and Koon, 2012, [59] | Analyze the computer customization service that can simplify the communication between older adults and caregivers through the tangible and virtual interface in social media. | Older adults | 1. Interviews (system usability, behavior, and perception of older adults on using computer) 2. Observation (daily activities of older adults) 3. Interviews (user needs and user feedback) |
| 18 | Hourcade et al., 2012, [41] | Design applications that run on multitouch tablets to promote social skills for children with ASD, enabling them to better collaborate, and understand emotions. | Children with ASD | 1. Interviews (user feedback) 2. Observation (general user activities) |
| 19 | Garattini et al., 2012, [60] | Design and evaluate a communication system prototype to increase interaction in older adults suffering from social isolation and loneliness. | Older adults | 1. System log (usage of the system) 2. Interviews (Entry: health, social routines, social routines, changes to social network and experience with technology; Exit: user experience and perceived impact on social connectedness) 3. Interviews (user experiences, further improvement) 4. Questionnaire (user satisfaction and experience) |
| 20 | Magee and Betke, 2013, [53] | Design assistive technology to automatically generate a message on the social network to help people with (motion) disabilities to communicate with family and caregivers, to combat loneliness and isolation. | People with (motion) disability | 1. Observation 2. Interview (related mainly to usability) |
| 21 | Nijhof et al., 2013, [71] | Explore the behavior outcome of a designed technology supporting leisure activity (a social game) of people with dementia, in comparison with a game without technology support. | People with dementia | 1. Observation (structured observation using Oshkosh Social Behavior Coding Scale) 2. Interviews with activity facilitators |
| 22 | Anam et al., 2014, [29] | Use assistive technology to enable blind people to perceive social signals during a dyadic conversation. | Blind people | Questionnaires: (1) Correctness (2) Learnability (3) Informativeness (4) Usability (5) Portability (6) User satisfaction |
| 23 | Bala et al., 2014, [30] | Use a haptic interface to deliver the facial expressions of an interaction partner to blind people. | Blind people | User task performance (select a face image according to vibrotactile cues, to test the recognition rates) |
| 24 | Purves et al., 2014, [72] | Develop a touchscreen-based interface to facilitate the communication between people with dementia and their caregivers. | People with dementia | 1. Interviews (user experience) 2. Observation (audio transcription and videos on social interaction) |
| 25 | Terven et al., 2014, [81] | Present a method of robustly recognizing six head gestures for blind people. | Blind people | 1. Observation (head movements) 2. System log (the requested head movement) |
| 26 | Louanne, E. and Boyd et al., 2015, [38] | Use collaborative gaming to facilitate social relationships (i.e., membership, partnership, and friendship) in children with ASD. | Children with ASD | 1. Observation (field notes) 2. Interviews (interview transcripts) |
| 27 | Nazzi et al., 2015, [67] | Design the augmented everyday artifacts (the shopping bag) to make activities of older adults more socially visible to their community, to enhance their face-to-face social interaction. | Older adults | Observation (pictures, videos, and notes experiences of older adults gathered from co-design activities) |
| 28 | Abdallah et al., 2016, [48] | Provide an application to transfer text or voice information of hearing people into sign language, aiming at communicating with deaf and dumb people simply and creatively. | Deaf-and-dumb people | Questionnaires about the application: (1) Easy to use (2) Clear instructions (3) Helpful (4) Short response time (5) Willing to use on daily basis |
| 29 | Bekele et al., 2016, [36] | Design a multimodal VR-based social interaction platform for ASD intervention, asking children with ASD to recognize the emotions of the virtual characters. | Children with ASD | 1. Physiological data: (1) EEG (2) Gaze data (3) Heart rate (HR) (4) Skin temperature (SKT) (5) Respiration rate (RSPR) (6) Galvanic skin conductance rate (SCR) (7) Skin conductance level (SCL) 2. User task performance (the participant was asked to recognize an emotion of the virtual character) |
| 30 | Buimer et al., 2016, [31] | Provide vibrotactile feedback through a haptic belt to enhance social interactions for blind people. | Blind people | User task performance (i.e., identify a given emotional according to the location of tactile feedback) |
| 31 | Kim et al., 2016, [78] | Design an audio-augmented badminton game to help blind people enjoy physical activities and social interaction with sighted people. | Blind people | 1. Interviews (overall experience on the game) 2. Observation (exchanged times of shuttlecock) |
| 32 | Sauvé et al., 2016, [69] | Measure the benefits of an online educational game designed for older adults’ quality of life. | Older adults | Questionnaires: self-administered questionnaire (physical state, psychological aspect, social Environment) |
| 33 | Tapia et al., 2016, [70] | Explore the effectiveness of a smart TV-based application that promotes social interaction between older adults and their family members through social media. | Older Adults | 1. Interviews (system usability) 2. Observation (the participants’ interactions with the system) 3. User task performance (the number of errors, spent time) |
| 34 | Wang et al., 2016, [82] | Design a mobile application that not only helps older adults with low vision read better, but also encourages them to interact with family, friends, and society. | Older adults with low vision | 1. Observation (interactions with the prototype) 2. Interviews (user feedback) |
| 35 | Zhao et al., 2016, [57] | Present an automatic emotion annotation solution on 2.5-D facial data collected from RGB-D cameras. | People with low vision, Alzheimer’s disease, and ASD | Functional validation (the recognition rates) |
| 36 | Voss et al., 2016, [20] | Implement a facial expression recognition system based on google glasses, aiming at providing social cues for children with ASD. | Children with ASD | Observation (the effectiveness and usability of the system) |
| 37 | Qiu et al., 2016, [33] | Design a Tactile Band to enable the blind person to feel attention (gaze signals) from the sighted person, aiming at enhancing the level of engagement in face-to-face communication. | Blind people | 1. Questionnaires (relationship quality, partner closeness) 2. Physiological data (eye gaze) 3. Interviews (participant’s comments and suggestions) |
| 38 | Baez et al., 2017, [58] | Design a virtual fitness environment to keep independent-living older adults physically and socially active. | Older adults | 1. Questionnaires: (1) Usability (System Usability Scale) (2) Technology acceptance (i.e., anxiety, attractiveness, acceptance, satisfaction, and usefulness) (3) Usefulness by feature 2. System log (qualitative analysis of posted messages, using a coding scheme for measuring the nature of social interactions) |
| 39 | Bonnin et al., 2017, [37] | Assist children with ASD to improve social interactions through messages received in a waist smart band. | Children with ASD | 1. Observation: an observation instrument included data: (1) Interaction (2) Device (3) Conversation (4) Social errors 2. Physiological data: (1) Galvanic skin response (2) Heart rate (3) Skin temperature |
| 40 | Davis et al., 2017, [64] | Use a peripheral activity-based awareness system to capture human activity information, aiming at enhancing context awareness and support social connectedness between older adults and their caregivers. | Older adults | 1. A semi-structured interview 2. Interviews: (1) Self-reported moods (the self-assessment manikin (SAM) scale) (2) Social connectedness (IOS scale) |
| 41 | Gugenheimer et al., 2017, [43] | Design and evaluate the real-time translation of sign language to promote face-to-face interactions between deaf and hearing people. | People with deafness | 1. Interviews (1) Interview video analysis (interaction footage: number of interaction circles) (2) Interview transcripts were coded by two authors 2. Questionnaires for the emotional state (SAM questionnaire): (1) Dominance (2) Arousal (3) Pleasure |
| 42 | Meza-de-Luna et al., 2017, [80] | Enhance face-to-face interaction of blind people by conveying the social cue of head-nodding of conversation partners (so that the user could mirror this gesture). | Blind people | 1. Questionnaire to evaluate conversation (i.e., the Two-Dimensional Social Interaction Scale) 2. Semi-structured interview (user experiences focusing on how natural the conversation is) 3. Functional validation (head nodding recognition) |
| 43 | Papa et al., 2017, [68] | Design a TV-based interface to promote social interaction of less-educated older adults who have difficulty in using computers for socialization. | Older adults with lower education levels and difficulties of using computers | 1. Group interviews (opinions about the system) 2. Personal interviews (potential of the system in social inclusion, and QoL improvement) |
| 44 | Wu et al., 2017, [83] | Use artificial intelligence to enhance blind people’s experiences with photos on SNSs. | Blind people | 1. Interviews (current use of technology and social media, comprehension and general feedback on automatic alt-text) 2. Questionnaires (user experience) 3. System log (photo interactions) |
| 45 | Feng et al., 2017, [73] | Evaluate the effectiveness of an Interactive Table Design (ITD) for providing older adults with dementia meaningful engagements. | Older adults with dementia | Observation (emotional, verbal, visual, behavioral, collective engagement, and signs of agitation) |
| 46 | Zolyomi et al., 2017, [84] | Understand and investigate the social and emotional impacts associated with the adoption of low-vision assistive technology. | Blind people | Interviews (recall critical incidents, necessary visual qualifications for using eSight, customers’ concerns about adoption, and daily use) |
| 47 | Rahman et al., 2017, [85] | Design a smartphone based system to assist blind people to perceive nonverbal signals in natural dyadic conversations. | Blind people | 1. Questionnaires (user satisfaction, usability) 2. System log (predicted behavioral expressions) 3. Observation (user behaviors) |
| 48 | Sarfraz et al., 2017, [34] | A real-time multi-modal system that provides nonverbal cues (e.g., eye contact, number of people, their names and positions) via audio and haptic interfaces. | Blind people | 1. Questionnaire (the usability of interfaces, functions, ease of use, and intuitiveness) 2. Interviews (system’s face identification performance, user acceptance) 3. Functional validation (face recognition accuracy and head orientation accuracy) |
| 49 | Louanne, E. and Boyd et al., 2018, [35] | Provide the VR intervention to regulate social distance for children with ASD in social interactions. | Children with ASD | 1. System log (user’s distance from the avatar; volume; duration of talking) 2. Interview (interview transcripts) 3. Observation (took detailed paper-pencil field notes) |
| 50 | Johnson et al., 2018, [56] | Design and evaluate an affective avatar to engage the user in social interactions to assist in communication therapies. | People with SCD (Social Communication Disorders) | 1. User task performance (identification accuracy of six avatar emotions) 2. Interviews (ask user’s opinions whether the emotion of the avatar is logical or not) |
| 51 | Lin et al., 2018, [66] | Design a VR system for older adults living in communities, aiming at enhancing their emotional and social well-being. | Older adults | Questionnaires: (1) Health and wellbeing (2) Affects and emotions (e.g., Positive and Negative Affect Schedule (PANAS), big five inventory, Geriatric Depression Scale (GDS)) (3) System user experiences |
| 52 | McDaniel et al., 2018, [28] | Design haptic display using vibrotactile representation to convey facial action units (e.g., lip corners pulled up, cheeks raised), to help blind people perceive social signals. | Blind people | 1. User task performance (recognition accuracies of participants about the designed vibrotactile representation) 2. Questionnaire (self-report Likert scale) |
| 53 | Pingali et al., 2018, [51] | Design an autonomous wheelchair that can perform side-by-side following to reduce the mental load for people with physical disabilities in simultaneously navigating the wheelchair and conversing with people. | People with physical disabilities | Functional validation (sensor sampling rates, wireless communication distance, etc.) |
| 54 | Yurkewich et al., 2018, [76] | Evaluate how a tablet-based communication technology designed for older adults was used and impact family relationships. | Older adults with cognitive impairment | 1. Interviews (participants’ past experiences and present life, patterns of use, the facilitators and barriers to use, user experience) 2. Ethnography (field notes recording training strategies, activities practiced) 3. Observation (use scenarios) 4. System log (sent and received messages) |
| 55 | Fleury et al., 2019, [87] | Design and evaluate a fabric-based speech-generating device (SGD) for nonverbal pediatric participants with vision impairment. | The nonverbal pediatric participant with vision impairment | 1. Questionnaires completed by caregivers: (1) User acceptance (QUEST 2.0) (2) The participant’s feelings regarding her communication devices 2. System log (daily usage statistics) |
| 56 | Isaacson et al., 2019, [65] | Design and evaluate a communication system, aiming at promoting social connectivity and providing entrainment content for older adults. | Older adults | Questionnaires: (1) Loneliness (UCLA Loneliness Scale) (2) Depression (PHQ9 Depression Screener) (3) Emotional wellbeing (Mental Health Continuum Short Form (MHC-SF)) (4) Social engagement (Lubben Social Network Scale) |
| 57 | Marti and Recupero, 2019, [44] | Design smart jewels to support people with hearing loss beyond functional needs: instead of supporting hearing, the system aims to support emotional and socio-cultural needs. | People with deafness or hearing loss | In-depth interview (lived experiences on aesthetics, self-expression, and identity) |
| 58 | McCarron et al., 2019, [18] | Support people with memory loss (dementia) to remember people (names and relationships) that they interact in social activities, to increase their social engagement. | People with memory loss | 1. Questionnaires (quality of social interactions and quality of life) 2. Semi-structured interviews |
| 59 | Tamplin, et al., 2019, [54] | Test the acceptability and feasibility of an online virtual reality platform for therapeutic group singing interventions for people living with spinal cord injury. | People living with spinal cord injury | 1. Questionnaires (the overall user experience) 2. Interviews (user experience) |
| 60 | Lee et al., 2020, [86] | Design a working prototype for pedestrian detection, to decrease the social tensions of blind people. | Blind people | System log (the pedestrians’ attributes, such as name, gender, head pose, and position) |
| 61 | Li et al., 2020, [62] | Design three interactive systems to enhance the social interaction of older adults. | Older adults | 1. Questionnaire (IOS) 2. Semi-structured interviews 3. Observation (video recordings) |
| 62 | Qiu et al., 2020, [19] | Design Social Glasses system to let a blind person perceive and react “eye gaze” to a sighted conversation partner, to enhance their communication quality. | Blind people | 1. Questionnaire (NMSPI, IOS) 2. Observation (video recordings) 3. Physiological data (eye gaze) |
| 63 | Theil et al., 2020, [47] | Present a mobile Augmentative and Alternative Communication (AAC) device to facilitate communication of deaf-blind people. | Deaf blind people | N/A |
| 64 | Bellini et al., 2021, [75] | Analyze the localization data of AD patients living in assisted care homes to understand their social behaviors, promote their sociability and delay cognitive decline. | AD patients (Alzheimer’s Disease) | System log |
| 65 | Hsieh et al., 2021, [52] | Use eye-gaze assistive technology to promote dyadic interaction between children with severe physical disabilities and their communication partners. | Children with physical disabilities and complex communication needs | Observation (video-coding for communicative interaction, observational scheme) |
Appendix B
| Older adults in general [17] International Conference on Computers for Handicapped Persons [58] International Conference on Collaboration Technologies and Systems [59] International Convention on Rehabilitation Engineering and Assistive Technology [60] Universal Access in the Information Society [61] International Academic Conference on the Future of Game Design and Technology [62] Sustainability [63] Ai & Society [64] IEEE Access [65] International Conference on Technologies for Active and Assisted Living [66] International Conference on Human Aspects of IT for the Aged Population [67] International Conference on Human Aspects of IT for the Aged Population [68] Informatics for Health and Social Care [69] Communications in Computer and Information Science [70] International Conference on Ubiquitous Computing and Ambient Intelligence |
| Older adults with cognitive impairments [18] JMIR aging [71] Technology and Disability [72] American Journal of Alzheimer’s Disease & Other Dementias® [73] International Conference on Smart Health [74] Interacting with Computers [75] Sensors [76] International Journal of Mobile Human Computer Interaction |
| People with visual impairments [19] IEEE Access [28] Proceedings of the 2018 Workshop on Multimedia for Accessible Human Computer Interface [29] International Joint Conference on Pervasive and Ubiquitous Computing [30] 2014 IEEE International Symposium on Haptic, Audio and Visual Environments and Games [31] International Conference on Human-Computer Interaction [32] International Conference on Computers for Handicapped Persons [33] International Conference on Universal Access in Human-Computer Interaction [34] Informatik-Spektrum [77] Proceedings of the 7th Audio Mostly Conference: A Conference on Interaction with Sound [78] CHI Conference on Human Factors in Computing Systems [79] CHI Conference on Human Factors in Computing Systems [80] International Journal of Human-Computer Studies [81] Mexican Conference on Pattern Recognition [82] CHI Conference on Human Factors in Computing Systems [83] ACM Conference on Computer-Supported Cooperative Work [84] ACM SIGACCESS Conference on Computers and Accessibility [85] Multimedia Tools and Applications [86] CHI Conference on Human Factors in Computing Systems [87] Disability and Rehabilitation: Assistive Technology [88] IEEE International Conference on Systems, Man and Cybernetics |
| Children with ASD [20] ACM International Joint Conference on Pervasive and Ubiquitous Computing [35] CHI Conference on Human Factors in Computing Systems [36] IEEE Virtual Reality Conference [37] International Conference of Design, User Experience, and Usability [38] ACM Transactions on Accessible Computing [39] CHI Conference on Human Factors in Computing Systems [40] CHI Conference on Human Factors in Computing Systems [41] Personal and ubiquitous computing [42] International conference on entertainment computing |
| People with listening and speech impairments [43] ACM Conference on Computer-Supported Cooperative Work [44] ACM Creativity and Cognition [45] ACM Southeast Regional Conference [46] Technology and Disability [47] International Conference on Mobile and Ubiquitous Multimedia [48] Procedia Computer Science [49] ACM conference on Assistive technologies |
| People with mobility and physical impairments [50] Technology and Disability [51] Sensors [52] International journal of environmental research and public health [53] International Conference on Universal Access in Human-Computer Interaction [54] Journal of telemedicine and telecare |
| Others [55] ACM conference on Assistive technologies [56] Health informatics journal [57] IEEE transactions on cybernetics |
References
- Rogers, Y.; Sharpe, H.; Preece, J. Interaction Design, Beyond Human-Computer Interaction, 3rd ed.; Wiley: New York, NY, USA, 2011. [Google Scholar]
- Ibarra, F.; Baez, M.; Cernuzzi, L.; Casati, F. A Systematic Review on Technology-Supported Interventions to Improve Old-Age Social Wellbeing: Loneliness, Social Isolation, and Connectedness. J. Health Eng. 2020, 2020, 2036842. [Google Scholar] [CrossRef] [PubMed]
- Fiorillo, D.; Sabatini, F. Quality and quantity: The role of social interactions in self-reported individual health. Soc. Sci. Med. 2011, 73, 1644–1652. [Google Scholar] [CrossRef]
- Evans, I.E.M.; Llewellyn, D.J.; Matthews, F.E.; Woods, R.T.; Brayne, C.; Clare, L. Social isolation, cognitive reserve, and cognition in older people with depression and anxiety. Aging Ment. Health 2019, 23, 1691–1700. [Google Scholar] [CrossRef]
- Fratiglioni, L.; Wang, H.-X.; Ericsson, K.; Maytan, M.; Winblad, B. Influence of social network on occurrence of dementia: A community-based longitudinal study. Lancet 2000, 355, 1315–1319. [Google Scholar] [CrossRef]
- Centers for Disease Control and Prevention. Guidance for Large or Extended Families Living in the Same Household. 2020. Available online: https://www.cdc.gov/coronavirus/2019-ncov/downloads/living-in-close-quarters.pdf (accessed on 15 November 2021).
- Kemp, N.J.; Rutter, D.R. Social Interaction in Blind People: An Experimental Analysis. Hum. Relat. 1986, 39, 195–210. [Google Scholar] [CrossRef]
- Chamberlain, B.; Kasari, C.; Rotheram-Fuller, E. Involvement or Isolation? The Social Networks of Children with Autism in Regular Classrooms. J. Autism Dev. Disord. 2007, 37, 230–242. [Google Scholar] [CrossRef]
- Cotugno, A.J. Social Competence and Social Skills Training and Intervention for Children with Autism Spectrum Disorders. J. Autism Dev. Disord. 2009, 39, 1268–1277. [Google Scholar] [CrossRef]
- Reichow, B.; Volkmar, F.R. Social Skills Interventions for Individuals with Autism: Evaluation for Evidence-Based Practices within a Best Evidence Synthesis Framework. J. Autism Dev. Disord. 2010, 40, 149–166. [Google Scholar] [CrossRef] [PubMed]
- Thiemann, K.S.; Goldstein, H. Social Stories, Written Text Cues, and Video Feedback: Effects on Social Communication of Children with Autism. J. Appl. Behav. Anal. 2001, 34, 425–446. [Google Scholar] [CrossRef]
- Balakrishnan, S.; Alias, A. Usage of Social Stories in Encouraging Social Interaction of Children with Autism Spectrum Disorder. J. ICSAR 2017, 1, 91–97. [Google Scholar] [CrossRef]
- World Health Organization. Assistive Technology: Making Universal Health Coverage Inclusive; WHO: Geneva, Switzerland, 2016; p. 3. [Google Scholar]
- World Intellectual Property Organization. WIPO Technology Trends 2021: Assistive Technology; World Intellectual Property Organization: Geneva, Switzerland, 2021; Available online: https://www.wipo.int/edocs/pubdocs/en/wipo_pub_1055_2021.pdf (accessed on 24 September 2021).
- International Organization for Standardization. ISO 9999: 2016 Assistive Products for Persons with Disability—Classification and Terminology; International Organization for Standardization: Geneva, Switzerland, 2016. [Google Scholar]
- Pino, M.; Boulay, M.; Jouen, F.; Rigaud, A.-S. “Are we ready for robots that care for us?” Attitudes and opinions of older adults toward socially assistive robots. Front. Aging Neurosci. 2015, 7, 141. [Google Scholar] [CrossRef] [PubMed]
- Fuchsberger, V.; Sellner, W.; Moser, C.; Tscheligi, M. Benefits and Hurdles for Older Adults in Intergenerational Online Interactions. In Proceedings of the International Conference on Computers for Handicapped Persons, Paris, France, 9–11 July 2012; Springer: Berlin/Heidelberg, Germany, 2012; pp. 697–704. [Google Scholar]
- McCarron, H.R.; Zmora, R.; E Gaugler, J. A Web-Based Mobile App With a Smartwatch to Support Social Engagement in Persons With Memory Loss: Pilot Randomized Controlled Trial. J. Med. Internet Res. 2019, 21, e13378. [Google Scholar] [CrossRef]
- Qiu, S.; Hu, J.; Han, T.; Osawa, H.; Rauterberg, M. An Evaluation of a Wearable Assistive Device for Augmenting Social Interactions. IEEE Access 2020, 8, 164661–164677. [Google Scholar] [CrossRef]
- Voss, C.; Washington, P.; Haber, N.; Kline, A.; Daniels, J.; Fazel, A.; De, T.; McCarthy, B.; Feinstein, C.; Winograd, T.; et al. Superpower Glass: Delivering unobtrusive real-Time social cues in wearable systems. In Proceedings of the 2016 ACM International Joint Conference on Pervasive and Ubiquitous Computing, Heidelberg, Germany, 12–16 September 2016; Association for Computing Machinery: New York, NY, USA, 2016; pp. 1218–1226. [Google Scholar]
- Bemelmans, R.; Gelderblom, G.J.; Jonker, P.; de Witte, L. Socially Assistive Robots in Elderly Care: A Systematic Review into Effects and Effectiveness. J. Am. Med. Dir. Assoc. 2012, 13, 114–120. [Google Scholar] [CrossRef] [PubMed]
- Kachouie, R.; Sedighadeli, S.; Khosla, R.; Chu, M.-T. Socially Assistive Robots in Elderly Care: A Mixed-Method Systematic Literature Review. Int. J. Hum. Comput. Interact. 2014, 30, 369–393. [Google Scholar] [CrossRef]
- Martinez-Martin, E.; Escalona, F.; Cazorla, M. Socially Assistive Robots for Older Adults and People with Autism: An Overview. Electron 2020, 9, 367. [Google Scholar] [CrossRef]
- Kabacińska, K.; Prescott, T.J.; Robillard, J.M. Socially Assistive Robots as Mental Health Interventions for Children: A Scoping Review. Int. J. Soc. Robot. 2021, 13, 919–935. [Google Scholar] [CrossRef]
- Qiu, S.; An, P.; Kang, K.; Hu, J.; Han, T.; Rauterberg, M. Investigating socially assistive systems from system design and evaluation: A systematic review. Univers. Access Inf. Soc. 2021, 1–25. [Google Scholar] [CrossRef]
- Moher, D.; Liberati, A.; Tetzlaff, J.; Altman, D.G. The PRISMA Group. Preferred Reporting Items for Systematic Reviews and Meta-Analyses: The PRISMA Statement. Ann. Intern. Med. 2009, 151, 264–269. [Google Scholar] [CrossRef]
- Ross, J. The Role of Observation in User Research. UXmatters. 2018. Available online: https://www.uxmatters.com/mt/archives/2018/09/the-role-of-observation-in-user-research.php (accessed on 15 August 2021).
- McDaniel, T.; Tran, D.; Devkota, S.; DiLorenzo, K.; Fakhri, B.; Panchanathan, S. Tactile facial expressions and associated emotions toward accessible social interactions for individuals who are blind. In MAHCI 2018—Proceedings of the 2018 Workshop on Multimedia for Accessible Human Computer Interface, co-located with MM 2018, Seoul, Korea, 22–26 October 2018; ACM Press: New York, NY, USA, 2018; pp. 25–32. [Google Scholar]
- Anam, A.I.; Alam, S.; Yeasin, M. Expression: A dyadic conversation aid using google glass for people with visual impairments. In UbiComp 2014—Adjunct Proceedings of the 2014 ACM International Joint Conference on Pervasive and Ubiquitous Computing, Seattle, WA, USA, 13–17 September 2014; ACM Press: New York, NY, USA, 2014; pp. 211–214. [Google Scholar]
- Bala, S.; McDaniel, T.; Panchanathan, S. Visual-to-tactile mapping of facial movements for enriched social interactions. In Proceedings of the 2014 IEEE International Symposium on Haptic, Audio and Visual Environments and Games (HAVE) Proceedings, Richardson, TX, USA, 10–11 October 2014; pp. 82–87. [Google Scholar]
- Buimer, H.P.; Bittner, M.; Kostelijk, T.; van der Geest, T.M.; van Wezel, R.J.A.; Zhao, Y. Enhancing emotion recognition in VIPs with haptic feedback. In Proceedings of the International Conference on Human-Computer Interaction, Paris, France, 14–16 September 2016; Association for Computing Machinery: New York, NY, USA, 2016; pp. 157–163. [Google Scholar]
- Krishna, S.; Panchanathan, S. Assistive technologies as effective mediators in interpersonal social interactions for persons with visual disability. In Proceedings of the International Conference on Computers for Handicapped Persons, Vienna, Austria, 14–16 July 2010; Springer: Berlin/Heidelberg, Germany, 2010; pp. 316–323. [Google Scholar]
- Qiu, S.; Rauterberg, M.; Hu, J. Designing and evaluating a wearable device for accessing gaze signals from the sighted. In Proceedings of the International Conference on Universal Access in Human-Computer Interaction, Toronto, ON, Canada, 17–22 July 2016; Springer: Singapore, 2016; pp. 454–464. [Google Scholar]
- Sarfraz, M.S.; Constantinescu, A.; Zuzej, M.; Stiefelhagen, R. A Multimodal Assistive System for Helping Visually Impaired in Social Interactions. Inform. Spektrum 2017, 40, 540–545. [Google Scholar] [CrossRef]
- Boyd, L.E.; Gupta, S.; Vikmani, S.B.; Gutierrez, C.M.; Yang, J.; Linstead, E.; Hayes, G.R. VrSocial: Toward immersive therapeutic VR systems for children with autism. In Proceedings of the Conference on Human Factors in Computing Systems—Proceedings, Montreal, QC, Canada, 21–26 April 2018; ACM Press: New York, NY, USA, 2018; pp. 1–12. [Google Scholar]
- Bekele, E.; Wade, J.; Bian, D.; Fan, J.; Swanson, A.; Warren, Z.; Sarkar, N. Multimodal adaptive social interaction in virtual environment (MASI-VR) for children with Autism spectrum disorders (ASD). In Proceedings of the 2016 IEEE Virtual Reality (VR), Greenville, SC, USA, 19–23 March 2016; pp. 121–130. [Google Scholar]
- Bonnin, F.; Gonzalez, V.M. TEA band: An interactive system to aid students with autism improve their social interactions. In Proceedings of the International Conference of Design, User Experience, and Usability, Vancouver, BC, Canada, 9–14 July 2017; Springer: Berlin/Heidelberg, Germany, 2017; pp. 621–635. [Google Scholar]
- Boyd, L.E.; Ringland, K.E.; Haimson, O.; Fernandez, H.; Bistarkey, M.; Hayes, G.R. Evaluating a Collaborative iPad Game’s Impact on Social Relationships for Children with Autism Spectrum Disorder. ACM Trans. Access. Comput. 2015, 7, 1–18. [Google Scholar] [CrossRef]
- Escobedo, L.; Nguyen, D.H.; Boyd, L.; Hirano, S.; Rangel, A.; Garcia-Rosas, D.; Tentori, M.; Hayes, G. MOSOCO: A mobile assistive tool to support children with autism practicing social skills in real-life situations. In Proceedings of the SIGCHI Conference on Human Factors in Computing Systems, Austin, TX, USA, 5–10 May 2012; pp. 2589–2598. [Google Scholar]
- Hirano, S.H.; Yeganyan, M.T.; Marcu, G.; Nguyen, D.H.; Boyd, L.A.; Hayes, G.R. vSked: Evaluation of a system to support classroom activities for children with autism. In Proceedings of the SIGCHI Conference on Human Factors in Computing Systems, Atlanta, GA, USA, 10–15 April 2010; pp. 1633–1642. [Google Scholar]
- Hourcade, J.P.; Bullock-Rest, N.E.; Hansen, T.E. Multitouch tablet applications and activities to enhance the social skills of children with autism spectrum disorders. Pers. Ubiquitous Comput. 2012, 16, 157–168. [Google Scholar] [CrossRef]
- Brok, J.C.J.; Barakova, E.I. Engaging autistic children in imitation and turn-taking games with multiagent system of interactive lighting blocks. In Proceedings of the International Conference on Entertainment Computing, Seoul, Korea, 8–11 September 2010; Springer: Berlin/Heidelberg, Germany, 2010; pp. 115–126. [Google Scholar]
- Gugenheimer, J.; Plaumann, K.; Schaub, F.; Vito, P.d.S.; Duck, S.; Rabus, M.; Rukzio, E. The impact of assistive technology on communication quality between deaf and hearing individuals. In Proceedings of the ACM Conference on Computer Supported Cooperative Work, Portland, OR, USA, 25 February–1 March 2017; pp. 669–682. [Google Scholar]
- Marti, P.; Recupero, A. Is deafness a disability?: Designing hearing AIDS beyond functionality. In Proceedings of the 2019 Creativity and Cognition, San Diego, CA, USA, 23–26 June 2019; pp. 133–143. [Google Scholar]
- Miller, D.; Gyllstrom, K.; Stotts, D.; Culp, J. Semi-transparent video interfaces to assist Deaf persons in meetings. In Proceedings of the Annual Southeast Conference, Winston-Salem, NC, USA, 23–24 March 2007; pp. 501–506. [Google Scholar]
- Vincent, C.; Deaudelin, I.; Hotton, M. Pilot on evaluating social participation following the use of an assistive technology designed to facilitate face-to-face communication between deaf and hearing persons. Technol. Disabil. 2008, 19, 153–167. [Google Scholar] [CrossRef]
- Theil, A.; Buchweitz, L.; Gay, J.; Lindell, E.; Guo, L.; Persson, N.-K.; Korn, O. Tactile Board: A Multimodal Augmentative and Alternative Communication Device for Individuals with Deafblindness. In Proceedings of the 19th International Conference on Mobile and Ubiquitous Multimedia, Essen, Germany, 22–25 November 2020; ACM Press: New York, NY, USA, 2020; pp. 223–228. [Google Scholar]
- Abdallah, E.E.; Fayyoumi, E. Assistive Technology for Deaf People Based on Android Platform. Procedia Comput. Sci. 2016, 94, 295–301. [Google Scholar] [CrossRef]
- Hine, N.; Arnott, J.L. Assistive social interaction for non-speaking people living in the community. In Proceedings of the Fifth International ACM Conference on Assistive Technologies—Assets ’02, Edinburgh, UK, 8–10 July 2002; pp. 162–169. [Google Scholar]
- Nguyen, T.; Garrett, R.; Downing, A.; Walker, L.; Hobbs, D. An interfacing system that enables speech generating device users to independently access and use a mobile phone. Technol. Disabil. 2008, 20, 225–239. [Google Scholar] [CrossRef]
- Pingali, T.R.; Lemaire, E.D.; Baddour, N. Ultrasonic Tethering to Enable Side-by-Side Following for Powered Wheelchairs. Sensors 2018, 19, 109. [Google Scholar] [CrossRef] [PubMed]
- Hsieh, Y.-H.; Borgestig, M.; Gopalarao, D.; McGowan, J.; Granlund, M.; Hwang, A.-W.; Hemmingsson, H. Communicative Interaction with and without Eye-Gaze Technology between Children and Youths with Complex Needs and Their Communication Partners. Int. J. Environ. Res. Public Health 2021, 18, 5134. [Google Scholar] [CrossRef]
- Magee, J.J.; Betke, M. Automatically generating online social network messages to combat social isolation of people with disabilities. In Proceedings of the International Conference on Universal Access in Human-Computer Interaction, Las Vegas, NV, USA, 21–26 July 2013; Springer: Berlin/Heidelberg, Germany, 2013; pp. 684–693. [Google Scholar]
- Tamplin, J.; Loveridge, B.; Clarke, K.; Li, Y.; Berlowitz, D.J. Development and feasibility testing of an online virtual reality platform for delivering therapeutic group singing interventions for people living with spinal cord injury. J. Telemed. Telecare 2020, 26, 365–375. [Google Scholar] [CrossRef] [PubMed]
- Black, R.; Waller, A.; Tintarev, N.; Reiter, E.; Reddington, J. A mobile phone based personal narrative system. In ASSETS’11: Proceedings of the 13th International ACM SIGACCESS Conference on Computers and Accessibility, Dundee, UK, 24–26 October 2011; ACM Press: New York, NY, USA, 2011; pp. 171–178. [Google Scholar]
- Johnson, E.; Hervás, R.; de la Franca, C.; Mondéjar, T.; Ochoa, S.F.; Favela, J. Assessing empathy and managing emotions through interactions with an affective avatar. Health Inform. J. 2018, 24, 182–193. [Google Scholar] [CrossRef]
- Zhao, X.; Zou, J.; Li, H.; Dellandréa, E.; Kakadiaris, I.A.; Chen, L. Automatic 2.5-D Facial Landmarking and Emotion Annotation for Social Interaction Assistance. IEEE Trans. Cybern. 2015, 46, 2042–2055. [Google Scholar] [CrossRef] [PubMed]
- Baez, M.; Ibarra, F.; Far, I.K.; Ferron, M.; Casati, F. Online Group-Exercises for Older Adults of Different Physical Abilities. In Proceedings of the 2016 International Conference on Collaboration Technologies and Systems (CTS), Orlando, FL, USA, 31 October–4 November 2016; pp. 524–533. [Google Scholar]
- Wu, J.; Koon, L.C. Tangible social-media application for the elderly. In Proceedings of the i-CREATe 2012—6th International Convention on Rehabilitation Engineering and Assistive Technology, Singapore, 24–26 July 2012; pp. 1–4. [Google Scholar]
- Garattini, C.; Wherton, J.; Prendergast, D. Linking the lonely: An exploration of a communication technology designed to support social interaction among older adults. Univers. Access Inf. Soc. 2011, 11, 211–222. [Google Scholar] [CrossRef]
- Shim, N.; Baecker, R.; Birnholtz, J.; Moffatt, K. Table Talk Poker: An online social gaming environment for seniors. In Proceedings of the Future Play 2010: Research, Play, Share—International Academic Conference on the Future of Game Design and Technology, Vancouver, BC, Canada, 6–7 May 2010; pp. 98–104. [Google Scholar]
- Li, C.; Kang, K.; Lin, X.; Hu, J.; Hengeveld, B.; Hummels, C. Promoting Older Residents’ Social Interaction and Wellbeing: A Design Perspective. Sustainability 2020, 12, 2834. [Google Scholar] [CrossRef]
- Dadlani, P.; Sinitsyn, A.; Fontijn, W.; Markopoulos, P. Aurama: Caregiver awareness for living independently with an augmented picture frame display. AI Soc. 2010, 25, 233–245. [Google Scholar] [CrossRef]
- Davis, K.; Owusu, E.B.; Marcenaro, L.; Feijs, L.; Regazzoni, C.; Hu, J. Effects of Ambient Lighting Displays on Peripheral Activity Awareness. IEEE Access 2017, 5, 9318–9335. [Google Scholar] [CrossRef]
- Isaacson, M.; Cohen, I.; Shpigelman, C.N. Leveraging emotional wellbeing and social engagement of the oldest old by using advanced communication technologies: A pilot study using uniper-care’s technology. In Proceedings of the 3rd IET International Conference on Technologies for Active and Assisted Living (TechAAL 2019), London, UK, 25 March 2019; pp. 1–5. [Google Scholar]
- Lin, C.X.; Lee, C.; Lally, D.; Coughlin, J.F. Impact of Virtual Reality (VR) experience on older adults’ well-being. In Proceedings of the International Conference on Human Aspects of IT for the Aged Population, Las Vegas, NV, USA, 15–20 July 2018; Springer: Singapore, 2018; pp. 89–100. [Google Scholar]
- Nazzi, E.; Sokoler, T. TwitterIDo: What if my shopping bag could tell my friends I’m out shopping. In Proceedings of the International Conference on Human Aspects of IT for the Aged Population, Los Angeles, CA, USA, 2–7 August 2015; Springer: Singapore, 2015; pp. 512–523. [Google Scholar]
- Papa, F.; Cornacchia, M.; Sapio, B.; Nicolò, E. Engaging technology-resistant elderly people: Empirical evidence from an ICT-enabled social environment. Informatics Health Soc. Care 2017, 42, 43–60. [Google Scholar] [CrossRef] [PubMed]
- Sauvé, L.; Renaud, L.; Kaufman, D.; Duplàa, E. Can digital games help seniors improve their quality of life? In Communications in Computer and Information Science; Springer: Singapore, 2017; pp. 179–192. [Google Scholar]
- Tapia, J.M.; Gutierrez, F.J.; Ochoa, S.F. Using smart TV applications for providing interactive ambient assisted living services to older adults. In Proceedings of the International Conference on Ubiquitous Computing and Ambient Intelligence, Gran Canaria, Spain, 29 November–2 December 2016; Springer: Berlin/Heidelberg, Germany, 2016; pp. 514–524. [Google Scholar]
- Nijhof, N.; van Hoof, J.; van Rijn, H.; van Gemert-Pijnen, J. The behavioral outcomes of a technology-supported leisure activity in people with dementia. Technol. Disabil. 2013, 25, 263–273. [Google Scholar] [CrossRef]
- Purves, B.A.; Phinney, A.; Hulko, W.; Puurveen, G.; Astell, A. Developing CIRCA-BC and Exploring the Role of the Computer as a Third Participant in Conversation. Am. J. Alzheimer’s Dis. Other Dement. 2014, 30, 101–107. [Google Scholar] [CrossRef]
- Feng, Y.; van Reijmersdal, R.; Yu, S.; Hu, J.; Rauterberg, M.; Barakova, E. Using observational engagement assessment method VC-IOE for evaluating an interactive table designed for seniors with dementia. In Proceedings of the International Conference on Smart Health, Hong Kong, China, 26-27 June 2017; Springer: Singapore, 2017; pp. 26–37. [Google Scholar]
- Astell, A.; Ellis, M.; Bernardi, L.; Alm, N.; Dye, R.; Gowans, G.; Campbell, J. Using a touch screen computer to support relationships between people with dementia and caregivers. Interact. Comput. 2010, 22, 267–275. [Google Scholar] [CrossRef]
- Bellini, G.; Cipriano, M.; Comai, S.; De Angeli, N.; Gargano, J.; Gianella, M.; Goi, G.; Ingrao, G.; Masciadri, A.; Rossi, G.; et al. Understanding Social Behaviour in a Health-Care Facility from Localization Data: A Case Study. Sensors 2021, 21, 2147. [Google Scholar] [CrossRef] [PubMed]
- Yurkewich, A.; Stern, A.; Alam, R.; Baecker, R. A field study of older adults with cognitive impairment using tablets for communication at home: Closing technology adoption gaps using InTouch. Int. J. Mob. Hum. Comput. Interact. 2018, 10, 1–30. [Google Scholar] [CrossRef]
- Hermann, T.; Neumann, A.; Zehe, S. Head gesture sonification for supporting social interaction. In Proceedings of the 7th Audio Mostly Conference: A Conference on Interaction with Sound, Corfu, Greece, 26–28 September 2012; pp. 82–89. [Google Scholar]
- Kim, S.; Lee, K.P.; Nam, T.J. Sonic-badminton: Audio-augmented Badminton game for blind people. In Proceedings of the 2016 CHI Conference Extended Abstracts on Human Factors in Computing Systems, San Jose, CA, USA, 7–12 May 2016; pp. 1922–1929. [Google Scholar]
- McDaniel, T.L.; Villanueva, D.; Krishna, S.; Colbry, D.; Panchanathan, S. Heartbeats: A methodology to convey interpersonal distance through touch. In Proceedings of the CHI’10 Extended Abstracts on Human Factors in Computing Systems, Atlanta, GA, USA, 10–15 April 2010; pp. 3985–3990. [Google Scholar]
- Meza-De-Luna, M.E.; Terven, J.R.; Raducanu, B.; Salas, J. A Social-Aware Assistant to support individuals with visual impairments during social interaction: A systematic requirements analysis. Int. J. Hum. Comput. Stud. 2019, 122, 50–60. [Google Scholar] [CrossRef]
- Terven, J.R.; Salas, J.; Raducanu, B. Robust Head Gestures Recognition for Assistive Technology. In Proceedings of the Mexican Conference on Pattern Recognition, Cancun, Mexico, 25–28 June 2014; Springer: Singapore, 2014; pp. 152–161. [Google Scholar]
- Wang, N.; Yu, K.; Li, J.; Zhang, R.; Ren, F. Readful-U: Improving reading experience and social interaction for low vision elders. In Proceedings of the 2016 CHI Conference Extended Abstracts on Human Factors in Computing Systems, San Jose, CA, USA, 7–12 May 2016; pp. 80–85. [Google Scholar]
- Wu, S.; Wieland, J.; Farivar, O.; Schiller, J. Automatic alt-text: Computer-generated image descriptions for blind users on a social network service. In Proceedings of the ACM Conference on Computer Supported Cooperative Work, Portland, OR, USA, 25 February–1 March 2017; pp. 1180–1192. [Google Scholar]
- Zolyomi, A.; Shukla, A.; Snyder, J. Technology-mediated sight: A case study of early adopters of a low vision assistive technology. In Proceedings of the ASSETS 2017—19th International ACM SIGACCESS Conference on Computers and Accessibility, Baltimore, MD, USA, 29 October–1 November 2017; pp. 220–229. [Google Scholar]
- Rahman, A.K.M.M.; Anam, A.I.; Yeasin, M. EmoAssist: Emotion Enabled Assistive Tool to Enhance Dyadic Conversation for the Visually Impaired. IEEE Trans. Affect. Comput. 2017, 76, 7699–7730. [Google Scholar]
- Lee, K.; Sato, D.; Asakawa, S.; Kacorri, H.; Asakawa, C. Pedestrian Detection with Wearable Cameras for the Blind: A Two-way Perspective. In Proceedings of the 2020 CHI Conference on Human Factors in Computing Systems, Honolulu, HI, USA, 25–30 April 2020; pp. 1–12. [Google Scholar]
- Fleury, A.; Wu, G.; Chau, T. A wearable fabric-based speech-generating device: System design and case demonstration. Disabil. Rehabil. Assist. Technol. 2018, 14, 434–444. [Google Scholar] [CrossRef]
- Gilfeather-Crowley, P.; Smith, C.E.; Youtsey, S. Connecting visually-impaired people to friends through wireless sensor networks. In Proceedings of the 2011 IEEE International Conference on Systems, Man and Cybernetics, Anchorage, AK, USA, 9–12 October 2011; pp. 3224–3229. [Google Scholar]
- Qiu, S.; Han, T.; Rauterberg, M.; Hu, J. Impact of Simulated Gaze Gestures on Social Interaction for People with Visual Impairments. Adv. Transdiscipl. Eng. 2018, 7, 249–258. [Google Scholar]
- Braun, V.; Clarke, V. Using thematic analysis in psychology. Taylor Fr. 2006, 3, 77–101. [Google Scholar] [CrossRef]
- Beech, N. Basics of Qualitative Research: Techniques and Procedures for Developing Grounded Theory. Manag. Learn. 2000, 31, 521–523. [Google Scholar] [CrossRef]
- Charmaz, K. Constructing Grounded Theory: A Practical Guide through Qualitative Analysis; SAGE Publications: London, UK, 2006. [Google Scholar]
- Kuniavsky, M. Observing the User Experience: A Practitioner’s Guide to User Research; Elsevier: Amsterdam, The Netherlands, 2003. [Google Scholar]
- Hsieh, H.-F.; Shannon, S.E. Three Approaches to Qualitative Content Analysis. Qual. Health Res. 2005, 15, 1277–1288. [Google Scholar] [CrossRef] [PubMed]
- World Health Organization. Active Aging: A Policy Framework. 2002. Available online: https://apps.who.int/iris/handle/10665/67215 (accessed on 15 August 2021).
- Schroeter, C.; Mueller, S.; Volkhardt, M.; Einhorn, E.; Huijnen, C.; Heuvel, H.V.D.; van Berlo, A.; Bley, A.; Gross, H.-M. Realization and user evaluation of a companion robot for people with mild cognitive impairments. In Proceedings of the 2013 IEEE International Conference on Robotics and Automation, Karlsruhe, Germany, 6–10 May 2013; pp. 1153–1159. [Google Scholar]
- Dawson, G.; Rogers, S.; Munson, J.; Smith, M.; Winter, J.; Greenson, J.; Donaldson, A.; Varley, J. Randomized, Controlled Trial of an Intervention for Toddlers With Autism: The Early Start Denver Model. Pediatrics 2009, 125, e17–e23. [Google Scholar] [CrossRef] [PubMed]
- Morris, C.; Janssens, A.; Allard, A.; Coon, J.T.; Shilling, V.; Tomlinson, R.; Williams, J.; Fellowes, A.; Rogers, M.; Allen, K.; et al. Informing the NHS Outcomes Framework: Evaluating meaningful health outcomes for children with neurodisability using multiple methods including systematic review, qualitative research, Delphi survey and consensus meeting. Health Serv. Deliv. Res. 2014, 2, 1–224. [Google Scholar] [CrossRef]
- Toet, A.; Kaneko, D.; Ushiama, S.; Hoving, S.; de Kruijf, I.; Brouwer, A.-M.; Kallen, V.; van Erp, J.B.F. EmojiGrid: A 2D Pictorial Scale for the Assessment of Food Elicited Emotions. Front. Psychol. 2018, 9, 2396. [Google Scholar] [CrossRef]
- Bieri, D.; Reeve, R.A.; Champion, D.G.; Addicoat, L.; Ziegler, J.B. The faces pain scale for the self-assessment of the severity of pain experienced by children: Development, initial validation, and preliminary investigation for ratio scale properties. Pain 1990, 41, 139–150. [Google Scholar] [CrossRef]
- Nakano, Y.I.; Ishii, R. Estimating user’s engagement from eye-gaze behaviors in human-agent conversations. In Proceedings of the 15th International Conference on Intelligent User Interfaces, Hong Kong, China, 7–10 February 2010; pp. 139–148. [Google Scholar]
- Bednarik, R.; Eivazi, S.; Hradis, M. Gaze and conversational engagement in multiparty video conversation: An annotation scheme and classification of high and low levels of engagement. In Proceedings of the 4th Workshop on Eye Gaze in Intelligent Human Machine Interaction, Crete, Greece, 14–18 June 2012; pp. 1–6. [Google Scholar]
- Perugia, G.; Diaz-Boladeras, M.; Catala-Mallofre, A.; Barakova, E.I.; Rauterberg, M. ENGAGE-DEM: A Model of Engagement of People with Dementia. IEEE Trans. Affect. Comput. 2022, in press. [Google Scholar] [CrossRef]
- Rauterberg, M. How to access and transform the unconscious for cultural development. In Culture and Computing—HCII C&C (Lecture Notes in Computer Science); Springer Nature: Cham, Switzerland, 2021; Volume 12795, pp. 274–294. [Google Scholar]


| Target Population (N) | References | ||
|---|---|---|---|
| Older adults (21) | Older adults in general (14) | [17,58,59,60,61,62,63,64,65,66,67,68,69,70] | |
| Cognitive impairments (7) | Dementia | [18,71,72,73,74,75] | |
| Mild cognitive impairment | [76] | ||
| People with disabilities (44) | Visual impairments (20) | [19,28,29,30,31,32,33,34,77,78,79,80,81,82,83,84,85,86,87,88] | |
| Autism spectrum disorder (ASD) (9) | Children with ASD | [20,35,36,37,38,39,40,41,42] | |
| Listening and speech impairments (7) | People with deafness | [43,44,45,46,47] | |
| Deaf and dumb people | [48] | ||
| People with speech or language impairment | [49] | ||
| Mobility and physical impairments (5) | People with physical disabilities | [50,51,52] | |
| People with motion disability | [53] | ||
| People living with spinal cord injury | [54] | ||
| Others (3) | People with severe speech and physical impairments (SSPI) | [55] | |
| People with social communication disorders (SCD) | [56] | ||
| People with low vision, Alzheimer’s disease, and ASD | [57] |
| Data Gathering | References |
|---|---|
| Interview data (N = 31) | [18,33,34,35,38,39,40,41,43,44,45,53,54,56,59,60,61,62,63,64,68,70,71,72,76,78,80,82,83,84,87] |
| Questionnaire (N = 26) | [17,18,19,28,29,33,34,43,46,48,50,54,58,60,61,62,63,64,65,66,69,77,80,83,85,87,89] |
| Observational data (N = 24) | [17,19,20,35,38,39,40,41,42,52,53,59,61,62,67,70,71,72,73,74,76,78,82,85] |
| System log (N = 11) | [35,55,58,60,75,76,81,83,85,86,87] |
| User task performance (N = 10) | [17,28,30,31,32,36,56,70,77,79] |
| Functional validation (N = 6) | [32,34,51,57,80,88] |
| Physiological data (N = 4) | [19,33,36,37] |
| Questionnaire | Measures | References of Studies |
|---|---|---|
| Standardized questionnaire (N = 21) | Social interaction (N = 11) | IOS [19,33,62,64], ABC [63], UES [17], LSNS [65], 2DSIS [80], NMSPI [19], PIADS [54], Life-H [46], FACS-A [46], IAS [61], IMI [33] |
| Emotional state (N = 7) | SAM [43,64], UCLA-LS [65], PHQ9-DS [65], MHC-SF [65], PANAS [66], BFI [66], GDS [66] | |
| Usability (N = 3) | SUS [17,54,58], QUEST ([46,54,87]), COPM [50] | |
| Self-developed questionnaire (N = 13) | Social interaction and emotional state (N = 3) | [18,69,87] |
| Usability (N = 10) | [18,28,29,34,48,50,60,77,83,85] |
Publisher’s Note: MDPI stays neutral with regard to jurisdictional claims in published maps and institutional affiliations. |
© 2021 by the authors. Licensee MDPI, Basel, Switzerland. This article is an open access article distributed under the terms and conditions of the Creative Commons Attribution (CC BY) license (https://creativecommons.org/licenses/by/4.0/).
Share and Cite
Qiu, S.; An, P.; Kang, K.; Hu, J.; Han, T.; Rauterberg, M. A Review of Data Gathering Methods for Evaluating Socially Assistive Systems. Sensors 2022, 22, 82. https://doi.org/10.3390/s22010082
Qiu S, An P, Kang K, Hu J, Han T, Rauterberg M. A Review of Data Gathering Methods for Evaluating Socially Assistive Systems. Sensors. 2022; 22(1):82. https://doi.org/10.3390/s22010082
Chicago/Turabian StyleQiu, Shi, Pengcheng An, Kai Kang, Jun Hu, Ting Han, and Matthias Rauterberg. 2022. "A Review of Data Gathering Methods for Evaluating Socially Assistive Systems" Sensors 22, no. 1: 82. https://doi.org/10.3390/s22010082
APA StyleQiu, S., An, P., Kang, K., Hu, J., Han, T., & Rauterberg, M. (2022). A Review of Data Gathering Methods for Evaluating Socially Assistive Systems. Sensors, 22(1), 82. https://doi.org/10.3390/s22010082