Article

Assessment of Soil Moisture Anomaly Sensitivity to Detect Drought Spatio-Temporal Variability in Romania

1
Remote Sensing and Satellite Meteorology, National Meteorological Administration, 013686 Bucharest, Romania
2
Department of Geography, Faculty of Sciences, University of Craiova, 200764 Craiova, Romania
*
Author to whom correspondence should be addressed.
Sensors 2021, 21(24), 8371; https://doi.org/10.3390/s21248371
Submission received: 11 October 2021 / Revised: 24 November 2021 / Accepted: 13 December 2021 / Published: 15 December 2021
(This article belongs to the Special Issue Remote Sensing and GIS Applications on Groundwater Research)

Abstract

:
This paper will assess the sensitivity of soil moisture anomaly (SMA) obtained from the Soil water index (SWI) product Metop ASCAT, to identify drought in Romania. The SWI data were converted from relative values (%) to absolute values (m3 m−3) using the soil porosity method. The conversion results (SM) were validated using soil moisture in situ measurements from ISMN at 5 cm depths (2015–2020). The SMA was computed based on a 10 day SWI product, between 2007 and 2020. The analysis was performed for the depths of 5 cm (near surface), 40 cm (sub surface), and 100 cm (root zone). The standardized precipitation index (SPI), land surface temperature anomaly (LST anomaly), and normalized difference vegetation index anomaly (NDVI anomaly) were computed in order to compare the extent and intensity of drought events. The best correlations between SM and in situ measurements are for the stations located in the Getic Plateau (Bacles (r = 0.797) and Slatina (r = 0.672)), in the Western Plain (Oradea (r = 0.693)), and in the Moldavian Plateau (Iasi (r = 0.608)). The RMSE were between 0.05 and 0.184. Furthermore, the correlations between the SMA and SPI, the LST anomaly, and the NDVI anomaly were significantly registered in the second half of the warm season (July–September). Due to the predominantly agricultural use of the land, the results can be useful for the management of water resources and irrigation in regions frequently affected by drought.

1. Introduction

Drought is a complex phenomenon without a universal definition, being characterized by its implications in various fields, such as social, economic, and environmental [1]. The first visible negative effects of the drought are agricultural production [2] and natural ecosystems [3,4,5]. Agricultural drought, as defined by Wilhite and Glantz (1985), represents the decrease in soil moisture to a level that affects agricultural crops at different stages of crop development [6]. However, this decrease in soil moisture has a negative effect not only on agricultural vegetation but also on natural vegetation [7,8]. The increase in water demand due to climate change (decreasing precipitation and increasing temperatures) can lead to significant losses of biodiversity and ecosystem service [9]. Therefore, soil moisture is an essential climate variable (ECV) [10] of the land system [11,12].
In recent decades, drought events have increased in the South, Western, South-Eastern, and Central regions of Europe, while in the North and North-Eastern regions it has been decreasing [13,14,15]. The investigations of Spinoni et al. (2017) showed a significant increase in drought frequency in spring and summer, especially in the southern and western parts, and a decrease in autumn and winter in Northern and Eastern Europe [16]. The annual economic losses caused by drought are estimated in the PESETA IV project at approximately EUR 9 billion, for the EU and UK, and the highest losses being registered in Spain, Italy, and France [17].
Previous studies, based on the analysis of vegetation indices (derived from satellite data, for the period 2001–2020) have shown the frequency of spring drought in the first 10 years of the analyzed interval, while, in the last 10 years, this phenomenon occurred mainly in autumn [18]. At the regional level, the southern and eastern part of the country with increasing drought conditions is noticeable, while the northern part is highlighted by a tendency to increase humidity [19]. Regarding the frequency of the phenomenon, it is higher in the South and East [18].
Romania’s main economic sector affected by the drought conditions is agriculture. According to the inception report for the global water partnership (GWP) in Central and Eastern Europe (CEE), part of the world meteorological organization (WMO)/GWP integrated drought management program, about 14.7 million ha are frequently affected by drought in Romania [20]. In the last two decades, the largest agricultural areas affected were in 2007 (11.2 million ha), 2012 (10.3 million ha), and 2003 (9.6 million ha), followed by 2001, 2019, and 2020 [21]. The most affected areas are those in the South, Southeast, and East [18,22].
In most studies of drought, events were analyzed based on meteorological data, such as the precipitation, by calculating the standardized precipitation index (SPI) [23]; and precipitation and evapotranspiration, by calculating the standardized precipitation evapotranspiration index (SPEI) [24] or palmer drought severity index (PDSI) [25].
Furthermore, many studies are using remote sensing data in the optical, thermal, and radar field for drought assessment, including the normalized difference drought index (NDDI) [26], drought severity index (DSI) [27], vegetation temperature condition index (VTCI) [28,29], soil water index (SWI) [2], and soil moisture [30] from the European Space Agency Climate Change Initiative (ESA CCI) [31].
This study aims to analyze the quality of soil moisture anomalies obtained using the Metop ASCAT satellite to evaluate the spatio-temporal variability of drought events in Romania. The SMA was obtained based on SWI products at 3 essential depths: 5 cm (near surface), 40 cm (sub surface) and 100 cm (root zone). The results of this study can be used for the management of water resources available in agriculture.

2. Materials and Methods
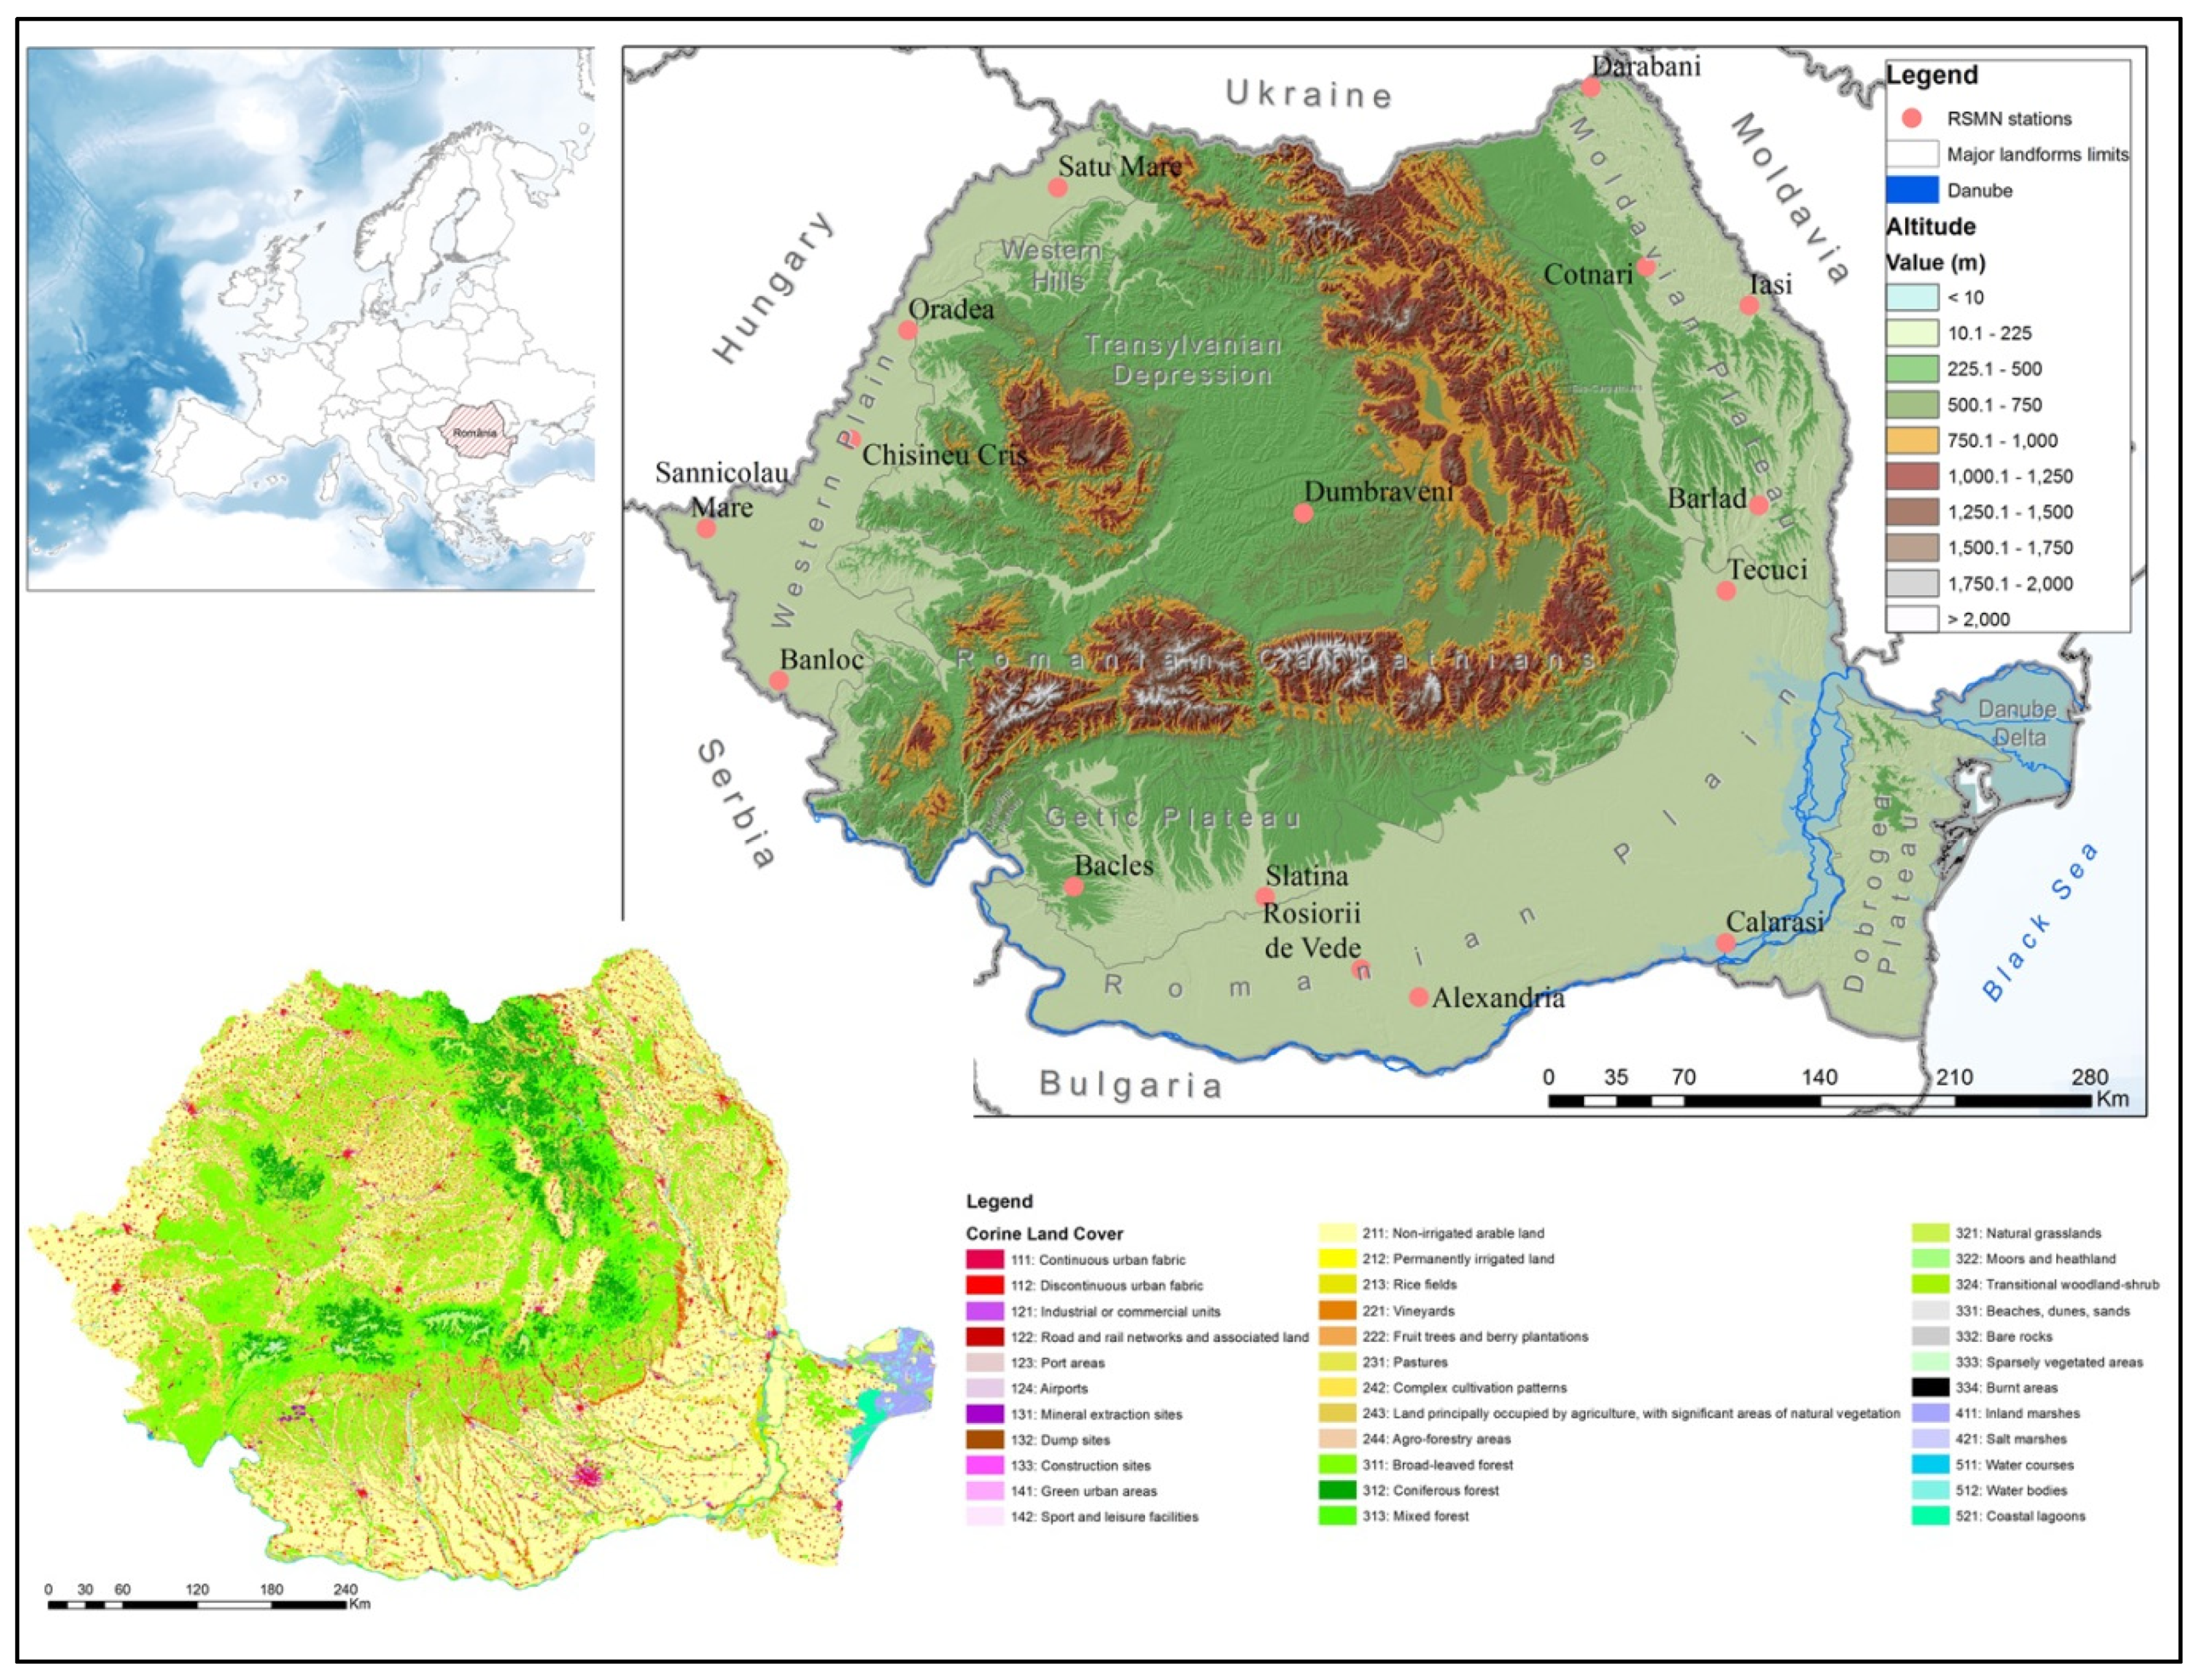
2.1. Study Area

Romania has approximately 238,500 km2, with major relief forms distributed concentrically [32]. The Transylvanian Depression is in the center and surrounded by mountains (the Carpathian) and hills. The plains are located outside the base of the Carpathian arc (Figure 1). Most of the country is used for agriculture. According to the National Institute of Statistics [33], the agricultural area occupies 61.8% of the country’s surface. Thus, cereal crops predominate in the plain regions; in the hilly regions, the orchard and vine cultures are dominant; and, in the mountainous areas, the alpine pastures are dominant. Southern and Southeastern Romania often faces severe drought phenomena that mainly affect agricultural crops [21,34]. The sandy soils from the South–West of the Romanian Plain; the degradation of the irrigation system, after the communist period [35,36]; and the deforestation (that causes the decrease in water retention and the increase in soil scattering [37]), leads to an accentuation of the drought phenomenon in the region.
According to the Köppen–Geiger climate map [38], most of the country has a temperate-continental climate, with warm summers and no dry season (Dfb). The South and Southwest of the Romanian Plain has a temperate-continental climate, with hot summer climate and no dry season (Dfa). In the Dobrogea Plateau and the Danube Delta, there is a cold semi-arid climate with a hot and dry summer and a cold winter (BSk).
The annual mean air temperature is between −2.4 °C, in the mountainous areas, and 13 °C in the plain areas (1981–2010), and the precipitation levels are between 229.3 mm and 1649.9 mm (1981–2010) [39]. The highest temperatures are recorded in the South and East of the country (the Romanian Plain, the Dobrogea Plateau, and the Danube Delta). Moreover, these regions have the lowest amounts of precipitation. The highest amounts of precipitation are recorded in the mountainous area.

2.2. Data and Methodology

2.2.1. Satellite Soil Moisture Products

SWI is an average product computed at a 10 day interval, 0.1° spatial resolution. It is freely provided by EUMETSAT H SAF through the program Copernicus Global Land Service (Https://land.copernicus.eu/global/products/swi, accessed on 15 June 2021), for the 2007–2020 time period [40,41]. In this regard, the 10 day average of the SWI product was analyzed. It is considered that the vegetation responds to the lack or excess of moisture within this time interval. The percentile calculation was performed based on all existing data (10 day averages). Thus, the areas with the lowest moisture (10 day synthesis) are highlighted. This product is available for various depths (5 cm, 10 cm, 15 cm, 20 cm, 30 cm, 40 cm, 60 cm, and 100 cm).
Starting from a 5 cm layer depth, it was modeled for all the above-mentioned depths, according to the product user manual [42]. The SWI is expressed in relative units (%). In this study we analyzed satellite products for depths of 5 cm, 40 cm, and 100 cm, and validation was performed only for data from 5 cm depths, which match the depth of the in situ measurements. The conversion into volumetric units (m3/m3) has been performed, in order to analyze the spatial distribution over Romania of soil moisture in volumetric units, and also to validate it with in situ measurements.
Therefore, the soil bulk density ( ρ b ) and mean density of soil particles ( ρ s ) for soil moisture (SM) conversion have been used, as presented in Equation (1) [43]:
SM = SWI [ ( 1 ρ b ρ s ) θ r ] + θ r
where ρ s is the mean density of the soil particles (constant value 2.65 g/cm3) [44,45]; θ r is the residual SM being calculated as the average of the minimum SM values recorded at the in situ stations, and the resulting value was 0.04 m3/m3; and ρ b is the soil bulk density (fine earth) 10 × kg/m3. The source of bulk density data used is provided by Hengl, 2008 [46]. Thus, considering that soil bulk density values are available for the depths of 0, 10, 30, 60, 100, and 200 cm, and the depths for the computed SWI products are 5, 40, and 100 cm depths, the average of 2 consecutive layers of soil bulk density was used (Figures S1–S3). The quality of the transformation result depended on the additional input data [47].

2.2.2. In Situ Soil Moisture

The in situ soil moisture datasets (5 cm depth) from the Romanian Soil Moisture Network (RSMN) [48], which are part of the International Soil Moisture Network (ISMN) [49,50], were used to validate the SM results. The data is freely available through the ISMN (https://ismn.geo.tuwien.ac.at/en/, accessed on 30 June 2021). The sensor used in the RSMN network is 5TM. It measures the dielectric permittivity at a frequency of 70 MHz, which minimizes the influences due to soil texture and salinity. The time interval between the soil moisture measurements is 60 min at a 5 cm depth. Moreover, the soil moisture observations are quality controlled by the National Meteorological Administration (NMA). In order to be able to compare them with the soil moisture in the SWI product, they were mediated at 10 day intervals. The differences between soil moisture from remote sensing and in situ were quantified by the standard statistical methods. Thus, the bias, median absolute error (MAE), root mean square deviation (RMSD), the Pearson correlation coefficient (r), and the Spearman’s rank correlation coefficient (rho) were calculated.
There are 4 soil moisture stations in the Romanian Plain, 5 stations in the Western Plain, 1 in the Transylvanian Depression, 4 in the Moldavian Plateau, and 2 in the Getic Plateau, covering a period of at least 5 years of registration. The characteristics of the RSMN dataset used in this study are summarized in Table 1.
The identification of drought events was based on the SMA using a z-score. This indicator was computed based on the SWI 10 day products. We calculated the average (µ), standard deviation (σ), and finally the anomaly (δ), according to Equation (2). The Shapiro–Wilk normality test was applied to check if the data is distributed normally or not. All the p values are larger than 0.05, thus, the distribution of the 10 day datasets is not significantly different from the normal distribution. The results can be found in the Supplementary: Table S1 and Figure S4. The resulting values were classified into 5 categories (3–for drought, 1–normal condition, and 1–wetter than normal), according to Table 2:
δ = x µ σ
where: x—is the 10 days period average; µ—is the average for the period 2007–2020; and σ—is the standard deviation, which is calculated for the same period (2007–2020).
The SMA was validated by several drought indices, including the NDVI anomaly and LST anomaly. Both the NDVI and LST were resampled to 0.1° for each 10 day period, between 2007 and 2020. The data used for the NDVI and LST anomaly were provided by the Terra-MODIS, MOD09GA product [52] and MOD11A1 product [53], respectively. Moreover, both indices are processed and downloaded using the Google Earth Engine (GEE) platform.
NDVI is a well-known vegetation index [54]. It is frequently used in studies aimed at analyzing the impact of drought on vegetation, the results being satisfactory [55,56]. The negative values of the NDVI anomaly (less than −1) represent browning vegetation, when they are between −1 and 1 they represent the vegetation in normal vegetation conditions, and when they are over 1 they represent greening vegetation.
LST is an essential climate variable with implications in land–atmosphere exchange processes [10]. High temperatures can contribute to an increase in evapotranspiration and drought. Thus, the positive values (above 1) of the LST anomaly often highlight drought occurrence due to thermal stress [57]. Moreover, there is a close correlation between the browning of vegetation resulting from NDVI, and the increase in temperature stress highlighted by LST [58,59,60,61].

2.2.3. Drought Indicators from Meteorological Data

According to the World Meteorological Organization (WMO), SPI is a key meteorological drought indicator, which is computed using the amount of precipitation that is typically accumulated at the intervals of 1, 3, 6, 9, 12, 24, or 48 months [62]. In this study, the SPI at 10 day intervals is calculated between 2007 and 2020, relative to the 1961–2020 reference period. The SPI classification is similar to that of the SMA, in Table 2. By using data registered at the meteorological stations, raster, with a resolution of 0.1°, were obtained. The data used are part of the archive of the National Meteorological Administration (NMA).

3. Results

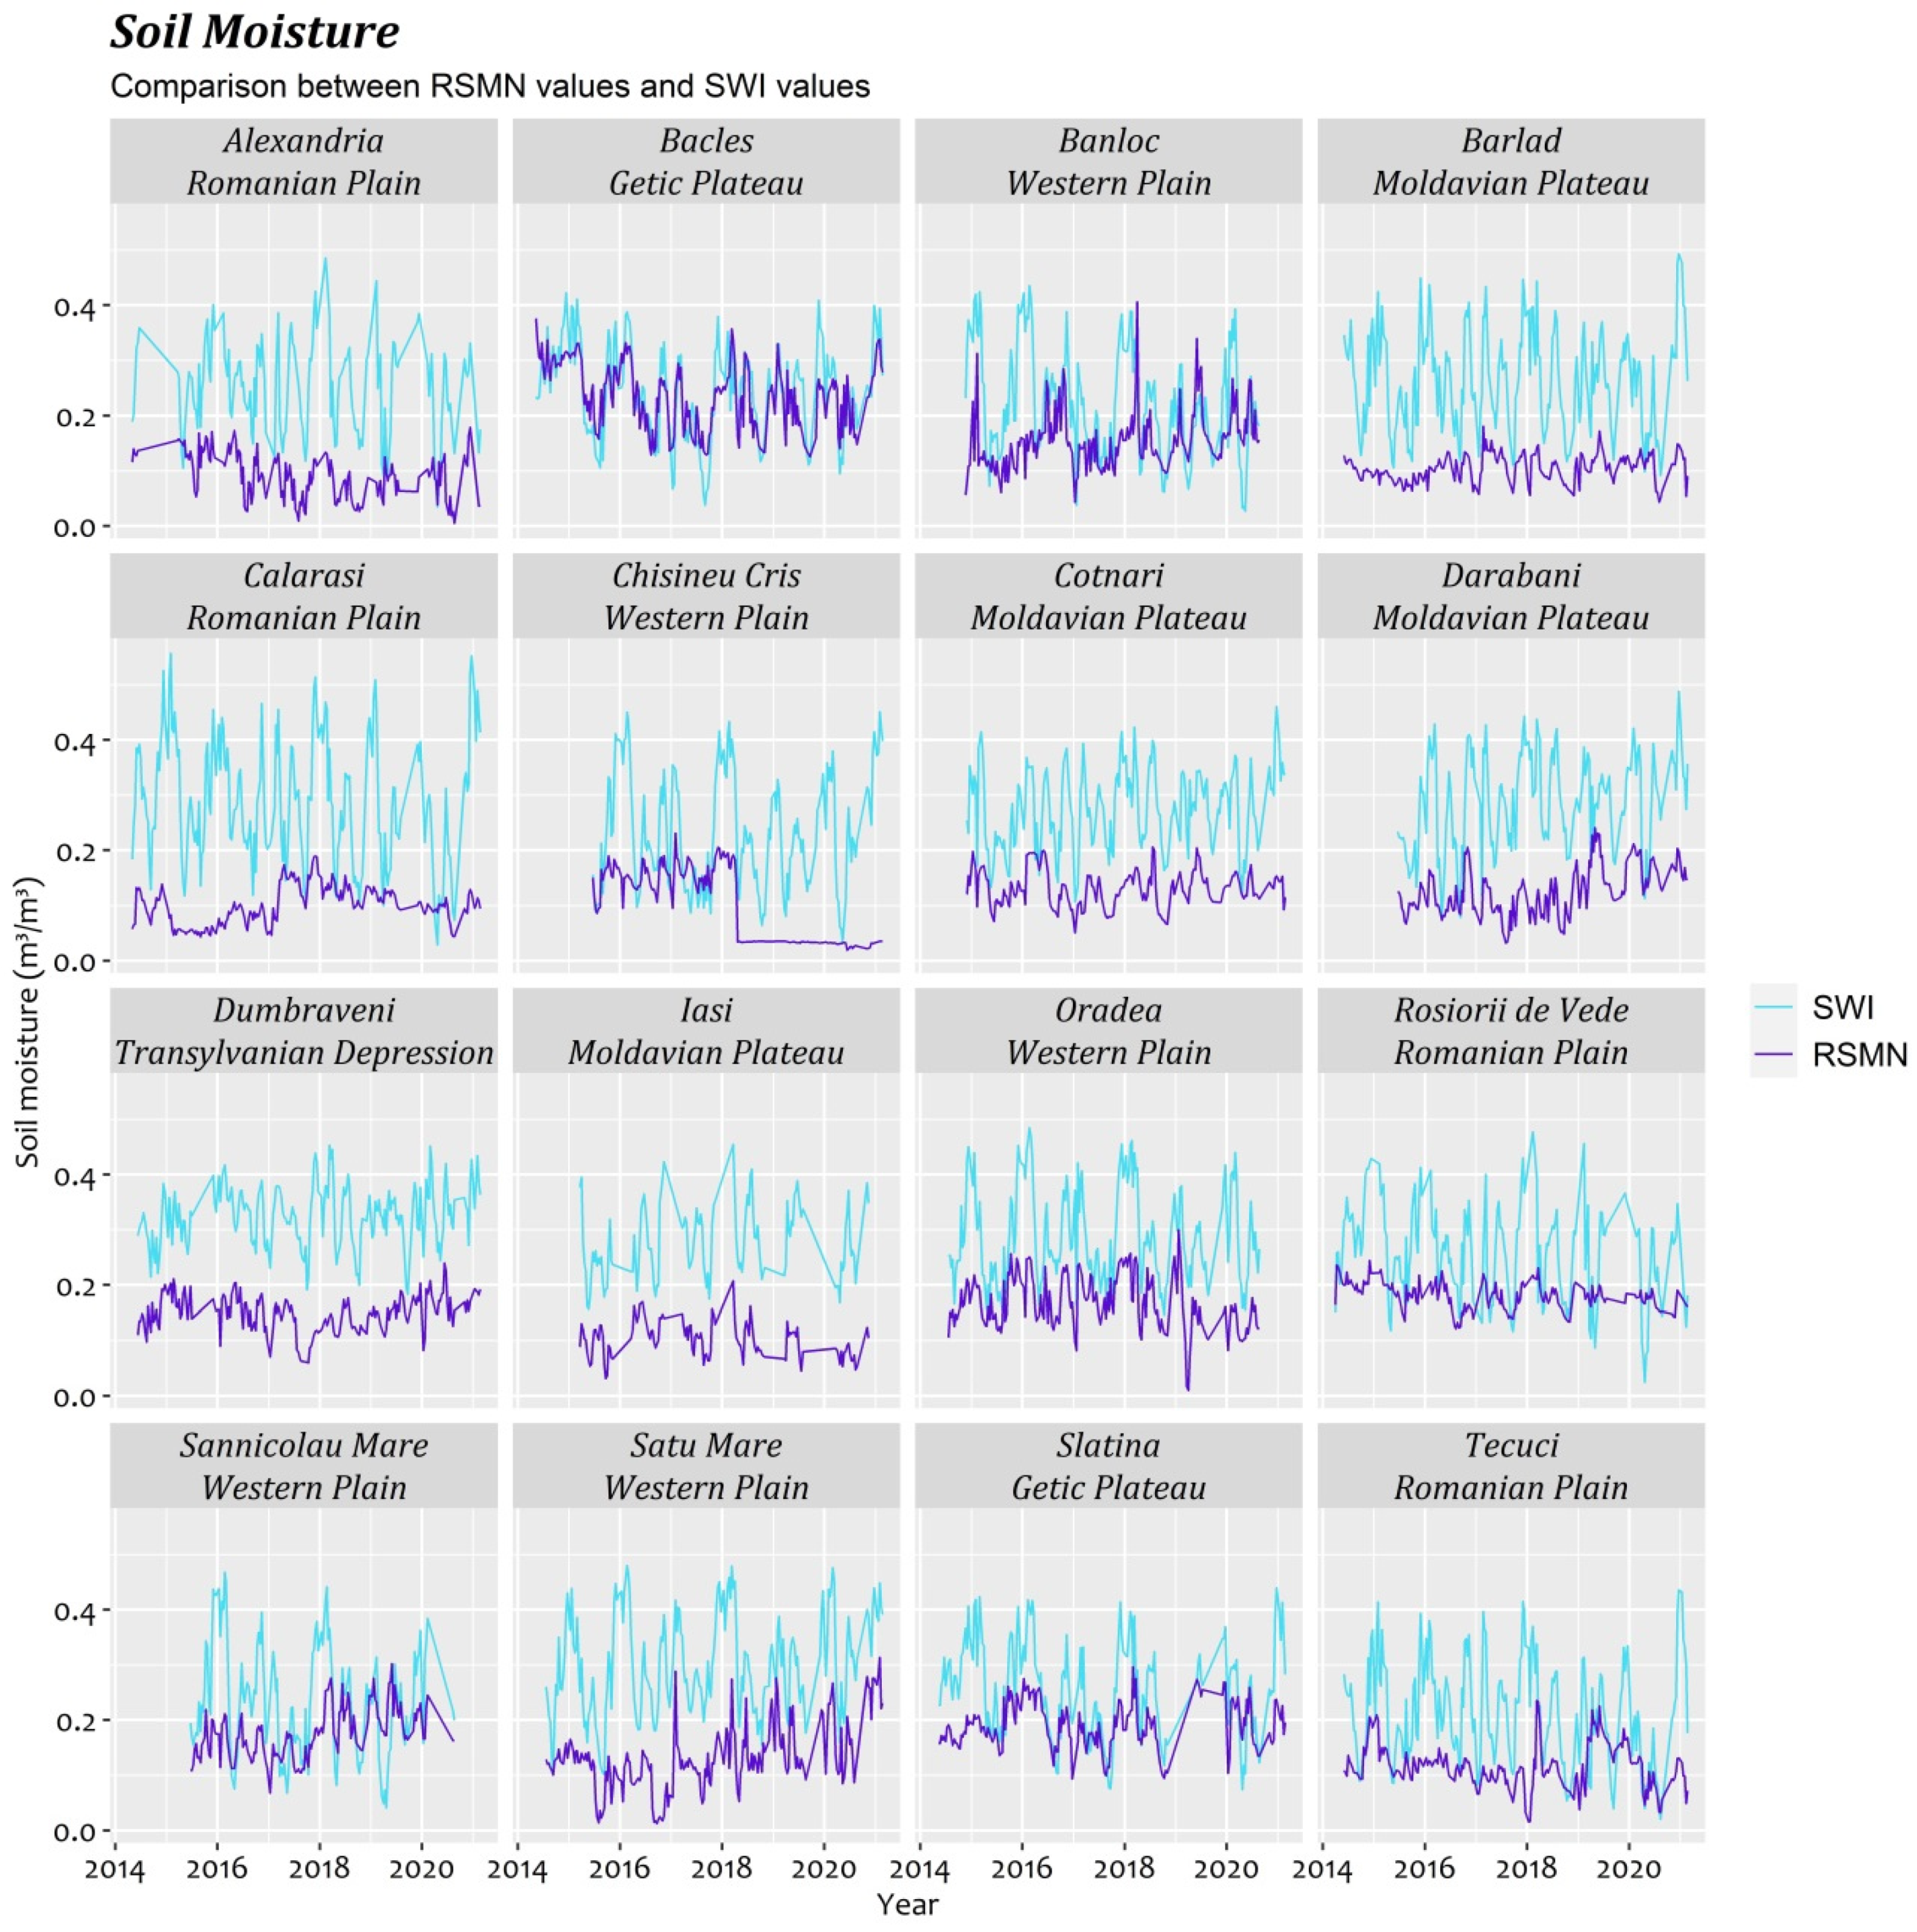
3.1. Soil Moisture Conversion Accuracy

Figure 2 presents the two data sets (remote sensing vs. in situ) for the period 2015–2020. We noted that, generally, satellite data overestimated the soil moisture. The estimated values of SM are higher than the in situ data at 10 of the 16 stations analyzed. However, there are some stations in which the correlation is satisfactory (Bacles, Banloc, Slatina, and Sannicolau Mare).
The correlation coefficients over 0.6 were obtained for the stations located in the Getic Plateau (Bacles (r = 0.797 and rho = 0.809) and Slatina (r = 0.672 and rho = 0.708)), in the Western Plain (Oradea (r = 0.693 and rho = 0.724)), and in the Moldavian Plateau (Iasi (r = 0.608 and rho = 0.591)), in Table 3. The average of the significant Pearson correlation coefficients (r) was 0.491 and Spearman (rho) was 0.51, while greater than 0.5 were at 8 out of 16 stations. However, the bias values are small, being between −0.009 at the Bacles station (located in a hill area at 313.0 m alt., being the second station with the highest altitude) and −0.186 at the Calarasi station (located in the low meadow area at 18 m alt., having the lowest altitude of all the analyzed stations). Overall, the mean value of bias per RSMN network was −0.122.
The RMSE and MAE values are between 0.05 and 0.184, and between 0.04 and 0.178, respectively. The lowest values were registered at the Bacles and Slatina stations, and the highest at Calarasi. The mean value of RMSE per RSMN network was 0.148 and MAE was 0.130.
There is a connection between the correlation coefficients and the percentage of sandy soil (r = 0.65) and the percentage of clay soil (r = −0.56). It was observed that where the sand percentage in the soil is higher and the clay percentage in the soil is lower, the correlation between the satellite and in situ data is better. Moreover, it was observed that the correlation is better at the stations located at higher altitudes than those located at lower altitudes, with r = 0.53. Furthermore, no connection was identified between these differences or the distribution of the stations by major landforms, or by latitude and longitude.

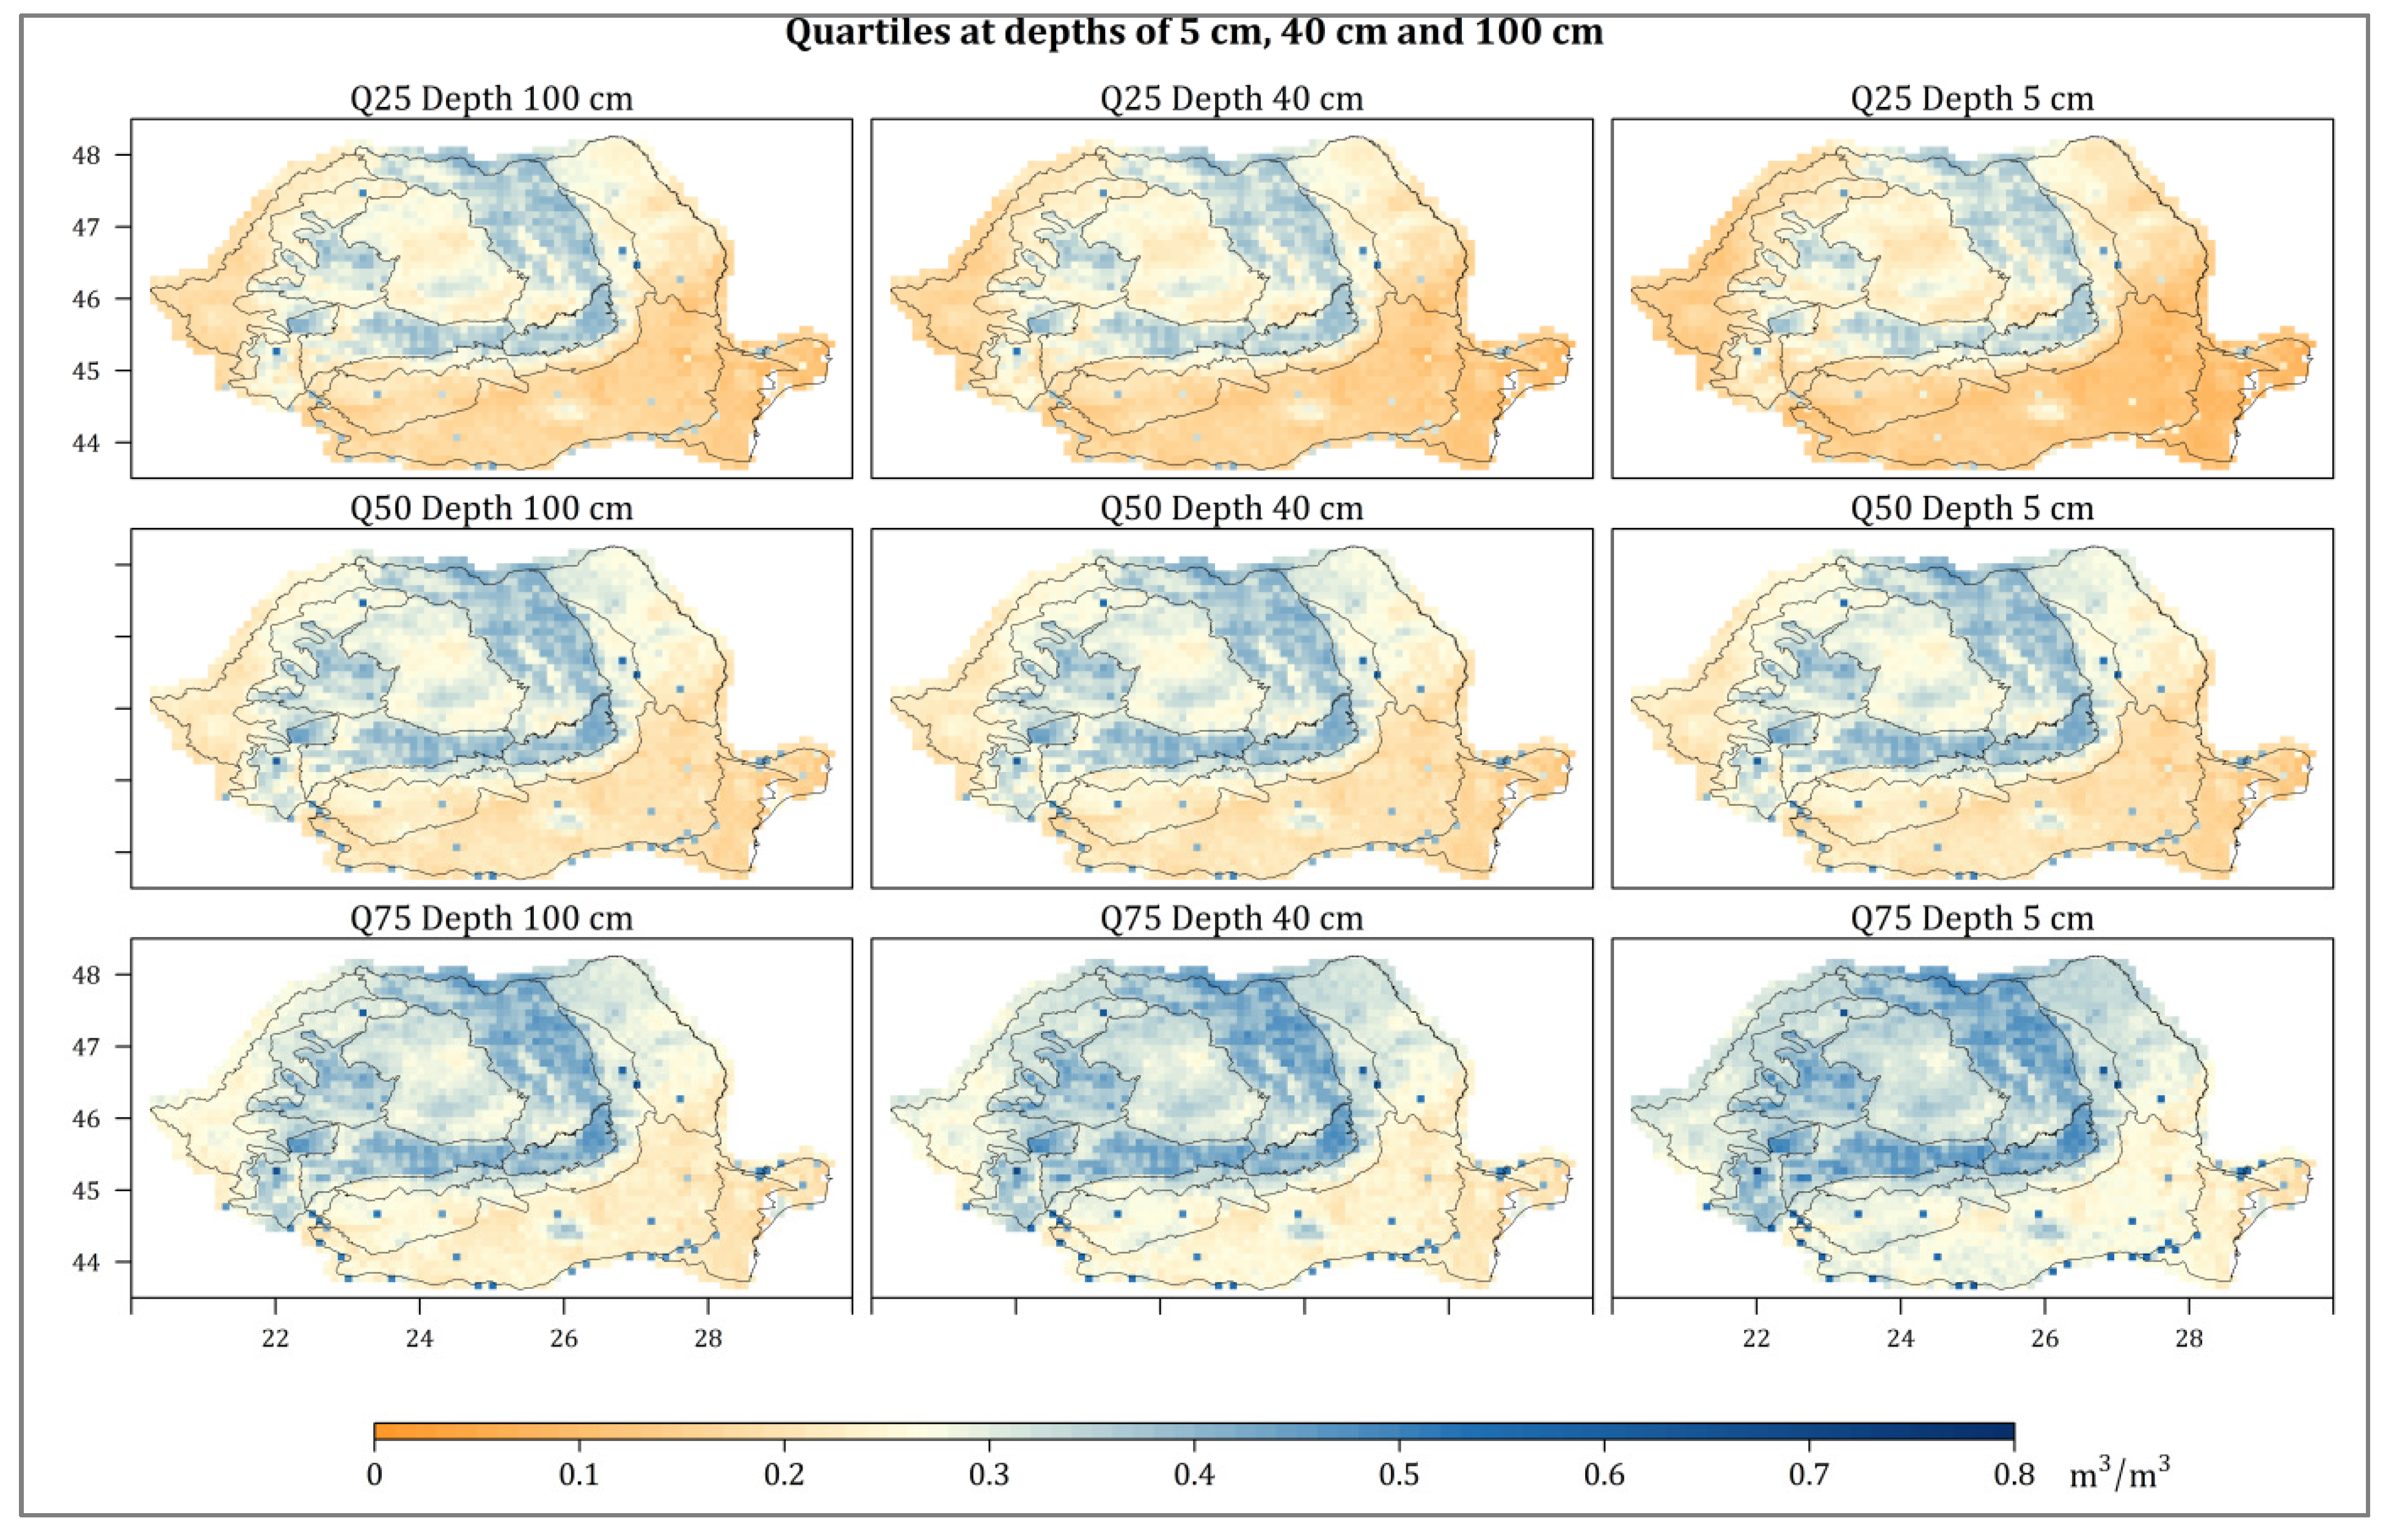
3.2. Soil Moisture Distribution (2007–2020)

In order to better highlight the spatial distribution of SM in Romania, the values of the first quartile (Q1 or 25%), the second or median quartile (Q2 or 50%), and the third quartile (Q3 or 75%) were extracted. Therefore, the first quartile shows the dry areas in the country.
According to the Q1 of SM at 5 cm depth, the lowest values of the SM are registered in the South-East of Romania, in the low meadow area and to the east of the Romanian Plain, the South of the Moldavian Plateau, the entire Dobrogea Plateau, and the Danube Delta (0.06 to 0.13 m3/m3), as is presented in Figure 3. Therefore, the southeast area can be considered as the driest in Romania, in which the soil moisture frequently registers low values (<0.13 m3/m3), hence the high risk of drought. In the South and Southwest of the Romanian Plain and in the Western Plain, the values are slightly higher (between 0.13 and 0.18 m3/m3), gradually increasing with the altitude. The MS at 40 and 100 cm depth has slightly higher values than at 5 cm depth, but the same spatial distribution is maintained at the country level. Q2 and Q3 highlight the same spatial distribution of SM in Romania as Q1. However, the values are approximately 0.1 m3/m3 and higher. The distribution of soil moisture in Romania corresponds to the type of climate in each area [63].
At a monthly level, the mean values of SM at 5 cm depth in the period 2007–2020 in the Romanian Plain, was about 0.18 m3/m3 in the April–May period, and slightly higher (0.22 m3/m3), in September–November. Generally, the values decreased from West to East. Moreover, the low values of SM in April–May were recorded in the Dobrogea Plateau (0.15 m3/m3).
At 40 cm and 100 depths, the lowest monthly average values were registered in the Romanian Plain and the Dobrogea Plateau in May–August (about 0.17 m3/m3), and the highest in November–December (about 0.21 m3/m3 in the Romania Plain and 0.19 m3/m3 in the Dobrogea Plateau). Slightly lower values were observed at 40 cm and 100 cm depths compared to 5 cm (at the surface) in the Romanian Plain, while, in the Dobrogea Plateau, the values in depth were higher than those at the surface.

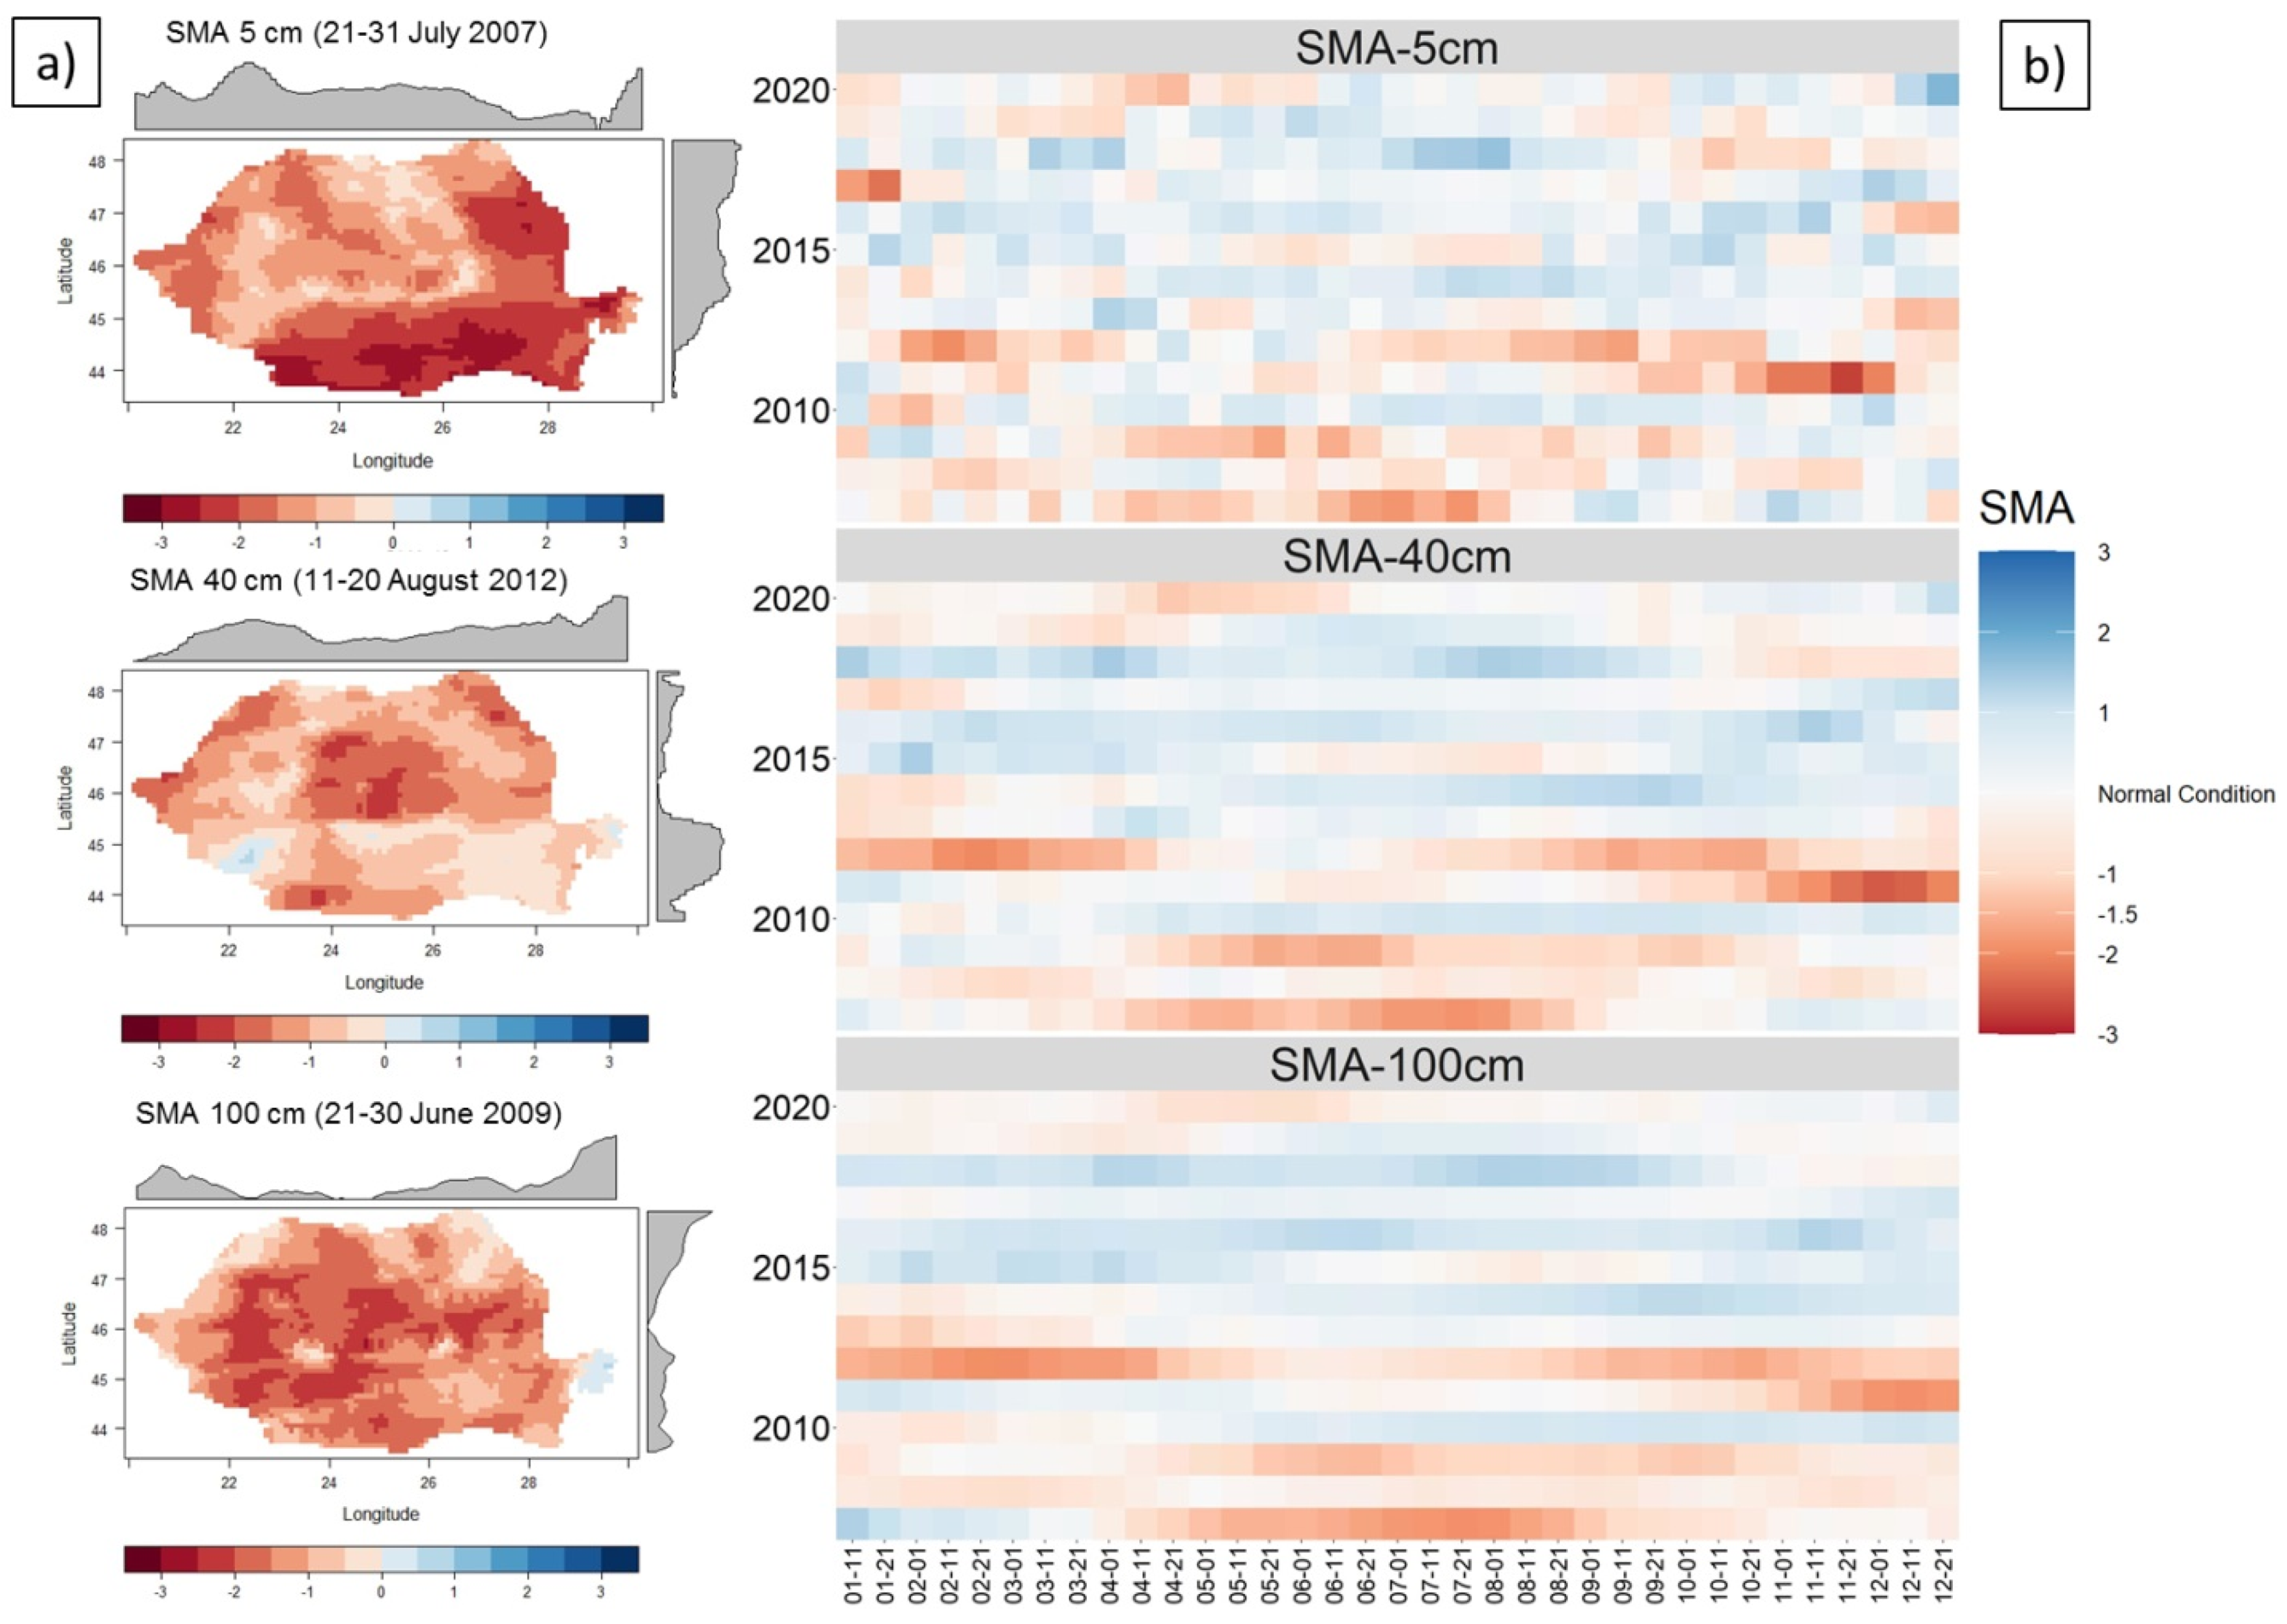
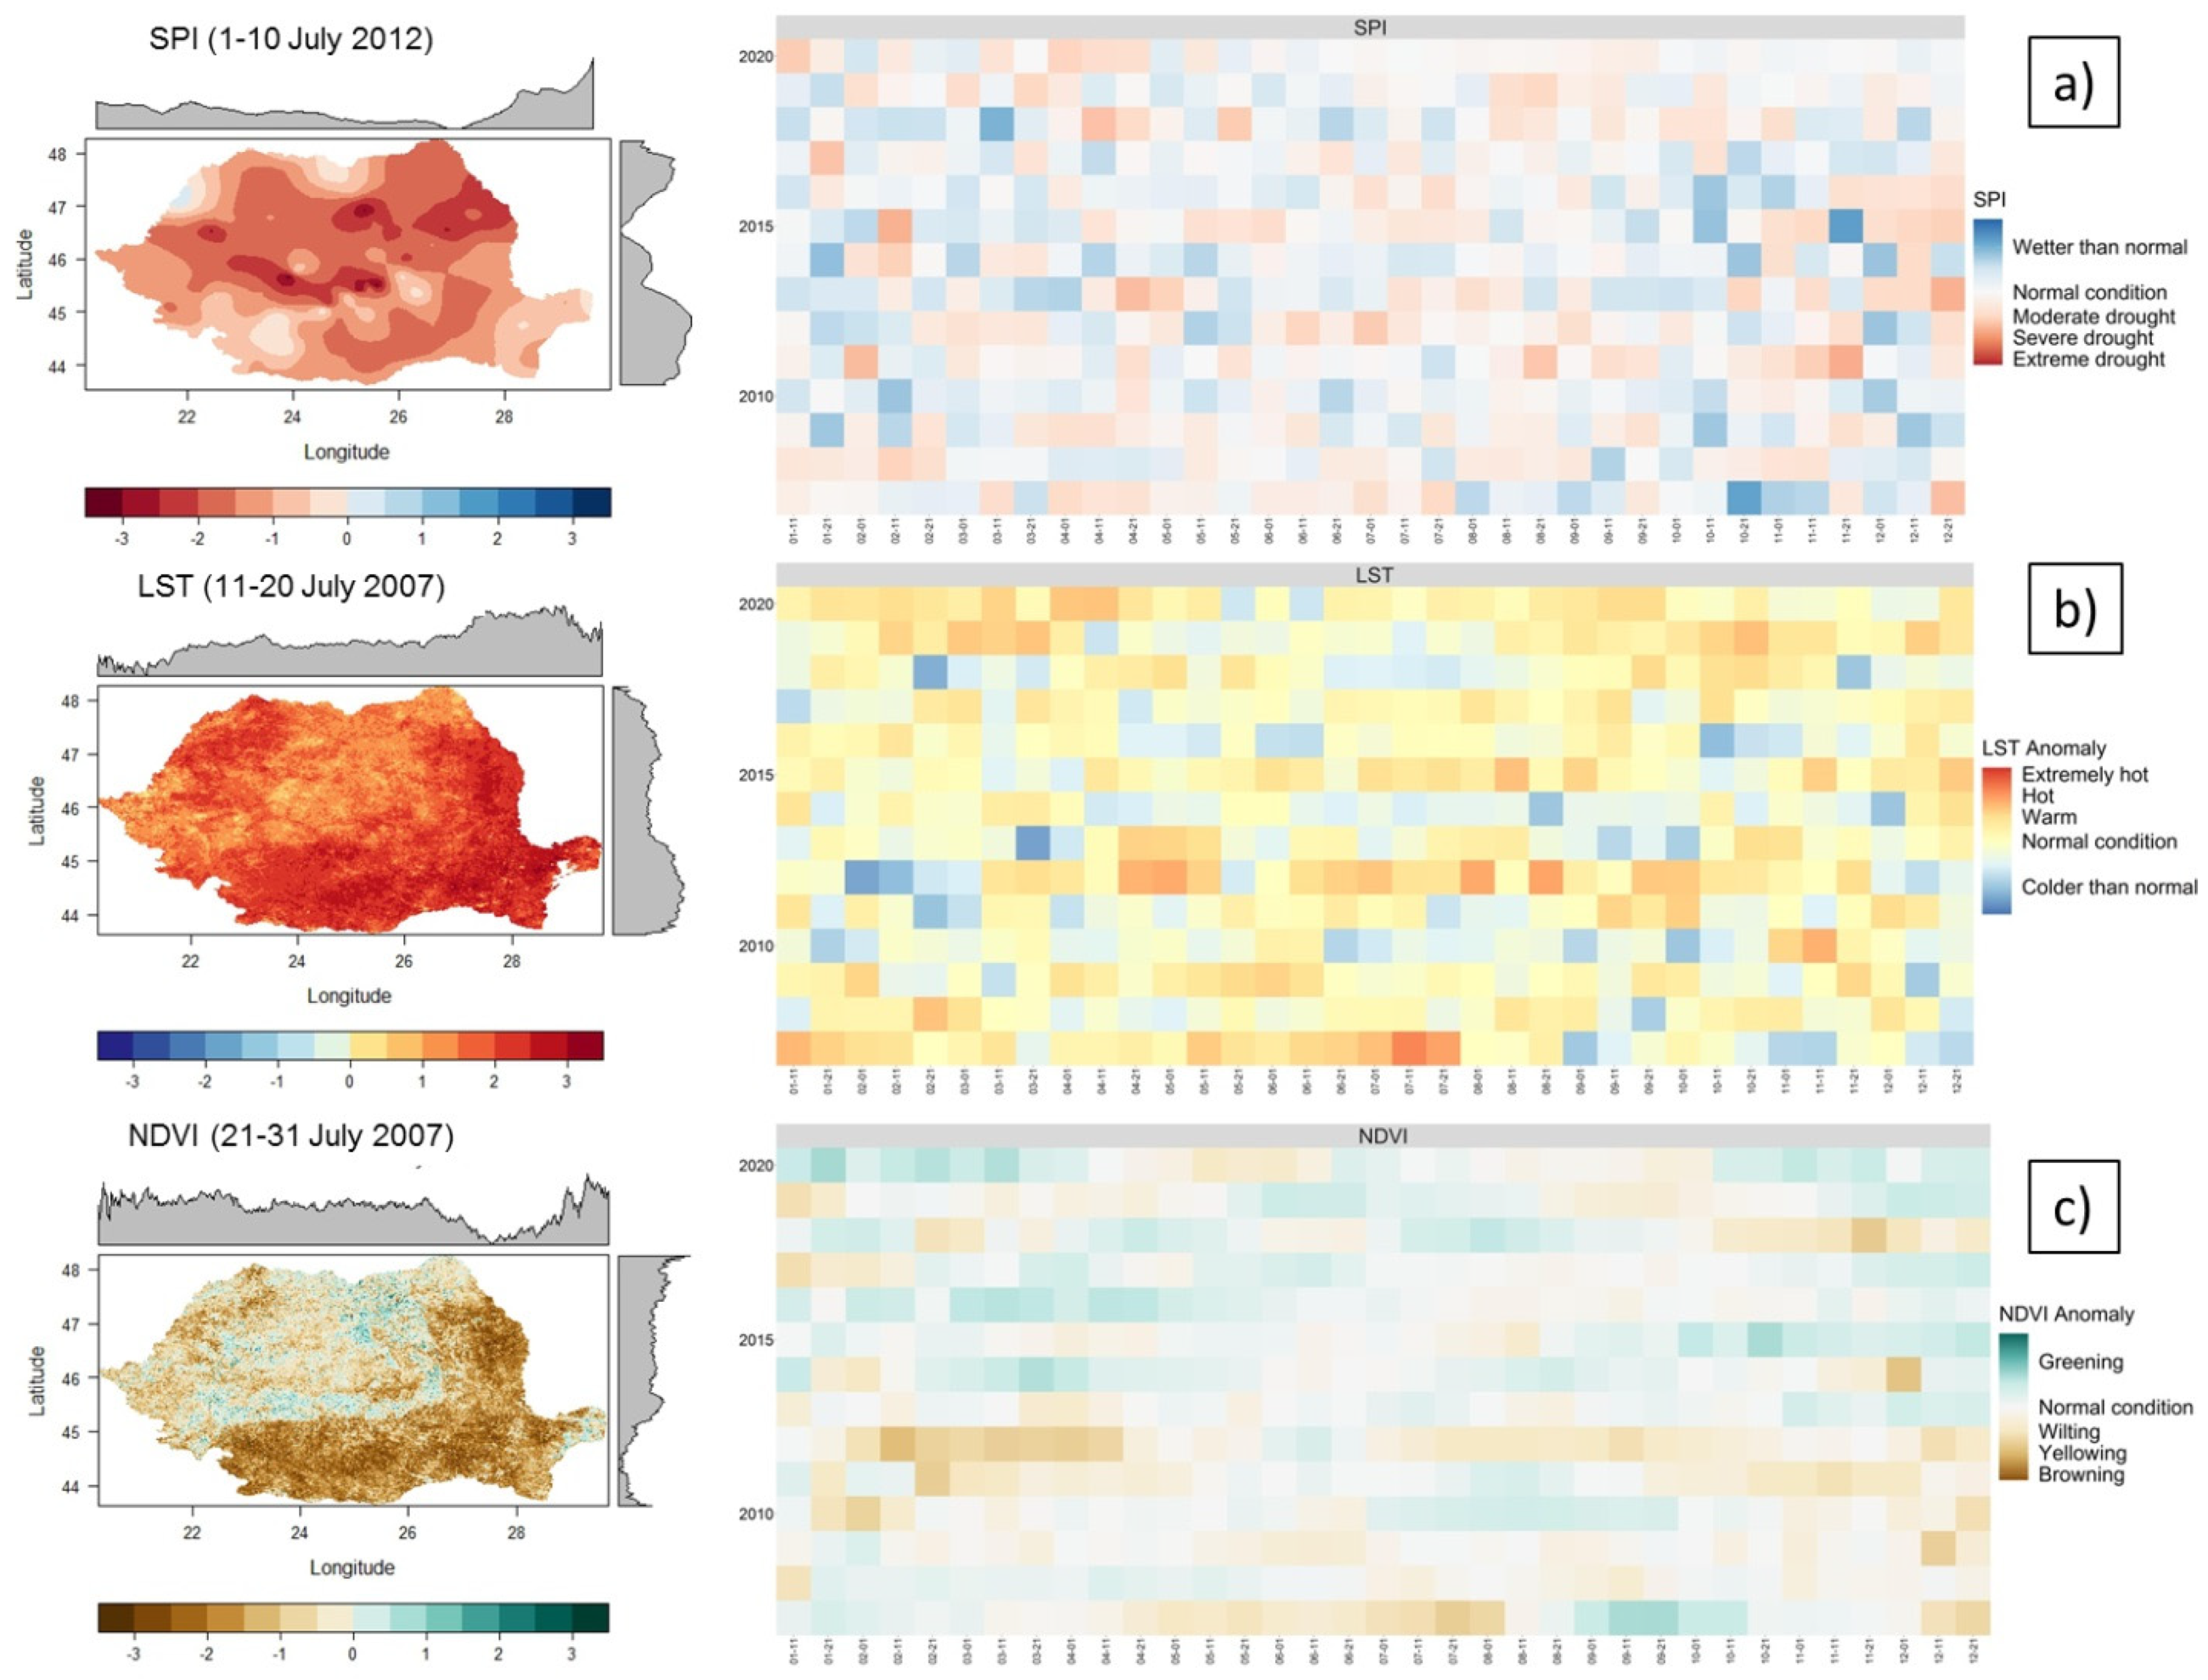
3.3. Drought Description according to SMA in Romania

SMA was used to characterize the intensity, spatial extent, and duration of the drought event. Therefore, the extreme and severe droughts were recorded at the beginning of the analyzed period, in 2007–2009, 2011, and 2012 (Figure 4). The first driest year was 2007 and the second was 2012. Moderate drought was recorded, especially in the years after 2015 when an increase in soil moisture was observed, especially in depth (100 cm). Additionally, the dry events at 40 cm, and 100 cm depths are longer compared to those at 5 cm, where there is a greater variability of SM.
In 2007, the extreme drought affected all of Southern (Romanian Plain) and Eastern Romania (the Moldavian and Dobrogea Plateau), while, in 2012, it mainly affected the center (Transylvanian Depression), west (Western Plain), and southwest (Romanian Plain). In 2009, the extreme drought was recorded mainly in the central part of Romania, but also in small areas in the South and East of the country. Severe and moderate drought are the most frequent types of drought present in Romania. These affected large agricultural areas (over 5 million ha) in 2009, 2011, 2012, 2018, 2019, and 2020 (at 5 cm depth). Extreme drought was recorded in 2007 (almost 5.7 million ha affected between 21 and 31 July, at 5 cm depth), 2011 (7.1 million ha affected between 11 and 20 Nov, at 5 cm depth), and 2012 (5.7 million ha affected between 1 and 10 April, at 100 cm depth). The agricultural surfaces affected by drought, in the driest years, are presented in Table S2.

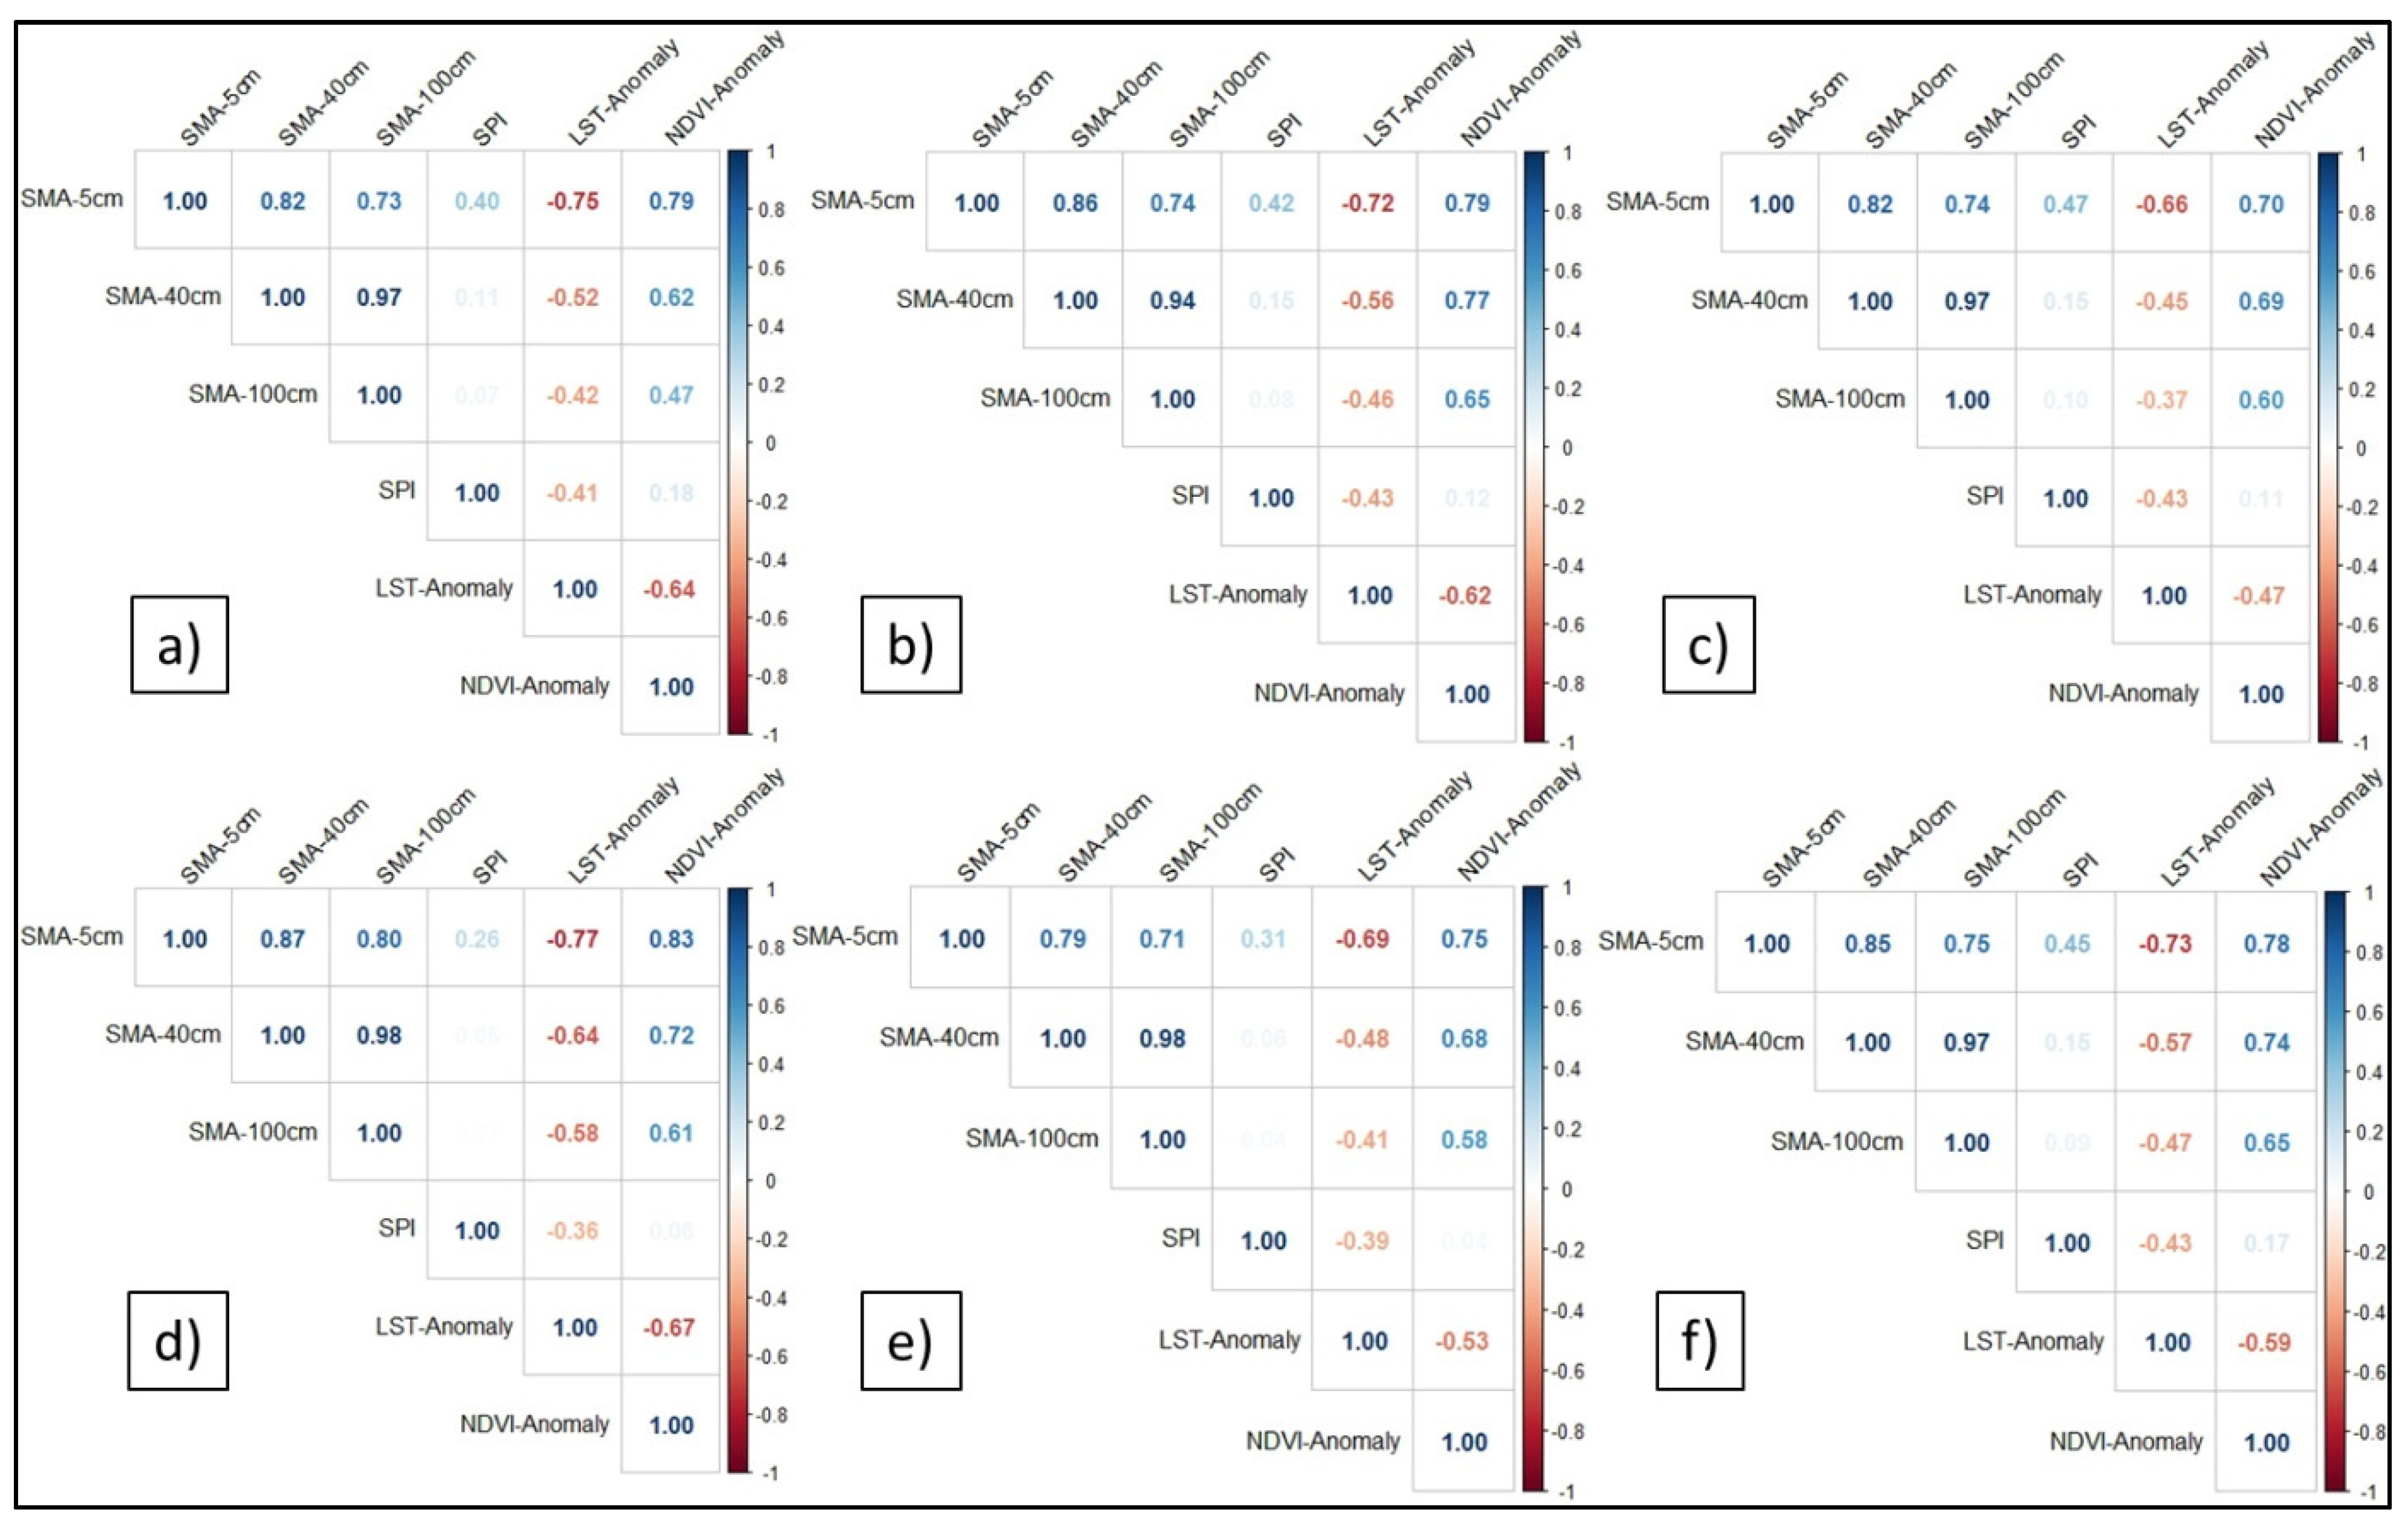
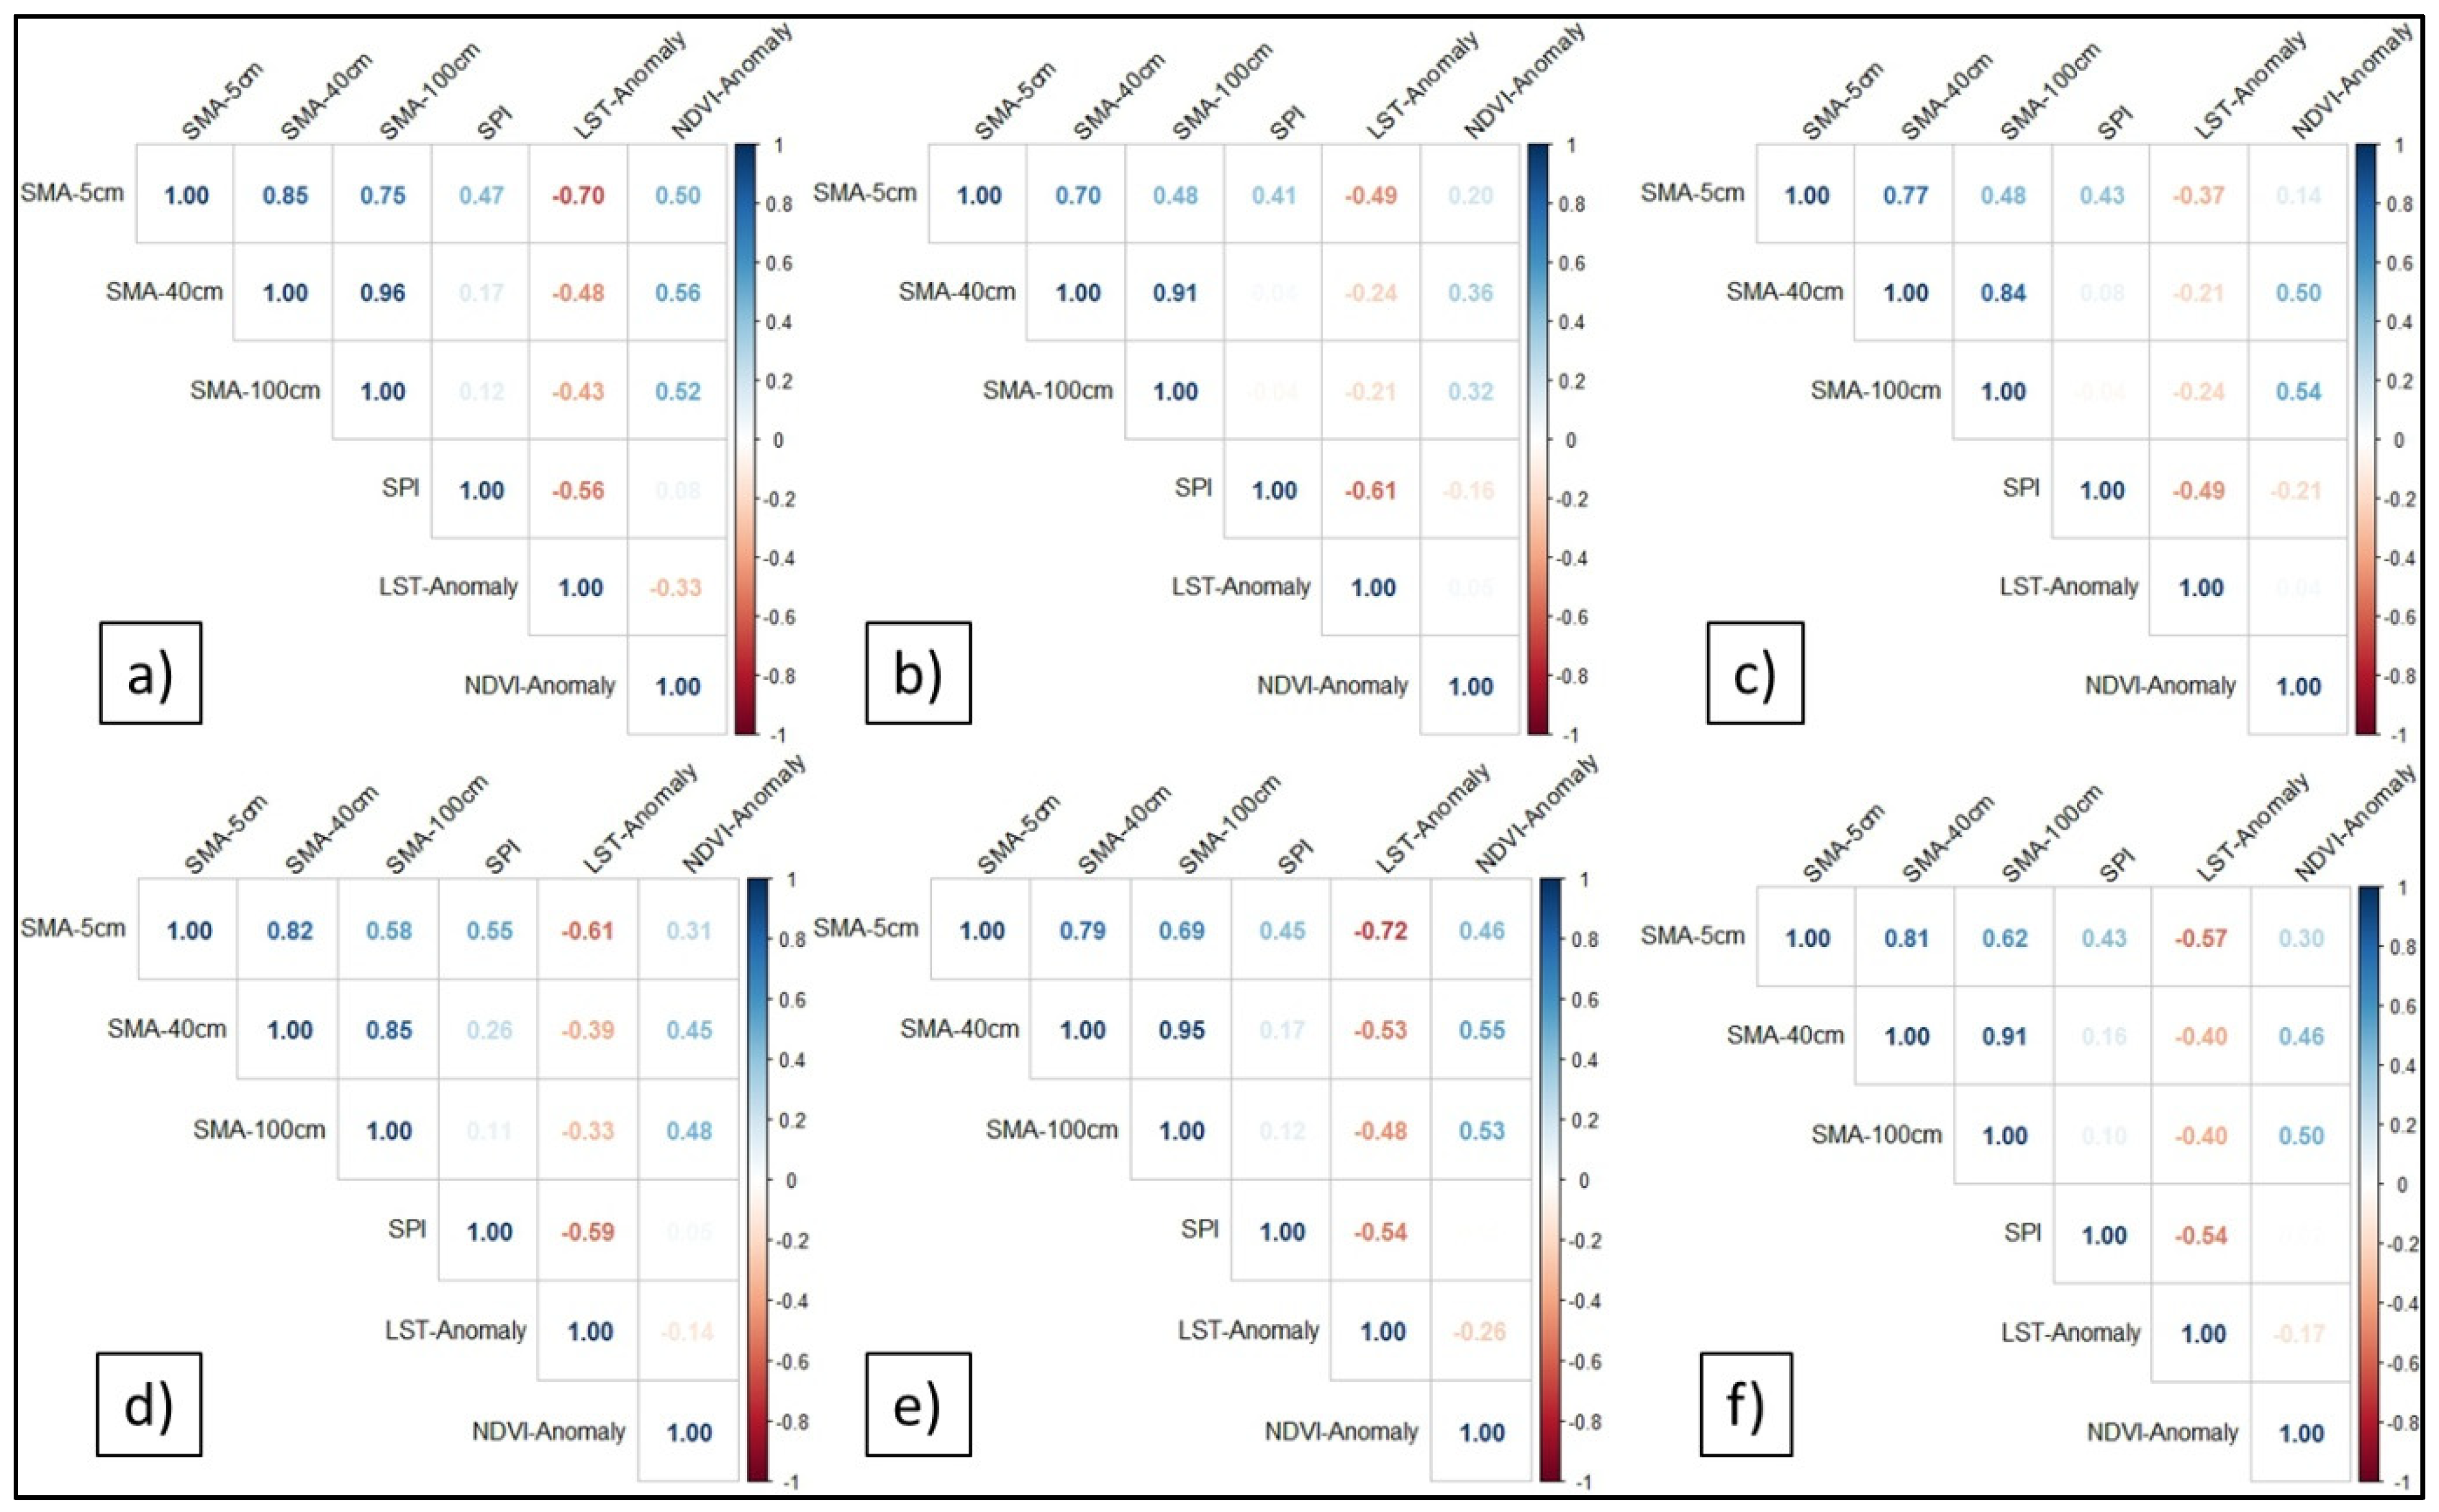
3.4. Correlation of Drought from SMA with SPI, LST, and the NDVI Anomaly

The SPI, LST anomaly, and NDVI anomaly were computed in order to identify the possible connection with SMA. Figure 5 presents the mean values of the three indicators in Romania (right side), and one example for each indicator with spatial extensions (left side). The values are the mean for the entire surface of Romania.
The SPI indicated normal conditions in terms of accumulated precipitation over 10 day, intervals for most of the analyzed period. However, there have been 10 day periods with moderate and severe drought over a large area of Romania (2011–2012).
The LST anomaly showed a positive anomaly of temperatures, with long warm or hot periods in 2008–2009, 2015, and 2018–2020, and extremely hot periods in 2007 and 2012. The NDVI anomaly showed a yellowing to browning of the vegetation mainly in the last two years mentioned. Furthermore, it highlighted the browning vegetation in the spring of 2012. This negative anomaly can be due to the drought at the end of 2011, which especially affected the autumn crops.
Finally, by using the Pearson correlation coefficient, the agreement between the drought obtained from SMA and the common indices (SPI, LST anomaly, and NDVI anomaly) has been evaluated for Romanian major landforms. Initially, the correlations were analyzed over different time intervals (annual and seasonal), but it was found that the best correlation was recorded for the July–September interval (Figure 6), followed by the April–June interval (Figure 7).
Generally, the results showed a moderate-to-strong positive correlation between the SMA and NDVI anomaly, and a moderate-to-strong negative correlation between the SMA and LST anomaly, for all the landforms in the second part of the warm seasons (July–September) (Figure 6). SMA and SPI have weaker correlations. However, these results need to be further studied by increasing the time step of the SPI from 10 days to at least 1 month. Furthermore, the correlation coefficient is higher for SMA at 5 cm and lower for 40 cm and 100 cm depths.

4. Discussion

Several aspects related to the soil moisture estimated from Metop ASCAT and related to drought from SMA were observed.
The estimated data form about half of the 16 in situ soil moisture stations in Romania match those measured. The issue of validating soil moisture can be due to the mismatch in spatial scales [64]. The in situ data are values measured at a single point, while satellite data are observed values over an area of 0.1°. However, we observed a good correlation at the stations located on soils with a high percentage of sand and a low percentage of clay. According to Liu et al. (2010) [65], the effect of cracking soils can occur during dry periods if the percentage of clay is high, resulting divergences between satellite data and those measured punctually at the station. Rainwater is no longer evenly distributed on the surface but accumulates in the cracks formed, so the sensor at the station can register a lower or higher value than the needles recorded by the satellite sensor.
The general results of our validation match those of the SWI product validation reports [66,67]. However, the results presented in those reports are from stations in which a good correlation was observed, such as Bacles or Oradea. The stations with poor correlation results, such as Calarasi and Alexandria, were omitted. These are located in the main agricultural areas of the country and it is important to know how accurate the soil moisture estimate is. Therefore, it was necessary to make this analysis in order to be able to go further in the analysis of the drought. However, in Romania there are a limited number of automatic stations for measuring the soil moisture. The correlations between the two data sources were made only for the locations with measurements for the available period of time (2015–2020). At the same time, the in situ sensors perform measurements at a fixed point, which is not representative of neighboring areas, compared to the satellite images that provide information at the regional or global level.
Even if there is a difference between the estimated and the measured data, the drought events identified by the SMA method match those identified by the NDVI anomaly and the LST anomaly, and less by the SPI. The short time interval (10 days) compared to the typical one for which the SPI is calculated (1, 3, 6 months, and so on), did not allow the clear identification of the periods with severe or extreme drought, already known in the literature [22,68]. Moreover, according to Sehler et al. [69], the precipitation and soil moisture have weaker correlations in temperate areas and areas with higher amounts of precipitation, compared to areas in which small amounts of precipitation are recorded. This would explain the different results from one relief unit to another, as well as from one season to another. For example, compared to the Romanian Plain, the amount of precipitation in the Western Plain is higher and drought occurs occasionally and less intensely, thus explaining the weak correlation.
Some areas of Romania, such as the Romanian and Western Plains, are frequently affected by heat waves and drought [2,70,71], and the increase in aridity in these regions is projected [72]. The main cause of drought occurrence is the high temperature that causes the decrease in soil moisture, having a negative impact on vegetation. Moreover, the drought of the last decades has led to a decrease in groundwater resources in Eastern Romania [73,74]. In Southern Romania, the air temperature exceeded 40 °C in 2007 [75] and 35 °C in 2012 [71], also obviously influencing the LST. The high temperatures combined with low rainfall mainly affected agricultural crops, causing lower production levels. The agricultural areas affected by the drought, as it results from the SMA, are close to those that resulted from our previous work [21]. However, the differences exist as a result of the differences in spatial resolution and the reference periods taken into account (2007–2020 compared to 2001–2019). Previously, the results were based mainly on optical satellite images, and, in the present paper, the results are based on SAR data. In this paper, the surfaces affected by droughts at different depths (5 cm, 40 cm, and 100 cm) have been quantified. It can be observed that there are differences in the extension of the surfaces affected by the drought at surface level (5 cm) compared to those in depth (40 cm and 100 cm).
The changes in soil moisture at 40 cm and 100 cm depths are less sensitive to the changes in precipitation compared to the surface layers [76]. Water infiltration into the lower layers of the soil depends on its texture and structure, but also on the amount and intensity of precipitation [77]. This is mainly due to the amount of precipitation that evaporates before reaching the lower layers of the soil. Additionally, wind erosion has a significant effect on drought, especially in sectors with sandy soils (Romanian Plain) [78]. Moreover, the heavy rain causes a rapid drainage of water on dry soil [79]. Compaction and crusting act mainly in the plain region in the South and West of the country, in which these processes are most widespread [78]. Therefore, even if the monthly precipitation registered at the meteorological stations does not highlight a drought event, the soil moisture in the lower layers of the soil can have values below the normal period. The occurrence of drought at the depths of 40 cm and 100 cm could have a negative impact on drought-prone plant communities [80]. Water erosion is a strong drought-amplifying factor in the Dobrogea Plateau (the main area of the country subject to desertification), as well as in the Barlad Plateau (South of the Moldavian Plateau), and in the Getic Plateau [81].

5. Conclusions

The results of the study led to the following conclusions:
(i)
They comply with the results of the validations performed in other studies from other regions. The RMSE were between 0.05 and 0.184, and the mean correlation coefficient (r) was 0.491. The correlation between the measured data and those recorded from satellite data, represents a challenge that will be studied in detail in future studies.
(ii)
The results indicated that the lowest soil moisture values are in the entire Romanian Plain and Dobrogea Plateau, Western Plain, and southern parts of the Moldavian Plateau. By knowing the areas with low soil water content values, the feature of irrigation can be improved.
(iii)
SMA highlighted very well two excessively dry agricultural years (2011–2012 and 2007). They appeared in the official reports as having a recurrence period of 3 events at 10 years, respectively 1 event at 25 years [81]. Moreover, other drought events have been identified, such as those in 2009, 2019, and 2020. The results of the correlation between SMA and various drought indices (SPI, the LST anomaly, and NDVI anomaly) are confirmed by previous studies [24,82]. Thus, a moderate-to-strong correlation was observed in the July–September interval compared to the April–June interval, in which a weak correlation was observed.
Future studies should aim to test other methods of transformation from relative values (%) to absolute values (m3/m3), such as cumulative distribution function (CDF) matching [83], and add other drought indicators, such as SPEI [84], that take into account evapotranspiration to validate the results.

Supplementary Materials

The following are available online at https://www.mdpi.com/article/10.3390/s21248371/s1, Figure S1: Mean of Bulk Density at 0 cm and 10 cm depth for conversion of soil moisture at 5 cm depth (data source: Tomislav Hengl. 2018). The data was processed and downloaded using the Google Earth Engine platform, Figure S2: Mean of Bulk Density at 30 cm and 60 cm depth for conversion of soil moisture at 40 cm depth (data source: Tomislav Hengl. 2018). The data was processed and downloaded using the Google Earth Engine platform, Figure S3: Bulk Density at 100 cm depth for conversion of soil moisture at 100 cm depth (data source: Tomislav Hengl. 2018). The data was processed and downloaded using the Google Earth Engine platform, Figure S4: Histogram of the 10-day dataset (1–10 June) from 2007 to 2020 for No 1 to 8 cells, Table S1: The coordinates and p-value of the cells for which the data distribution was test for normality using Shapiro-Wilk Normality Test, Table S2: Maximum agricultural surfaces (ha) affected by drought each year according to SMA (2007–2020) and 10-day intervals when they were registered.

Author Contributions

Conceptualization, I.O. and A.I.; methodology, I.O.; software, G.B.; validation, D.M., A.N. and V.C.; formal analysis, I.O.; investigation, C.-V.A. and S.N.; data curation, I.O.; writing—original draft preparation, I.O.; writing—review and editing, I.O., A.I., G.B., D.M., C.-V.A., A.N., V.C. and S.N.; visualization, G.B.; supervision, A.I. All authors have read and agreed to the published version of the manuscript.

Funding

This work was supported by a grant from the Romanian National Authority for Scientific Research and Innovation, CCCDI-UEFISCDI, project number COFUND-SUSCROP-SUSCAP-2, within PNCDI III.

Institutional Review Board Statement

Not applicable.

Informed Consent Statement

Not applicable.

Data Availability Statement

Not applicable.

Acknowledgments

The authors would like to thank the ISMN for providing the in situ soil moisture data, as well as EUMETSAT, ESA, and NASA for making their satellite products publicly available. Furthermore, the authors would like to thank Alexandru Dumitrescu for the SPI computation at country level. We are also very grateful to the anonymous reviewers who provided us with very helpful comments to improve the quality of this study.

Conflicts of Interest

The authors declare no conflict of interest. The funders had no role in the design of the study; in the collection, analyses, or interpretation of data; in the writing of the manuscript; or in the decision to publish the results.

References

  1. Wilhite, D.A.; Glantz, M.H. Understanding the Drought Phenomenon: The Role of Definitions. In Planning for Drought: Toward a Reduction of Societal Vulnerability, 1st ed.; Wilhite, D.A., Easterling, W.E., Wood, D.A., Eds.; Routledge: London, UK, 1987; pp. 11–27. [Google Scholar] [CrossRef]
  2. Crocetti, L.; Forkel, M.; Fischer, M.; Jurečka, F.; Grlj, A.; Salentinig, A.; Trnka, M.; Anderson, M.; Ng, W.-T.; Kokalj, Ž.; et al. Earth Observation for Agricultural Drought Monitoring in the Pannonian Basin (Southeastern Europe): Current State and Future Directions. Reg. Environ. Chang. 2020, 20, 123. [Google Scholar] [CrossRef]
  3. Ogaya, R.; Peñuelas, J. Climate Change Effects in a Mediterranean Forest Following 21 Consecutive Years of Experimental Drought. Forests 2021, 12, 306. [Google Scholar] [CrossRef]
  4. Barrett, T.M.; Robertson, G.C. Disturbance and Sustainability in Forests of the Western United States; US Department of Agriculture, Forest Service, Pacific Northwest Research Station: Portland, OR, USA, 2021; 231p.
  5. Pravalie, R.; Sîrodoev, I.; Peptenatu, D. Changes in the Forest Ecosystems in Areas Impacted by Aridization in South-Western Romania. J. Environ. Health Sci. Eng. 2014, 12, 2. [Google Scholar] [CrossRef] [PubMed] [Green Version]
  6. Wilhite, D.A. Chapter1 Drought as a Natural Hazard. Drought A Glob. Assess. 2000, 1, 3–18. [Google Scholar]
  7. Fries, A.; Silva, K.; Pucha-Cofrep, F.; Oñate-Valdivieso, F.; Ochoa-Cueva, P. Water Balance and Soil Moisture Deficit of Different Vegetation Units under Semiarid Conditions in the Andes of Southern Ecuador. Climate 2020, 8, 30. [Google Scholar] [CrossRef] [Green Version]
  8. Liu, L.; Gudmundsson, L.; Hauser, M.; Qin, D.; Li, S.; Seneviratne, S.I. Soil Moisture Dominates Dryness Stress on Ecosystem Production Globally. Nat. Commun. 2020, 11, 4892. [Google Scholar] [CrossRef] [PubMed]
  9. Weiskopf, S.R.; Rubenstein, M.A.; Crozier, L.G.; Gaichas, S.; Griffis, R.; Halofsky, J.E.; Hyde, K.J.W.; Morelli, T.L.; Morisette, J.T.; Muñoz, R.C.; et al. Climate Change Effects on Biodiversity, Ecosystems, Ecosystem Services, and Natural Resource Management in the United States. Sci. Total Environ. 2020, 733, 137782. [Google Scholar] [CrossRef] [PubMed]
  10. GTOS 52. Terrestrial Essential Climate Variables for Climate Change Assessment, Mitigation and Adaptation; Food Agriculture Organization United Nations: Rome, Italy, 2008. [Google Scholar]
  11. Pirc Velkavrh, A.; Martin, J.; Lung, T. The European Environment-State and Outlook 2020. Knowledge for Transition to a Sustainable Europe; Teruleti Statisztika: Budapest, Hungary, 2020; Volume 60, ISBN 978-92-9480-090-9. [Google Scholar]
  12. EEA. Land Systems at European Level—Analytical Assessment Framework; European Environment Agency: København, Denmark, 2018. [Google Scholar]
  13. Markonis, Y.; Kumar, R.; Hanel, M.; Rakovec, O.; Máca, P.; Kouchak, A.A. The Rise of Compound Warm-Season Droughts in Europe. Sci. Adv. 2021, 7, eabb9668. [Google Scholar] [CrossRef]
  14. Spinoni, J.; Naumann, G.; Vogt, J.; Paulo, B. Meteorological Droughts in Europe: Events and Impacts—Past Trends and Future Projections; Publications Office of the European Union: Luxembourg, 2016; ISBN 978-92-79-55098-0. [Google Scholar]
  15. Caloiero, T.; Veltri, S.; Caloiero, P.; Frustaci, F. Drought Analysis in Europe and in the Mediterranean Basin Using the Standardized Precipitation Index. Water 2018, 10, 1043. [Google Scholar] [CrossRef] [Green Version]
  16. Spinoni, J.; Naumann, G.; Vogt, J.V. Pan-European Seasonal Trends and Recent Changes of Drought Frequency and Severity. Glob. Planet. Chang. 2017, 148, 113–130. [Google Scholar] [CrossRef]
  17. Cammalleri, C.; Naumann, G.; Mentaschi, L.; Formetta, G.; Forzieri, G.; Gosling, S.; Bisselink, B.; Roo, D.A.; Feyen, L. Global Warming and Drought Impacts in the EU; Publications Office of the European Union: Luxembourg, 2020. [Google Scholar] [CrossRef]
  18. Dobri, R.V.; Sfîcă, L.; Amihaaesei, V.A.; Apostol, L.; Timpu, S. Arable Lands in Romania Derived from Normalized Difference Drought Index (2001–2020). Remote Sens. 2021, 2021, 1478. [Google Scholar] [CrossRef]
  19. Ionita, M.; Scholz, P.; Chelcea, S. Assessment of Droughts in Romania Using the Standardized Precipitation Index. Nat. Hazards 2016, 81, 1483–1498. [Google Scholar] [CrossRef] [Green Version]
  20. Kindler, J.; Thalmeinerova, D. Inception Report for the GWP CEE Part. of the WMO/GWP Integrated Drought Management Programme, 2012th ed.; Global Water Partnership Central and Eastern Europe: Stockholm, Sweden, 2012; ISBN 978-80-88907-80-0. [Google Scholar]
  21. Angearu, C.V.; Ontel, I.; Boldeanu, G.; Mihailescu, D.; Nertan, A.; Craciunescu, V.; Catana, S.; Irimescu, A. Multi-Temporal Analysis and Trends of the Drought Based on Modis Data in Agricultural Areas, Romania. Remote Sens. 2020, 12, 3940. [Google Scholar] [CrossRef]
  22. Sandu, I.; Mateescu, E.; Vătămanu, V.V. Schimbări Climatice În România Și Efectele Sale Asupra Agriculturii; Siteh: Craiova, Romania, 2010. [Google Scholar]
  23. Vicente-Serrano, S.M.; Domínguez-Castro, F.; Murphy, C.; Hannaford, J.; Reig, F.; Peña-Angulo, D.; Tramblay, Y.; Trigo, R.M.; Mac Donald, N.; Luna, M.Y.; et al. Long-Term Variability and Trends in Meteorological Droughts in Western Europe (1851–2018). Int. J. Climatol. 2021, 41, E690–E717. [Google Scholar] [CrossRef]
  24. Páscoa, P.; Gouveia, C.M.; Russo, A.C.; Bojariu, R.; Vicente-Serrano, S.M.; Trigo, R.M. Drought Impacts on Vegetation in Southeastern Europe. Remote Sens. 2020, 12, 2156. [Google Scholar] [CrossRef]
  25. Ogunrinde, A.T.; Oguntunde, P.G.; Olasehinde, D.A.; Fasinmirin, J.T.; Akinwumiju, A.S. Drought Spatiotemporal Characterization Using Self-Calibrating Palmer Drought Severity Index in the Northern Region of Nigeria. Results Eng. 2020, 5, 100088. [Google Scholar] [CrossRef]
  26. Gu, Y.; Brown, J.F.; Verdin, J.P.; Wardlow, B. A Five-Year Analysis of MODIS NDVI and NDWI for Grassland Drought Assessment over the Central Great Plains of the United States. Geophys. Res. Lett. 2007, 34, 1–6. [Google Scholar] [CrossRef] [Green Version]
  27. Mu, Q.; Zhao, M.; Kimball, J.S.; McDowell, N.G.; Running, S.W. A Remotely Sensed Global Terrestrial Drought Severity Index. Bull. Am. Meteorol. Soc. 2013, 94, 83–98. [Google Scholar] [CrossRef] [Green Version]
  28. Wang, P.; Li, X.; Gong, J.; Song, C. Vegetation Temperature Condition Index and Its Application for Drought Monitoring. In Proceedings of the IGARSS 2001. Scanning the Present and Resolving the Future. Proceedings. IEEE 2001 International Geoscience and Remote Sensing Symposium (Cat. No.01CH37217), Sydney, Australia, 9–13 July 2001; Volume 1, pp. 141–143. [Google Scholar]
  29. Hu, X.; Ren, H.; Tansey, K.; Zheng, Y.; Ghent, D.; Liu, X.; Yan, L. Agricultural Drought Monitoring Using European Space Agency Sentinel 3A Land Surface Temperature and Normalized Difference Vegetation Index Imageries. Agric. For. Meteorol. 2019, 279, 107707. [Google Scholar] [CrossRef]
  30. Blunden, J.; Boyer, T. State of the Climate in 2020. Bull. Amer. Meteor. Soc. 2020, 102, S1–S475. [Google Scholar] [CrossRef]
  31. European Space Agency. ESA Climate Change Initiative Plus Soil Moisture. ESA Bull. 2020, 52, 88. [Google Scholar]
  32. Badea, L.; Gastescu, P.; Velcea, V.A. Geografia României. Vol. 1, Geografia Fizică; Editura Academiei Romane: Bucharest, Romania, 1983. [Google Scholar]
  33. National Institute of Statistics. Land Area by Use, by Forms of Ownership, Macro-Regions, Development Regions and Counties. Tempo Online, Romania. 2020. Available online: http://statistici.insse.ro:8077/tempo-online/#/pages/tables/insse-table (accessed on 30 August 2021).
  34. Constantin (Oprea), M.D.; Ionac, N.; Marinică, I.; Vătămanu, V.V.; Marinică, A.F.; Grigore, E.; Bogan, E.; Ontel, I. The Agro-Climatic Resources of the Year 2015 and Their Impact on the Agricultural Crops in the South–West of Romania. Sci. Pap. Manag. Econ. Eng. Agric. Rural. Dev. 2019, 19, 81–92. [Google Scholar]
  35. Fraser, E.D.G.; Stringer, L.C. Explaining Agricultural Collapse: Macro-Forces, Micro-Crises and the Emergence of Land Use Vulnerability in Southern Romania. Glob. Environ. Chang. 2009, 19, 45–53. [Google Scholar] [CrossRef]
  36. Ontel, I.; Vladut, A. Impact of Drought on the Productivity of Agricultural Crops within the Oltenia Plain, Romania. Geogr. Pannonica 2015, 19, 6–19. [Google Scholar] [CrossRef] [Green Version]
  37. Asghari, S.; Ahmadnejad, S.; Keivan Behjou, F. Deforestation Effects on Soil Quality and Water Retention Curve Parameters in Eastern Ardabil, Iran. Eurasian Soil Sci. 2016, 49, 338–346. [Google Scholar] [CrossRef]
  38. Beck, H.E.; Zimmermann, N.E.; McVicar, T.R.; Vergopolan, N.; Berg, A.; Wood, E.F. Present and Future Köppen-Geiger Climate Classification Maps at 1-Km Resolution. Sci. Data 2018, 5, 1–12. [Google Scholar] [CrossRef] [Green Version]
  39. Climatology Laboratory. NMA Mean of Air Temperature and Precipitation. Available online: https://www.meteoromania.ro/ (accessed on 30 May 2021).
  40. Albergel, C.; Rüdiger, C.; Pellarin, T.; Calvet, J.C.; Fritz, N.; Froissard, F.; Suquia, D.; Petitpa, A.; Piguet, B.; Martin, E. From Near-Surface to Root-Zone Soil Moisture Using an Exponential Filter: An Assessment of the Method Based on in-Situ Observations and Model Simulations. Hydrol. Earth Syst. Sci. 2008, 12, 1323–1337. [Google Scholar] [CrossRef] [Green Version]
  41. Wagner, W.; Lemoine, G.; Rott, H. A Method for Estimating Soil Moisture from ERS Scatterometer and Soil Data. Remote Sens. Environ. 1999, 70, 191–207. [Google Scholar] [CrossRef]
  42. Bauer-Marschallinger, B. Copernicus Global Land Operations, ”Vegetation and Energy”, Product User Manual. Available online: https://land.copernicus.eu/global/sites/cgls.vito.be/files/products/CGLOPS1_PUM_SWIV3-SWI10-SWI-TS_I2.60.pdf, (accessed on 15 August 2021).
  43. Mladenova, I.; Lakshmi, V.; Walker, J.P.; Panciera, R.; Wagner, W.; Doubkova, M. Validation of the ASAR Global Monitoring Mode Soil Moisture Product Using the NAFE’05 Data Set. IEEE Trans. Geosci. Remote Sens. 2010, 48, 2498–2508. [Google Scholar] [CrossRef]
  44. Blake, G.R. Particle Density. In Encyclopedia of Soil Science; Chesworth, W., Ed.; Springer: Dordrecht, The Netherlands, 2008; pp. 504–505. ISBN 978-1-4020-3995-9. [Google Scholar]
  45. Guo, Z. Estimating Method of Maximum Infiltration Depth and Soil Water Supply. Sci. Rep. 2020, 10, 9726. [Google Scholar] [CrossRef]
  46. Hengl, T. Soil Bulk Density (Fine Earth) 10 x Kg/m-Cubic at 6 Standard Depths (0, 10, 30, 60, 100 and 200 cm) at 250 m Resolution. Data Set (v0.2) 2018. [Google Scholar] [CrossRef]
  47. Wolfgang, W.; Dorigo, W.; Jeu, R.; Parinussa, R.; Scarrott, R.; Lahoz, K.W.; Doubková, M.; Dwyer, N.; Barrett, B. Comprehensive Error Characterisation Report (CECR). 2012, pp. 1–69. Available online: www.esa-soilmoisture-cci.org (accessed on 30 May 2021).
  48. National Meteorological Administration, Romanian Soil Moisture Network (RSMN) 2020. Available online: https://ismn.geo.tuwien.ac.at/en/networks/?id=RSMN (accessed on 30 May 2021).
  49. Dorigo, W.A.; Wagner, W.; Hohensinn, R.; Hahn, S.; Paulik, C.; Xaver, A.; Gruber, A.; Drusch, M.; Mecklenburg, S.; Van Oevelen, P.; et al. The International Soil Moisture Network: A Data Hosting Facility for Global in Situ Soil Moisture Measurements. Hydrol. Earth Syst. Sci. 2011, 15, 1675–1698. [Google Scholar] [CrossRef] [Green Version]
  50. Dorigo, W.A.; Xaver, A.; Vreugdenhil, M.; Gruber, A.; Hegyiová, A.; Sanchis-Dufau, A.D.; Zamojski, D.; Cordes, C.; Wagner, W.; Drusch, M. Global Automated Quality Control of In Situ Soil Moisture Data from the International Soil Moisture Network. Vadose Zone J. 2013, 12, vzj2012.0097. [Google Scholar] [CrossRef]
  51. FAO/IIASA/ISRIC/ISSCAS/JRC. Harmonized World Soil Database (Version 1.2). Available online: https://www.fao.org/soils-portal/data-hub/soil-maps-and-databases/harmonized-world-soil-database-v12/en/ (accessed on 15 May 2021).
  52. Vermote, E.; Wolfe, R. MOD09GA MODIS/Terra Surface Reflectance Daily L2G Global 1km and 500m SIN Grid V006. In NASA EOSDIS Land Processes DAAC; 2015. Available online: https://lpdaac.usgs.gov/products/mod09gav006/ (accessed on 10 June 2021).
  53. Wan, Z.; Hook, S.; Hulley, G. MOD11A1 MODIS/Terra Land Surface Temperature/Emissivity Daily L3 Global 1km SIN Grid V006. In NASA EOSDIS Land Processes DAAC; 2015. Available online: https://lpdaac.usgs.gov/products/mod11a1v006/ (accessed on 10 June 2021).
  54. Gessesse, A.A.; Melesse, A.M. Chapter 8—Temporal Relationships between Time Series CHIRPS-Rainfall Estimation and EMODIS-NDVI Satellite Images in Amhara Region, Ethiopia. In Extreme Hydrology and Climate Variability; Melesse, A.M., Abtew, W., Senay, G.B.T.-E.H., Variability, C., Eds.; Elsevier: Amsterdam, The Netherlands, 2019; pp. 81–92. ISBN 978-0-12-815998-9. [Google Scholar]
  55. Faridatul, M.I.; Ahmed, B. Assessing Agricultural Vulnerability to Drought in a Heterogeneous Environment: A Remote Sensing-Based Approach. Remote Sens. 2020, 12, 3363. [Google Scholar] [CrossRef]
  56. Amri, R.; Zribi, M.; Lili-Chabaane, Z.; Duchemin, B.; Gruhier, C.; Chehbouni, A. Analysis of Vegetation Behavior in a North African Semi-Arid Region, Using SPOT-VEGETATION NDVI Data. Remote Sens. 2011, 3, 2568–2590. [Google Scholar] [CrossRef] [Green Version]
  57. Cammalleri, C.; Vogt, J. On the Role of Land Surface Temperature as Proxy of Soil Moisture Status for Drought Monitoring in Europe. Remote Sens. 2015, 7, 16849–16864. [Google Scholar] [CrossRef] [Green Version]
  58. Das, N.; Mondal, P.; Sutradhar, S.; Ghosh, R. Assessment of Variation of Land Use/Land Cover and Its Impact on Land Surface Temperature of Asansol Subdivision. Egypt. J. Remote Sens. Space Sci. 2021, 24, 131–149. [Google Scholar] [CrossRef]
  59. Marković, M.; Cheema, J.; Teofilović, A.; Čepić, S.; Popović, Z.; Tomićević-Dubljević, J.; Pause, M. Monitoring of Spatiotemporal Change of Green Spaces in Relation to the Land Surface Temperature: A Case Study of Belgrade, Serbia. Remote Sens. 2021, 13, 3846. [Google Scholar] [CrossRef]
  60. Cârlan, I.; Mihai, B.A.; Nistor, C.; Große-Stoltenberg, A. Identifying Urban Vegetation Stress Factors Based on Open Access Remote Sensing Imagery and Field Observations. Ecol. Inform. 2020, 55, 101032. [Google Scholar] [CrossRef]
  61. Cârlan, I.; Haase, D.; Große-Stoltenberg, A.; Sandric, I. Mapping Heat and Traffic Stress of Urban Park Vegetation Based on Satellite Imagery—A Comparison of Bucharest, Romania and Leipzig, Germany. Urban. Ecosyst. 2020, 23, 363–377. [Google Scholar] [CrossRef]
  62. Hayes, M.J.; Svoboda, M.D.; Wilhite, D.A.; Vanyarkho, O.V. Monitoring the 1996 Drought Using the Standardized Precipitation Index. Bull. Am. Meteorol. Soc. 1999, 80, 429–438. [Google Scholar] [CrossRef] [Green Version]
  63. Administratia Nationala de Meteorologie. Clima Romaniei; Romanian Academy: Bucharest, Romania, 2008; ISBN 973-27-1674-8. [Google Scholar]
  64. Liu, J.; Chai, L.; Lu, Z.; Liu, S.; Qu, Y.; Geng, D.; Song, Y.; Guan, Y.; Guo, Z.; Wang, J.; et al. Evaluation of SMAP, SMOS-IC, FY3B, JAXA, and LPRM Soil Moisture Products over the Qinghai-Tibet Plateau and Its Surrounding Areas. Remote Sens. 2019, 11, 792. [Google Scholar] [CrossRef] [Green Version]
  65. Liu, Y.Y.; Evans, J.P.; McCabe, M.F.; de Jeu, R.A.M.; van Dijk, A.I.J.M.; Su, H. Influence of Cracking Clays on Satellite Estimated and Model Simulated Soil Moisture. Hydrol. Earth Syst. Sci. 2010, 14, 979–990. [Google Scholar] [CrossRef] [Green Version]
  66. Martins, J.P.; Trigo, I.; Freitas, S.C. e Copernicus Global Land Operations ”Vegetation and Energy” “CGLOPS-1”. Copernic. Glob. Land Oper. 2020, 1–125. Available online: https://land.copernicus.eu/global/sites/cgls.vito.be/files/products/CGLOPS1_QAR_LST-V2.0_I1.10.pdf (accessed on 15 August 2021).
  67. Bauer-Marschallinger, B.; Paulik, C. Copernicus Global Land Operations ”Vegetation and Energy”; Validation Report (QAR). SWI1km-V1_I1.11; 2020; pp. 1–60. Available online: https://land.copernicus.eu/global/sites/cgls.vito.be/files/products/CGLOPS1_QAR_SWI1km-V1_I1.11.pdf (accessed on 15 August 2021).
  68. Mateescu, E.; Smarandache, M.; Jeler, N.; Apostol, V. Drought Conditions and Management Strategies in Romania. In Initiative on “Capacity Development to Support. National Drought Management Policy” (WMO, UNCCD, FAO and UNW-DPC); 2013; p. 600. Available online: http://www.ais.unwater.org/ais/pluginfile.php/548/mod_page/content/65/Romania_CountryReport.pdf (accessed on 15 August 2021).
  69. Sehler, R.; Li, J.; Reager, J.; Ye, H. Investigating Relationship Between Soil Moisture and Precipitation Globally Using Remote Sensing Observations. J. Contemp. Water Res. Educ. 2019, 168, 106–118. [Google Scholar] [CrossRef] [Green Version]
  70. Ceglar, A.; Croitoru, A.-E.; Cuxart, J.; Djurdjevic, V.; Güttler, I.; Ivančan-Picek, B.; Jug, D.; Lakatos, M.; Weidinger, T. PannEx: The Pannonian Basin Experiment. Clim. Serv. 2018, 11, 78–85. [Google Scholar] [CrossRef]
  71. Croitoru, A.E.; Piticar, A.; Sfîcă, L.; Roșca, C.-F.; Tudose, T.; Horvath, C.; Ionuț, M.; Ciupertea, A.-F.; Scripcă, S.; Harpa, G. Extreme Temperature and Precipitation Events in Romania; Editura Academiei Romane: Bucurest, Romania, 2018; ISBN 978-973-27-2833-8. [Google Scholar]
  72. Cheval, S.; Dumitrescu, A.; Birsan, M.-V. Variability of the Aridity in the South-Eastern Europe over 1961–2050. CATENA 2017, 151, 74–86. [Google Scholar] [CrossRef]
  73. Minea, I.; Iosub, M.; Boicu, D. Multi-Scale Approach for Different Type of Drought in Temperate Climatic Conditions. Nat. Hazards 2021, 1–25. [Google Scholar] [CrossRef]
  74. Minea, I.; Iosub, M.; Boicu, D. Daniel Groundwater Resources from Eastern Romania under Human and Climatic Pressure. Sustainability 2020, 12, 10341. [Google Scholar] [CrossRef]
  75. Busuioc, A.; Dumitrescu, A.; Soare, E.; Orzan, A. Summer Anomalies in 2007 in the Context of Extremely Hot and Dry Summers in Romania. Rom. J. Meteorol. 2007, 9, 1–17. [Google Scholar]
  76. Abu-Awwad, A.M. Water Infiltration and Redistribution within Soils Affected by a Surface Crust. J. Arid Environ. 1997, 37, 231–242. [Google Scholar] [CrossRef]
  77. Li, Y.; Yu, Y.; Sun, R.; Shen, M.; Zhang, J. Simulation of Soil Water Dynamics in a Black Locust Plantation on the Loess Plateau, Western Shanxi Province, China. Water 2021, 13, 1213. [Google Scholar] [CrossRef]
  78. RO-Risk. Raport Consolidat Privind Evaluarea Riscului La Secetă Pedologică. 2016. Available online: https://gis.ro-risk.ro/site/documente/RezultateRO-RISK/Seceta_pedologica/Raport_final_seceta_pedologica.pdf (accessed on 15 August 2021). (In Romanian).
  79. Shailendra, M.; Lockwood, S.; Helen, D.; Slavco, V.; Commandeur, T.; Siek, M. Soil and Water in a Changing Environment, Soil and Water in a Changing Environment; Final Report Prepared for European Commission (DG ENV), with Support. from HydroLogic; Office for Official Publications of the European Communities: Luxembourg, 2014; ISBN 978-92-79-38794-4. [Google Scholar]
  80. Ding, Y.; Nie, Y.; Chen, H.; Wang, K.; Querejeta, J.I. Water Uptake Depth Is Coordinated with Leaf Water Potential, Water-Use Efficiency and Drought Vulnerability in Karst Vegetation. New Phytol. 2021, 229, 1339–1353. [Google Scholar] [CrossRef]
  81. RO-Risk. Raport Privind Analiza de Vulnerabilitate La Seceta Meteorologica Si Hidrologica; 2016. (In Romanian). Available online: https://gis.ro-risk.ro/site/documente/RezultateRO-RISK/SECETA_meteo-hidro/Cap.6.Analizadevulnerabilitatelaseceta.pdf (accessed on 15 August 2021).
  82. Potopová, V.; Boroneanţ, C.; Boincean, B.; Soukup, J. Impact of Agricultural Drought on Main Crop Yields in the Republic of Moldova. Int. J. Climatol. 2016, 36, 2063–2082. [Google Scholar] [CrossRef] [Green Version]
  83. Liu, Y.Y.; Parinussa, R.M.; Dorigo, W.A.; De Jeu, R.A.M.; Wagner, W.; Van Dijk, A.I.J.; McCabe, M.F.; Evans, J.P. Developing an Improved Soil Moisture Dataset by Blending Passive and Active Microwave Satellite-Based Retrievals. Hydrol. Earth Syst. Sci. 2011, 15, 425–436. [Google Scholar] [CrossRef] [Green Version]
  84. Vicente-Serrano, S.M.; Beguería, S.; López-Moreno, J.I. A Multiscalar Drought Index Sensitive to Global Warming: The Standardized Precipitation Evapotranspiration Index. J. Clim. 2010, 23, 1696–1718. [Google Scholar] [CrossRef] [Green Version]
Figure 1. The physical-geographical characteristics of Romania and the location of the RSMN stations used in the validation of the results of the conversion of soil moisture values.
Sensors 21 08371 g001
Figure 2. Comparison between soil moisture from SWI with in situ (RSMN) at a 5 cm depth.
Sensors 21 08371 g002
Figure 3. The SM quartile (Q1, Q2, and Q3) for 5 cm, 40 cm, and 100 cm depth in Romania (2007–2020). The quartiles were identified based on the average values of SM at intervals of 10 days.
Sensors 21 08371 g003
Figure 4. SMA in Romania at 5 cm (top), 40 cm (center), and 100 cm (bottom) depth (2007–2020): (a) spatial distribution of SMA from 21–31 July 2007 (top), 11–20 August 2012 (center), and 21–30 June 2009 (bottom); and (b) mean of SMA for 10 day intervals.
Sensors 21 08371 g004
Figure 5. Variability of: (a) SPI, (b) LST anomaly, and (c) NDVI anomaly in Romania (2007–2020). The indices were calculated at 10 day intervals to be compatible with the SMA.
Sensors 21 08371 g005
Figure 6. The correlations between the soil moisture anomaly (5 cm, 40 cm, and 100 cm depths) and the SPI, LST anomaly, and NDVI anomaly in the second part of the warm seasons (July–September) within: (a) the Romanian Plain; (b) Western Plain; (c) Transylvanian Depression; (d) Moldavian Plateau; (e) Dobrogea Plateau; and (f) Getic Plateau.
Sensors 21 08371 g006
Figure 7. The correlations between the soil moisture anomaly (5 cm, 40 cm, and 100 cm depths) and the SPI, LST anomaly, and NDVI anomaly in the first part of the warm seasons (April–June) within: (a) the Romanian Plain; (b) Western Plain; (c) Transylvanian Depression; (d) Moldavian Plateau; (e) Dobrogea Plateau; and (f) Getic Plateau.
Sensors 21 08371 g007
Table 1. Characteristics of the RSMN stations used.
IDNameLonLatAlt (m)PeriodSoil Fraction (0–0.3 m Depth) [51]Major Landforms
ClayOrganic CarbonSandSilt
15489Alexandria25.3543.9775.462014–2020251.652847Romanian Plain
15460Calarasi27.3344.2018.72014–2020470.971439
15470Rosiorii de Vede24.9744.10102.22014–2020471.811934
15265Tecuci27.4045.8460.02014–2020180.63448
15289Banloc21.1345.3883.42014–2020541.132224Western Plain
15199Sannicolau Mare20.6046.0785.02015–2020180.63448
15136Chisineu Cris21.5446.5196.02015–2020431.351740
15080Oradea21.8947.03136.02014–2020210.863940
15010Satu Mare22.8847.72123.02014–2020240.834729
15189Dumbraveni24.5946.22318.02014–2020190.993744Transylvanian Depression
15000Darabani26.5748.19259.02015–2020221.653939Moldavian Plateau
15056Cotnari26.9247.35289.02014–2020411.132732
15090Iasi27.6247.1674.32014–2020251.652847
15197Barlad27.6446.23172.02014–2020251.652847
15434Slatina24.3544.44172.02014–2020180.63448Getic Plateau
15412Bacles23.1144.47313.02014–2020190.993744
Table 2. Drought category.
SMA ValueDrought Category
>1Wetter than normal
−1 to 1Normal condition
−1 to −1.5Moderate drought
−1.5 to −2Severe drought
≤−2Extreme drought
Table 3. The correlation coefficients and the errors between SM-RSMN and SM-SWI.
NameSM-RSMN vs. SM-SWISample
BiasRMSEMAErrho
Alexandria−0.1580.1760.1600.4030.404164
Calarasi−0.1860.2150.1870.2370.243219
Rosiorii de Vede−0.0780.1100.0930.5150.526187
Tecuci−0.0950.1280.1020.3540.418224
Banloc−0.0660.1140.0860.3110.396193
Sannicolau Mare−0.0590.1060.0840.4280.473158
Chisineu Cris−0.1330.1720.1400.2140.198186
Oradea−0.1190.1340.1200.6930.724202
Satu Mare−0.1670.1830.1670.5640.577212
Dumbraveni−0.1780.1840.1780.4740.453207
Darabani−0.160.1780.1610.4530.495182
Cotnari−0.1460.1580.1460.5420.556202
Iasi−0.1760.1840.1760.6080.591126
Barlad−0.1570.1750.1570.5860.586223
Slatina−0.0690.0940.0770.6720.708197
Bacles−0.0090.0500.0400.7970.809226
Mean−0.1220.1480.1300.4910.51016
Publisher’s Note: MDPI stays neutral with regard to jurisdictional claims in published maps and institutional affiliations.

