
Anemia Diagnostic System Based on Impedance Measurement of Red Blood Cells


Abstract
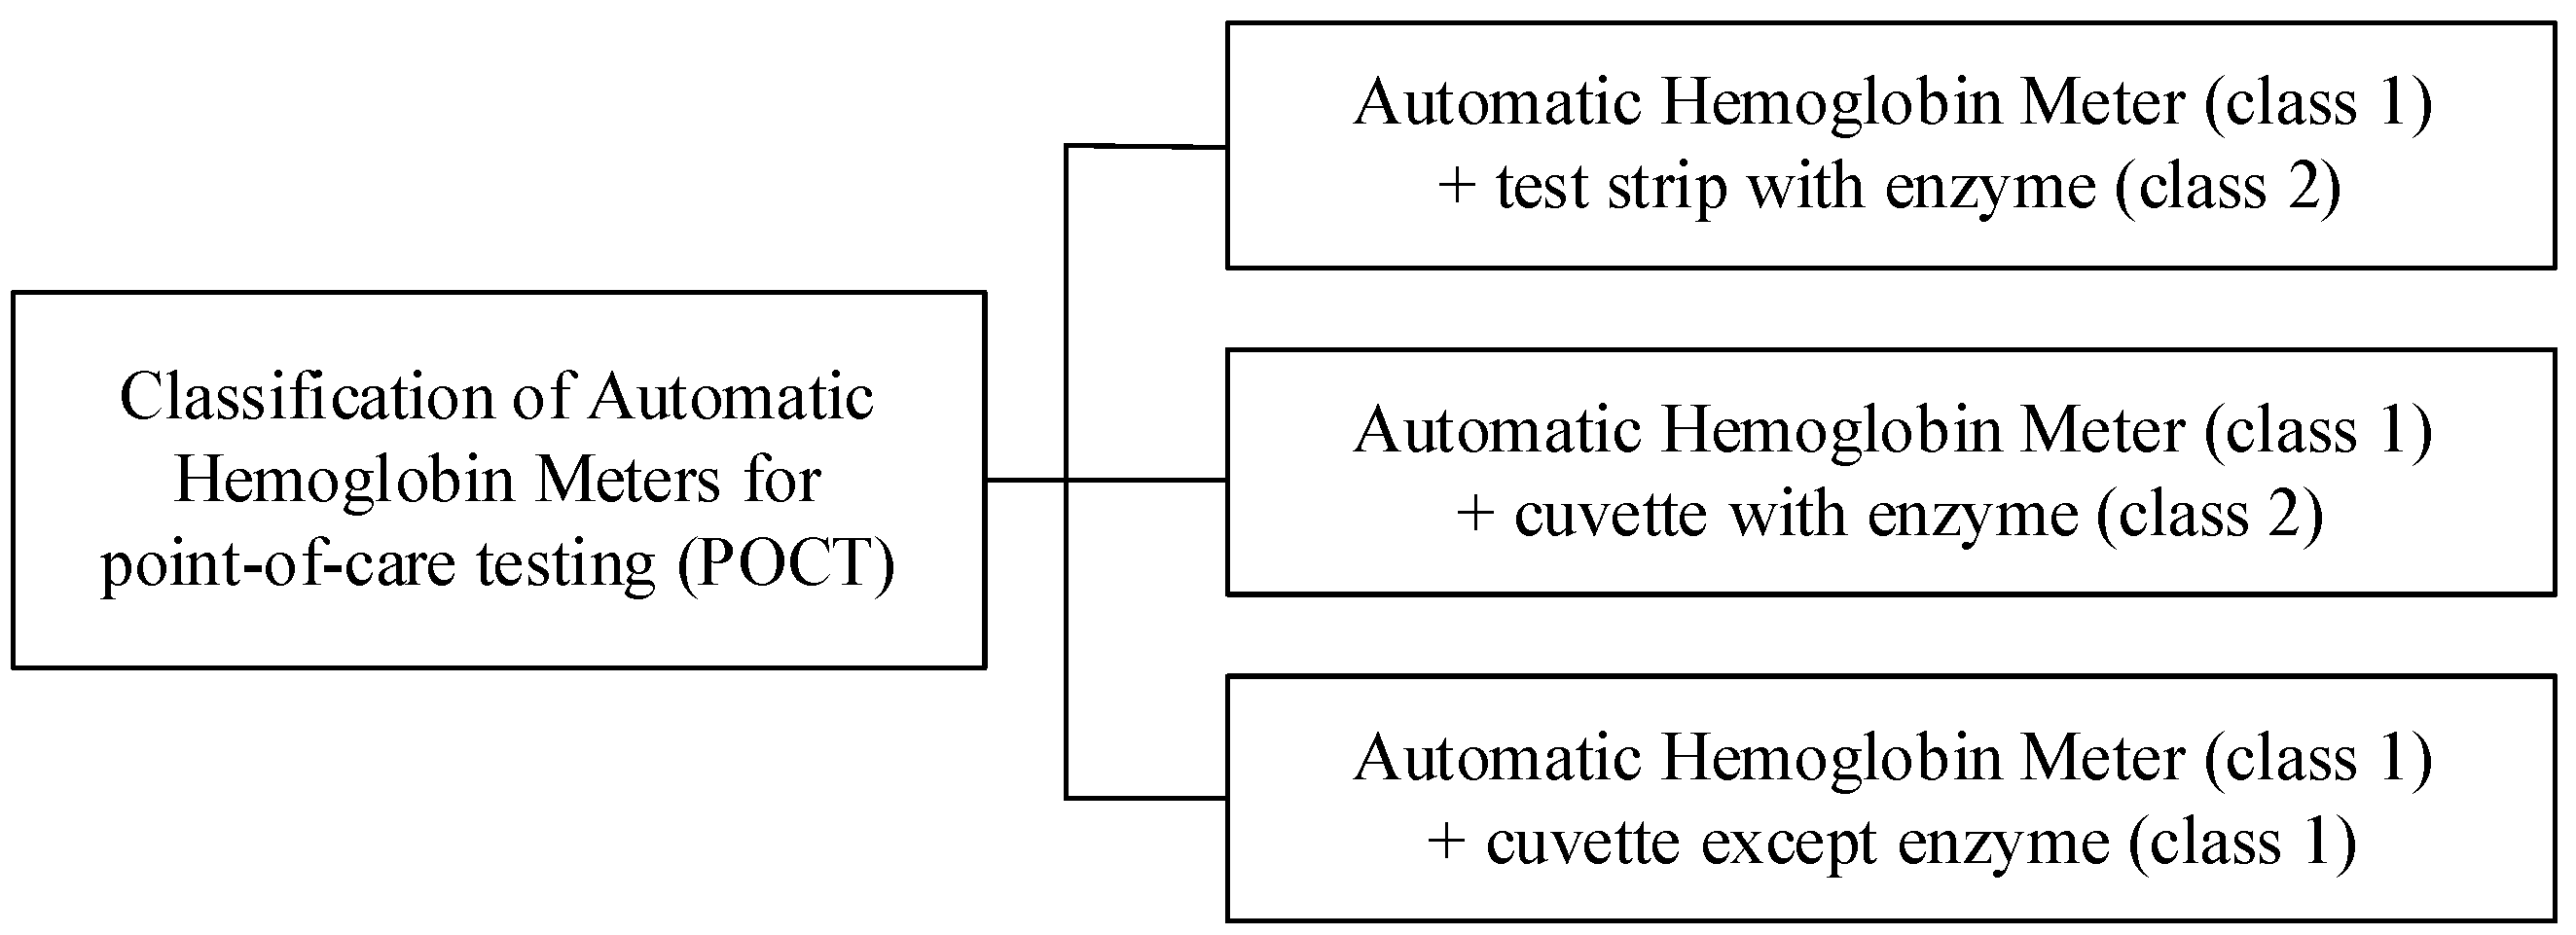
:1. Introduction
2. Related Work
3. Anemia Diagnostic System Based on Impedance Measurement
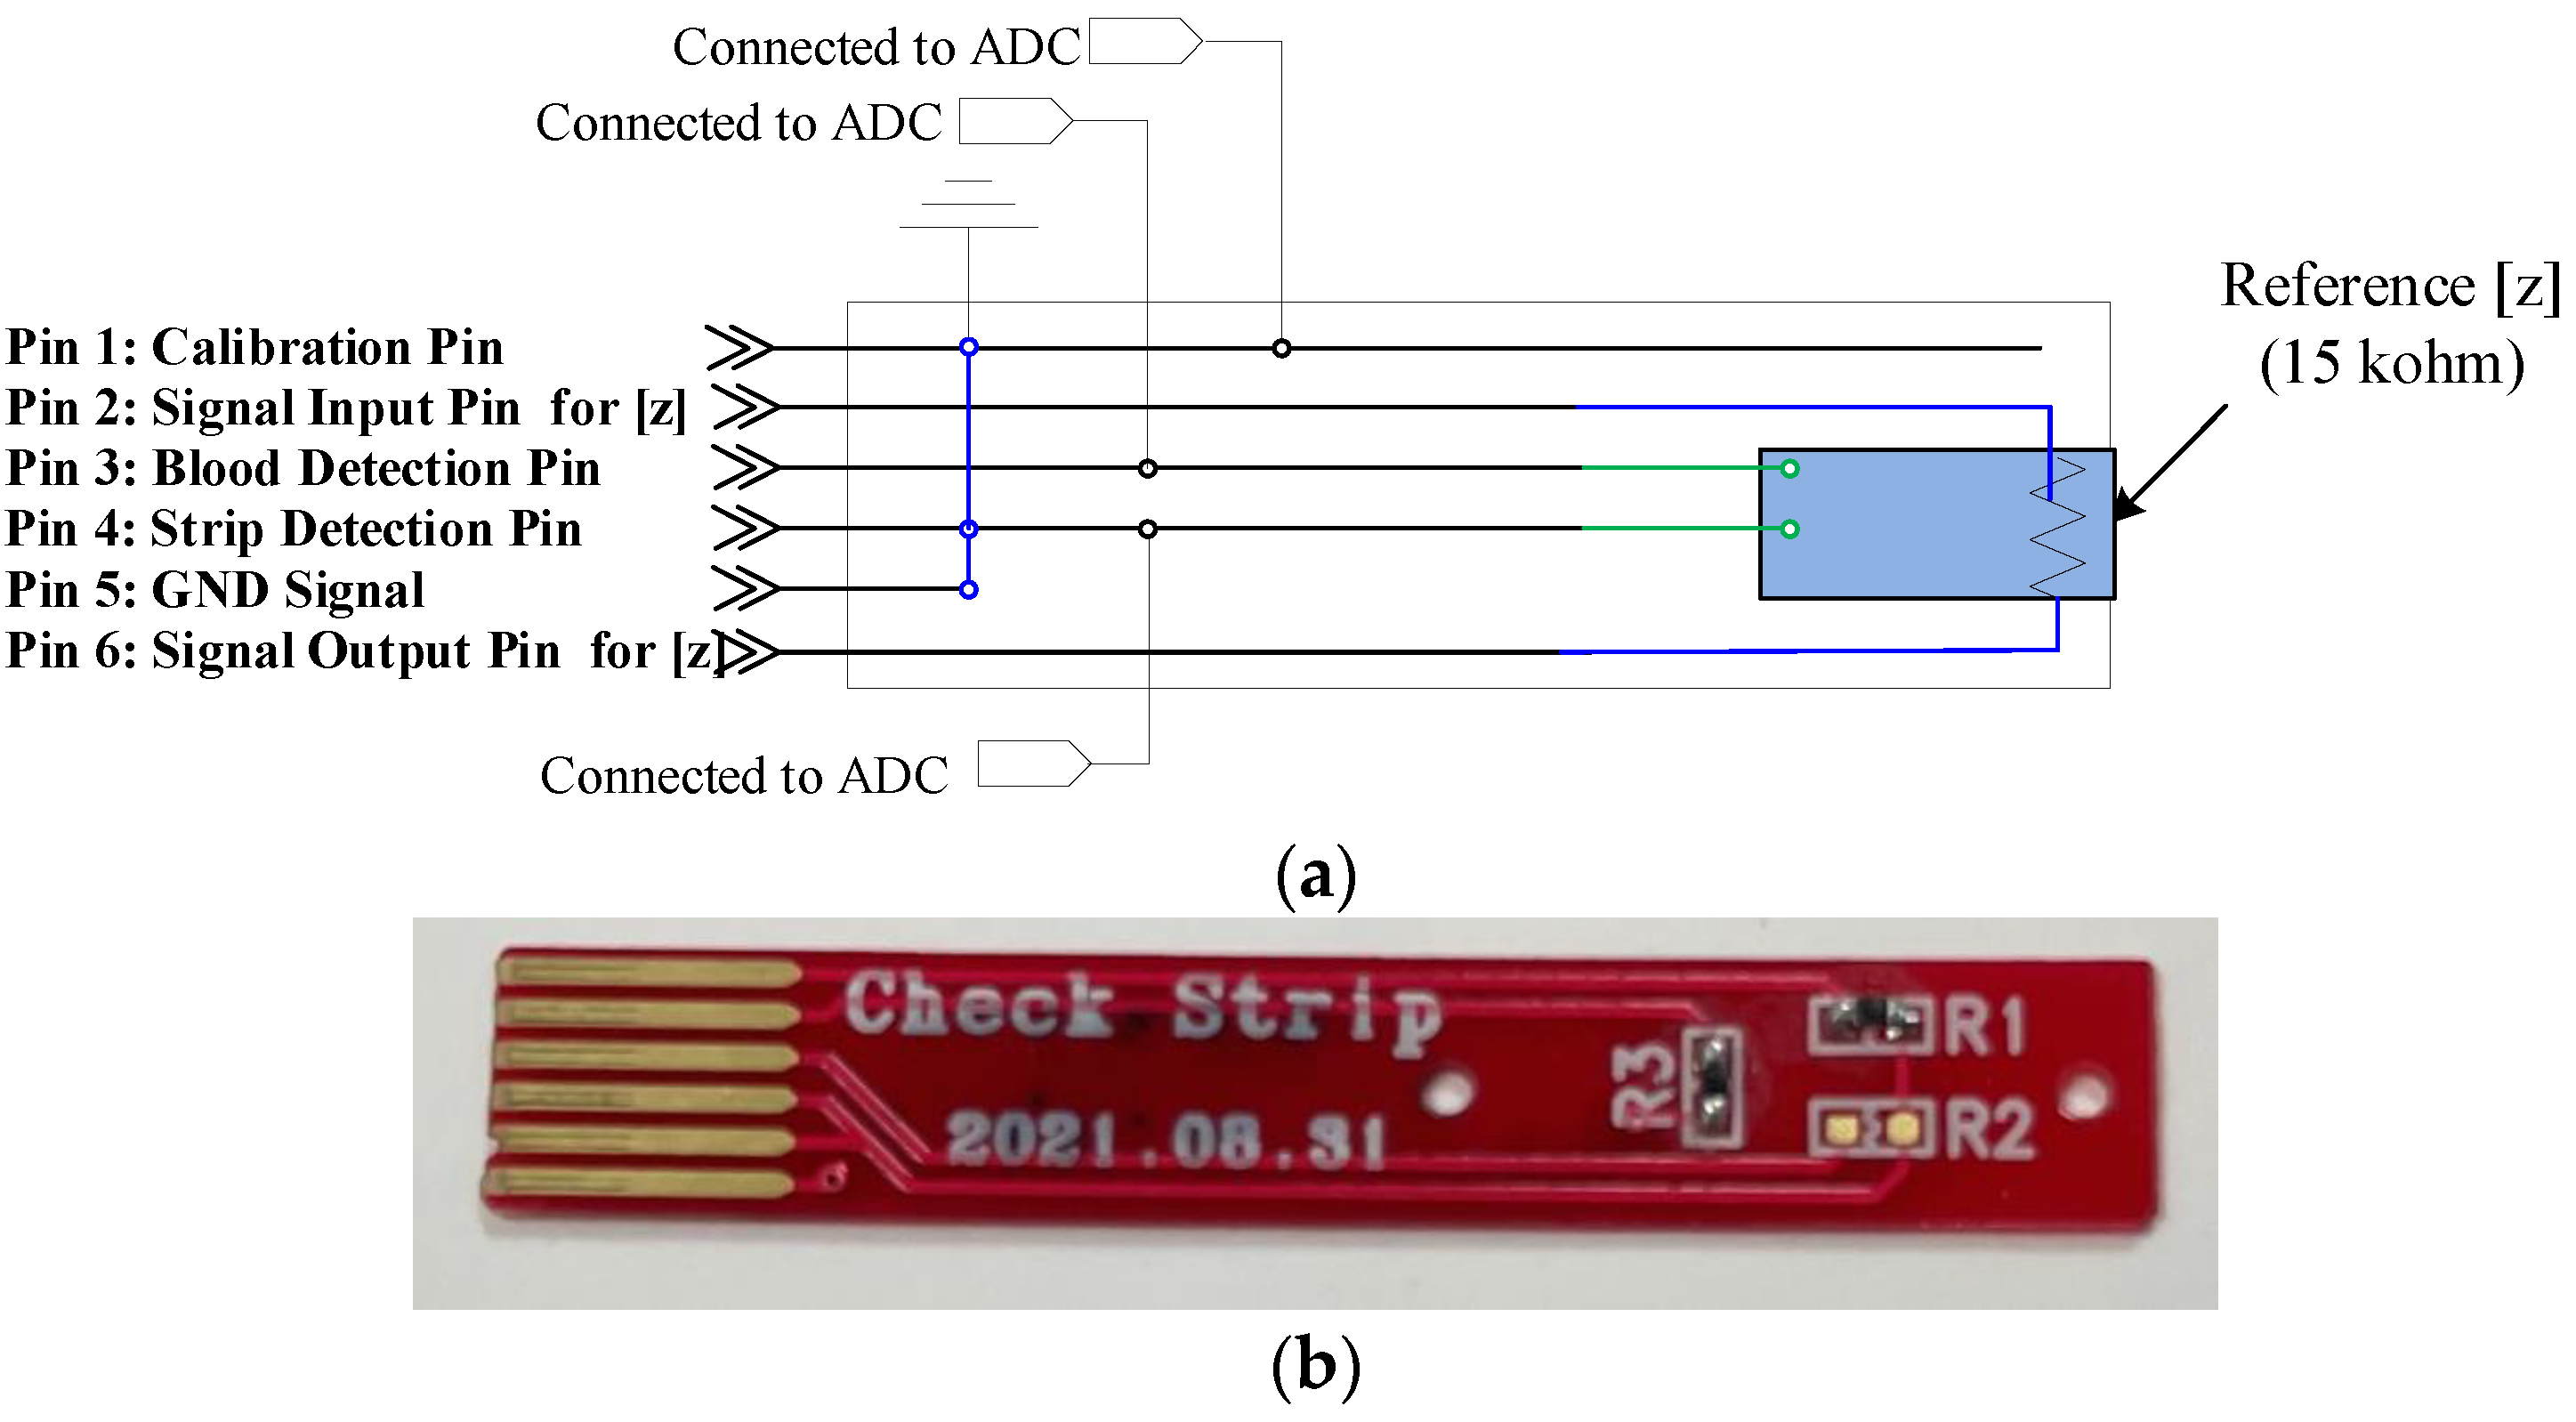
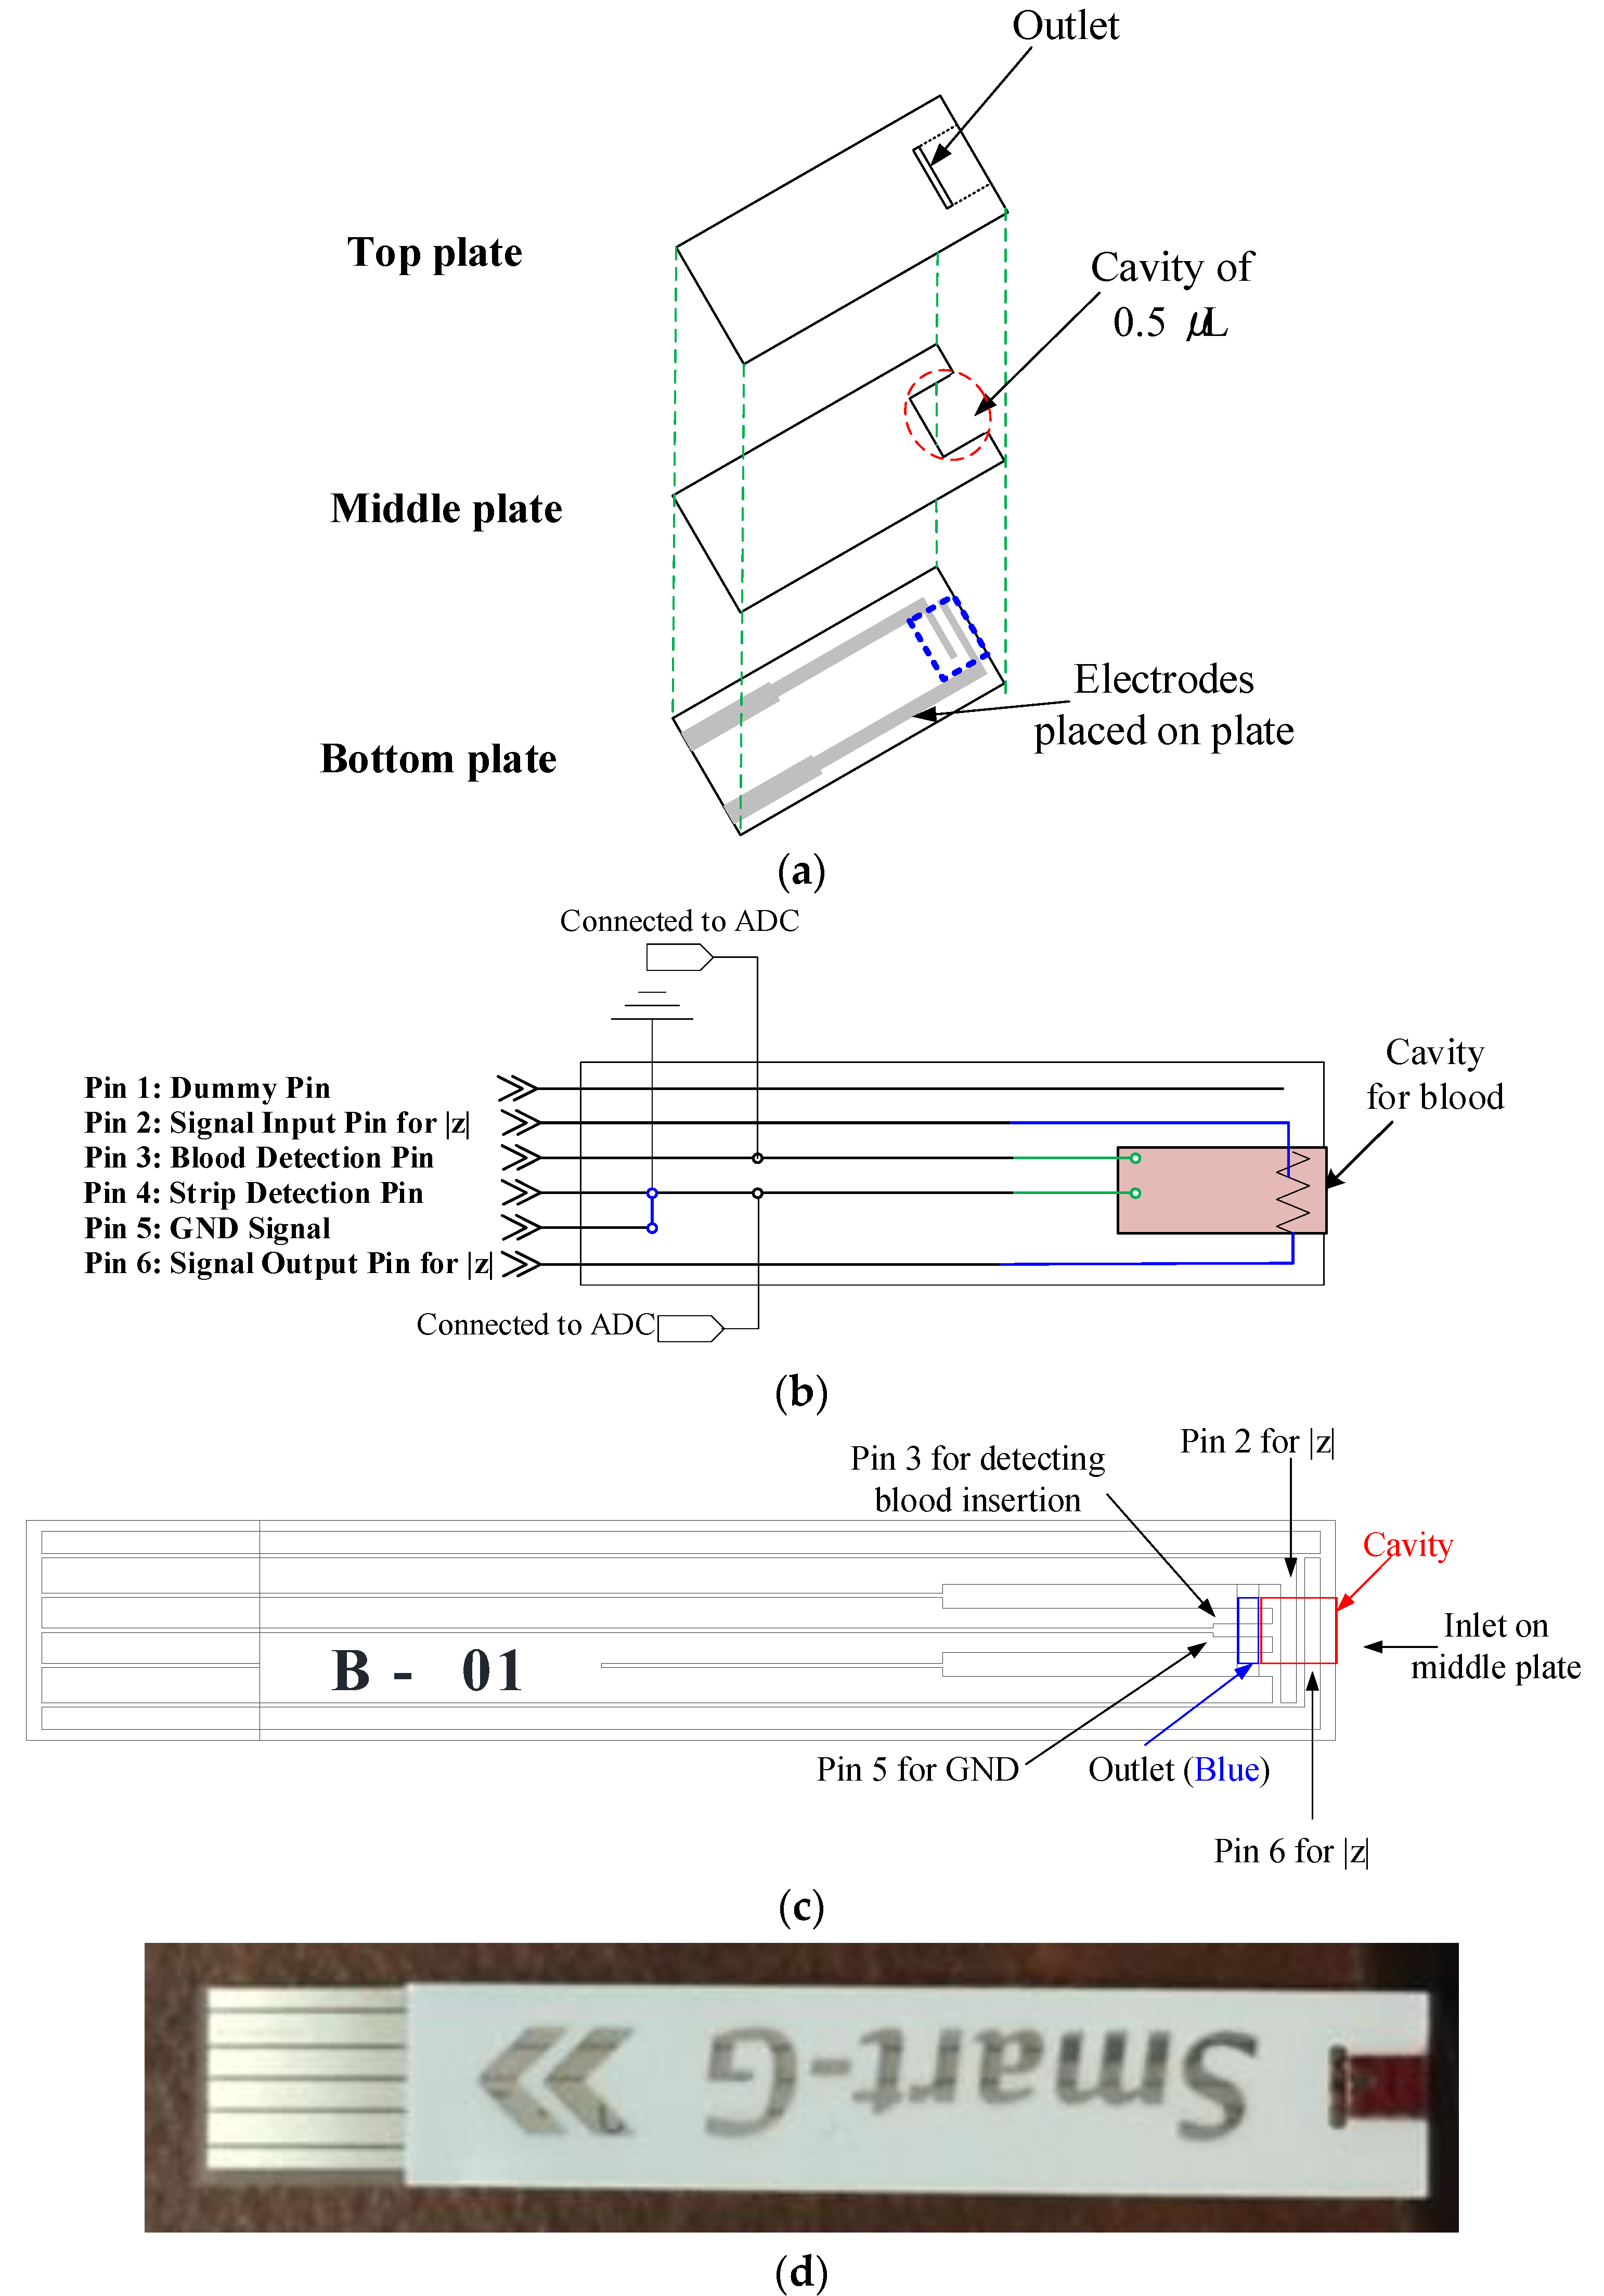
3.1. Strip Design
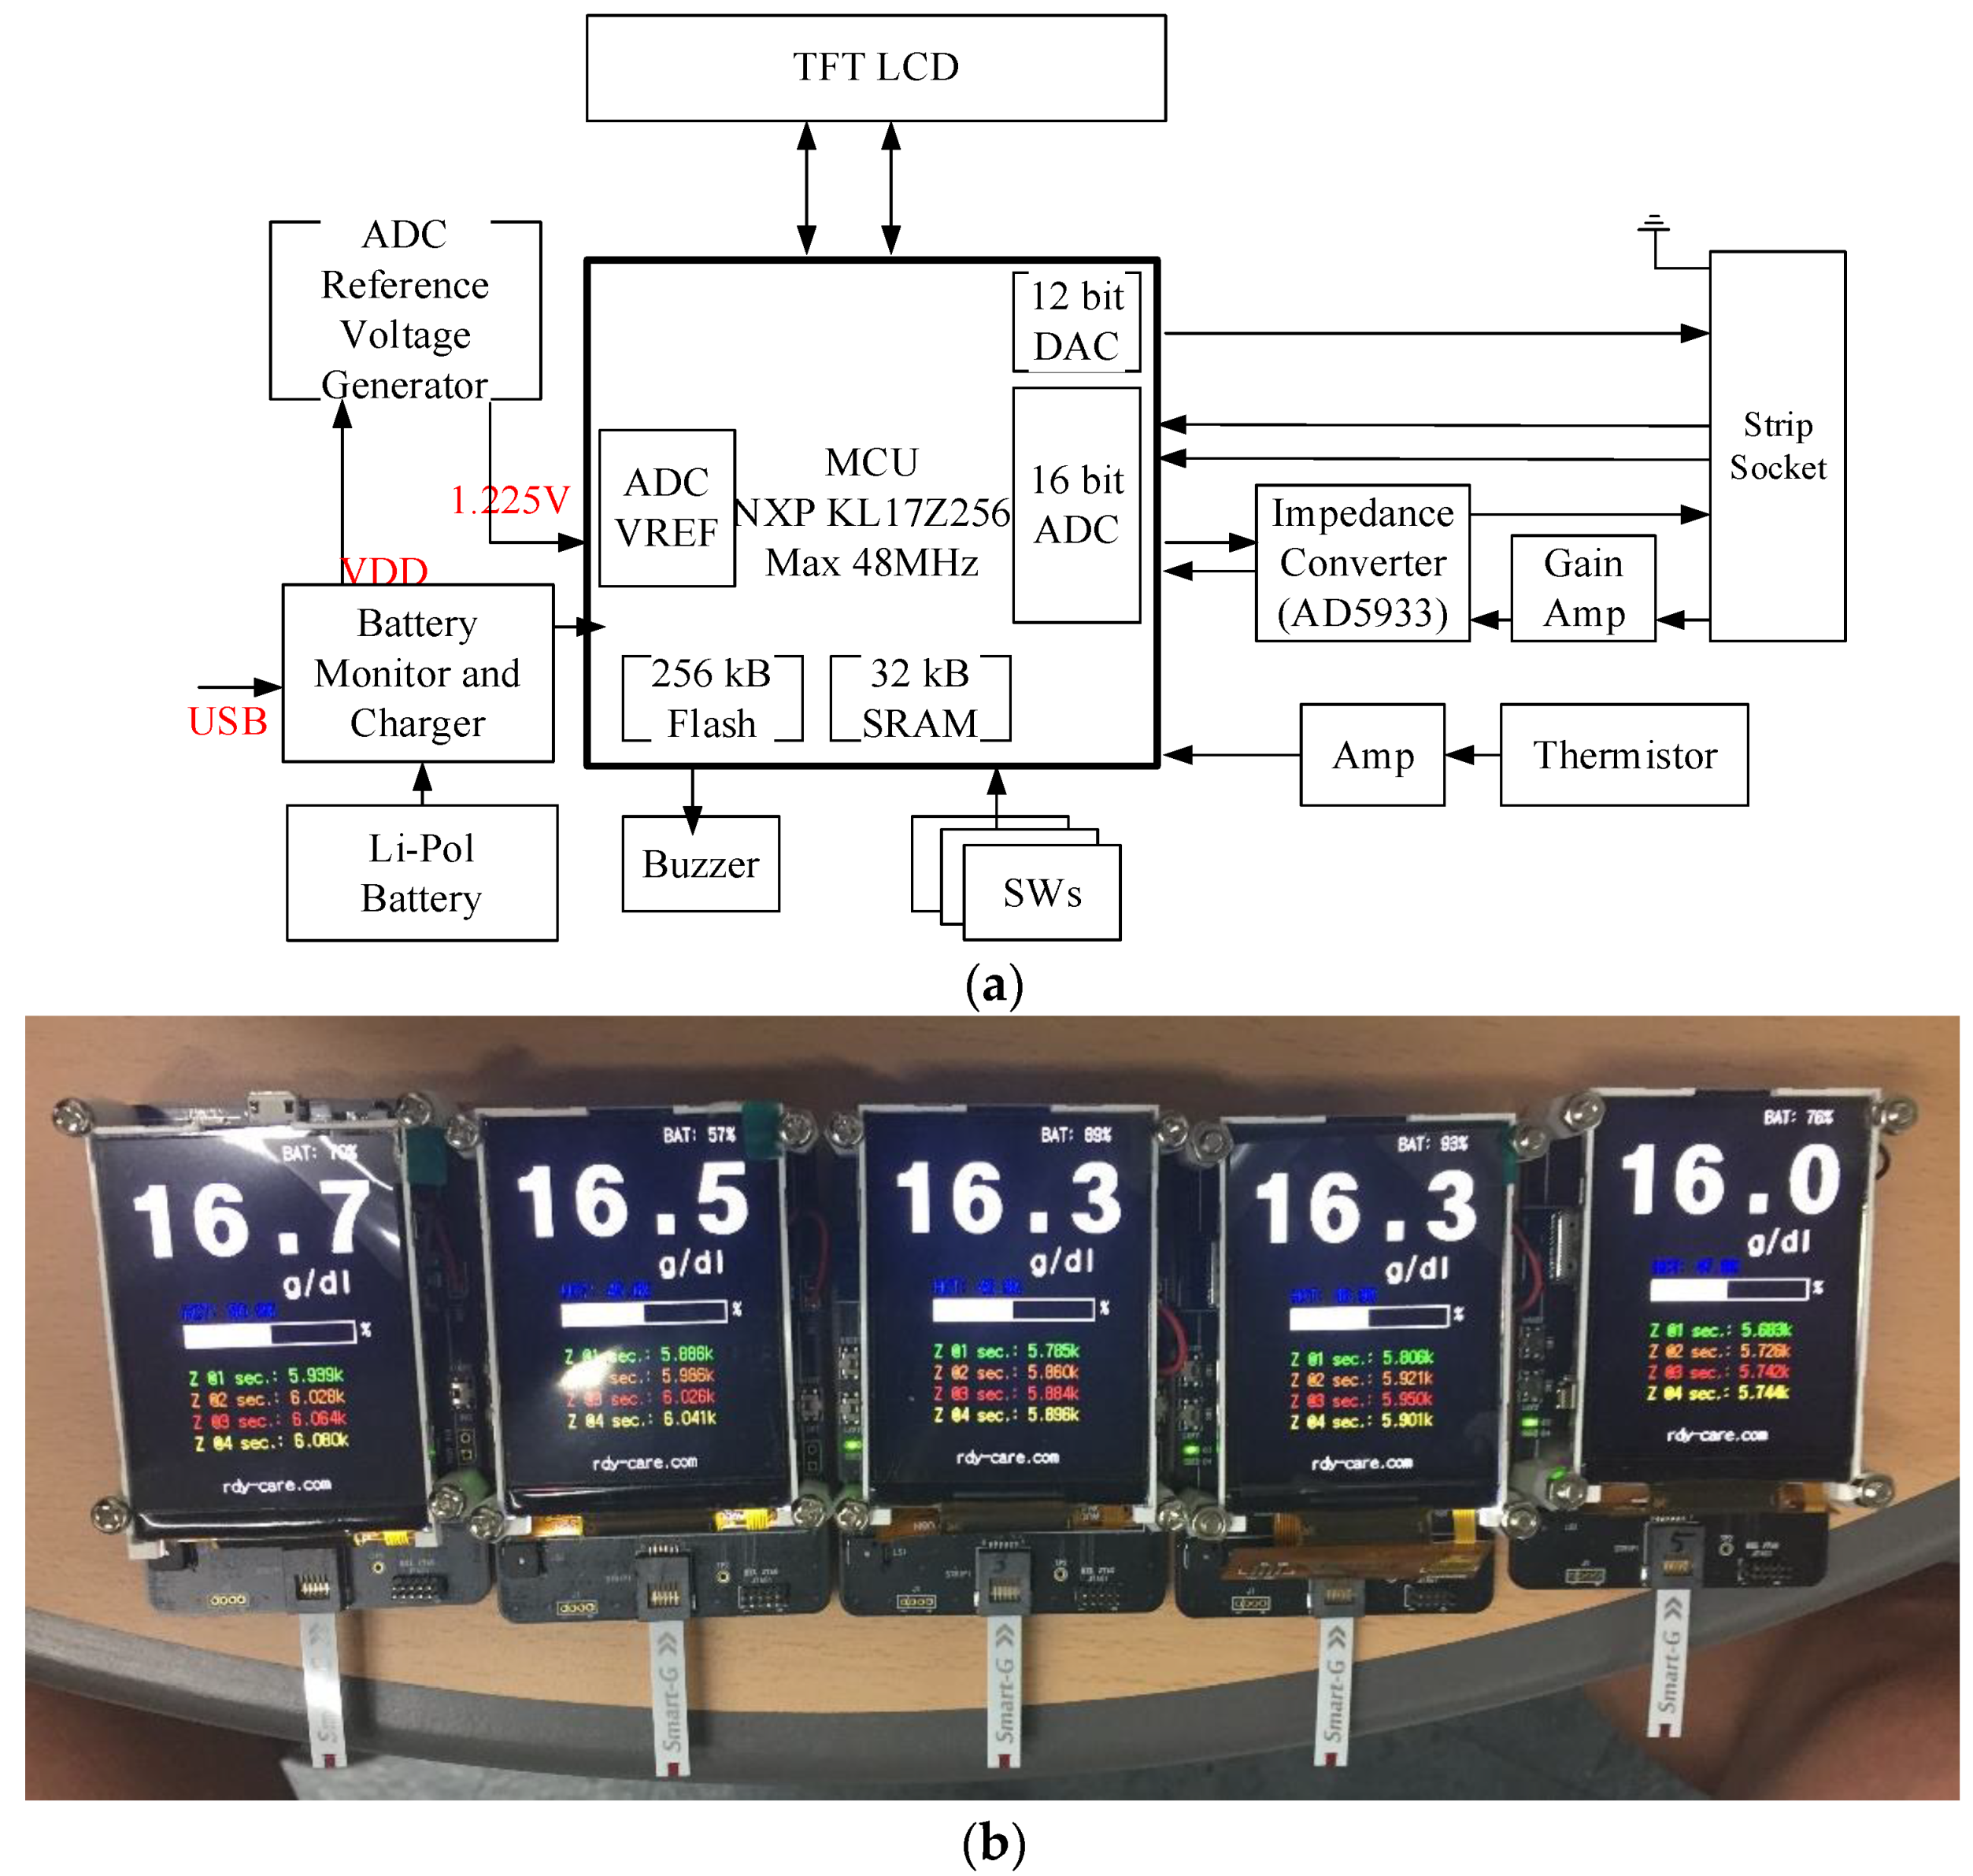
3.2. System Design of the Hemoglobin Meter
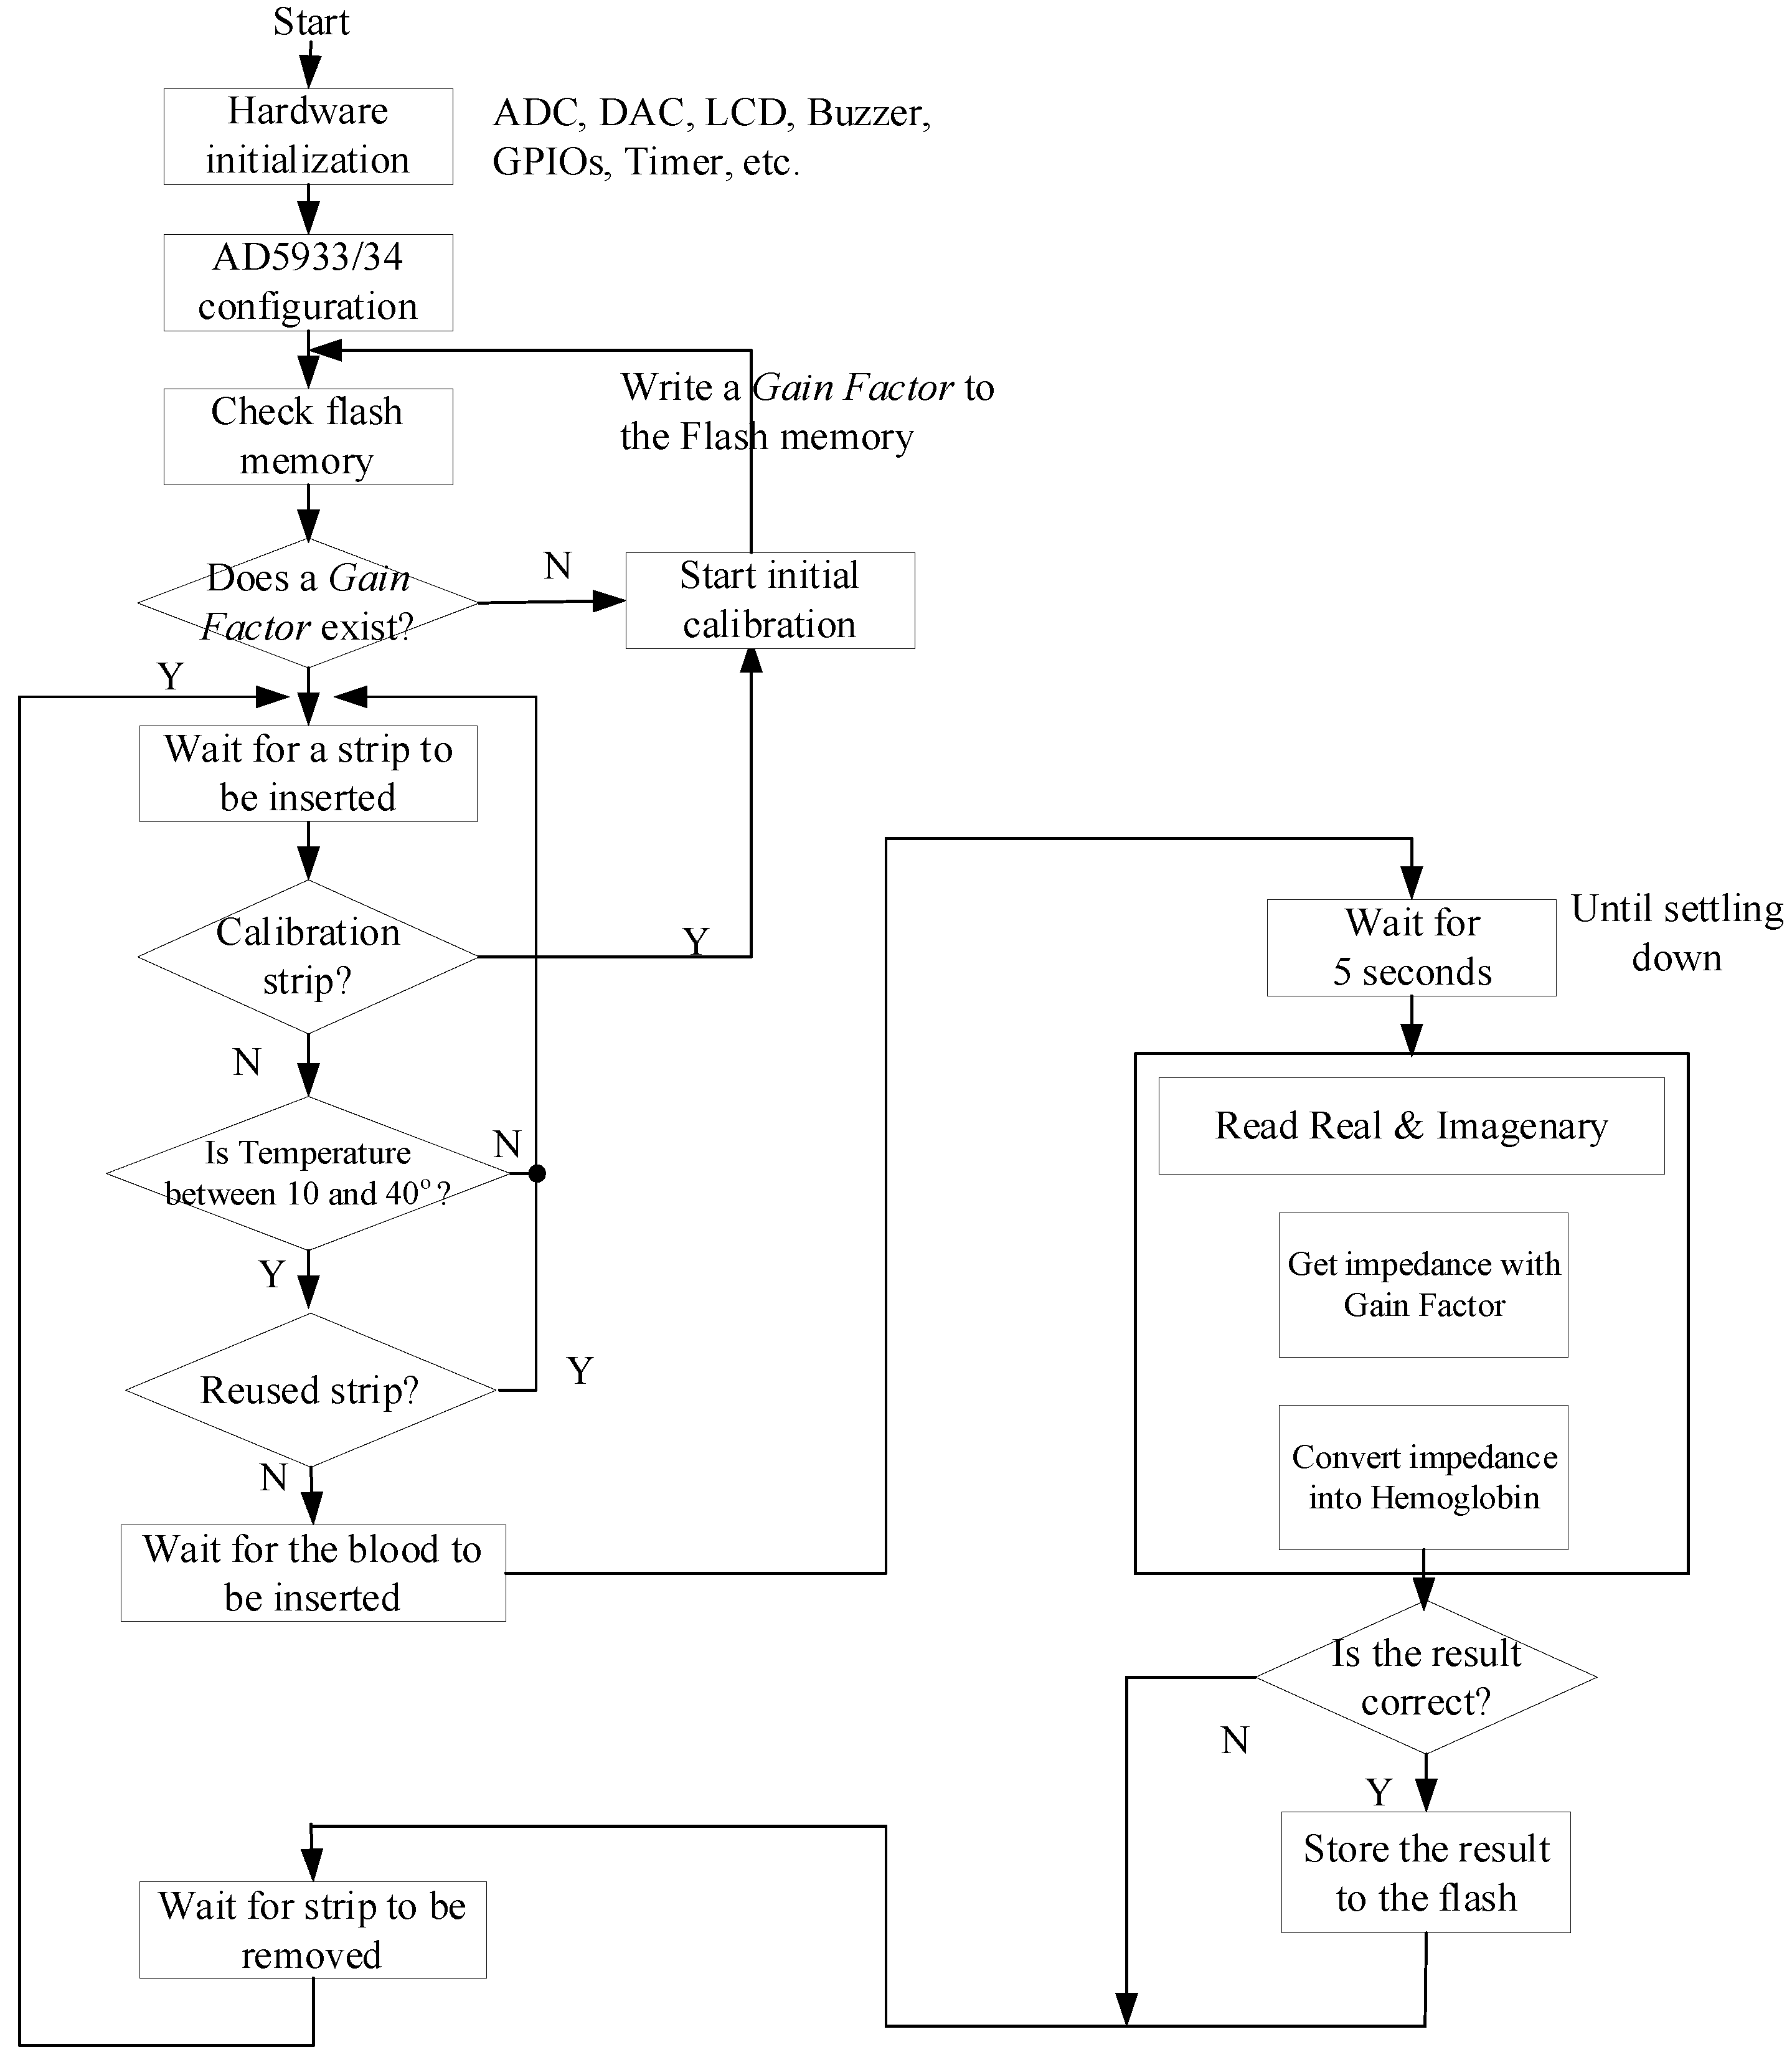
3.3. Software Operation of the Hemoglobin Meter
4. Experimental Results
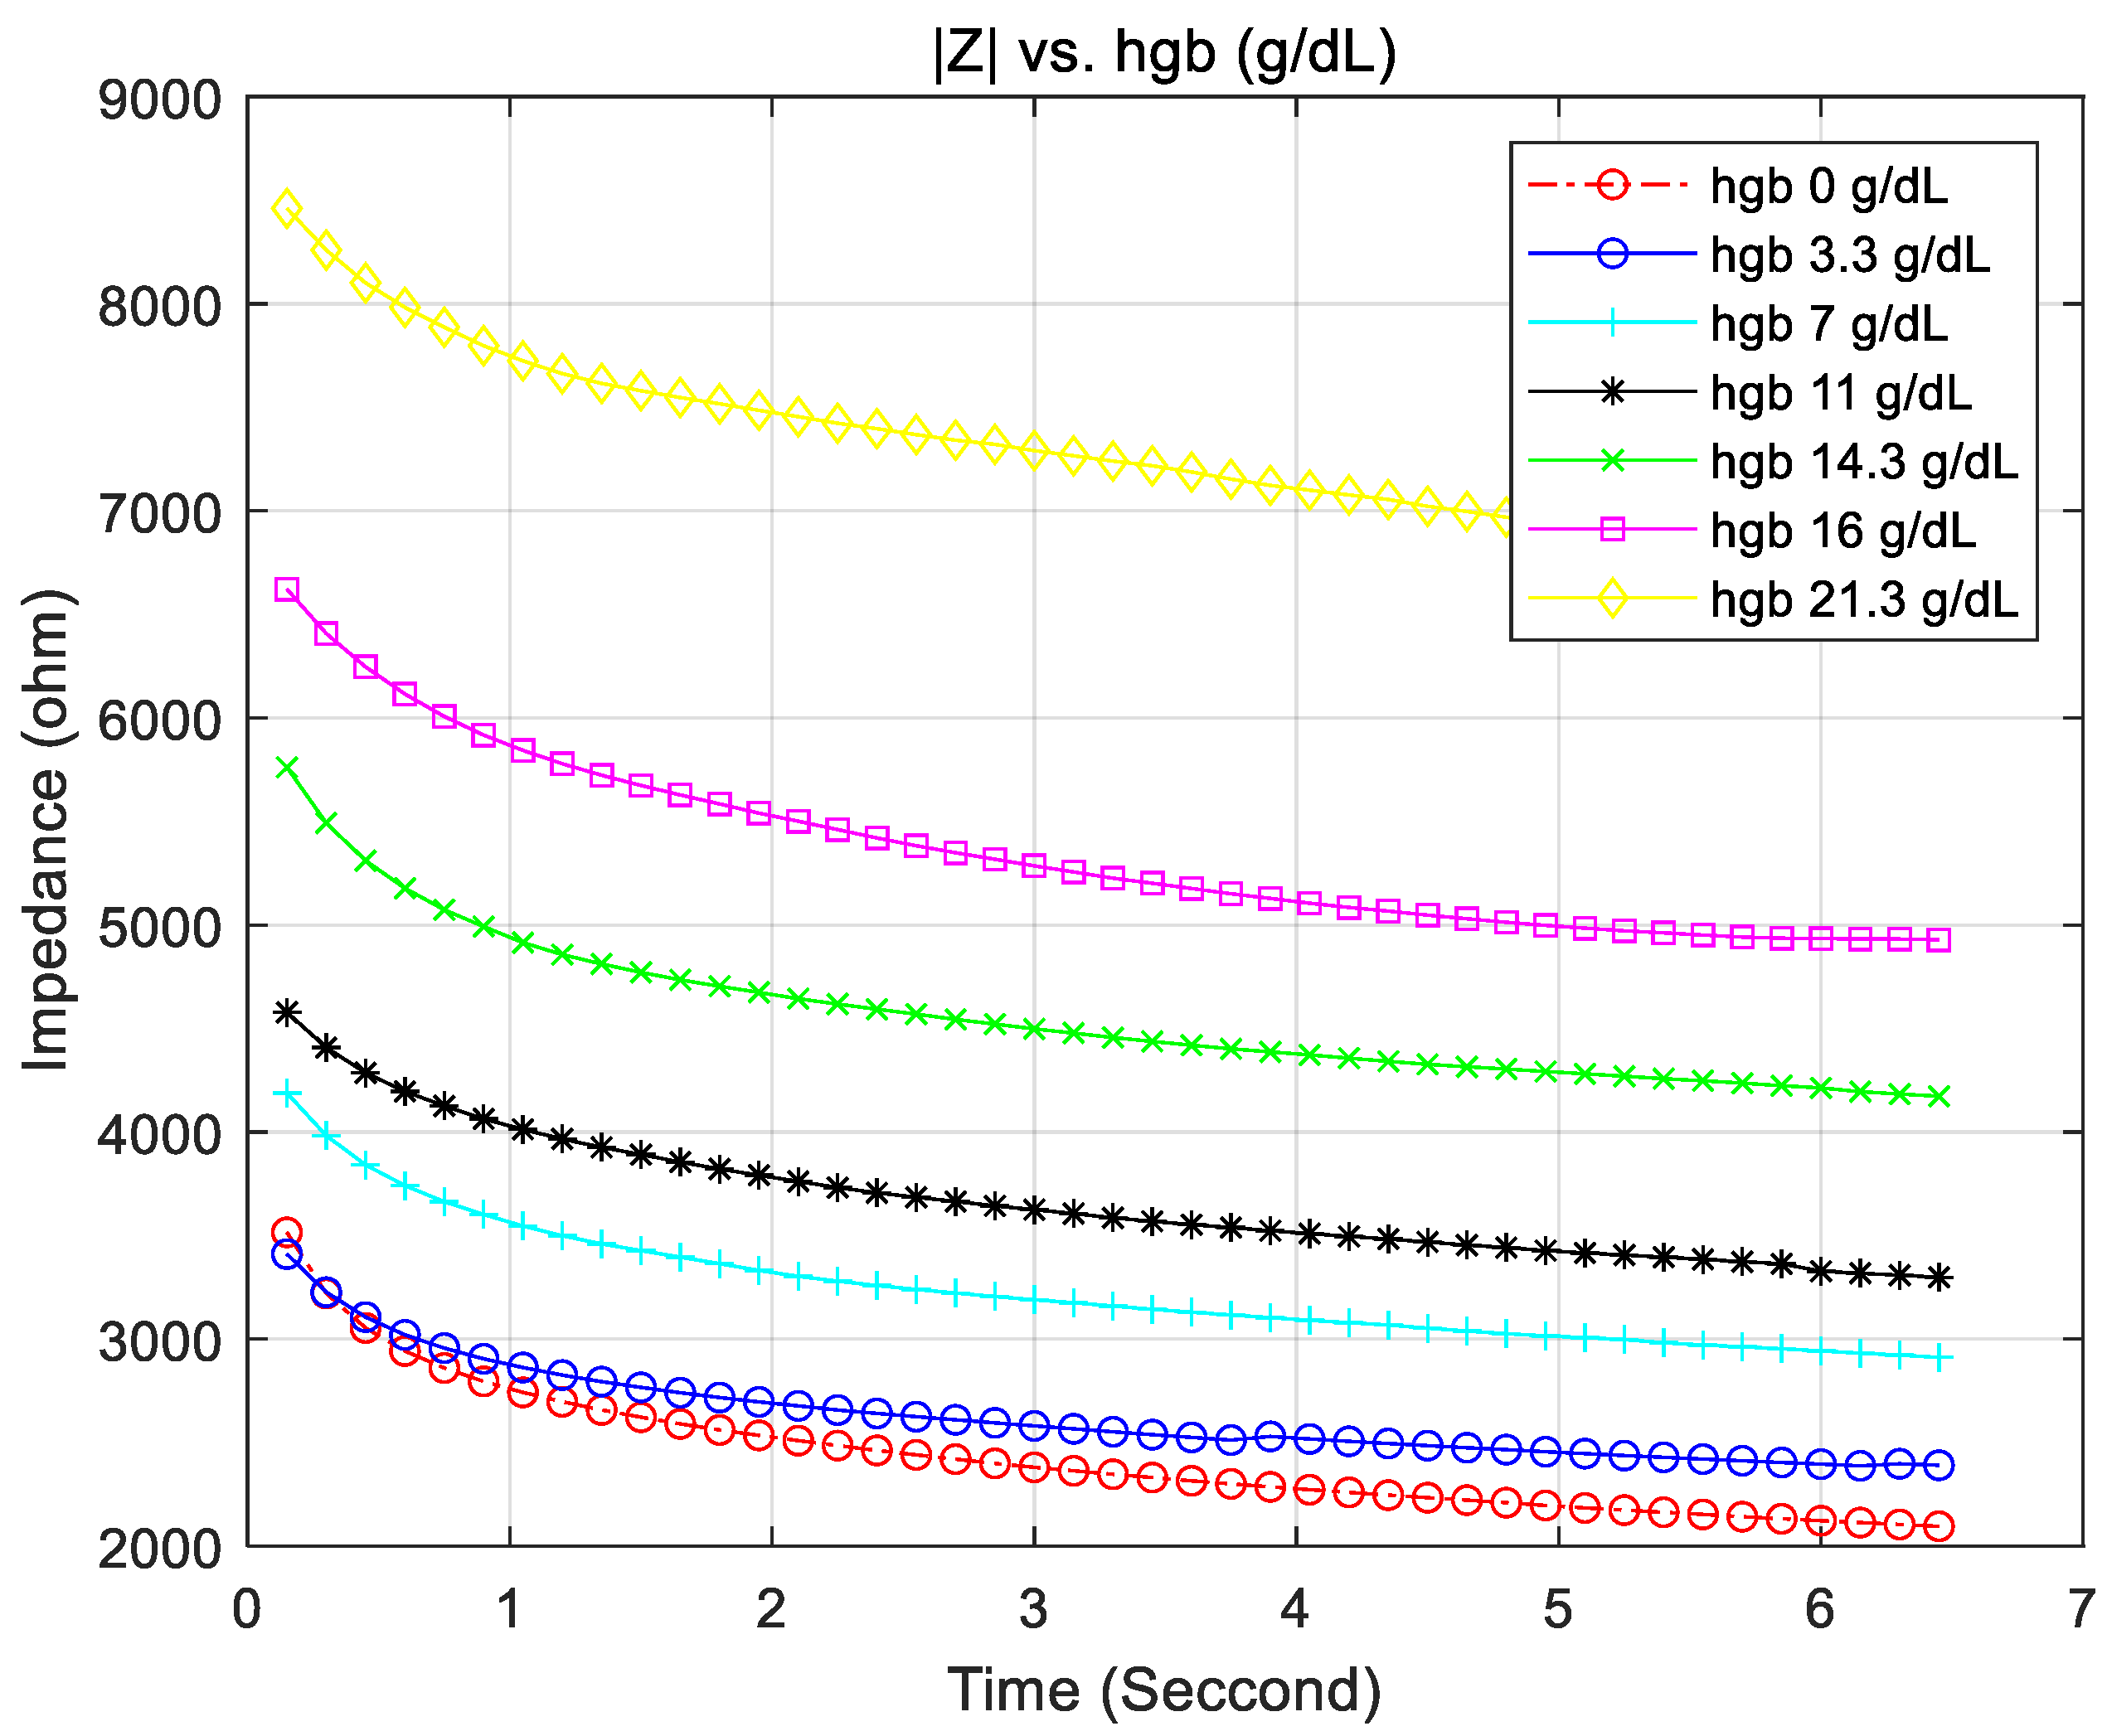
4.1. Hemoglobin vs. the Accuracy of the Measured Impedance
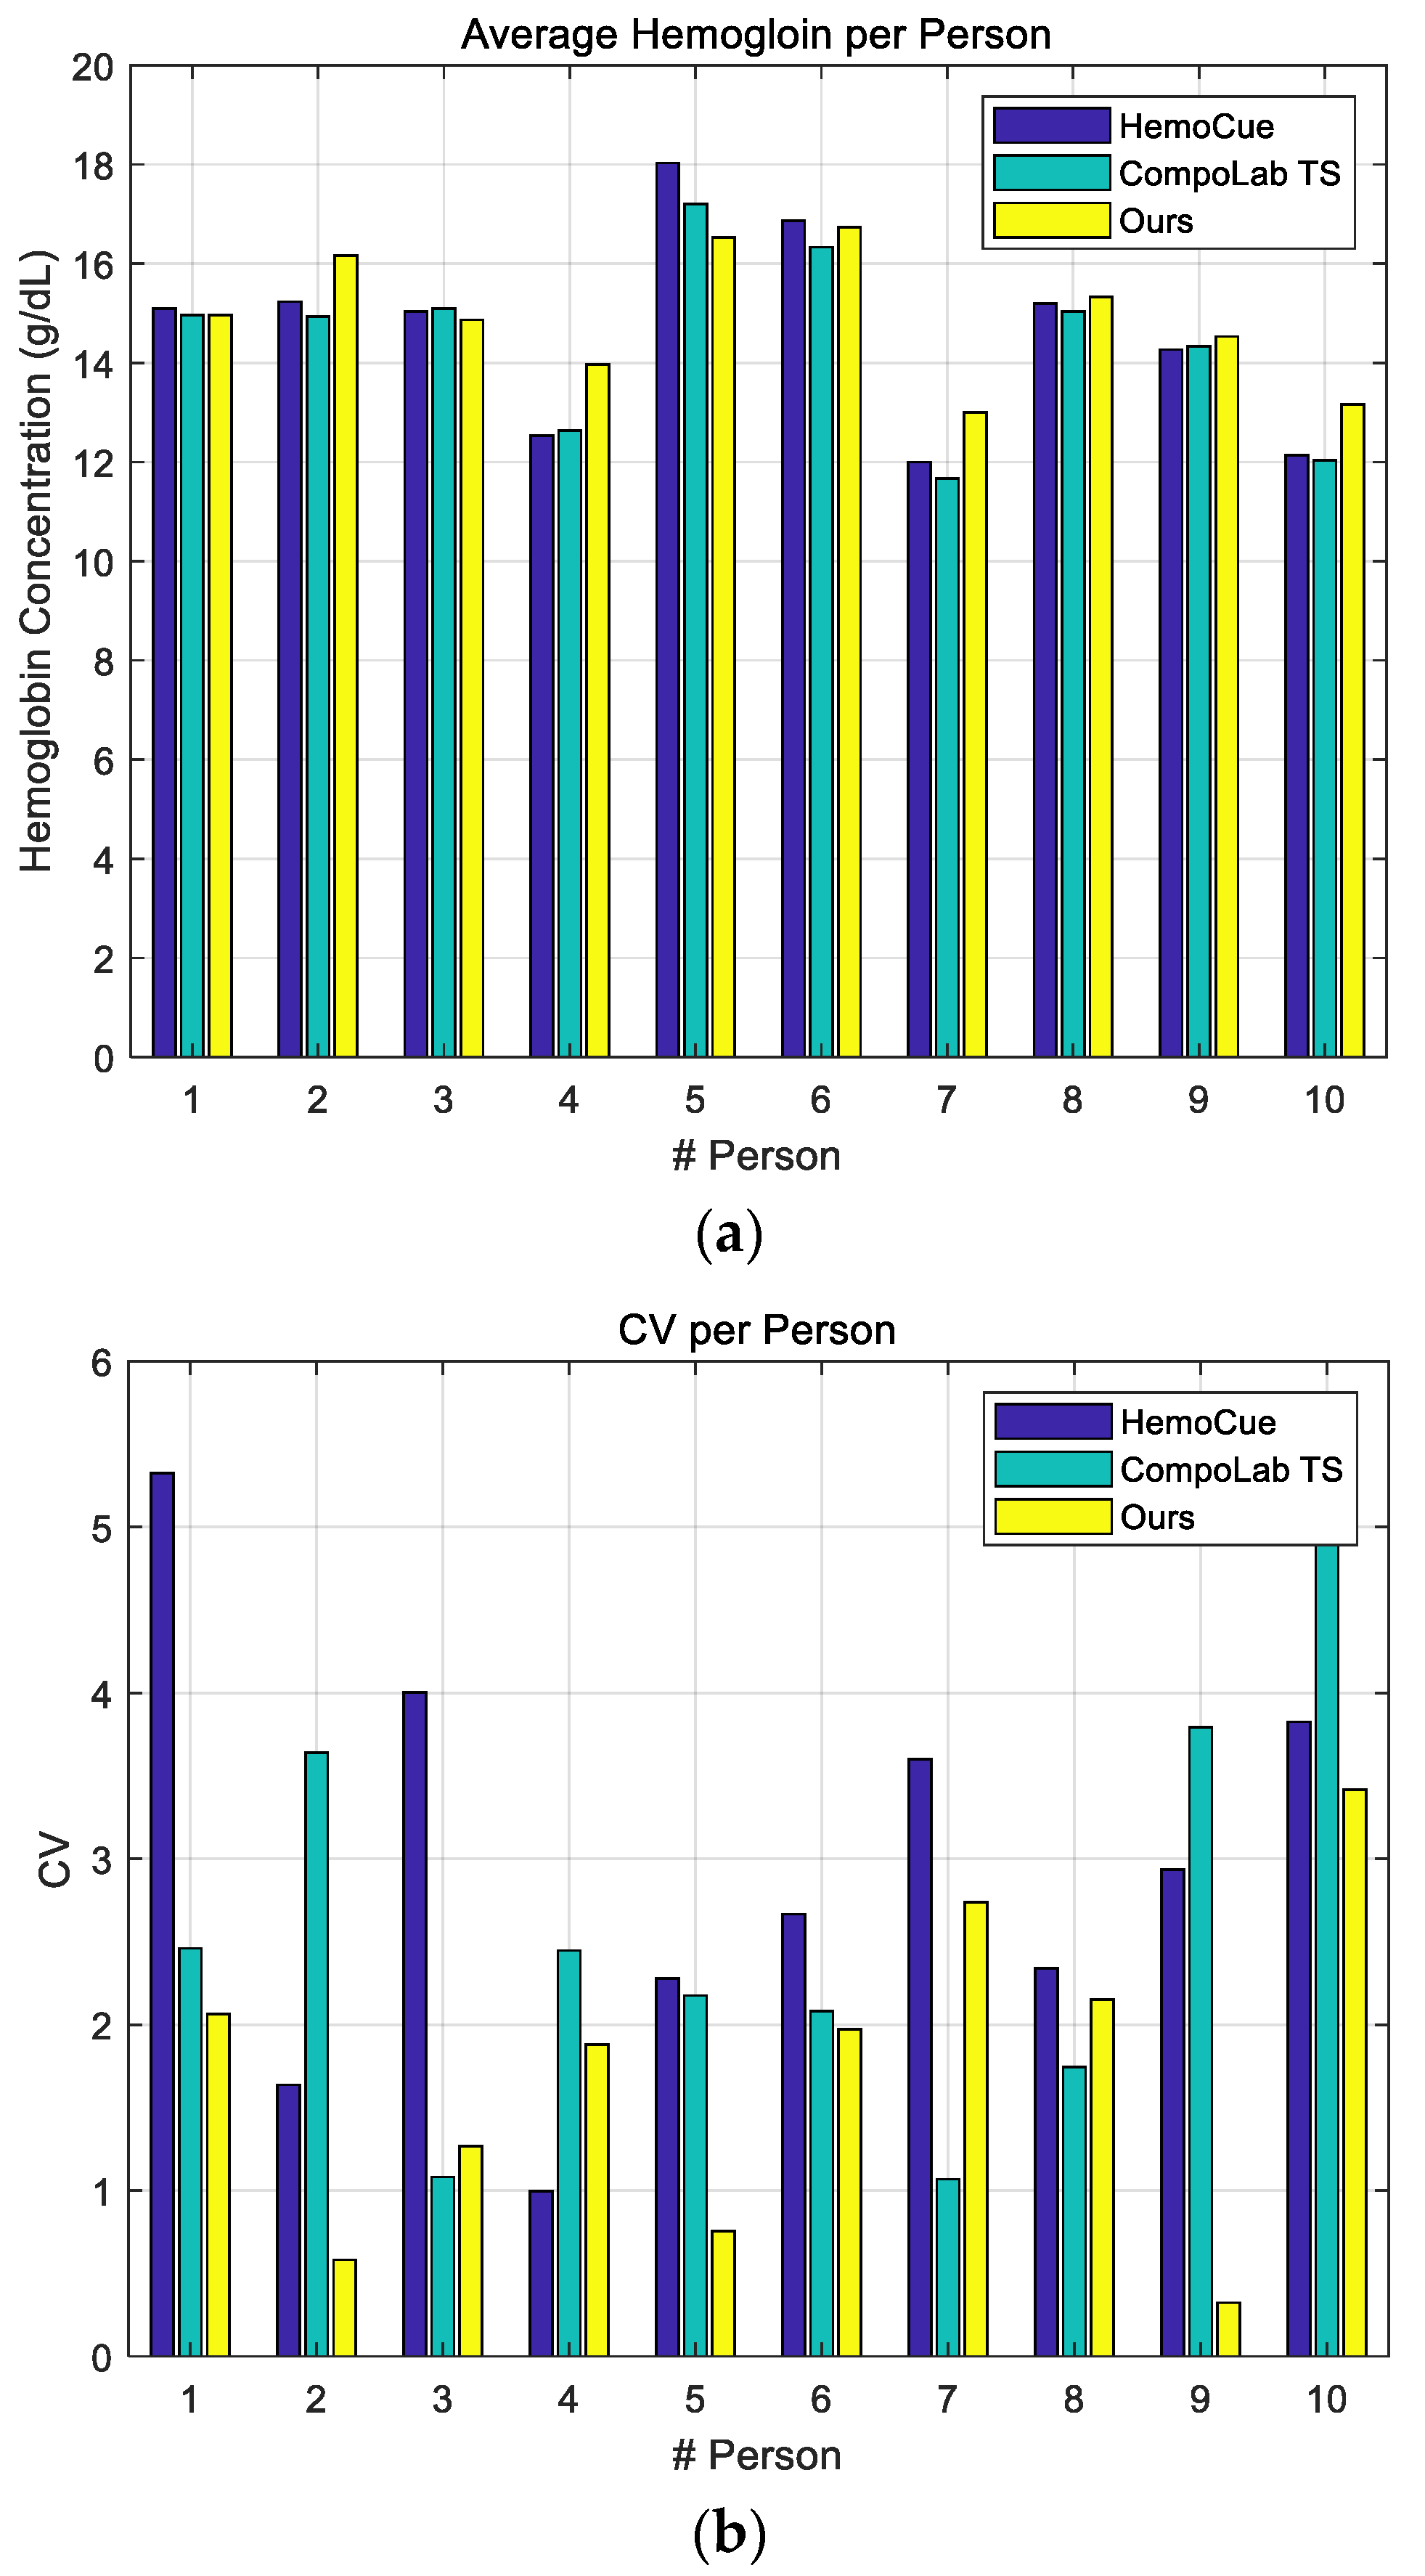
4.2. Performance Evaluation Using Human Blood
5. Conclusions
Author Contributions
Funding
Institutional Review Board Statement
Informed Consent Statement
Data Availability Statement
Conflicts of Interest
References
- Yap, B.K.; Soair, M.; Nur’Arifah, S.; Talik, N.A.; Lim, W.F.; Mei, I.L. Potential Point-of-Care Microfluidic Devices to Diagnose Iron Deficiency Anemia. Sensors 2018, 18, 2625. [Google Scholar] [CrossRef] [PubMed] [Green Version]
- Janz, T.G.; Johnson, R.L.; Rubenstein, S.D. Anemia in the emergency department: Evaluation and treatment. Emerg. Med. Pract. 2016, 15, 1–15. [Google Scholar]
- GBD 2015 Disease and Injury Incidence and Prevalence Collaborators. Global, regional, and national incidence, prevalence, and years lived with disability for 310 diseases and injuries, 1990–2015: A systematic analysis for the Global Burden of Disease Study 2015. Lancet 2017, 388, 1545–1602. [Google Scholar]
- Tayles, N. Anemia, genetic diseases, and malaria in prehistoric mainland Southeast Asia. Am. J. Phys. Anthropol. 1996, 101, 11–27. [Google Scholar] [CrossRef]
- Mayo Foundation for Medical Education and Research. Anemia. Available online: https://www.mayoclinic.org/diseases-conditions/anemia/symptoms-causes/syc-20351360 (accessed on 24 June 2021).
- WHO. Anemia. Available online: https://www.who.int/health-topics/anaemia#tab=tab_1 (accessed on 24 June 2021).
- Research and Market. The Hemoglobin Testing—Global Market Trajectory & Analytics. Available online: https://www.businesswire.com/news/home/20200903005654/en/Global-Hemoglobin-Testing-Industry-2020-to-2027---Market-Trajectory-Analytics---ResearchAndMarkets.com (accessed on 1 September 2020).
- Son, Y.; Park, C.; Min, H.; Lee, I.; Yoo, S.; Lee, S.; Kim, B.; Kim, J. Safety and Testing Guideline for POCT Automatic Hemoglobin Meter; Ministry of Food and Drug Safety: Cheongju, Korea, 2017; (In Korean). Available online: https://www.mfds.go.kr (accessed on 29 November 2021).
- Srivastava, T.; Negandhi, H.; Neogi, S.B.; Sharma, J.; Saxena, R. Methods for hemoglobin estimation: A review of “What Works”. J. Hemotol. Transf. 2014, 2, 1028. [Google Scholar]
- HemoCue. HemoCue Hb 301 System Manual. Available online: https://www.hemocue.com/en/solutions/hematology/hemocue-hb-301-system (accessed on 24 June 2021).
- Rippmann, C.E.; Nett, P.C.; Popovic, D.; Seifert, B.; Pasch, T.; Spahn, D.R. HemoCue, an Accurate Bedside Method of Hemoglobin Measurement. J. Clin. Monit. 1997, 13, 373–377. [Google Scholar] [CrossRef] [PubMed]
- Fresenuis Kabi. CompoLab TS Manual. Available online: https://www.fresenius-kabi.com/in/products/compolab-ts (accessed on 24 June 2021).
- CeraGem Medisys. Hb Plus Manual; CeraGem Medisys: Cheonan-si, Korea, 2014; Available online: http://www.gcmedis.com/kr/src/sub22.php (accessed on 29 November 2021).
- BeneCheck. BeneCheck Hb Manual; BeneCheck: 2021. Available online: https://palliance.se/wp-content/uploads/sites/6/2019/09/1150622205-Mission-plus-CE-Hb-Users-Manual-English-030816.pdf (accessed on 29 November 2021).
- Kraitl, J.; Timm, U.; Ewald, H.; Lewis, E. Non-invasive sensor for an in vivo hemoglobin measurement. In Proceedings of the IEEE Sensors, Limerick, Ireland, 28–31 October 2011; pp. 276–279. [Google Scholar]
- Timm, U.; McGrath, D.; Lewis, E.; Kraitl, J.; Ewald, H. Sensor system for non-invasive optical hemoglobin determination. In Proceedings of the IEEE Sensors, Christchurch, New Zealand, 25–28 October 2009; pp. 1975–1978. [Google Scholar]
- Punter-Villagrasa, J.; Cid, J.; Páez-Avilés, C.; Rodríguez-Villarreal, I.; Juanola-Feliu, E.; Colomer-Farrarons, J.; Miribel-Català, P.L. An Instantaneous Low-Cost Point-of-Care Anemia Detection Device. Sensors 2015, 15, 4564–4577. [Google Scholar] [CrossRef] [PubMed] [Green Version]
- Chakraborty, S.; Das, S.; Das, C.; Chandra, S.; Sharma, K.D.; Karmakar, A.; Chattoapadhyay, S. On-chip estimation of hematocrit level for diagnosing anemic conditions by Impedimetric techniques. Biomed. Microdev. 2020, 22, 38. [Google Scholar] [CrossRef] [PubMed]
- Reis, G.; Tan, X.; Kraft, L.; Yilmaz, M.; Schoeb, D.S.; Miernik, A. Safe Hb Concentration Measurement during Bladder Irrigation Using Artificial Intelligence. Sensors 2021, 21, 5723. [Google Scholar] [CrossRef] [PubMed]
- NXP. NXP KL17Z Datasheet. Available online: https://www.nxp.com (accessed on 24 June 2021).
- TI. LM4041-N Precision Micropower Shunt Voltage Reference Datasheet. 2016. Available online: https://www.ti.com (accessed on 29 November 2021).
- Analog Devices. AD5933 Impedance Converter Datasheet. Available online: https://www.analog.com/en/products/ad5933.html (accessed on 24 June 2021).
- Analog Devices. Circuit Note CN-0217. Available online: https://www.analog.com/en/design-center/reference-designs/circuits-from-the-lab/cn0217.html (accessed on 24 June 2021).
- Cho, H. Design and Implementation of a Blood-Glucose Meter to Reduce Hematocrit Interference. IEMEK J. Embed. Syst. Appl. 2020, 15, 167–175. (In Korean) [Google Scholar]
- Shimpi, P.D.; Yadav, D.M. Bio-impedance Detection using AD5933 Impedance Converter Analyzer. Int. J. Sci. Res. 2015, 4, 2015. [Google Scholar]
- Analog Device. Evaluation Board User Guide: UG-364. Available online: https://www.analog.com/media/en/technical-documentation/user-guides/ug-364.pdf (accessed on 11 November 2021).
- Djermanova, N.J.; Kiss’ovski, J.G.; Vatchkov, V.A. Portable Arduino-Based LCR–Meter. Annu. J. Electron. 2014, 170–173. [Google Scholar]
- Chabowski, K.; Piasecki, T.; Dzierka, A.; Nitsch, K. Simple wide frequency range impedance meter based on ad5933 integrated circuit. Metrol. Meas. Syst. 2015, 22, 13–24. [Google Scholar] [CrossRef]
- Aalen, O.O. A linear regression model for the analysis of life times. Stat. Med. 1989, 8, 907–925. [Google Scholar] [CrossRef] [PubMed]
- Yao, W.; Longhai, L. A new regression model: Modal linear regression. Scand. J. Stat. 2014, 41, 656–671. [Google Scholar] [CrossRef] [Green Version]
- Carneiro, I.A.; Drakeley, C.J.; Owusu-Agyei, S.; Mmbando, B.; Chandramohan, D. Haemoglobin and haematocrit: Is the threefold conversion valid for assessing anaemia in malaria-endemic settings? Malar. J. 2007, 6, 1–5. [Google Scholar] [CrossRef] [PubMed] [Green Version]
- Rudolf, J.; Douglass, J.; Baron, J.; Lewandrowski, K. Evaluation of the i-STAT point-of-care capillary whole blood hematocrit and hemoglobin: Comparison to the Siemens RAPIDLab 1200, Sysmex XE5000, and manual spun hematocrit. Clin. Chim. Acta 2015, 446, 37–42. [Google Scholar] [CrossRef] [PubMed]


| Male Adult | <13 g/dL |
| Female Adult | <12 g/dL |
| Age 6~16 Years | <12 g/dL |
| Age 6 Months~6 Years | <11 g/dL |
| Pregnancy | <11 g/dL |
| Reference |z| (Unit: Ω) | 680 | 0.98 k | 1.96 k | 20.18 k | 32.8 k | 50.58 k |
| Mean of Measured |z| (Unit: Ω) | 695.3 | 0.998 k | 1.99 k | 20.34 k | 32.8 k | 49.91 k |
| Std. Dev. (Unit: Ω) | 3.91 | 5.44 | 10.6 | 137.85 | 211.75 | 454.74 |
| Std. Dev. (Unit: %) | 0.58 | 0.55 | 0.54 | 0.68 | 0.65 | 0.9 |
Publisher’s Note: MDPI stays neutral with regard to jurisdictional claims in published maps and institutional affiliations. |
© 2021 by the authors. Licensee MDPI, Basel, Switzerland. This article is an open access article distributed under the terms and conditions of the Creative Commons Attribution (CC BY) license (https://creativecommons.org/licenses/by/4.0/).
Share and Cite
Cho, H.; Lee, S.-R.; Baek, Y. Anemia Diagnostic System Based on Impedance Measurement of Red Blood Cells. Sensors 2021, 21, 8043. https://doi.org/10.3390/s21238043
Cho H, Lee S-R, Baek Y. Anemia Diagnostic System Based on Impedance Measurement of Red Blood Cells. Sensors. 2021; 21(23):8043. https://doi.org/10.3390/s21238043
Chicago/Turabian StyleCho, Hyuntae, Seung-Ro Lee, and Yunju Baek. 2021. "Anemia Diagnostic System Based on Impedance Measurement of Red Blood Cells" Sensors 21, no. 23: 8043. https://doi.org/10.3390/s21238043
APA StyleCho, H., Lee, S.-R., & Baek, Y. (2021). Anemia Diagnostic System Based on Impedance Measurement of Red Blood Cells. Sensors, 21(23), 8043. https://doi.org/10.3390/s21238043