Abstract
Towards clarifying the spatio-temporal neurotransmitter distribution, potentiometric redox sensor arrays with 23.5-µm resolution were fabricated. The sensor array based on a charge-transfer-type potentiometric sensor comprises pixels with gold electrodes deposited on the surface of pixels. The sensor output corresponding to the interfacial potential of the electrode changed logarithmically with the mixture ratio of KFe(CN) and KFe(CN), where the redox sensitivity reached 49.9 mV/dec. By employing hydrogen peroxidase as an enzyme and ferrocene as an electron mediator, the sensing characteristics for hydrogen peroxide (HO) were investigated. The analyses of the sensing characteristics revealed that the sensitivity was about 44.7 mV/dec., comparable to the redox sensitivity, while the limit of detection (LOD) was achieved to be 1 µM. Furthermore, the oxidation state of the electron mediator can be the key to further lowering the LOD. Then, by immobilizing oxidizing enzyme for HO and glutamate oxidase, glutamate (Glu) measurements were conducted. As a result, similar sensitivity and LOD to those of HO were obtained. Finally, the real-time distribution of 1 µM Glu was visualized, demonstrating the feasibility of our device as a high-resolution bioimaging technique.
1. Introduction
Neurotransmitters (NTs) such as acetylcholine (ACh), dopamine (DO), glutamate (Glu), and amino butyric acid (GABA) are chemical messengers for signal transmission between synapses in central nerve systems (CNS), playing an important role in brain function including behavior and cognition [1]. Their irregular concentrations that affect the synaptic transmission are considered to be linked to various diseases such as Alzheimer’s, Parkinson’s disease, schizophrenia, and depression [2]. The concentration of NTs dynamically changes due to their release from a synapse followed by diffusion, reuptake, and enzyme degradation [3,4]. Therefore, clarifying the relationship between the extracellular spatio-temporal distribution of NTs and human behavior is of great importance for diagnosis, leading to the development of remedies for these diseases [5,6].
For these purposes, various methods for the detection of NTs were developed [3,7,8,9]. Among them, electrochemical (EC) sensors were extensively studied due to their potential to fast response, label-free, high-sensitivity, low-cost, and easy-to-use testing systems [10]. In previous reports, EC detection of NTs listed above: ACh [11,12,13,14,15,16], DO [17,18,19,20,21,22], Glu [15,23,24,25,26,27,28,29,30,31], and GABA [32,33,34,35], was reported. These EC devices were improving their limit of detection (LOD) by modifying their electrode materials and structures, and demonstrated submicromolar LOD [14,21,22]. More recently, electrochemical sensor arrays attracted attention to capturing the spatio-temporal concentration of NTs. EC sensors were advancing their resolution and pixel density by utilizing microfabrication technology to achieve sub-mm order spatial resolution [36,37,38,39,40,41,42]. Tedjo et al. fabricated 4096-channel microelectrode array (MEA) with the spatial resolution of , and reported the detection of catecholamines down to 8 M. Dudina et al. integrated 9216 carbon nanotube field-effect transistors into an array. They demonstrated Glu detection down to the concentration 10 M by a single channel. Although these reports achieved the pixel number of the order of 1000 with the pixel pitch of the order of 10 m, the amperometric sensor arrays generally suffer from the reduction in signal current with decreasing the area of working electrodes. Since the reduction in the signal current is directly linked to the deterioration of LOD, that fact imposes difficulty in achieving a higher spatial resolution to the level required to capture the NT dynamics, which is considered to be the order of 1 m [4], while keeping low LOD.
On the contrary, potentiometric sensors detect the interfacial potential of a working electrode, which follows the Nernst equation. Their output signal ideally does not change with the element size, and thus, they are advantageous for miniaturized sensor arrays. In particular, we were developing electrochemical imaging techniques based on charge-transfer-type (CTT) potentiometric sensor arrays. The sensors fabricated based on CMOS technology comprises pixels with spatial and temporal resolution of 23.5 and 33 ms, respectively, and demonstrated real-time pH imaging [43]. The array enabled the real-time imaging of pH changes in a brain tissue in vivo [44]. In a recent development, the sensor array with pixels shrunk its pixel area down to 2 m with the temporal resolution of 0.5 ms [45], showing the potential as a high spatio-temporal pH imaging technique. It was also demonstrated that the array applies to the detection of biomolecules including ACh [46] and ATP [47,48], based on acid generation by an enzymatic reaction. Although the CTT sensors showed the potential for the imaging of NTs, they suffer from low output signals in the application to living organisms including cells and tissues [48]. This comes from the fact that the sensor utilized pH change to capture the signal of NTs. Body fluid generally shows buffer action, which suppresses the pH change, and hence, the output signal of the CTT sensors is significantly reduced. Against this problem, we adopted redox electrodes [49,50] and developed Glu sensors that are insensitive to pH change, combining the enzymatic reaction with the redox species [51,52]
In this study, toward further improvement in imaging quality and LOD of the array, NT sensing characteristics based on redox potential were investigated in detail, setting Glu, one of the major NTs, as a target material. The measurement results, including the sensitivity among the pixels and calibration curve, were analyzed in detail and the decisive factor for LOD was discussed. Additionally, the imaging results for Glu are presented.
2. Experimental Procedure
2.1. Redox Reaction and Sensor Output
In this study, we employed horseradish peroxidase (HRP) and glutamate oxidase (GluOx) as enzymes to degrade HO and Glu, respectively. The enzyme-catalyzed reactions are described as follows [25]
In Equation (2), Fc and Fc indicate ferrocene in reduced and oxidized states, respectively. The potential of the Au layer is determined by the ratio of the electron mediators, and for diluted solution, well described as [49,53]
where is the potential in the standard state, R the gas constant, T temperature, and F Faraday constant. Square brackets in the second term indicate the concentration of the species. The output of each pixel in the sensor array () is related to as
where C is related to the interfacial potential of the reference electrode and others and can be regarded as a constant during the measurements. Hence, the changes in in response to the addition of substances (HO or Glu in this study) correspond to the changes in as
2.2. Device Fabrication
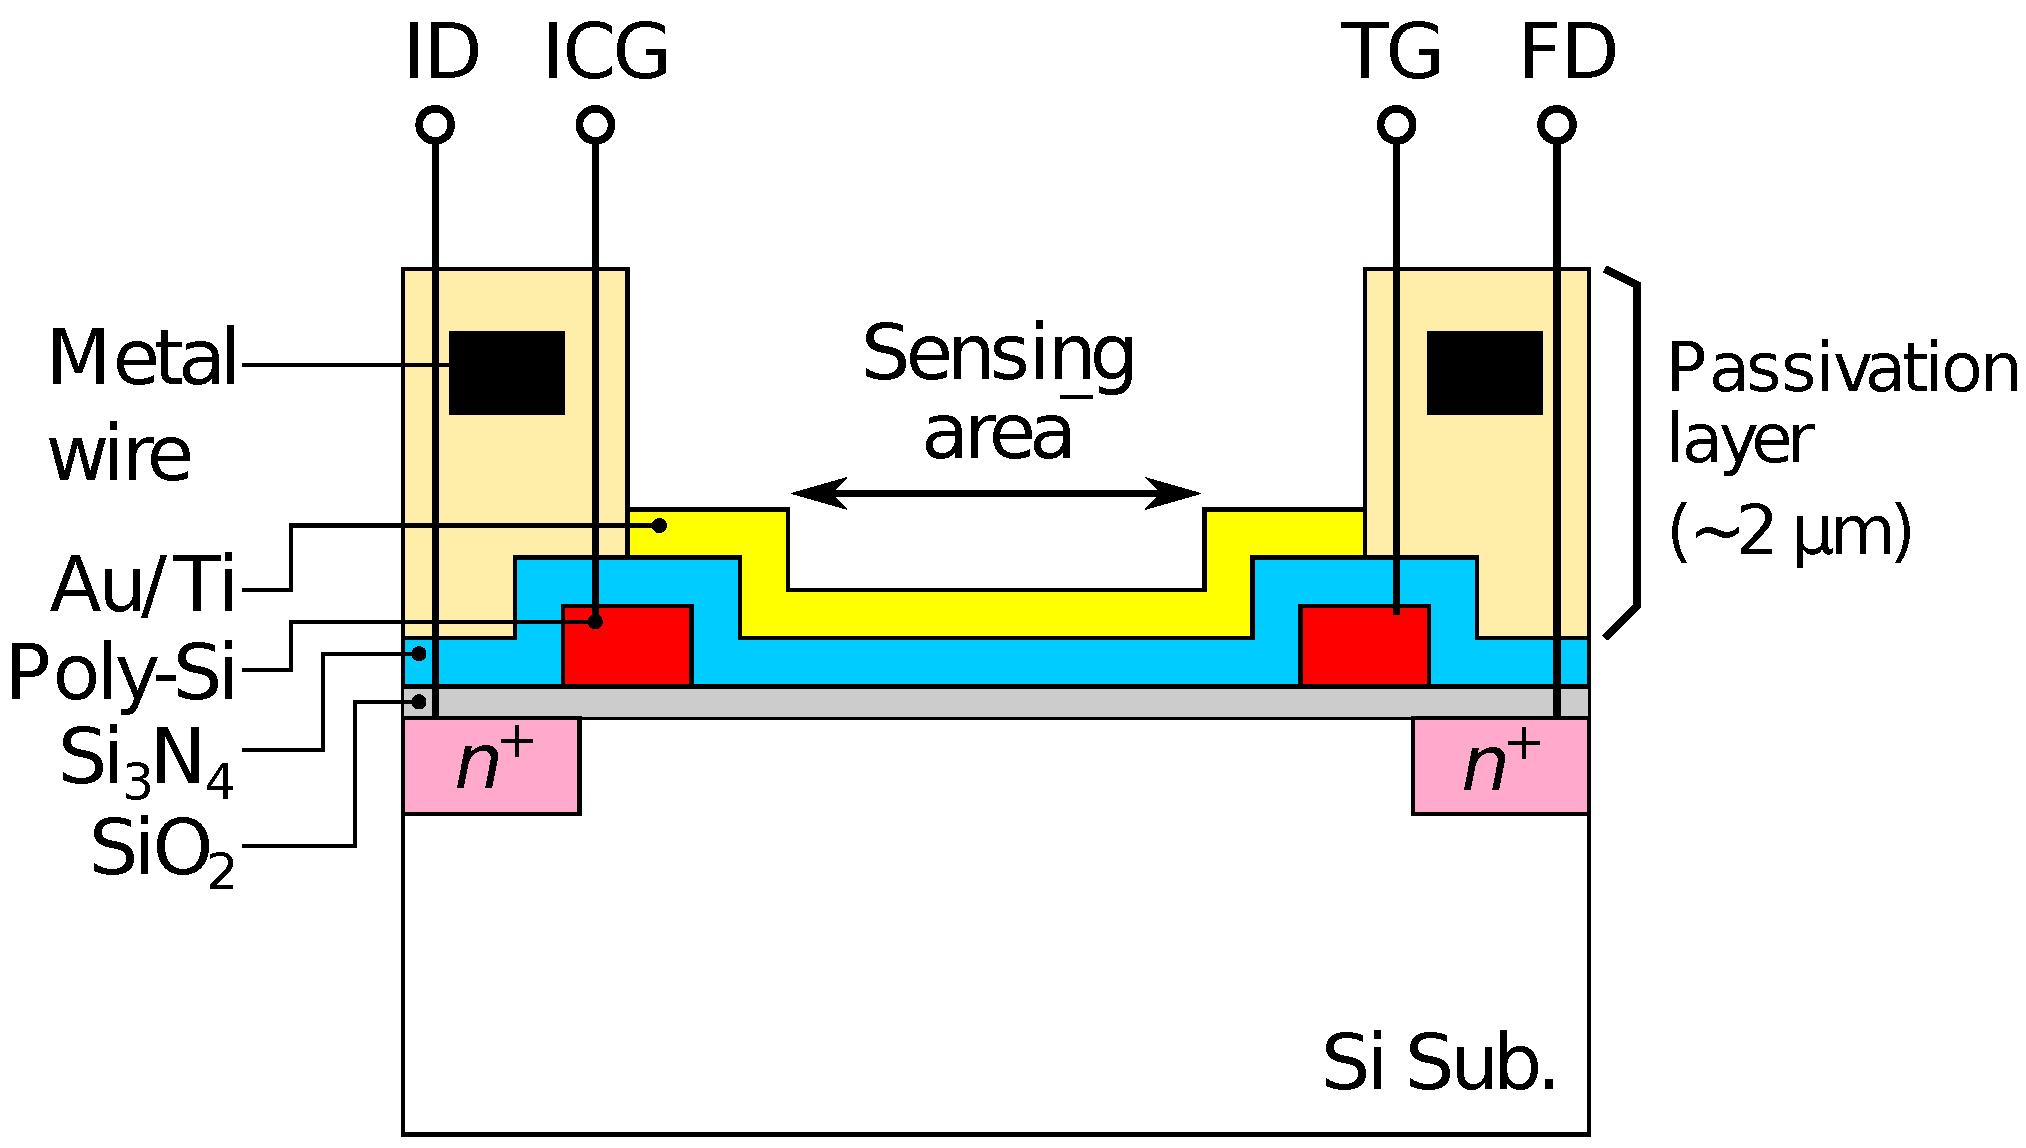
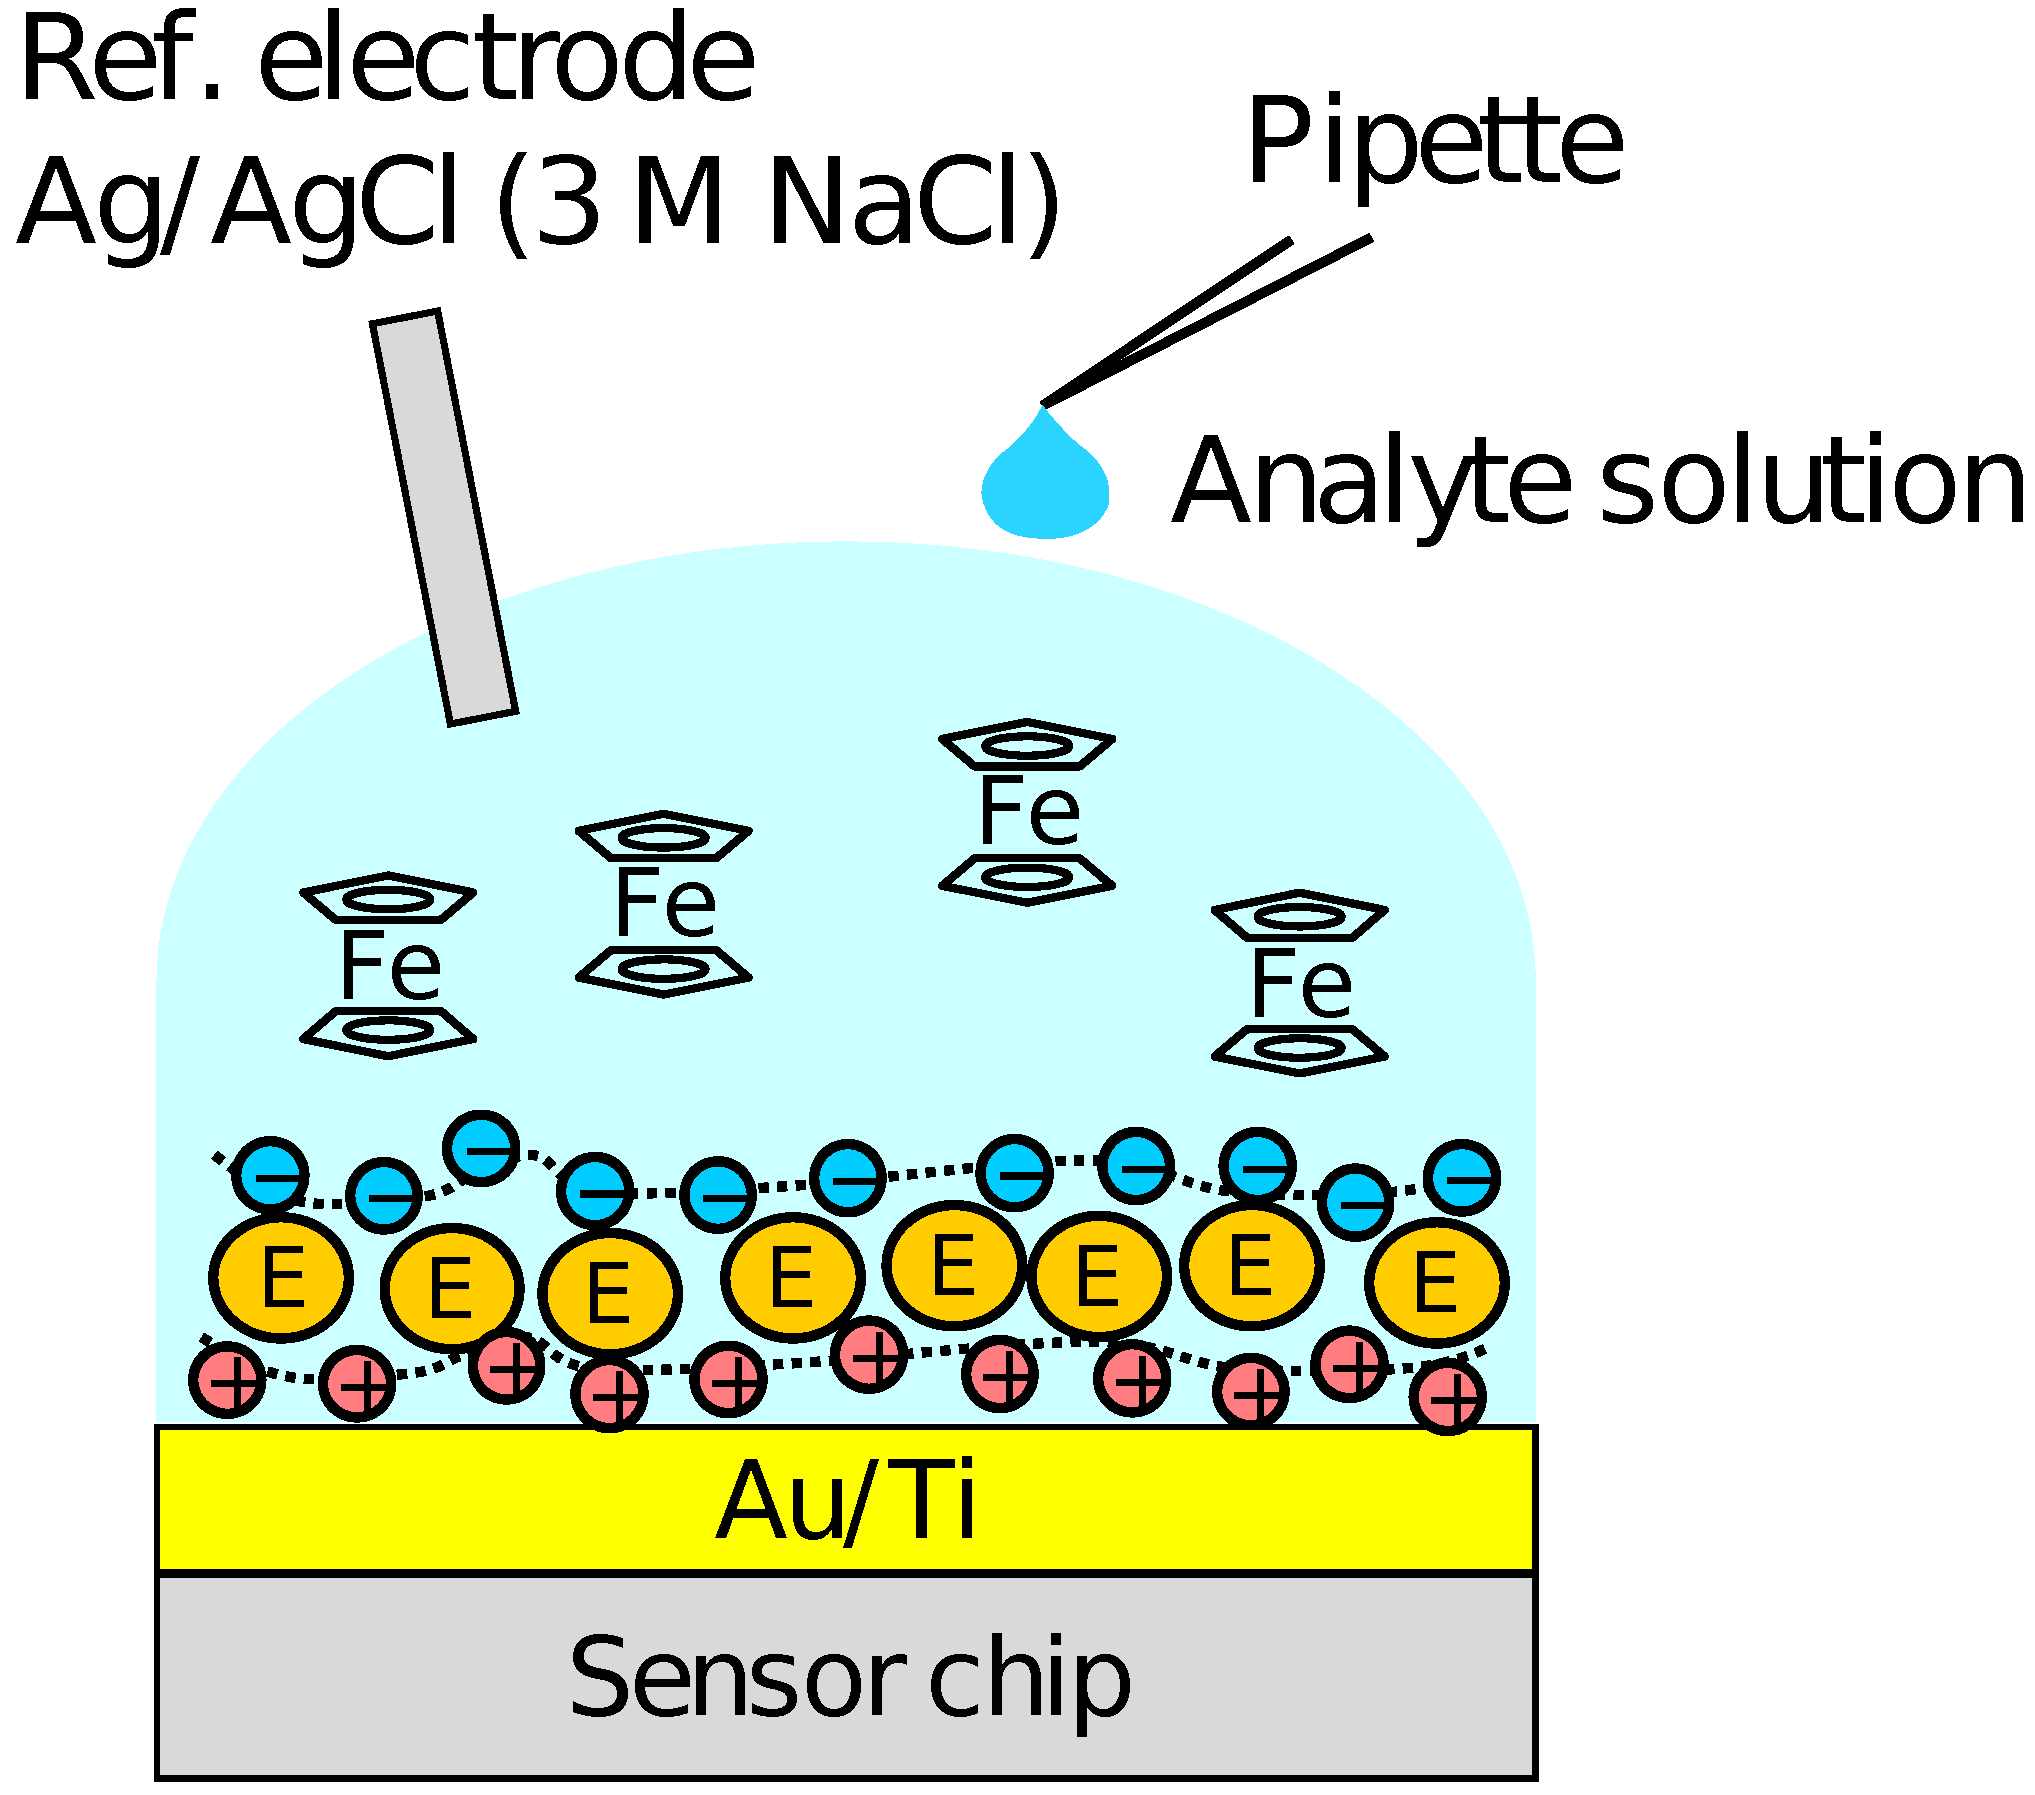
The redox sensor array was fabricated based on a CTT potentiometric sensor array. The potentiometric sensor array is fabricated based on complementary metal-oxide-semiconductor (CMOS) technology, and has 128 × 128 pixels with a pitch of 23.5 . The detailed structure and operational principle of the potentiometric sensor array are described elsewhere [43]. As the schematic cross-section of the pixel structure shown in Figure 1, a 20-nm-thick gold (Au) film with a 5-nm-thick titanium adhesion layer was evaporated on the sensing area of the array to form a redox electrode. For the detection of HO and Glu, Fc was used as an electron-mediator. The enzymes were immobilized by a poly-ion-complex (PIC) membrane, where poly-L-lysine (PLL) and poly(sodium 4-styrenesulfonate) (PSS) were employed as a polycation and a polyanion, respectively [51]. The PIC membrane was deposited by a conventional layer-by-layer method [54]. Firstly, a 10 of 60 mM PLL solution was dropped and dried for 10 min at room temperature (RT). Then, an enzyme solution containing 10 units of HRP and GluOx was dropped and dried at 4 C overnight. Finally, 10 of 75 mM PSS was dropped and dried for 1 h at RT.
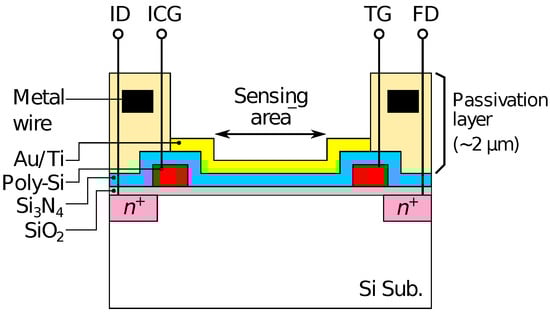
Figure 1.
Schematic illustration of pixel structure of fabricated device.
2.3. Materials
A recording medium (RM) composed of 135 mM NaCl, 5 mM KCl, 2 mM CaCl, 1 mM MgCl, 10 mM D-glucose, and 10 mM sodium 4-(2-hydroxyethyl)piperazine-1-ethanesulfonate (HEPES), where these substances were dissolved in deionized water (DIW) (18 at 298 K), was used to prepare sample solutions that mimic biological environments. To prepare the RM containing Fc, ferrocenyl methanol (FcMeOH) was employed. FeMeOH was first dissolved in ethanol, and then, the solution was mixed into the RM. On the other hand, the mixture of potassium hexacyanoferrate(III) [KFe(CN)] and potassium hexacyanoferrate(II) [KFe(CN)] was also used to examine the redox response of the sensors.
HRP, GluOx, and FcMeOH (95%) were purchased from Sigma–Aldrich Inc. Sodium HEPES (≥) was purchased from Dojindo Laboratries. NaCl, KCl, MgCl, HO (30.0%), ethanol (99%), KFe(CN)·3HO (99.5%), and KFe(CN) (99.0%) were purchased from Wako Pure Chemical Industries, Ltd.
2.4. Measurement Procedure
Firstly, the output of the sensor without the PIC membrane was measured using the solution of KFe(CN) and KFe(CN) with various mixture ratios to examine the redox response. Then, the response to HO was measured in the sensor with the enzymes immobilized and Fc as a mediator. The schematic illustration of the measurement setup is shown in Figure 2. A 90 of the RM containing 500 FcMeOH was first put on the array, and then, 10 of sample solution containing HO and 500 FcMeOH was added dropwise. The measurements were carried out for the HO concentration range of 10–10 M. After the measurements for each of the concentrations, the sample solution was removed from the surface each time and the sensor surface was washed by the RM several times. The output distribution among the pixels and the concentration dependence of the output were analyzed employing the output values at 300 s after the addition of HO, at which we assumed the enzymatic reactions were sufficiently progressed. The sensing characteristics of Glu were also measured with a similar procedure to that for HO sensing. A reference electrode of Ag/AgCl with 3 M NaCl was used. Although KCl inner solution for Ag/AgCl reference electrode is advantageous in terms of ion mobility, the leakage of potassium ions from a high-density solution may be harmful taking into account the application to cell measurements. Therefore, 3 M NaCl was employed as inner solution in this study.
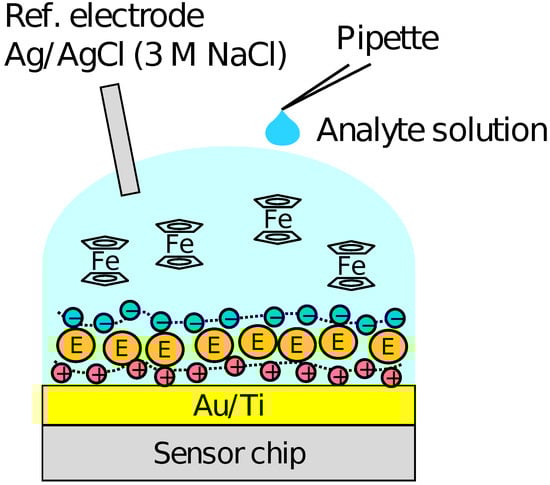
Figure 2.
Schematic illustration of setup for HO and Glu measurements.
3. Results and Discussion
3.1. Fabricated Device
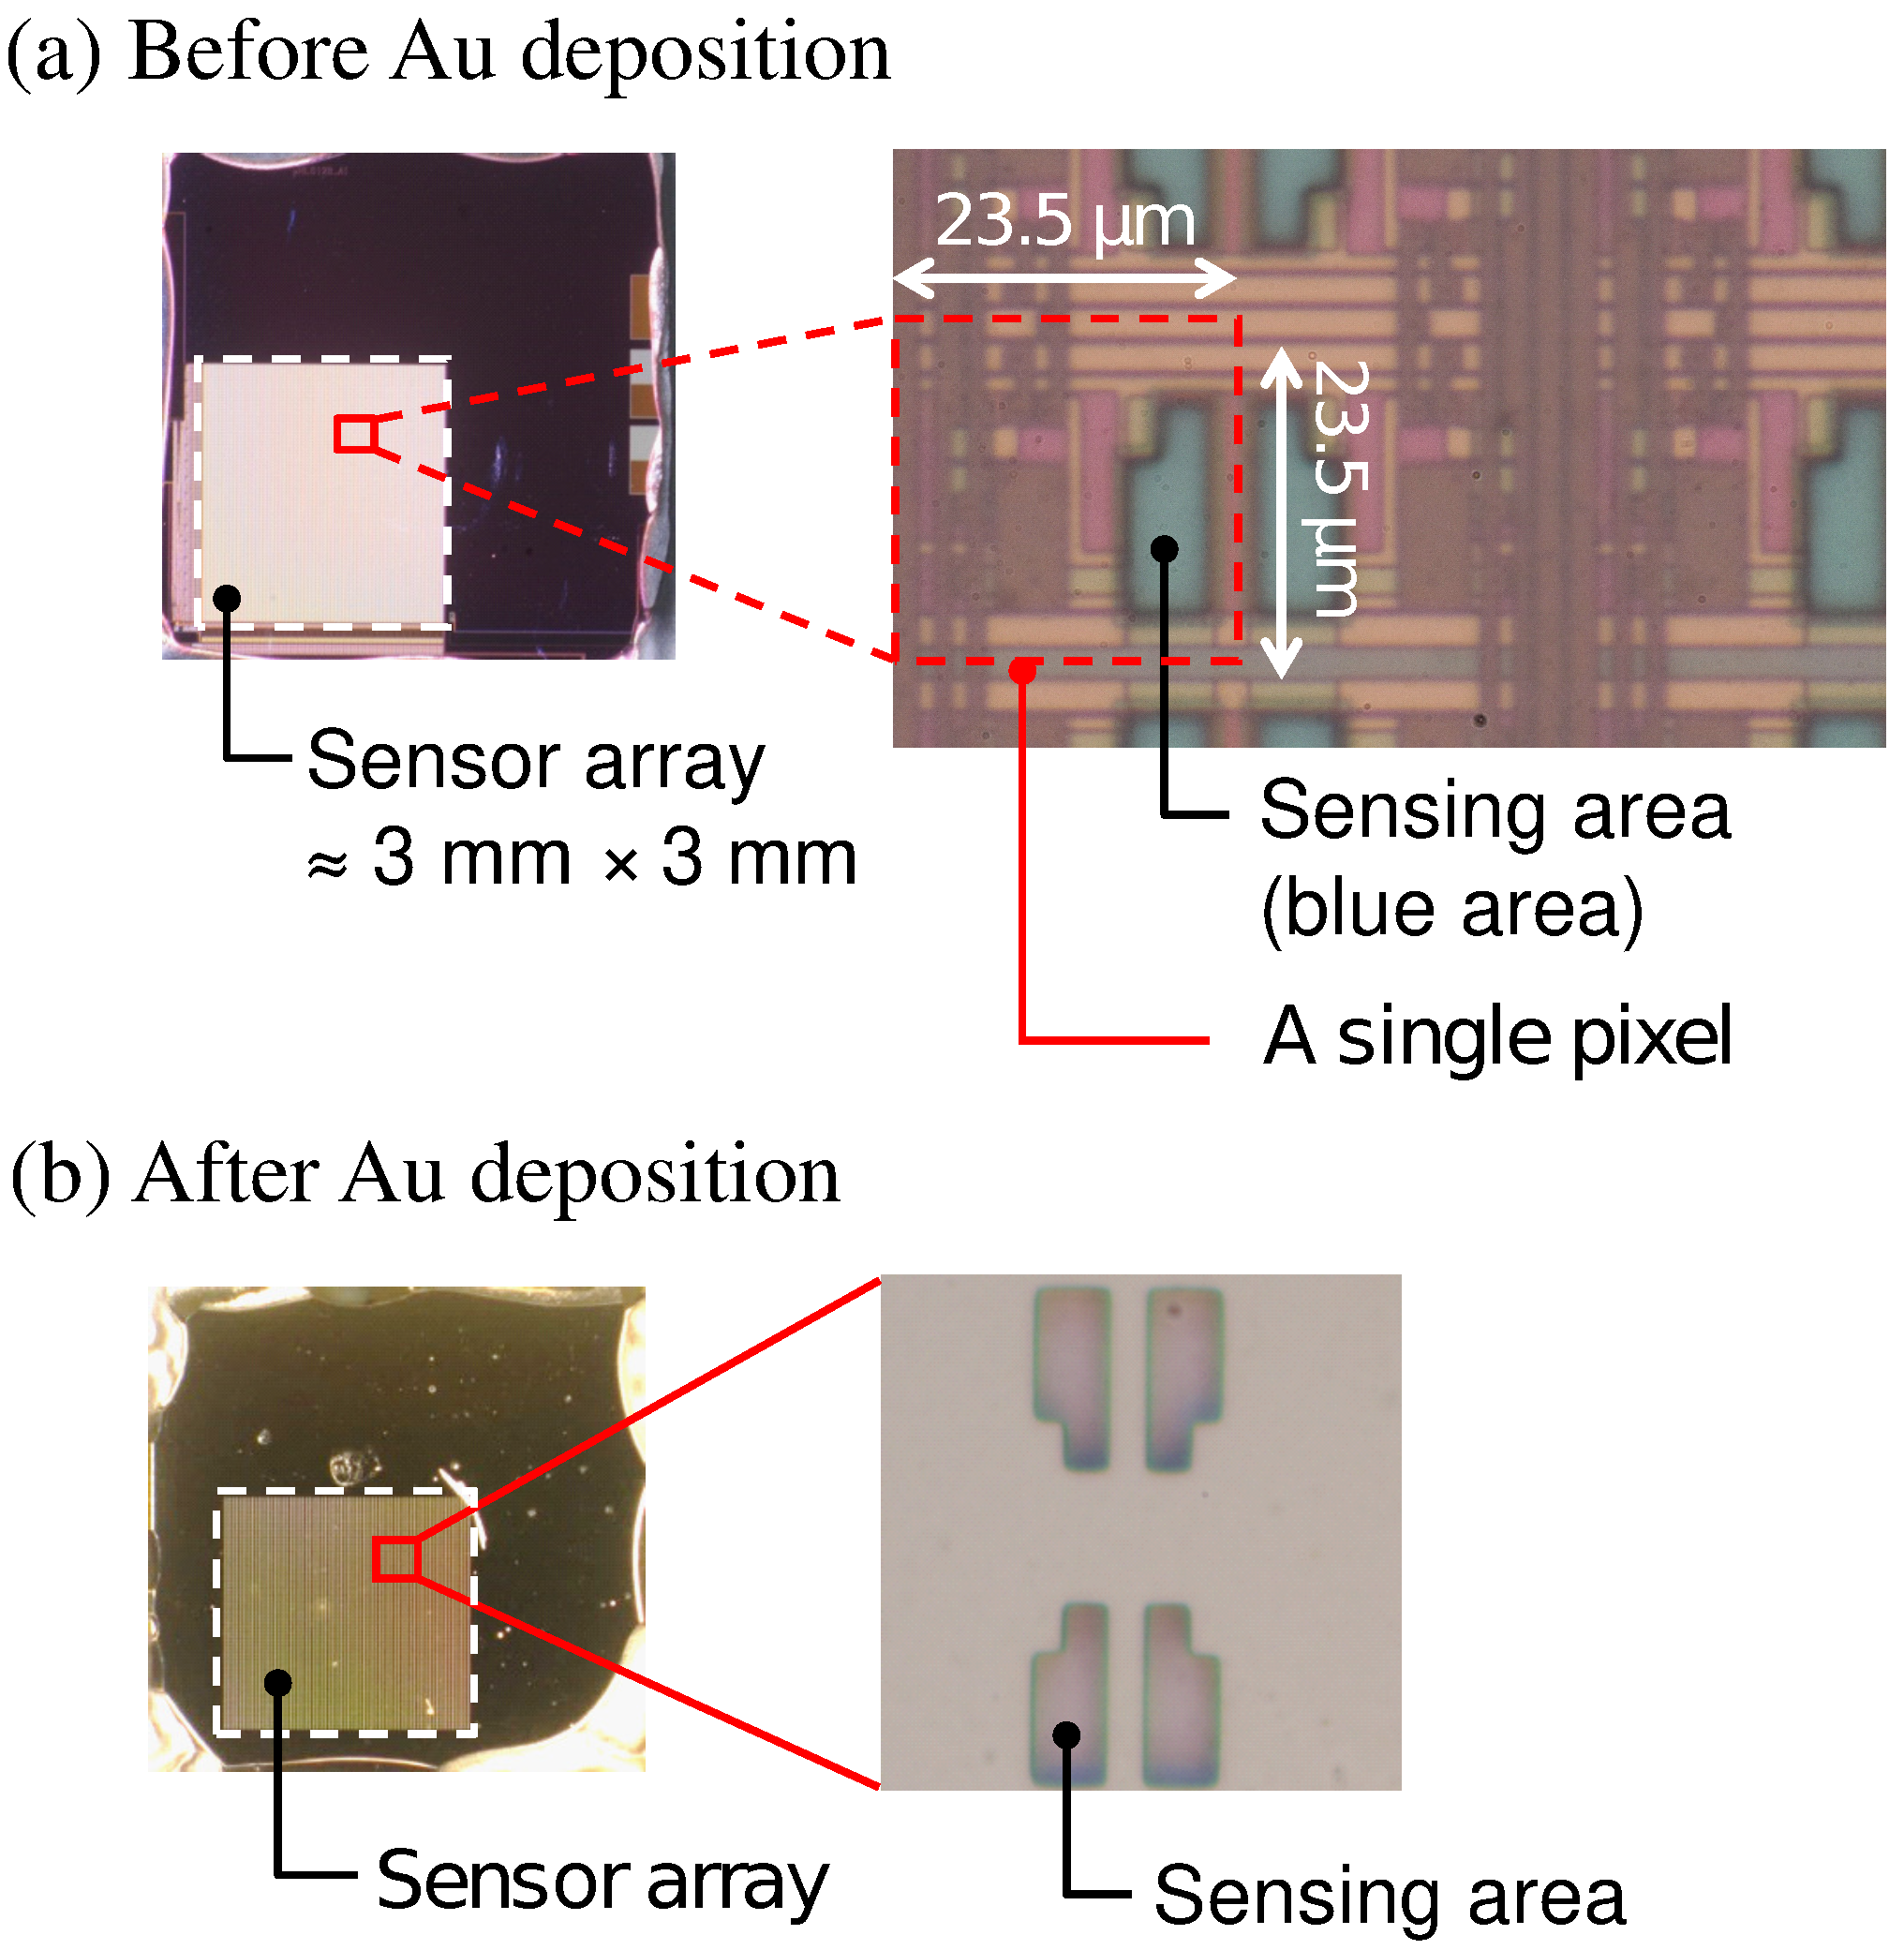
Optical microscopy images of the sensor chip (a) before and (b) after Au deposition are shown in Figure 3. The bluish region shown in Figure 3a corresponds to the sensing area. In Figure 3b, it was observed that the Au layer was deposited in each of the sensing areas. As schematically depicted in Figure 1, the surface of the sensing area is lowered than the surrounding areas due to the passivation layer. The flux of Au vapor incident into the sensor surface was nearly perpendicular to the sensing area, and thus, the thickness of an Au layer deposited on the sidewalls was negligible. As a result, the Au layer deposited on the pixels was separated from that on the neighboring pixels. The incident of the vapor can be regarded as nearly perpendicular to the sensor surface in terms of the deposition on the sidewall but not completely perpendicular, which caused the so-called shadowing effect, as will be discussed later.
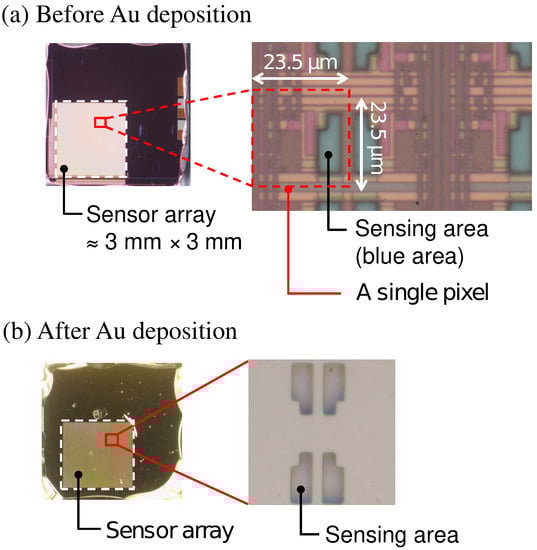
Figure 3.
Picture of sensor chip (a) before and (b) after Au deposition.
3.2. Redox Sensitivity of the Sensor
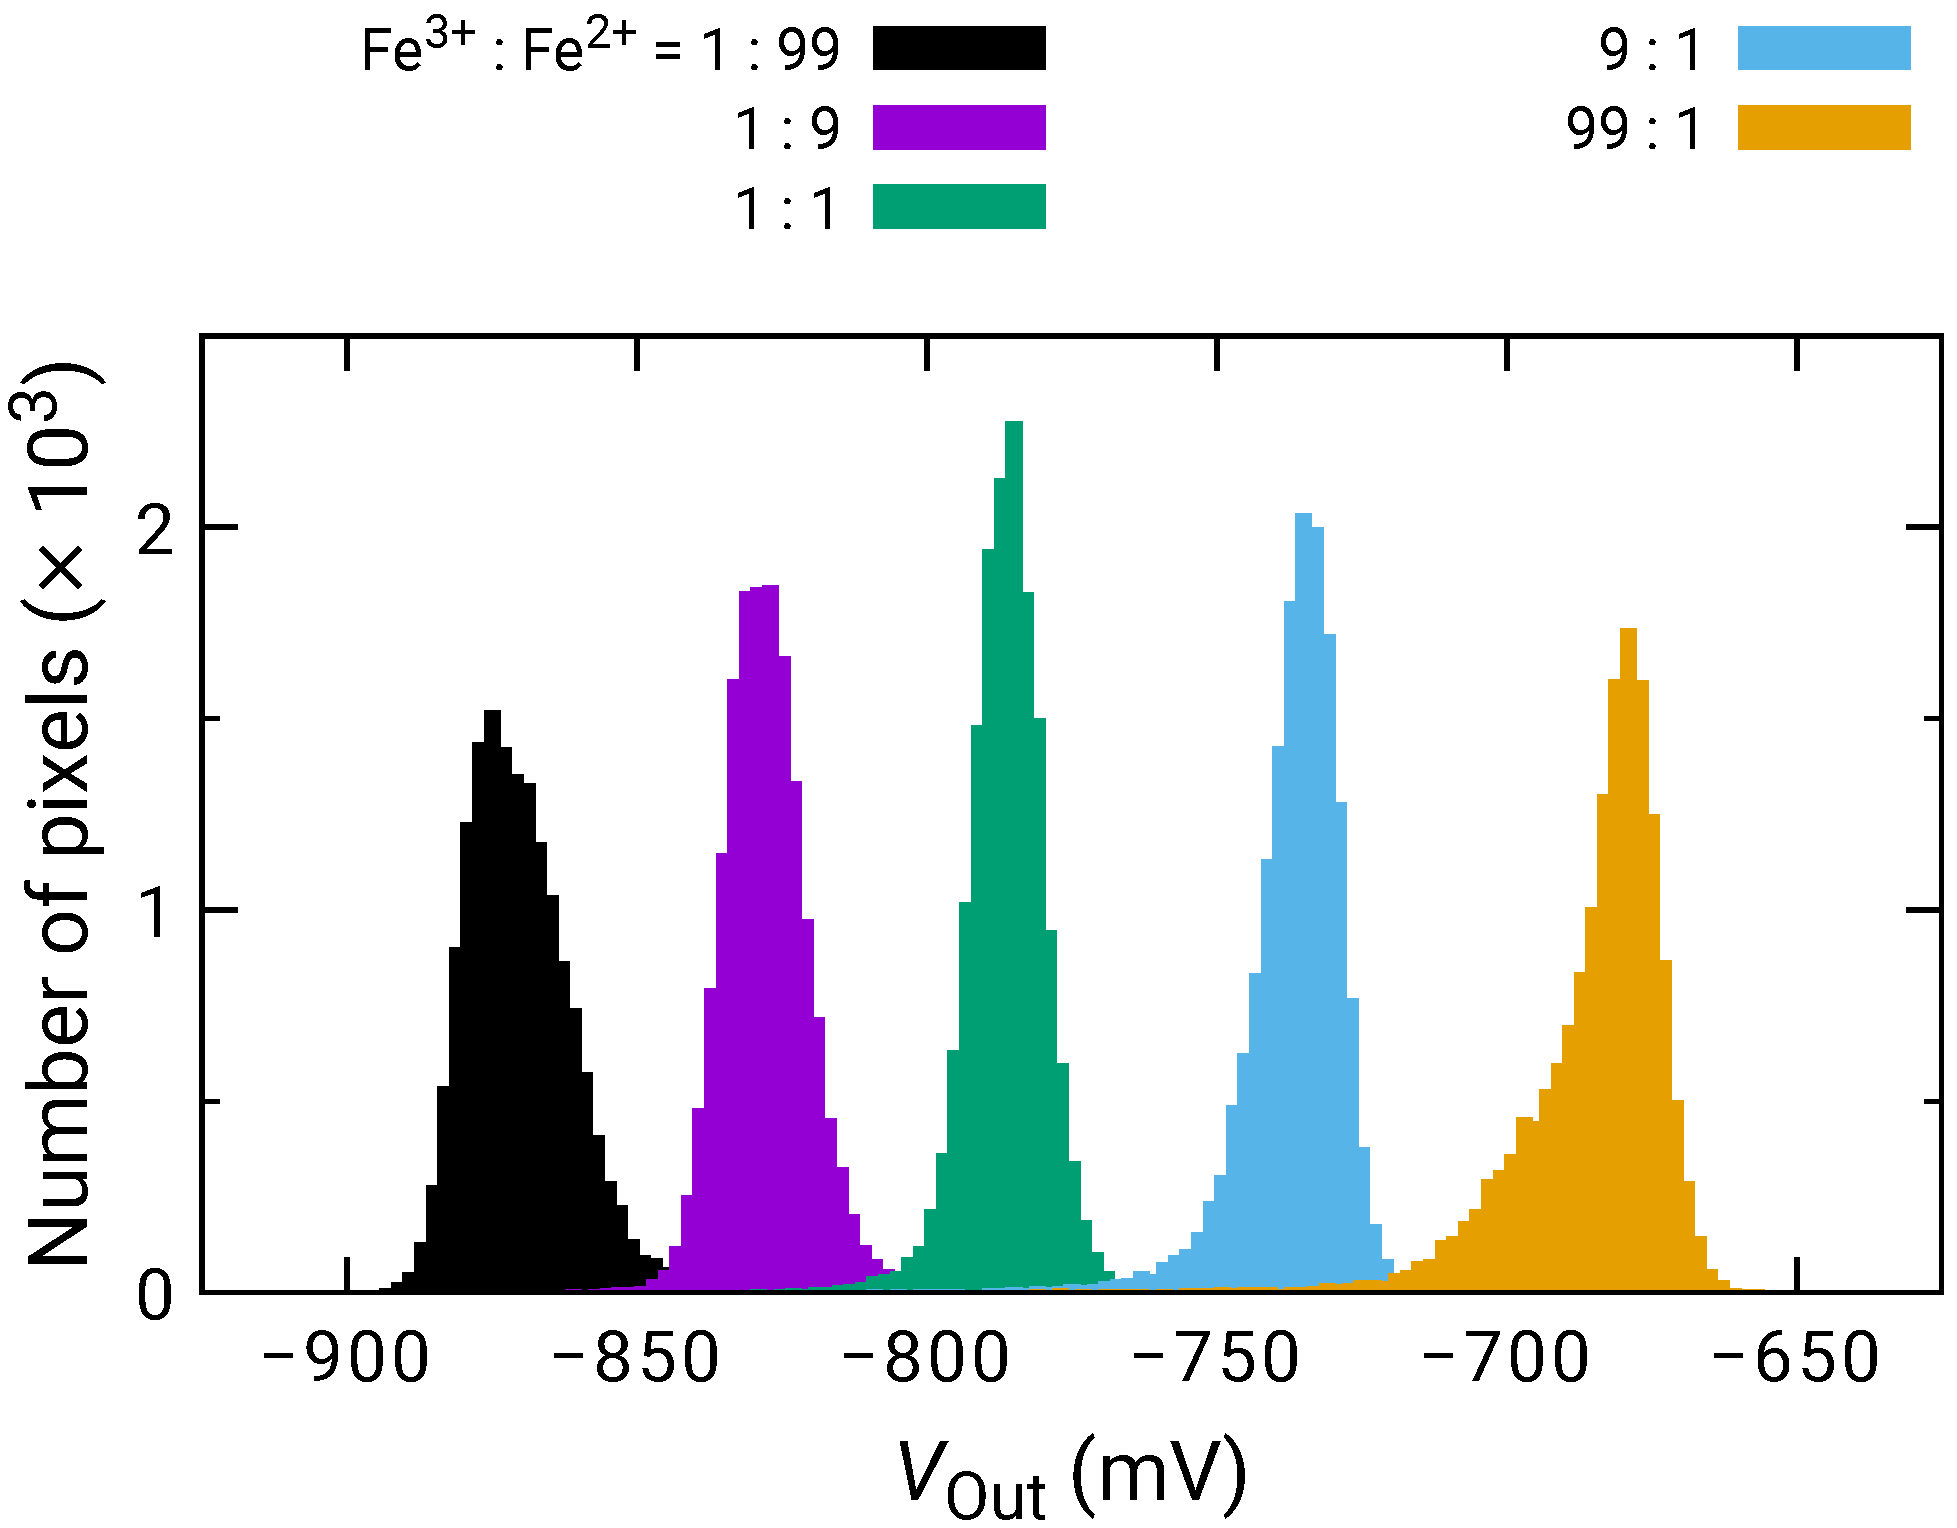
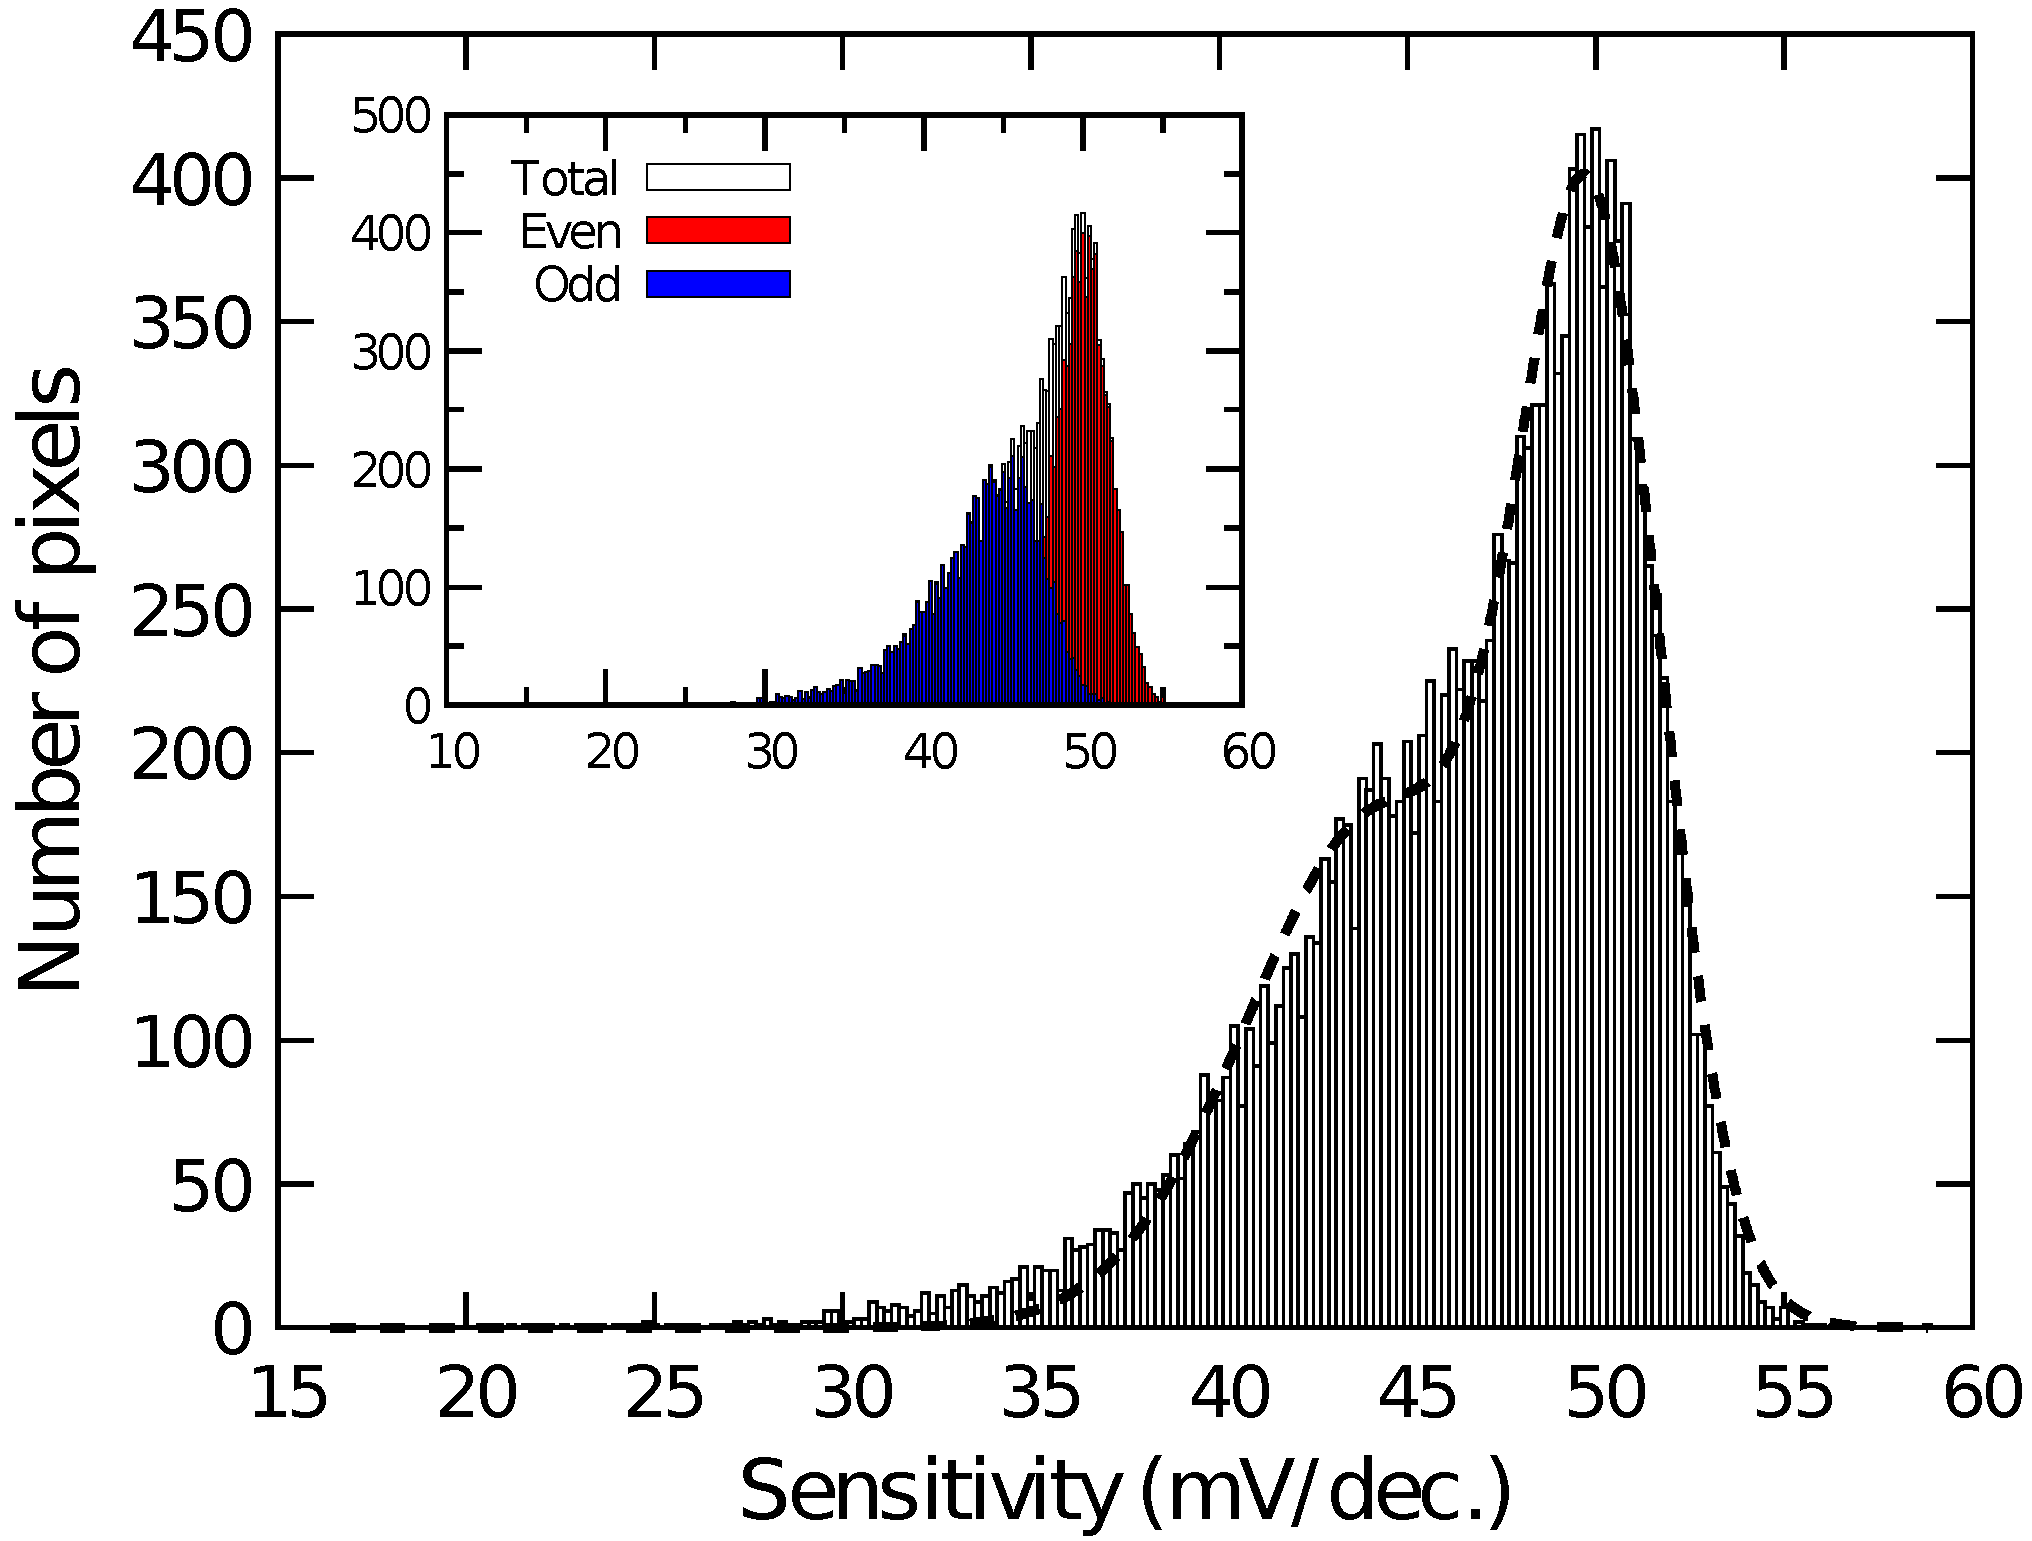
Figure 4 shows the histogram of among the pixels for the different quotient of KFe(CN) and KFe(CN) (Fe/Fe). among pixels was calibrated for Fe/Fe = 1:1. As the ratio of KFe(CN) increased, increased proportionally to the logarithm of Fe/Fe. Then, the sensitivity to the redox species was extracted on each pixel and its histogram is plotted in Figure 5. The histogram exhibited a peak near 50 mV/dec., while a shoulder peak near 45 mV/dec. was also observed. As the sensitivity was plotted for odd and even columns in the inset of Figure 5, the difference in the sensitivity between the even and odd column was observed, indicating the higher and lower peaks originate from the sensitivity of the even and odd columns, respectively. In general, the variation due to random processes should follow Gaussian distribution. Hence, assuming that the distributions corresponding to the even and odd columns have the same pixel numbers, the total distribution was fitted by the sum of two Gaussian distributions as:
where and are the average values and and are the standard deviation corresponding to each distribution. N is the total number of pixels and is the class interval of the histogram (here, 0.2 mV/dec.). The function well fitted into the experimental result, as shown as a dashed curve in Figure 5. The extracted average values and standard deviations for each of the Gaussian distributions are derived as mV/dec., mV/dec., mV/dec., and mV/dec., revealing that the redox sensitivities were slightly smaller than the Nernst limit (59.1 mV/dec at 298 K).
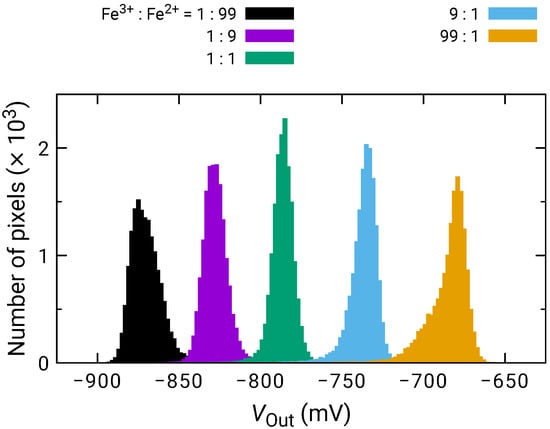
Figure 4.
Histogram of for various ratio between KFe(CN) (Fe) and KFe(CN) (Fe).

Figure 5.
Histogram of redox sensitivity among pixels. Inset depicts sensitivity of even and odd columns.
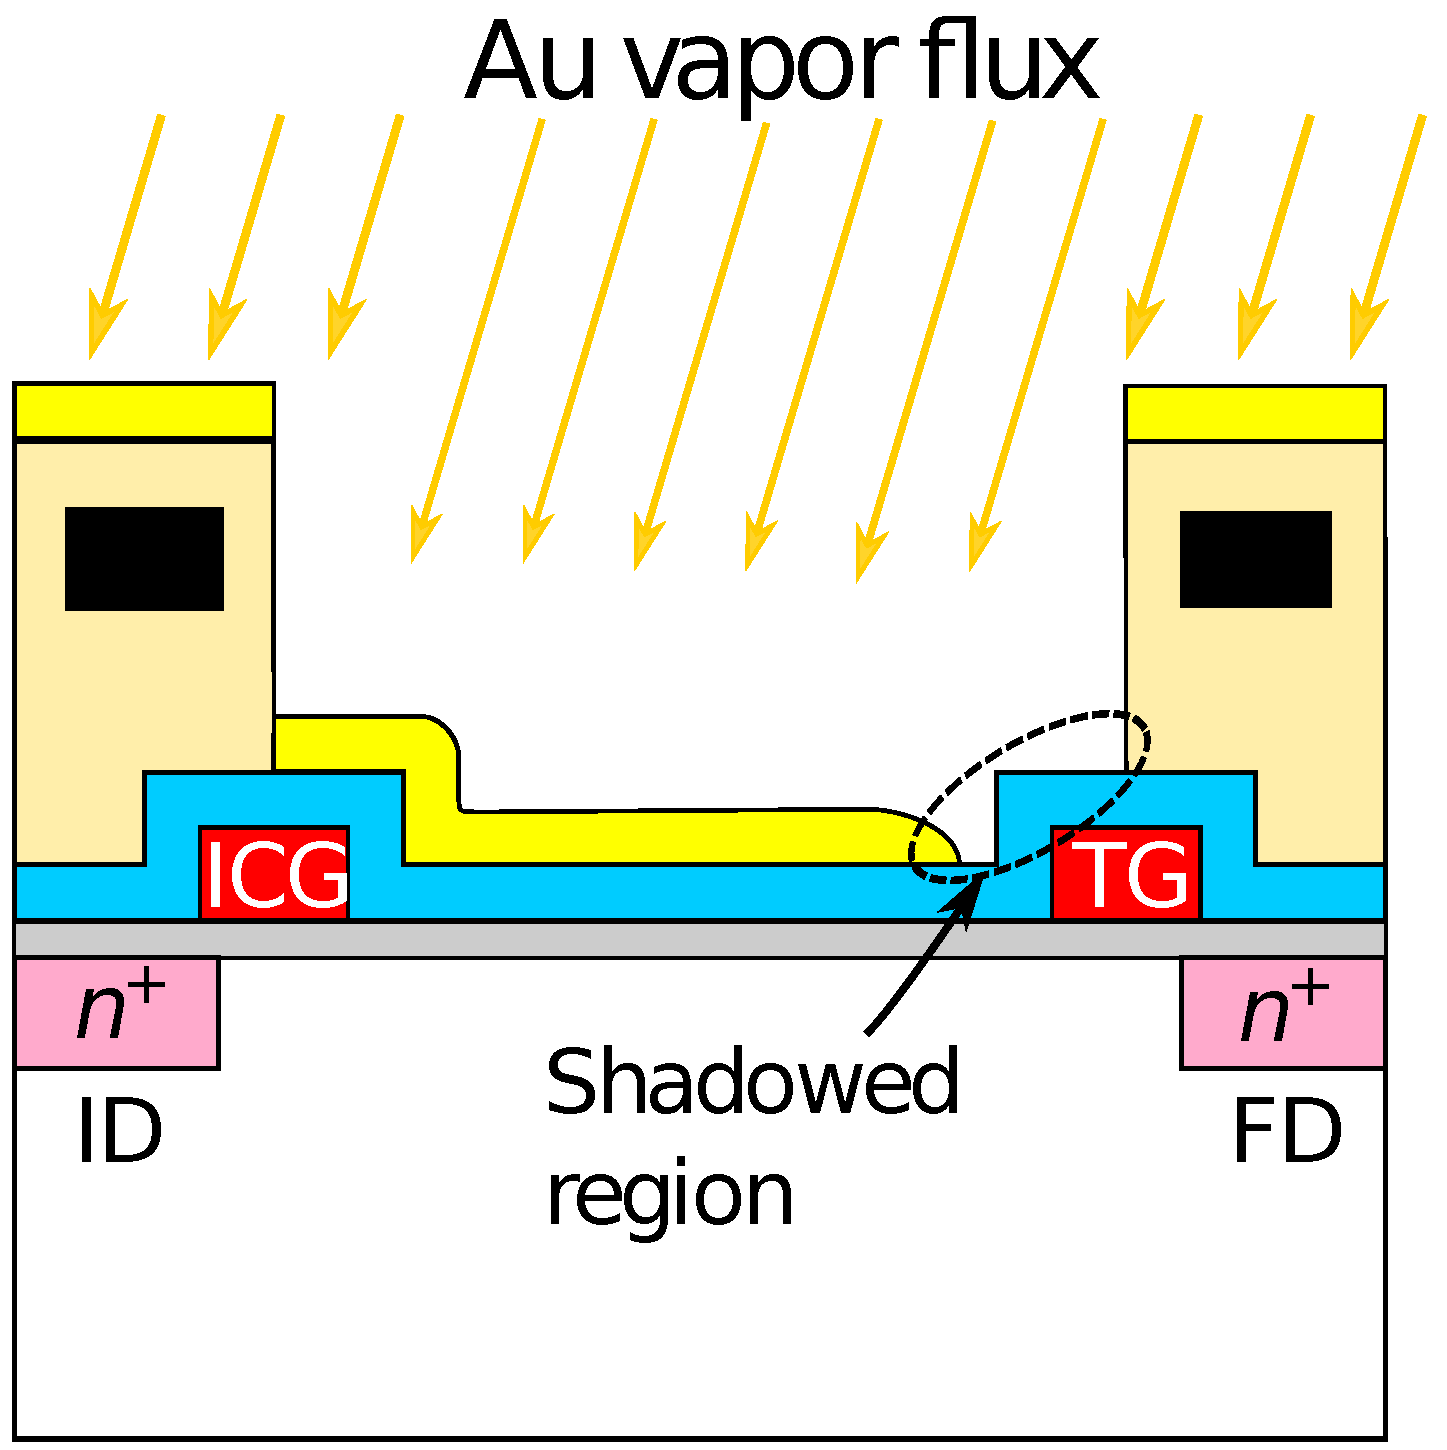
Then, the smaller redox sensitivity together with the sensitivity difference between the even and odd columns is discussed. In the device, the interfacial potential of the Au electrode according to the mixture ratio of redox species determines the depth of the potential well in the semiconductor part under the sensing area (see Figure 1). Charges are stored in the potential well, and then transferred to a floating diffusion amplifier (FD) through a transfer gate (TG), whereby the charges corresponding to the redox potential are converted to [43]. Therefore, the potential well corresponding to the areas that are not covered with the Au layer is insensitive to the redox potential, reducing the stored charge. More critically, the coverage near TG affects the transferring efficiency of the charges. If the area near the TG is not covered with the Au layer, the potential well nearby TG is only modulated by the fringing field due to the TG potential, causing the degradation of the transferring efficiency of the charges to FD, thus, . The insufficient coverage may be caused by a shadowing effect during the evaporation taking into account the pixel structure, because the surface of the sensing area is lower by approximately 2 than the surrounding area as schematically shown in Figure 6. As a result, the insufficient Au layer coverage, which degraded the conversion efficiency of the redox potential to , resulted in the lower redox sensitivity compared with that of the Nernst limit.

Figure 6.
Schematic illustration of shadowing effect during evaporation of gold electrode.
Additionally, the sensor pixel in the even and odd columns have a symmetric layout, namely, the relative location of TG, which caused the different shadowing effect during the evaporation, resulting in the different redox sensitivity. Although it was suggested that the shadowing effect during the film deposition can cause sensitivity variation among the pixels considerably, this problem will be solved by a flatter pixel structure that was recently developed [45]. In the structure, it was employed the so-called extended gate structure [53]. The roughness over the entire sensing area is less than 100 nm, for which the shadowing effect should be negligible, taking account of the pixel pitch of 2 . NT sensing based on the new-flatter structure is now under investigation.
3.3. HO Sensing Characteristics
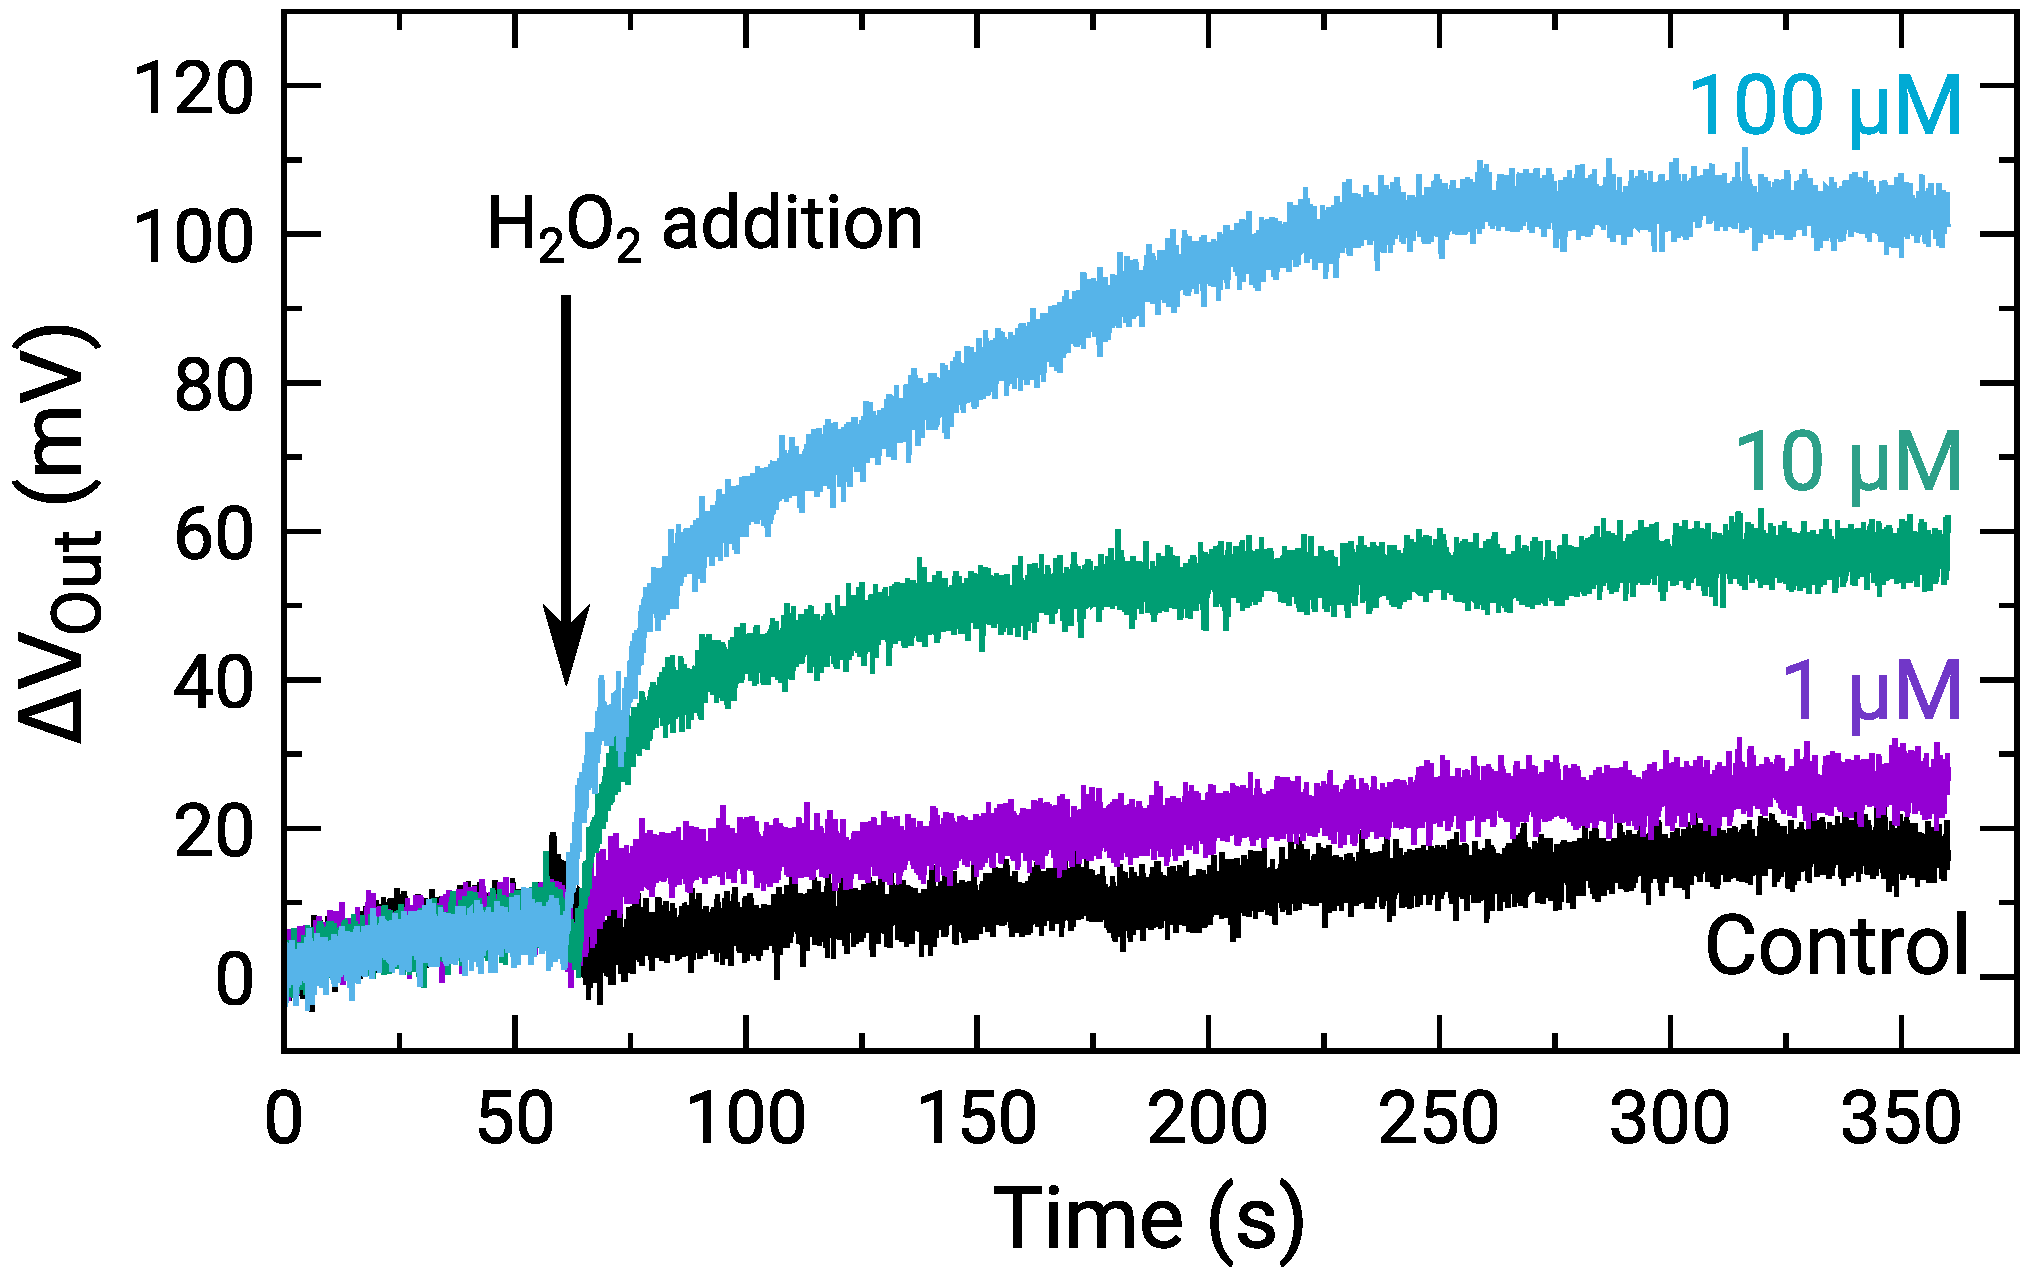
The sensor response to HO for the concentration range M was measured. Figure 7 shows the time-dependent of a center pixel of the array for various HO concentrations, where was defined as the change from the onset of the measurements. The result for the control, for which RM without HO was added, is also shown. The of all the HO concentrations gradually increased similarly after staring the measurements due to the output drift. In contrast, after the addition of HO at approximately 60 s, for 1 HO and more significantly became larger than that for the control. Note that the temporal drop of at the HO addition is an artifact [47]. Although its origin should be investigated, the difference in was observed among the HO concentration. Then, we focus on the difference. The response times to reach 95 % of the saturation values were roughly estimated to be 10 s, 95 s, and 125 s for 1 M, 10 M, and 100 M, respectively. Although the response times are still long at this stage, it was suggested that it is mainly limited by the diffusion of the molecules inside into the enzyme-immobilizing membrane as reported recently [48]. The molecules instantly reach the sensor surface with a sufficiently thin enzyme membrane, and thus, the response time would be reduced. The improvements in the response time should be investigated to obtain the spatio-temporal distribution of NTs in the future.

Figure 7.
Time-dependent output change for various HO concentrations, where control indicates addition of RM without HO. Sample solutions containing HO were added at approximately 60 s as indicated by an arrow.
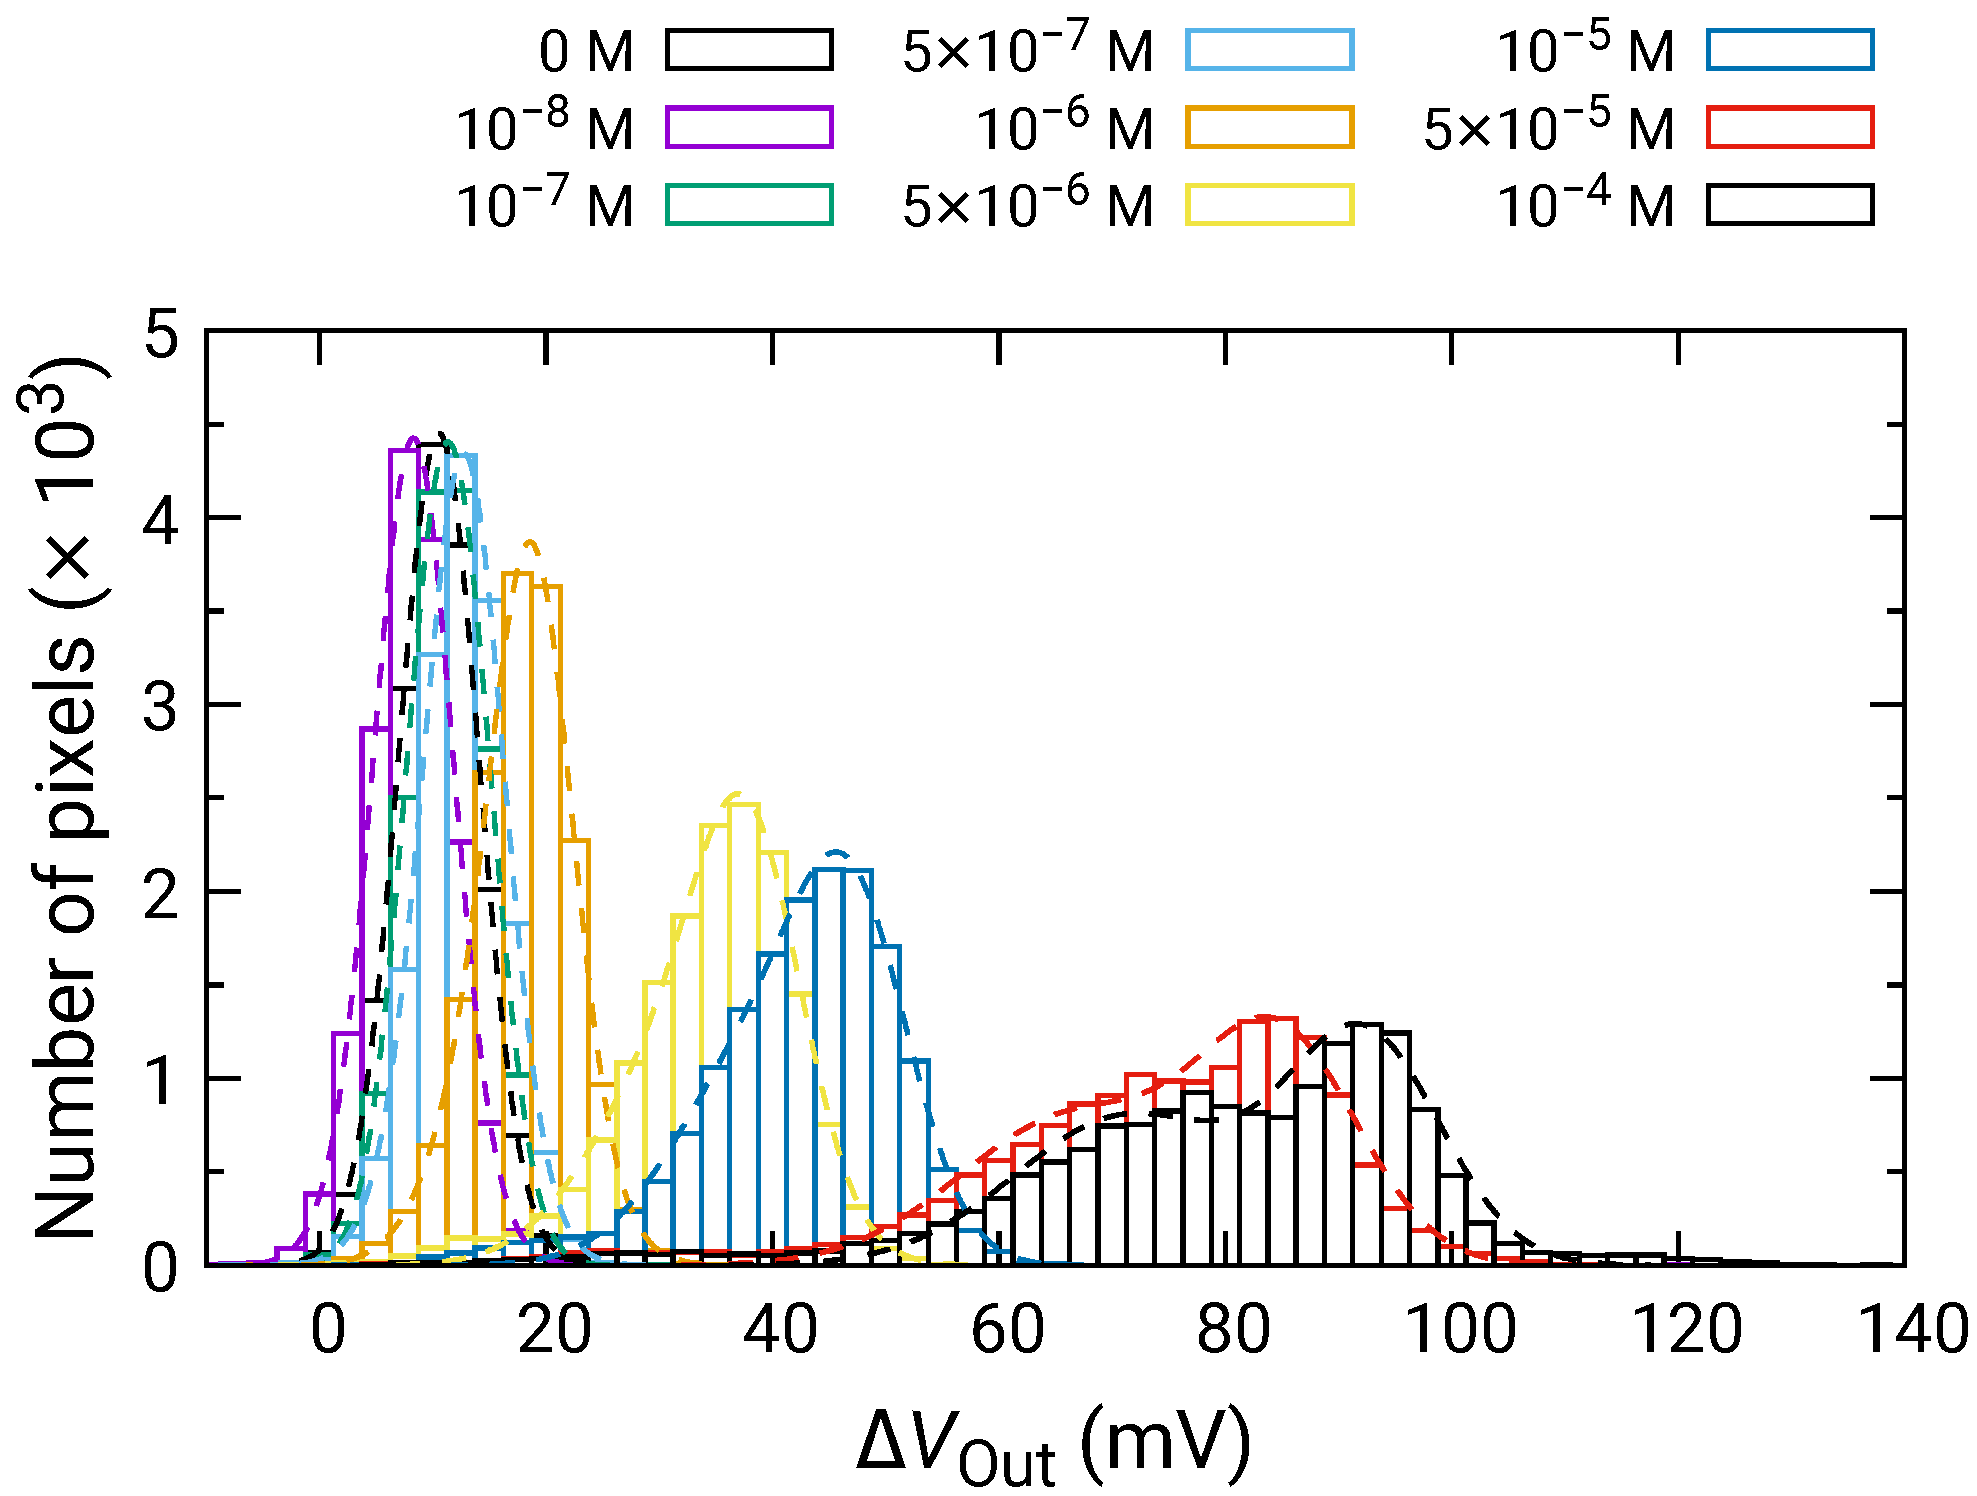
Figure 8 shows the distribution of for each of the HO concentrations depending on the HO concentration. For 500 nM and below, was comparable to that for 0 M; hence, significant change was not observed. In contrast, the distribution of began to shift higher values for 1 and above, and became larger as the HO concentration increased. Here, larger than 0 V for 0 M HO is due to the output drift, as observed in Figure 7.

Figure 8.
Histogram of in response to HO addition.
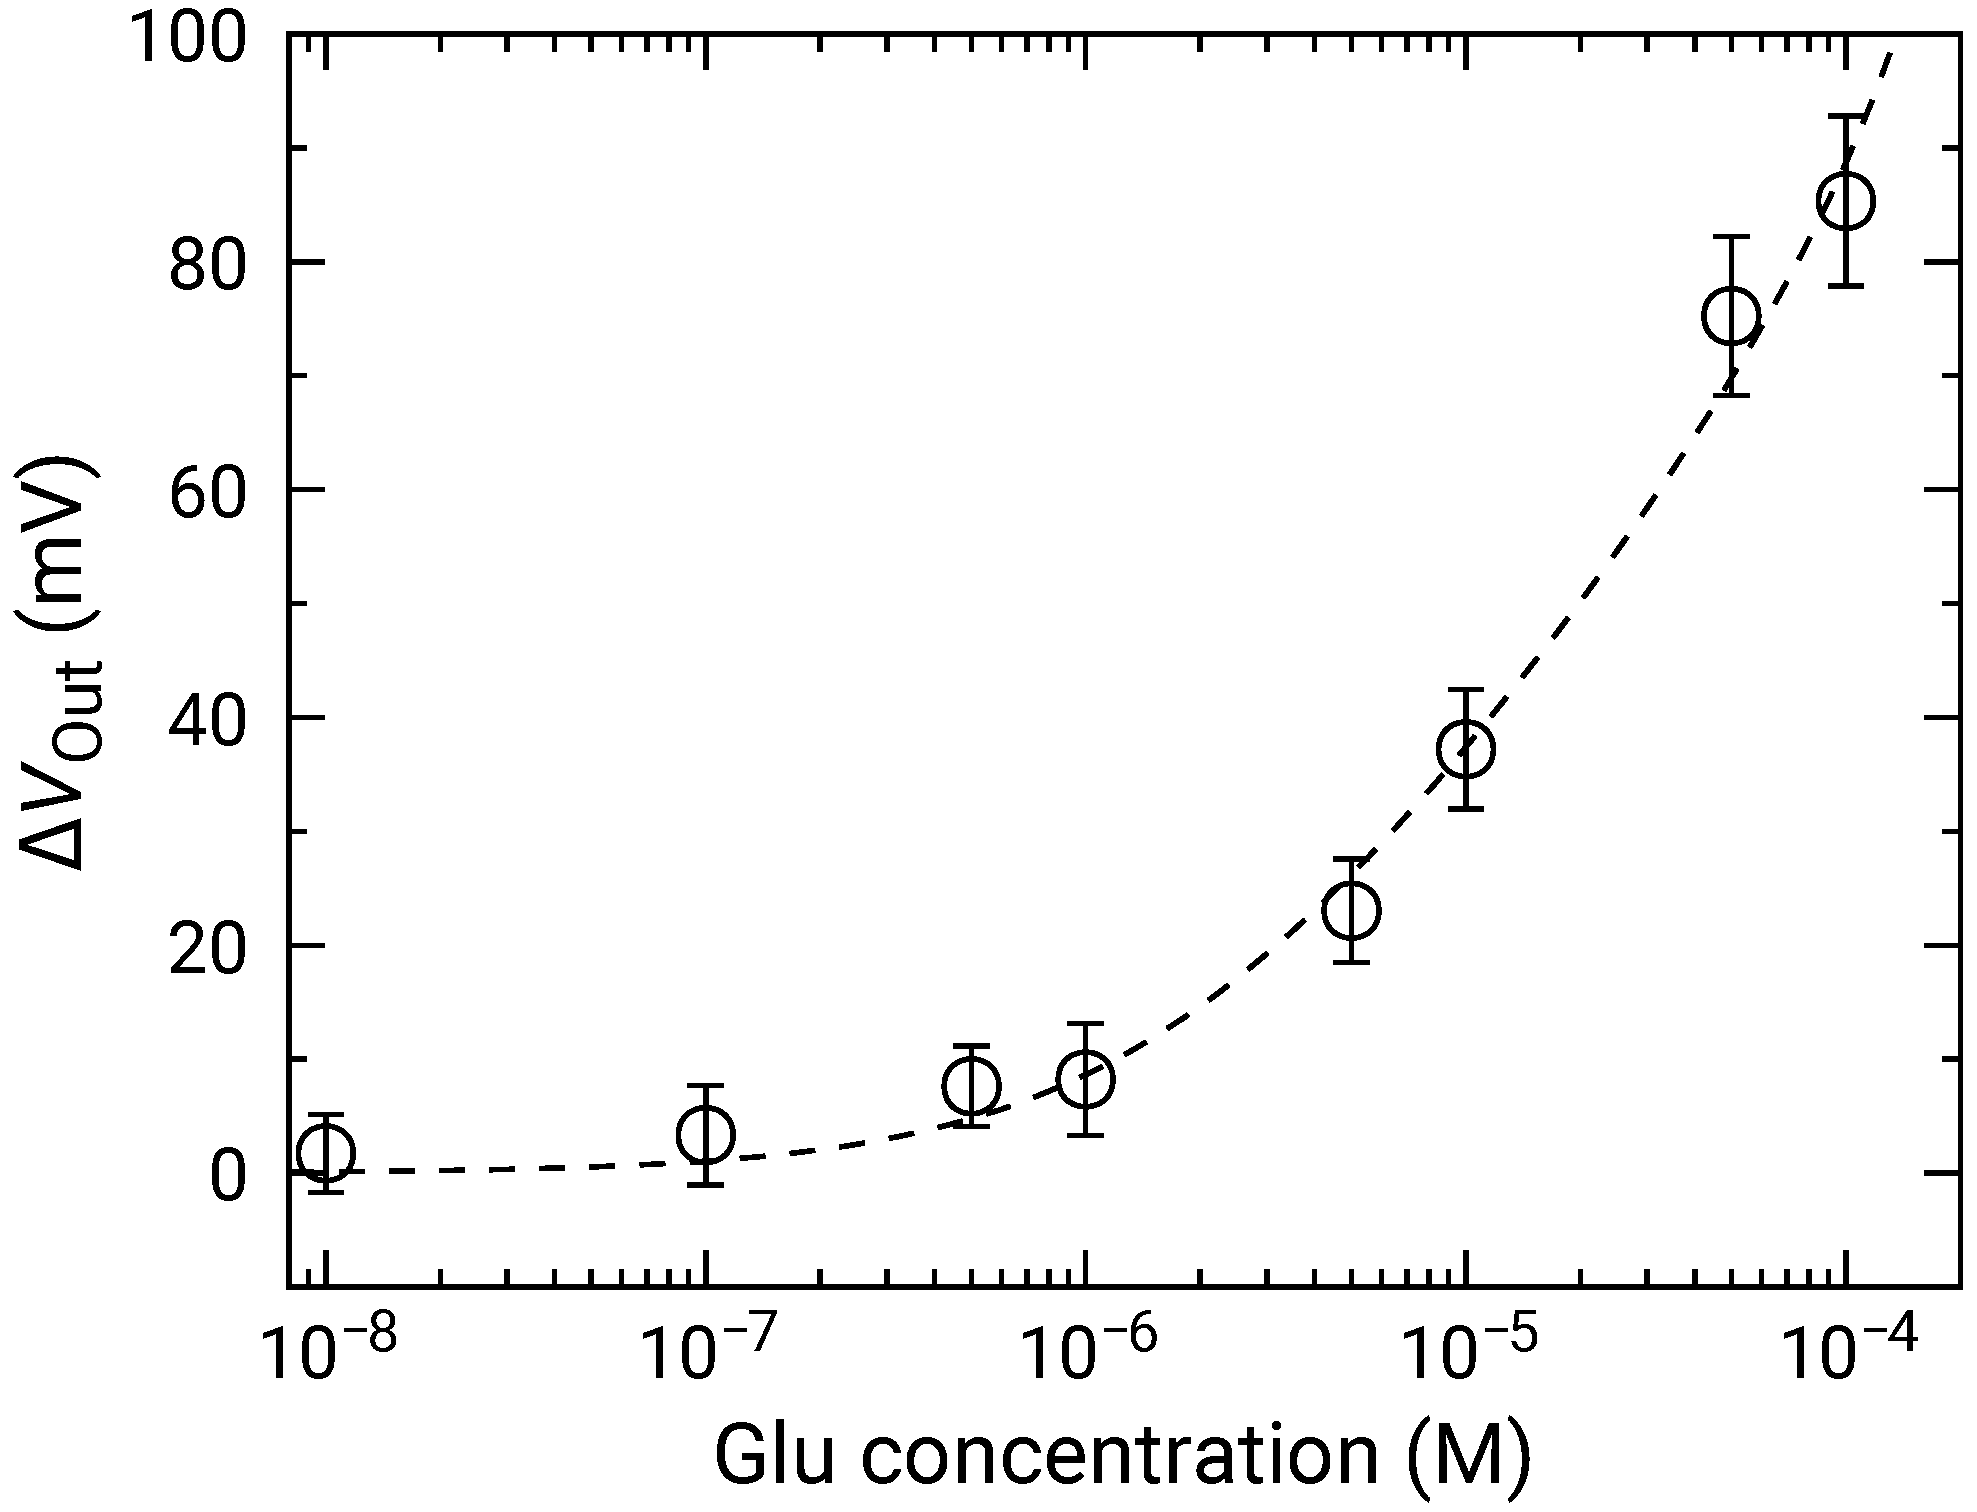
At high concentrations, the distribution became broader, and two distinct peaks were observed (e.g., 50 and 100 M). As discussed in Section 3.2, the broad distribution with a shoulder peak is attributed to the variation in the redox sensitivity among the pixels. Then, using Equation (6), each of the distributions was fitted, and the fitting result is shown as dashed curves. The average values and standard deviations of the distributions were extracted from the fitting. As discussed in Section 3.2, the histogram exhibited two peaks, which originated from the variation in the redox sensitivities among the pixel. In this study, the average values for the higher distribution were adopted for the following analyses to evaluate the sensitivity to HO. The average values of are shown in Figure 9 as a function of HO concentration, where for 0 M was subtracted from for each of the concentrations to omit the influence of the output drift. The error bars in the figure represent the standard deviation extracted from the fitting of the histogram. As described above, significant was observed at 1 and above, showing that the LDO was in the order of 1 for both samples.
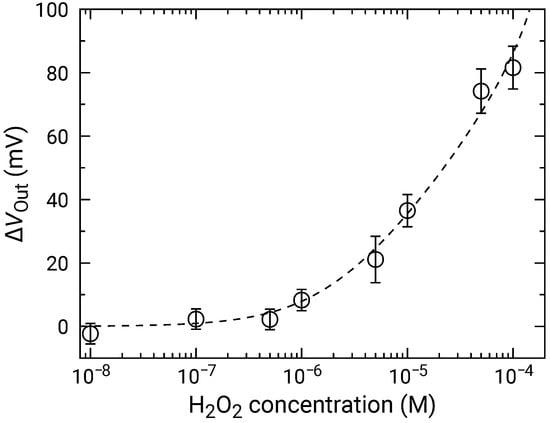
Figure 9.
Concentration dependence of sensor output change for addition of HO. Data are plotted after subtracting for 0 M HO (control) to compensate for output drift.
Then, the concentration dependence of is analyzed in detail. is determined by the quotient of the concentration of oxidized and reduced species as described in Equation (3). Then, during the measurements is described as [50]:
where the subscript 0 indicates their initial values (i.e., before HO addition). Assuming that the reaction involving HO sufficiently proceeded, the concentration of ferrocene is related to HO concentration, and then, setting as the effective redox sensitivity, becomes
Here, the theoretical limit of is 59.1 mV at 298 K. Assuming , the total concentration of ferrocene is approximated as . Then, Equation (9) is
Setting and as fitting parameters, the experimental results were fitted by Equation (10), where was a variable. The results were shown as dashed curves in Figure 9. The extracted parameters are and , respectively. The errors of extracted parameters are not those originating from the distribution, but are fitting errors for the data shown in Figure 9.
Although the extracted is slightly smaller than the redox response of 49.9 mV/dec, they are comparable to each other taking account of the range of error, which indicates that that the HO was fully degraded and that the ferrocene acted as the electron mediator. On the other hand, was the order of ∼ M in all the samples. Given that the LOD was the same order as , it may determine the LOD of the samples in this study. The redox potential of ferrocene is approximately +0.64 V vs. NHE [55], and thus, is negligible under equilibrium in the RM we employed (pH was approximately 7.1). However, it was reported that Ferrocene can be oxidized or reduced under light irradiation [50]. A similar situation might occur in this study, although further investigation is necessary. As a consequence, should be reduced in the initial state of the measurements to improve LOD. This, conversely, indicates that the LOD might be further improved by the optimal choice of redox species and by appropriate treatment before the measurements. Ishige et al. [50] improved the LOD of FET sensors with ferrocenyl-alkanethiol modified electrode by fully oxidizing the ferrocene before detecting the reducing species. Similarly, the reduction procedure before the measurements might be effective against our devices.
3.4. Application to Glutamate Imaging
Figure 10 shows the distributions for various Glu concentrations. In a similar manner to those for HO, the distribution exhibited two distinct peaks. Then, the fitting was carried out as shown by dashed curves, and extracted parameters for the higher peaks are plotted as a function of concentration in Figure 11. The concentration dependence analyzed by Equation (10) where was used as the variable instead of . was approximately mV/dec., which was almost similar to that for HO. This result indicates that the Glu was fully degraded into HO, and that the influences of the products including 2-oxoglutarate and ammonia on the redox reactions are negligible. Additionally, the LOD of 1 was also achieved.
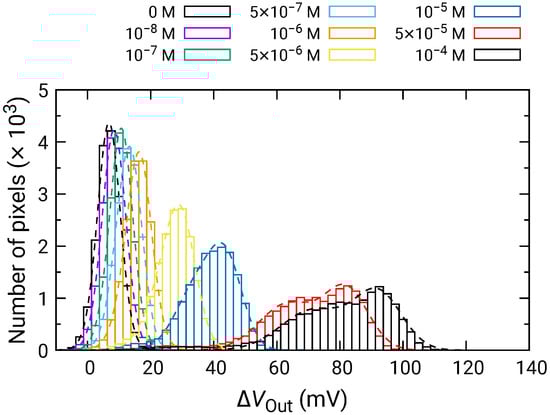
Figure 10.
Histogram of in response to Glu addition.

Figure 11.
Concentration dependence of sensor output change for Glu addition. Data are plotted after subtracting for 0 M Glu (control) to compensate for output drift.
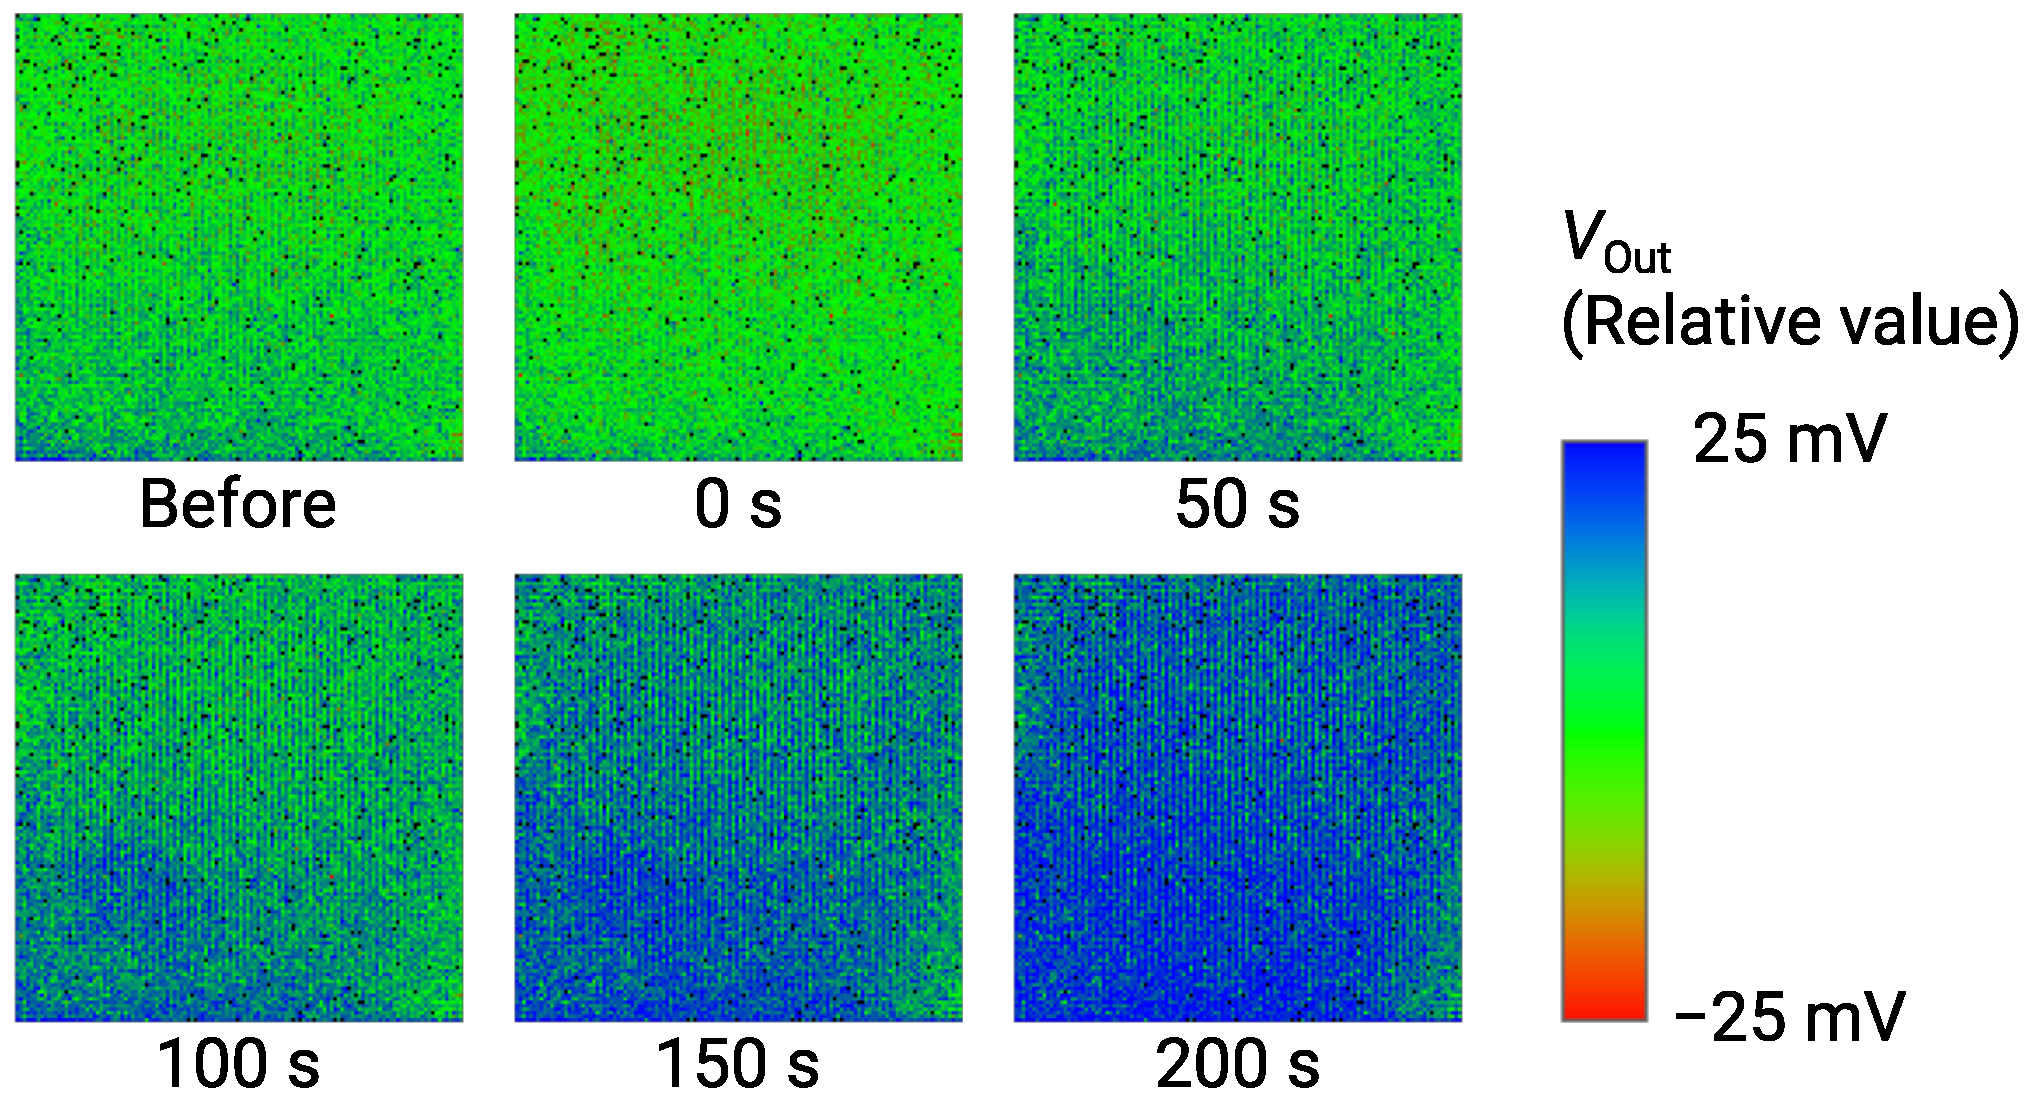
The imaging result of for 1 Glu is obtained as shown in Figure 12. is shown as a relative value over a range of 50 mV by a color bar. Just after the Glu addition, was decreased by approximately 5 mV, which was an artifact due to the specimen addition process as described in Section 3.3 (See Figure 7). Then, the color image gradually changed from green to blue due to the increase in as time evolves. At 200 s, the image became bluish over the almost entire area, indicating the significant output change was obtained as an image. As a result, we successfully demonstrated the imaging of Glu down to 1 . Table 1 compares the performance of the sensor array with previous studies [26,42,56]. This work simultaneously achieves high-spatial-resolution and good LOD. On the required LOD, it is reported that the extracellular Glu concentration reaches mM range, while the baseline is much lower down to 25 nM [57]. Therefore, the sensors with the LOD of M may apply to capturing the Glu release [58]. Nevertheless, taking into account such a low baseline, further lower LOD is still necessary, for which the approaches for improving the LOD discussed in Section 3.3 should be investigated as future work.
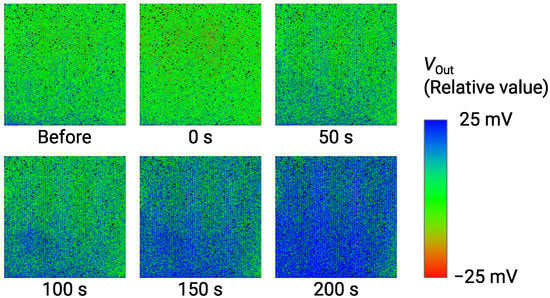
Figure 12.
Time-dependent change of output image for addition of 1 Glu. Labels below images indicate elapsed times after addition of Glu.

Table 1.
Comparison of performance of sensor arrays for Glu sensing.
Finally, the repeatability of the sensor and the influence of interfering substances are discussed. As described in Section 2.4, the measurements were carried out for each of the HO and Glu concentrations by changing the sample solution each time. Between each measurement, the sensor surface was washed by RM several times. According to the procedure, the sensor experienced 16 successive measurements (8 measurements for HO and Glu). As a result, similar concentration dependence was obtained between these substances as shown in Figure 9 and Figure 11, indicating the repeatability of the sensor response and that the activity of the enzyme was not lost. Although the interference from other substances is not examined at this stage, redox species (e.g., ascorbic acid) other than target molecules should affect the response taking into account the mechanism of the sensor, which should be an inevitable issue. The sensor in this study comprises a lot of sensor elements with a small pitch (23.5 m in the current sensor) and is beneficial to implementing multi-analyte sensing by immobilizing the different enzymes among neighboring pixels, like pixels in a color camera [59]. Similarly, the influence of the interfering molecules could be addressed by fabricating the sensor pixels on which the enzyme was immobilized or not. Thereby, the responses by purely the interfering substances and those superimposed with the response of the target molecules are obtained at different pixels. By analyzing these responses from the neighboring pixels, at which the concentration of the molecules can be regarded as the same, the responses from the target molecules can be deconvoluted, and therefore, the responses of interfering substances could be excluded.
4. Conclusions
In this study, redox electrodes were implemented on a CTT potentiometric sensor array with pixels as a pH-insensitive method for NTs sensing. The redox electrodes comprised gold electrodes and ferrocene as an electron mediator. The redox sensitivity characterized using the mixture of KFe(CN) and KFe(CN) was confirmed to reach 49.9 mV/dec., while it was found to be affected by the coverage of the gold electrode on the sensing area. Then, HO sensing characteristics were investigated. From the calibration curve for the output voltage, the LOD was estimated to be around 1 M. The analyses of the calibration curve revealed that the sensitivity was 44.7 mV/dec., being comparable with that confirmed by the mixture of KFe(CN) and KFe(CN). Additionally, it was suggested that the control of the oxidation state of the redox mediator is the key to further improving LOD. Finally, as a result of the Glu sensing measurements, the LOD of 1 M and sensitivity, comparable to the HO, was obtained. Furthermore, the real-time imaging of 1 M Glu was demonstrated, showing the promising property of the device fabricated in this study as a promising bioimaging device for clarifying the spatio-temporal distribution of NTs in CNS.
Author Contributions
Conceptualization, K.S.; methodology, K.O.; validation, T.H.; formal analysis, T.I.; investigation, Y.O., T.H. and H.D.; resources, Y.O. and T.H.; data curation, T.H.; writing—original draft preparation, T.I.; writing—review & editing, T.H., H.D., K.T. and K.S.; visualization, T.I.; supervision, K.O., K.T. and K.S.; project administration, K.S.; funding acquisition, K.S. All authors have read and agreed to the published version of the manuscript.
Funding
This research was funded by JST, CREST, JPMJCR14G2, OPERA, JPMJOP1834, and JSPS KAKENHI Grant Number JP18H03778.
Institutional Review Board Statement
Not applicable.
Informed Consent Statement
Not applicable.
Conflicts of Interest
The authors declare no conflict of interest.
References
- Hasanzadeh, M.; Shadjou, N.; de la Guardia, M. Current advancement in electrochemical analysis of neurotransmitters in biological fluids. TrAC-Trends Anal. Chem. 2017, 86, 107–121. [Google Scholar] [CrossRef]
- Klein, M.O.; Battagello, D.S.; Cardoso, A.R.; Hauser, D.N.; Bittencourt, J.C.; Correa, R.G. Dopamine: Functions, Signaling, and Association with Neurological Diseases. Cell. Mol. Neurobiol. 2019, 39, 31–59. [Google Scholar] [CrossRef]
- Schultz, K.N.; Kennedy, R.T. Time-resolved microdialysis for in vivo neurochemical measurements and other applications. Annu. Rev. Anal. Chem. 2008, 1, 627–661. [Google Scholar] [CrossRef]
- Scimemi, A.; Beato, M. Determining the Neurotransmitter Concentration Profile at Active Synapses. Mol. Neurobiol. 2009, 40, 289–306. [Google Scholar] [CrossRef] [PubMed] [Green Version]
- Okubo, Y.; Sekiya, H.; Namiki, S.; Sakamoto, H.; Iinuma, S.; Yamasaki, M.; Watanabe, M.; Hirose, K.; Iino, M. Imaging extrasynaptic glutamate dynamics in the brain. Proc. Natl. Acad. Sci. USA 2010, 107, 6526–6531. [Google Scholar] [CrossRef] [PubMed] [Green Version]
- Cao, Q.; Wang, Y.; Chen, B.; Ma, F.; Hao, L.; Li, G.; Ouyang, C.; Li, L. Visualization and Identification of Neurotransmitters in Crustacean Brain via Multifaceted Mass Spectrometric Approaches. ACS Chem. Neurosci. 2019, 10, 1222–1229. [Google Scholar] [CrossRef] [PubMed]
- Perry, M.; Li, Q.; Kennedy, R.T. Review of recent advances in analytical techniques for the determination of neurotransmitters. Anal. Chim. Acta 2009, 653, 1–22. [Google Scholar] [CrossRef] [Green Version]
- Tavakolian-Ardakani, Z.; Hosu, O.; Cristea, C.; Mazloum-Ardakani, M.; Marrazza, G. Latest Trends in Electrochemical Sensors for Neurotransmitters: A Review. Sensors 2019, 19, 2037. [Google Scholar] [CrossRef] [Green Version]
- Madhurantakam, S.; Karnam, J.B.; Brabazon, D.; Takai, M.; Ahad, I.U.; Balaguru Rayappan, J.B.; Krishnan, U.M. “Nano”: An Emerging Avenue in Electrochemical Detection of Neurotransmitters. ACS Chem. Neurosci. 2020, 11, 4024–4047. [Google Scholar] [CrossRef]
- Rakesh Kumar, R.; Shaikh, M.O.; Chuang, C.H. A review of recent advances in non-enzymatic electrochemical creatinine biosensing. Anal. Chim. Acta 2021, 1183, 338748. [Google Scholar] [CrossRef]
- Pandey, P.; Upadhyay, S.; Pathak, H.; Pandey, C.; Tiwari, I. Acetylthiocholine/acetylcholine and thiocholine/choline electrochemical biosensors/sensors based on an organically modified sol–gel glass enzyme reactor and graphite paste electrode. Sens. Actuators B Chem. 2000, 62, 109–116. [Google Scholar] [CrossRef]
- Lin, S.; Liu, C.C.; Chou, T.C. Amperometric acetylcholine sensor catalyzed by nickel anode electrode. Biosens. Bioelectron. 2004, 20, 9–14. [Google Scholar] [CrossRef] [PubMed]
- Ju, J.; Bai, J.; Bo, X.; Guo, L. Non-enzymatic acetylcholine sensor based on Ni–Al layered double hydroxides/ordered mesoporous carbon. Electrochim. Acta 2012, 78, 569–575. [Google Scholar] [CrossRef]
- Chauhan, N.; Chawla, S.; Pundir, C.; Jain, U. An electrochemical sensor for detection of neurotransmitter-acetylcholine using metal nanoparticles, 2D material and conducting polymer modified electrode. Biosens. Bioelectron. 2017, 89, 377–383. [Google Scholar] [CrossRef]
- Kucherenko, D.; Kucherenko, I.; Soldatkin, O.; Topolnikova, Y.; Dzyadevych, S.; Soldatkin, A. A highly selective amperometric biosensor array for the simultaneous determination of glutamate, glucose, choline, acetylcholine, lactate and pyruvate. Bioelectrochemistry 2019, 128, 100–108. [Google Scholar] [CrossRef]
- Fenoy, G.E.; Marmisollé, W.A.; Azzaroni, O.; Knoll, W. Acetylcholine biosensor based on the electrochemical functionalization of graphene field-effect transistors. Biosens. Bioelectron. 2020, 148, 111796. [Google Scholar] [CrossRef]
- Sheng, Z.H.; Zheng, X.Q.; Xu, J.Y.; Bao, W.J.; Wang, F.B.; Xia, X.H. Electrochemical sensor based on nitrogen doped graphene: Simultaneous determination of ascorbic acid, dopamine and uric acid. Biosens. Bioelectron. 2012, 34, 125–131. [Google Scholar] [CrossRef]
- Rezaei, B.; Boroujeni, M.K.; Ensafi, A.A. Fabrication of DNA, o-phenylenediamine, and gold nanoparticle bioimprinted polymer electrochemical sensor for the determination of dopamine. Biosens. Bioelectron. 2015, 66, 490–496. [Google Scholar] [CrossRef]
- Yang, J.; Hu, Y.; Li, Y. Molecularly imprinted polymer-decorated signal on-off ratiometric electrochemical sensor for selective and robust dopamine detection. Biosens. Bioelectron. 2019, 135, 224–230. [Google Scholar] [CrossRef]
- Selvolini, G.; Lazzarini, C.; Marrazza, G. Electrochemical Nanocomposite Single-Use Sensor for Dopamine Detection. Sensors 2019, 19, 3097. [Google Scholar] [CrossRef] [Green Version]
- Wang, S.; Guo, P.; Ma, G.; Wei, J.; Wang, Z.; Cui, L.; Sun, L.; Wang, A. Three-dimensional hierarchical mesoporous carbon for regenerative electrochemical dopamine sensor. Electrochim. Acta 2020, 360, 137016. [Google Scholar] [CrossRef]
- Castagnola, E.; Garg, R.; Rastogi, S.K.; Cohen-Karni, T.; Cui, X.T. 3D fuzzy graphene microelectrode array for dopamine sensing at sub-cellular spatial resolution. Biosens. Bioelectron. 2021, 191, 113440. [Google Scholar] [CrossRef]
- Hu, Y.; Mitchell, K.M.; Albahadily, F.N.; Michaelis, E.K.; Wilson, G.S. Direct measurement of glutamate release in the brain using a dual enzyme-based electrochemical sensor. Brain Res. 1994, 659, 117–125. [Google Scholar] [CrossRef]
- Sugawara, M.; Hirano, A.; Rehák, M.; Nakanishi, J.; Kawai, K.; Sato, H.; Umezawa, Y. Electrochemical evaluation of chemical selectivity of glutamate receptor ion channel proteins with a multi-channel sensor. Biosens. Bioelectron. 1997, 12, 425–439. [Google Scholar] [CrossRef]
- McMahon, C.P.; O’Neill, R.D. Polymer–Enzyme Composite Biosensor with High Glutamate Sensitivity and Low Oxygen Dependence. Anal. Chem. 2005, 77, 1196–1199. [Google Scholar] [CrossRef]
- Burmeister, J.J.; Davis, V.A.; Quintero, J.E.; Pomerleau, F.; Huettl, P.; Gerhardt, G.A. Glutaraldehyde cross-linked glutamate oxidase coated microelectrode arrays: Selectivity and resting levels of glutamate in the CNS. ACS Chem. Neurosci. 2013, 4, 721–728. [Google Scholar] [CrossRef] [PubMed] [Green Version]
- Barman, S.C.; Hossain, M.F.; Yoon, H.; Park, J.Y. Carboxyl Terminated Reduced Graphene Oxide (Crbxl-RGO) and Pt Nanoparticles Based Ultra-Sensitive and Selective Electrochemical Biosensor for Glutamate Detection. J. Electrochem. Soc. 2018, 165, B296–B301. [Google Scholar] [CrossRef]
- Wang, Y.; Mishra, D.; Bergman, J.; Keighron, J.D.; Skibicka, K.P.; Cans, A.S. Ultrafast Glutamate Biosensor Recordings in Brain Slices Reveal Complex Single Exocytosis Transients. ACS Chem. Neurosci. 2019, 10, 1744–1752. [Google Scholar] [CrossRef] [PubMed]
- Li, Y.T.; Jin, X.; Tang, L.; Lv, W.L.; Xiao, M.M.; Zhang, Z.Y.; Gao, C.; Zhang, G.J. Receptor-Mediated Field Effect Transistor Biosensor for Real-Time Monitoring of Glutamate Release from Primary Hippocampal Neurons. Anal. Chem. 2019, 91, 8229–8236. [Google Scholar] [CrossRef]
- Schultz, J.; Uddin, Z.; Singh, G.; Howlader, M.M.R. Glutamate sensing in biofluids: Recent advances and research challenges of electrochemical sensors. Analyst 2020, 145, 321–347. [Google Scholar] [CrossRef]
- Yang, X.; Zhang, F.; Wu, W.; Tang, Y.; Yan, J.; Liu, Y.; Amatore, C.; Huang, W. Quantitative Nano-amperometric Measurement of Intravesicular Glutamate Content and its Sub-Quantal Release by Living Neurons. Angew. Chem. Int. Ed. 2021, 60, 15803–15808. [Google Scholar] [CrossRef]
- Niwa, O.; Kurita, R.; Horiuchi, T.; Torimitsu, K. Small-Volume On-Line Sensor for Continuous Measurement of γ-Aminobutyric Acid. Anal. Chem. 1998, 70, 89–93. [Google Scholar] [CrossRef] [PubMed]
- Sekioka, N.; Kato, D.; Kurita, R.; Hirono, S.; Niwa, O. Improved detection limit for an electrochemical γ-aminobutyric acid sensor based on stable NADPH detection using an electron cyclotron resonance sputtered carbon film electrode. Sens. Actuators B Chem. 2008, 129, 442–449. [Google Scholar] [CrossRef]
- Prasad, B.B.; Prasad, A.; Tiwari, M.P. Highly selective and sensitive analysis of γ-aminobutyric acid using a new molecularly imprinted polymer modified at the surface of abrasively immobilized multi-walled carbon nanotubes on pencil graphite electrode. Electrochim. Acta 2013, 102, 400–408. [Google Scholar] [CrossRef]
- Alamry, K.A.; Hussein, M.A.; Choi, J.W.; El-Said, W.A. Non-enzymatic electrochemical sensor to detect γ-aminobutyric acid with ligand-based on graphene oxide modified gold electrode. J. Electroanal. Chem. 2020, 879, 114789. [Google Scholar] [CrossRef]
- Levine, P.M.; Gong, P.; Levicky, R.; Shepard, K.L. Real-time, multiplexed electrochemical DNA detection using an active complementary metal-oxide-semiconductor biosensor array with integrated sensor electronics. Biosens. Bioelectron. 2009, 24, 1995–2001. [Google Scholar] [CrossRef] [PubMed] [Green Version]
- Arya, S.K.; Wong, C.C.; Jeon, Y.J.; Bansal, T.; Park, M.K. Advances in Complementary-Metal-Oxide-Semiconductor-Based Integrated Biosensor Arrays. Chem. Rev. 2015, 115, 5116–5158. [Google Scholar] [CrossRef] [PubMed]
- Xiao, G.; Xu, S.; Song, Y.; Zhang, Y.; Li, Z.; Gao, F.; Xie, J.; Sha, L.; Xu, Q.; Shen, Y.; et al. In situ detection of neurotransmitters and epileptiform electrophysiology activity in awake mice brains using a nanocomposites modified microelectrode array. Sens. Actuators B Chem. 2019, 288, 601–610. [Google Scholar] [CrossRef]
- Begly, C.; Ackart, D.; Mylius, J.; Basaraba, R.; Chicco, A.J.; Chen, T.W. Study of Real-Time Spatial and Temporal Behavior of Bacterial Biofilms Using 2-D Impedance Spectroscopy. IEEE Trans. Biomed. Circuits Syst. 2020, 14, 1051–1064. [Google Scholar] [CrossRef]
- Lu, Z.; Xu, S.; Wang, H.; He, E.; Liu, J.; Dai, Y.; Xie, J.; Song, Y.; Wang, Y.; Wang, Y.; et al. PtNPt/MWCNT-PEDOT:PSS-Modified Microelectrode Arrays for the Synchronous Dopamine and Neural Spike Detection in Rat Models of Sleep Deprivation. ACS Appl. Bio Mater. 2021, 4, 4872–4884. [Google Scholar] [CrossRef]
- Tedjo, W.; Nejad, J.E.; Feeny, R.; Yang, L.; Henry, C.S.; Tobet, S.; Chen, T. Electrochemical biosensor system using a CMOS microelectrode array provides high spatially and temporally resolved images. Biosens. Bioelectron. 2018, 114, 78–88. [Google Scholar] [CrossRef]
- Dudina, A.; Frey, U.; Hierlemann, A. Carbon-Nanotube-Based Monolithic CMOS Platform for Electrochemical Detection of Neurotransmitter Glutamate. Sensors 2019, 19, 3080. [Google Scholar] [CrossRef] [Green Version]
- Futagawa, M.; Suzuki, D.; Otake, R.; Dasai, F.; Ishida, M.; Sawada, K. Fabrication of a 128 × 128 pixels charge transfer type hydrogen ion image sensor. IEEE Trans. Electron. Devices 2013, 60, 2634–2639. [Google Scholar] [CrossRef]
- Horiuchi, H.; Agetsuma, M.; Ishida, J.; Nakamura, Y.; Lawrence Cheung, D.; Nanasaki, S.; Kimura, Y.; Iwata, T.; Takahashi, K.; Sawada, K.; et al. CMOS-based bio-image sensor spatially resolves neural activity-dependent proton dynamics in the living brain. Nat. Commun. 2020, 11, 712. [Google Scholar] [CrossRef] [PubMed] [Green Version]
- Lee, Y.N.; Araki, T.; Kimura, Y.; Dasai, F.; Iwata, T.; Takahashi, K.; Sawada, K. High-Density 2-μm-Pitch pH Image Sensor With High-Speed Operation up to 1933 fps. IEEE Trans. Biomed. Circuits Syst. 2019, 13, 352–363. [Google Scholar] [CrossRef] [PubMed]
- Takenaga, S.; Tamai, Y.; Okumura, K.; Ishida, M.; Sawada, K. Label-Free Acetylcholine Image Sensor Based on Charge Transfer Technology for Biological Phenomenon Tracking. Jpn. J. Appl. Phys. 2012, 51, 027001. [Google Scholar] [CrossRef]
- Iwata, T.; Mizutani, S.; Okumura, K.; Okumura, Y.; Takahashi, K.; Sawada, K. H2O2 detection by redox-based potentiometric sensors under biological environments. Sens. Mater. 2018, 30, 2359–2367. [Google Scholar] [CrossRef]
- Doi, H.; Parajuli, B.; Horio, T.; Shigetomi, E.; Shinozaki, Y.; Noda, T.; Takahashi, K.; Hattori, T.; Koizumi, S.; Sawada, K. Development of a label-free ATP image sensor for analyzing spatiotemporal patterns of ATP release from biological tissues. Sens. Actuators B Chem. 2021, 335, 129686. [Google Scholar] [CrossRef]
- Anan, H.; Kamahori, M.; Ishige, Y.; Nakazato, K. Redox-potential sensor array based on extended-gate field-effect transistors with ω-ferrocenylalkanethiol-modified gold electrodes. Sens. Actuators B Chem. 2013, 187, 254–261. [Google Scholar] [CrossRef]
- Ishige, Y.; Takeda, S.; Kamahori, M. Direct detection of enzyme-catalyzed products by FET sensor with ferrocene-modified electrode. Biosens. Bioelectron. 2010, 26, 1366–1372. [Google Scholar] [CrossRef]
- Okumura, Y.; Mizutani, S.; Okumura, K.; Iwata, T.; Takahashi, K.; Sawada, K. Development of H2O2 image sensor for GABA and glutamate imaging. In Proceedings of the 2017 19th International Conference on Solid-State Sensors, Actuators and Microsystems (TRANSDUCERS), Kaohsiung, Taiwan, 18–22 June 2017; pp. 1551–1554. [Google Scholar] [CrossRef]
- Okumura, Y.; Iwata, T.; Okumura, K.; Shiguma, H.; Horio, T.; Doi, H.; Takahashi, K.; Sawada, K. H2O2 and Glutamate Imaging with Improved Sensitivity Based on Charge-Transfer-Type Potentiometric Redox Sensor Arrays. In Proceedings of the 17th International Meeting on Chemical Sensors 2018, Vienna, Austria, 15–19 July 2018; pp. 141–142. [Google Scholar] [CrossRef]
- Ishige, Y.; Shimoda, M.; Kamahori, M. Extended-gate FET-based enzyme sensor with ferrocenyl-alkanethiol modified gold sensing electrode. Biosens. Bioelectron. 2009, 24, 1096–1102. [Google Scholar] [CrossRef]
- Yabuki, S. Polyelectrolyte Complex Membranes for Immobilizing Biomolecules, and Their Applications to Bio-analysis. Anal. Sci. 2011, 27, 695–702. [Google Scholar] [CrossRef] [Green Version]
- Astruc, D. Why is Ferrocene so Exceptional? Eur. J. Inorg. Chem. 2017, 2017, 6–29. [Google Scholar] [CrossRef]
- Frey, O.; Holtzman, T.; McNamara, R.; Theobald, D.; van der Wal, P.; de Rooij, N.; Dalley, J.; Koudelka-Hep, M. Enzyme-based choline and l-glutamate biosensor electrodes on silicon microprobe arrays. Biosens. Bioelectron. 2010, 26, 477–484. [Google Scholar] [CrossRef]
- Fontana, A.C.K. Current approaches to enhance glutamate transporter function and expression. J. Neurochem. 2015, 134, 982–1007. [Google Scholar] [CrossRef]
- Borisova, T.; Kucherenko, D.; Soldatkin, O.; Kucherenko, I.; Pastukhov, A.; Nazarova, A.; Galkin, M.; Borysov, A.; Krisanova, N.; Soldatkin, A.; et al. An amperometric glutamate biosensor for monitoring glutamate release from brain nerve terminals and in blood plasma. Anal. Chim. Acta 2018, 1022, 113–123. [Google Scholar] [CrossRef]
- Lee, Y.N.Y.N.; Okumura, K.; Horio, T.; Iwata, T.; Takahashi, K.; Hattori, T.; Sawada, K. A bio-image sensor for simultaneous detection of multi-neurotransmitters. Talanta 2018, 179, 569–574. [Google Scholar] [CrossRef]


Publisher’s Note: MDPI stays neutral with regard to jurisdictional claims in published maps and institutional affiliations. |
© 2021 by the authors. Licensee MDPI, Basel, Switzerland. This article is an open access article distributed under the terms and conditions of the Creative Commons Attribution (CC BY) license (https://creativecommons.org/licenses/by/4.0/).