Communication

Quasi-Simultaneous Sensitive Detection of Two Gas Species by Cavity-Ringdown Spectroscopy with Two Lasers

1
Anhui Institute of Optics and Fine Mechanics, Hefei Institutes of Physical Sciences, Chinese Academy of Sciences, Hefei 230031, China
2
Graduate School of Science Island Branch, University of Science and Technology of China, Hefei 230026, China
3
School of Engineering Science, University of Science and Technology of China, Hefei 230026, China
4
College of Information Science and Engineering, Northeastern University, Shenyang 110819, China
*
Author to whom correspondence should be addressed.
Sensors 2021, 21(22), 7622; https://doi.org/10.3390/s21227622
Submission received: 8 October 2021 / Revised: 28 October 2021 / Accepted: 3 November 2021 / Published: 17 November 2021
(This article belongs to the Section Optical Sensors)

Abstract

:
We developed a cavity ringdown spectrometer by utilizing a step-scanning and dithering method for matching laser wavelengths to optical resonances of an optical cavity. Our approach is capable of working with two and more lasers for quasi-simultaneous measurements of multiple gas species. The developed system was tested with two lasers operating around 1654 nm and 1658 nm for spectral detections of 12CH4 and its isotope 13CH4 in air, respectively. The ringdown time of the empty cavity was about 340 µs. The achieved high detection sensitivity of a noise-equivalent absorption coefficient was 2.8 × 10⁻¹¹ cm−1 Hz−1/2 or 1 × 10⁻¹¹ cm−1 by averaging for 30 s. The uncertainty of the high precision determination of δ 13 CH 4 in air is about 1.3‰. Such a system will be useful for future applications such as environmental monitoring.

1. Introduction

Methane (CH4) is an important biosignature gas that provides key clues for the existence of life on extraterrestrial planets, such as Mars [1]. Methane is also an important greenhouse gas [2], energy resource [3], and microbial metabolites product [4] in ambient air. The processes of CH4 production and consumption can be understood through the analysis of its isotopes, so as to obtain CH4 source information. For example, more negative δ 13 C and δ D values indicate biological sources, while more positive δ 13 C and δ D values indicate heat sources [5].
One type of widely used instrument for measuring trace gases and isotopes is isotope ratio mass spectrometry (IRMS) with an accuracy of ±0.2‰ for δ C H 4 13 [6]. However, its in-situ application is limited due to its large size, high cost and complicated operation process [7]. In recent years, with the development of diode lasers, such as those used in fiber-optical tele-communication and longer wavelength interband and quantum cascade lasers, laser-spectroscopy-based sensors have become a more attractive tool for trace gas detection and its isotopes analysis. It offers high sensitivity, small size, fast response, and high selectivity [8,9,10,11,12,13,14,15] in spectroscopic gas sensing. In particular, cavity ringdown spectroscopy (CRDS) can achieve an effective absorption path length of tens of kilometers by using a high-finesse optical cavity, which greatly improves the detection capability of trace gas sensing [16]. CRDS has been extensively applied in atmospheric greenhouse gas detections [17,18,19], aerosol particle extinction measurements [20,21], spectral line parameters measurements [22,23,24], and human breath diagnosis [25,26,27]. Because of the high sensitivity of CRDS, it is very suitable for high-precision stable isotope analysis. One early CRDS methane isotope measurement was in the mid-infrared wavelength region, due to the stronger absorption line intensity in the mid-infrared region. Dahnke et al. measured the absorption of 12CH4 and 13CH4 near 3 μ m , and its measurement precision for δ 13 C in ambient air was ±11‰ [28]. With the development of longer wavelength quantum cascade lasers, it became possible to apply CRDS on the strong fundamental vibrational transitions of 12CH4 and 13CH4 at 7.5 μ m , as reported by Abhijit Maity et al. for δ 13 C H 4 measurements in the atmosphere and human breathing [29]. In the near-infrared region, the line intensity of methane is about two orders of magnitude weaker than that in the mid-infrared region. However, much higher reflectivity mirrors available for the near-infrared region increase the effective optical path length of absorption, which can largely compensate for weaker line intensity. In addition, near-infrared lasers and optical components are cheaper and more robust; hence, trace gas and isotope measurements based on near-infrared (NIR) continuous-wave cavity ringdown (CW-CRDS) have attracted attention. Chen et al. used a pair of high-reflection mirrors exceeding 99.9993% to build a CRDS system with an equivalent absorption optical length of 93.3 km and achieved high-precision measurements of δ 13 C H 4 in the air [30]. A commercial instrument made by Picarro is also based on NIR CW-CRDS. In addition to being used in ambient air [31], it also provides insights into the aquatic carbon cycle process [32].
This paper reports the development of a CRDS instrument which is capable of high-precision measurements of two species quasi simultaneously. The present instrument operates with dual lasers at wavelengths of ~1654 nm for 12CH4 and ~1658 nm for isotope 13CH4 measurements in this work. In the following sections, we will provide a detailed description of the system and an application demonstration of the system for isotope ratio measurements of CH4 in air.

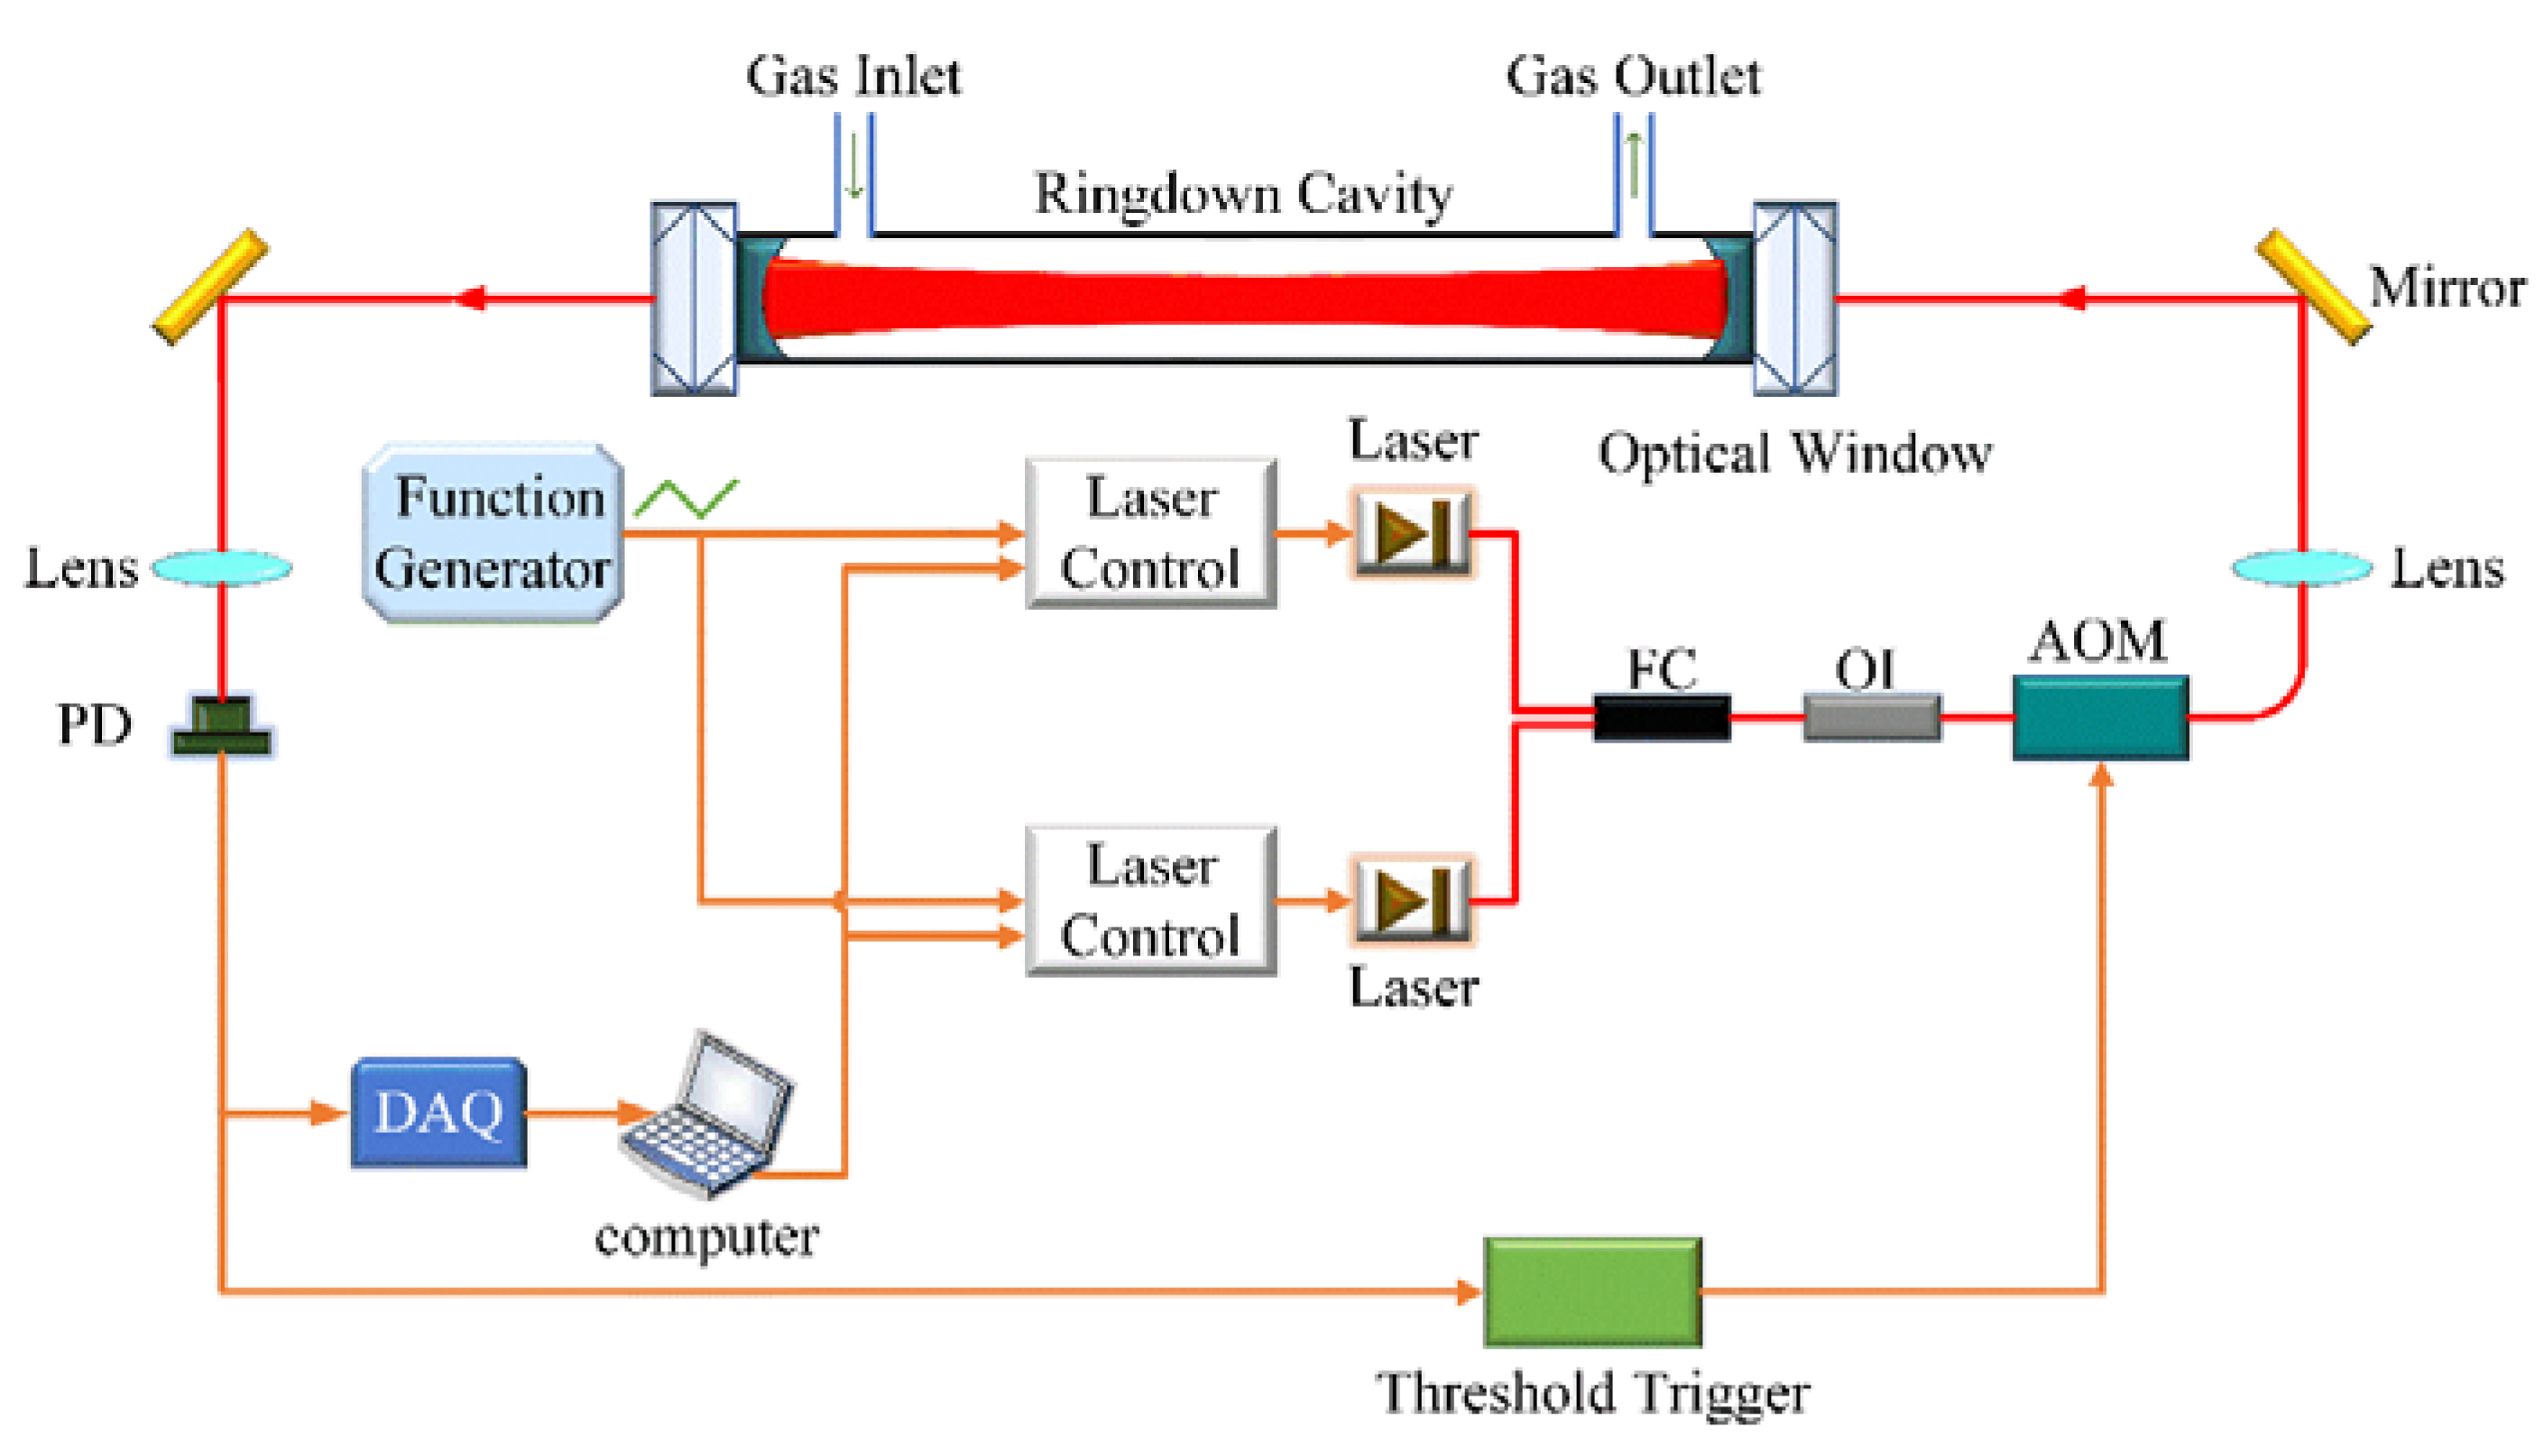
2. Experimental System

The schematic of our developed system is presented in Figure 1. Two near-infrared distributed feedback (DFB) diode lasers (from NEL) were utilized for spectral detections of 12CH4 and its isotope 13CH4 in wavelength regions of 1654 nm and 1658 nm, respectively. Two laser drivers (SRS, model LDC501) were used to control the operation temperatures and currents of the two diode lasers. These operation parameters were adjustable by a computer via a GPIB interface. The laser wavelength can be quickly modulated via its operation current by a triangle-waveform signal from a function generator (Siglent, model SDG1032X). Both laser outputs were combined by a fiber combiner and then passed through an optical isolator (FOPTO, model PIISO-1654-D-L-05-FA), which is used to block the light back-reflected by the ringdown cavity from entering the laser and to minimize any influence of the optical feedback effect on the laser stability. An acousto-optic modulator (Brimrose, model AMM-55-8-70-1630-2FP) is used to switch off the 1st-order deflected laser beam into the cavity during the measurements of ringdown signals. The input laser beam geometry was mode-matched to the longitudinal modes of the optical cavity by using a lens.
The optical ringdown cavity consisted of a pair of highly reflective plano-concave mirrors (Layertec, reflectivity > 99.995%, radius of curvature 1000 mm). The cavity was sealed by separate window quartz substrates at both ends, so that the cavity mirrors will not experience any differential pressure stress for better stability. The cavity was vacuumed and heated to around 200 °C for 48 h to desorb the gas adsorbed on the inner wall of the cavity before setting up the system. A high-vacuum turbo pump (Pfeiffer, model HiCube 80 Eco) was used to extract the gas in the cavity to a pressure as low as 10−3 Pa.
The transmitted optical signal from the ringdown cavity was collected into a single- mode optical fiber by a lens and received by a photodetector (Femto, model LCA-S-400K-IN-FS). Based on a preset threshold level for the transmitted signal, a trigger signal was generated to drive the AOM to turn off the 1st-order deflected laser beam and obtain a ringdown process of the signals. No noticeable impact on the ringdown decay time was observed when the threshold was set at different levels. A 16-bit data acquisition device (NI, model USB-6356, 1.25 MS/s data sampling rate) was used for acquiring cavity ringdown signals.

3. Methods

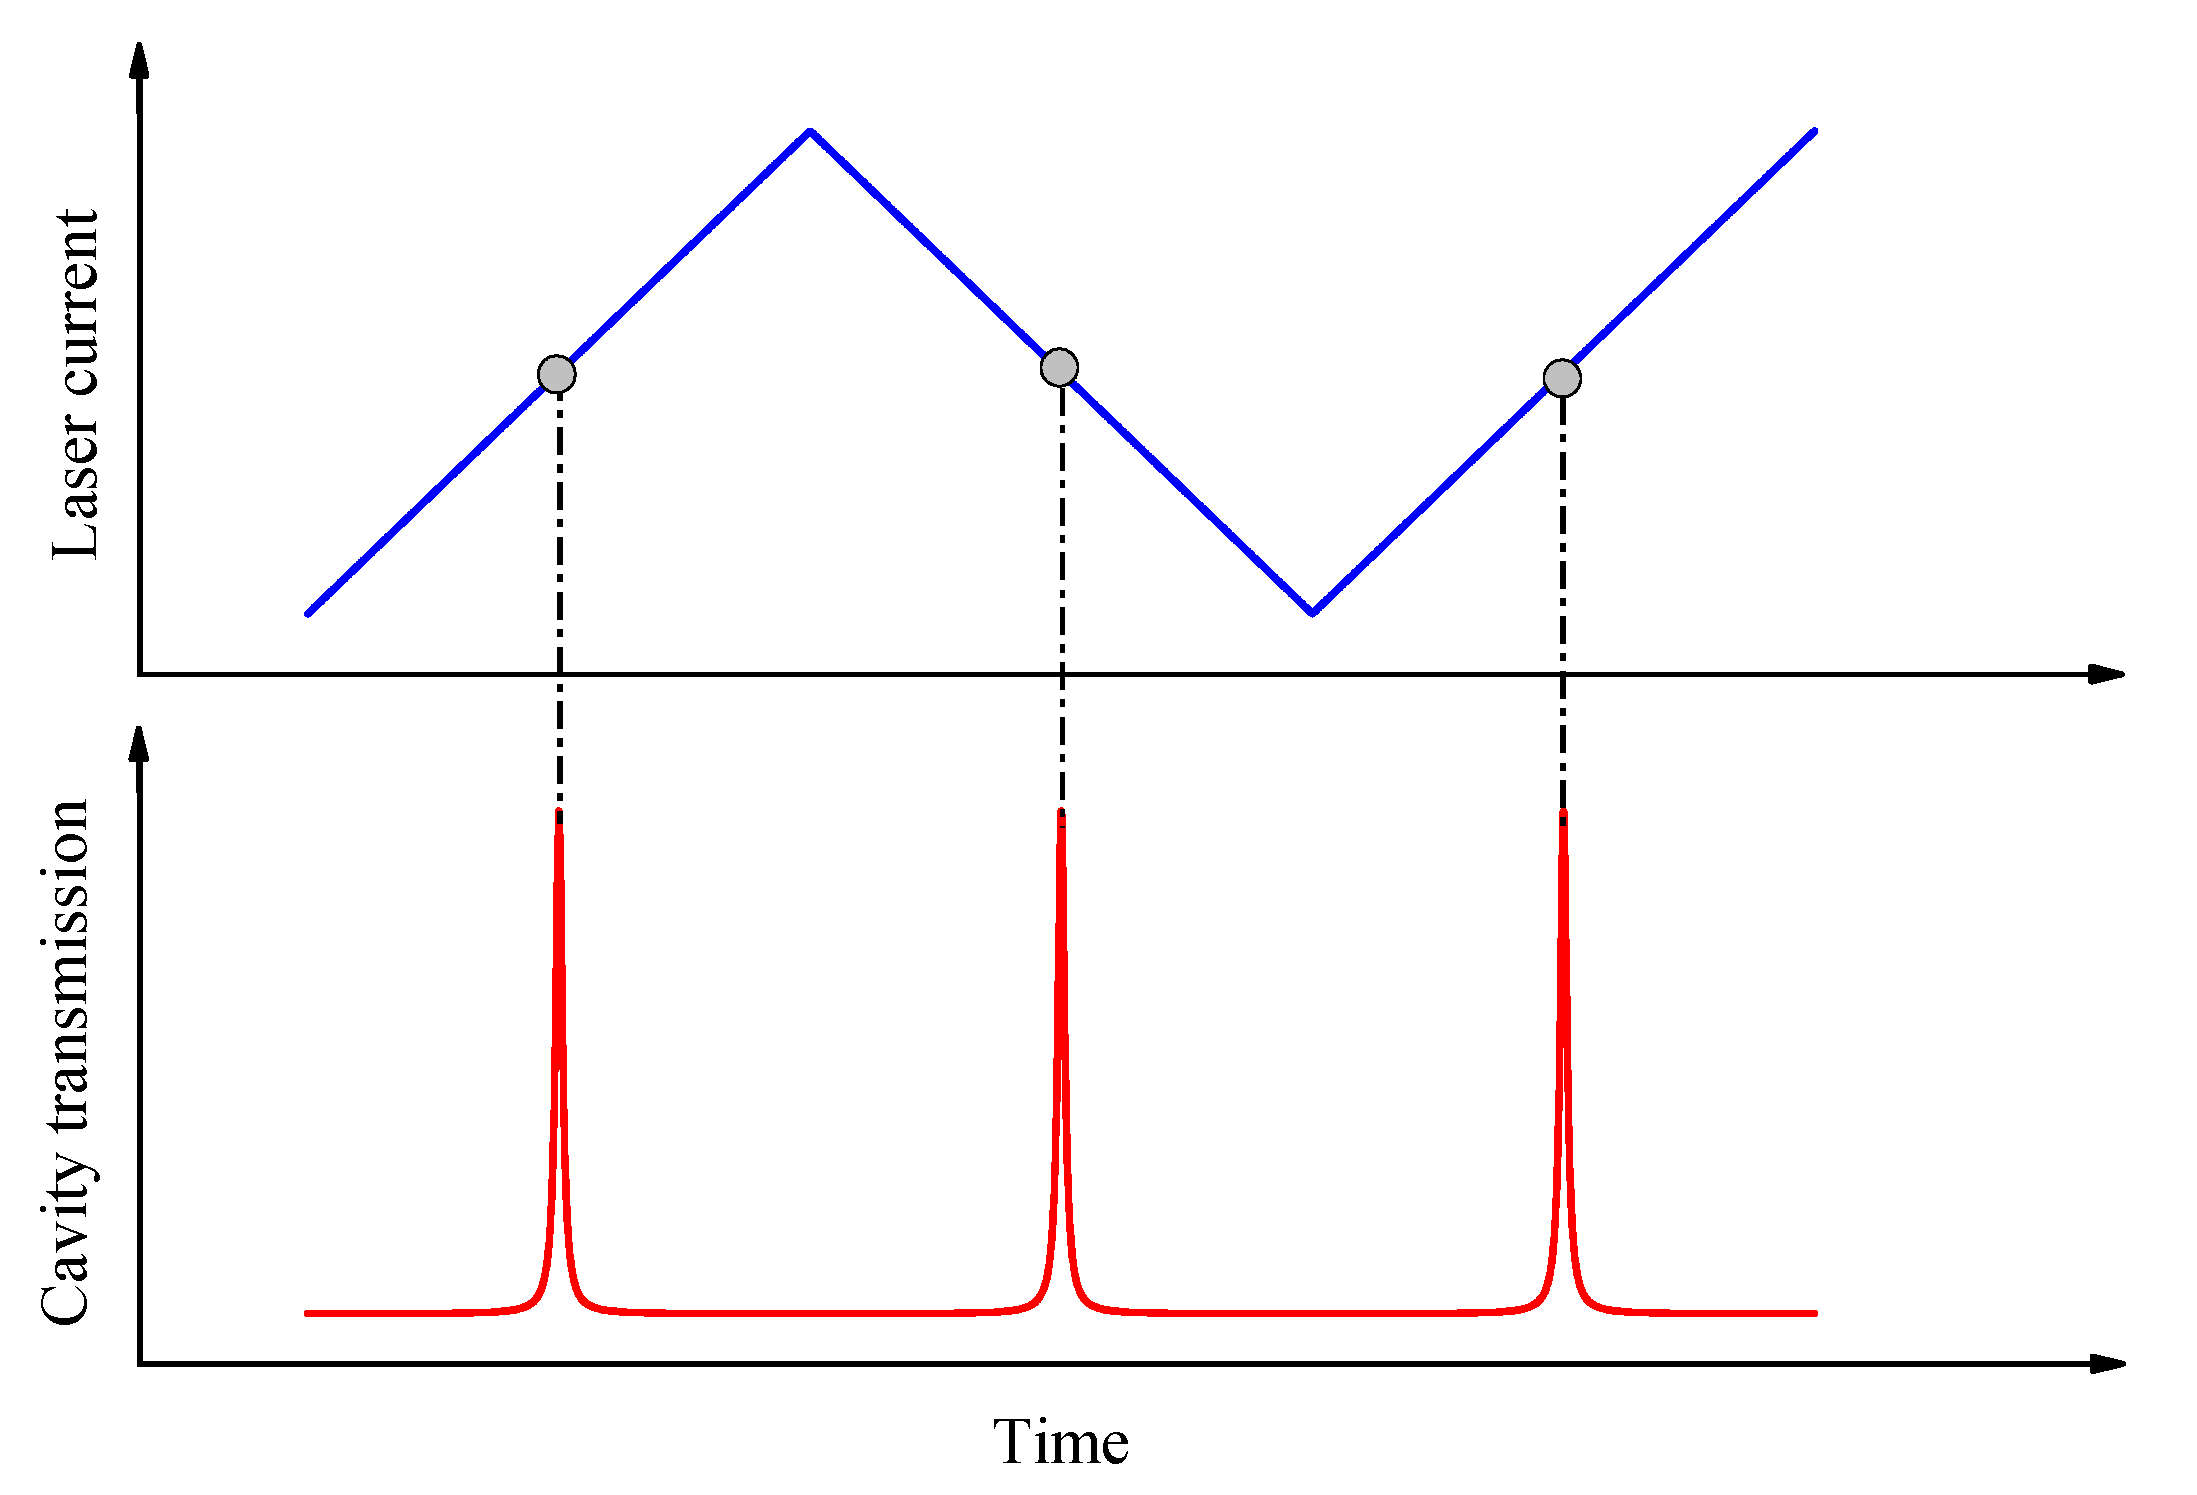
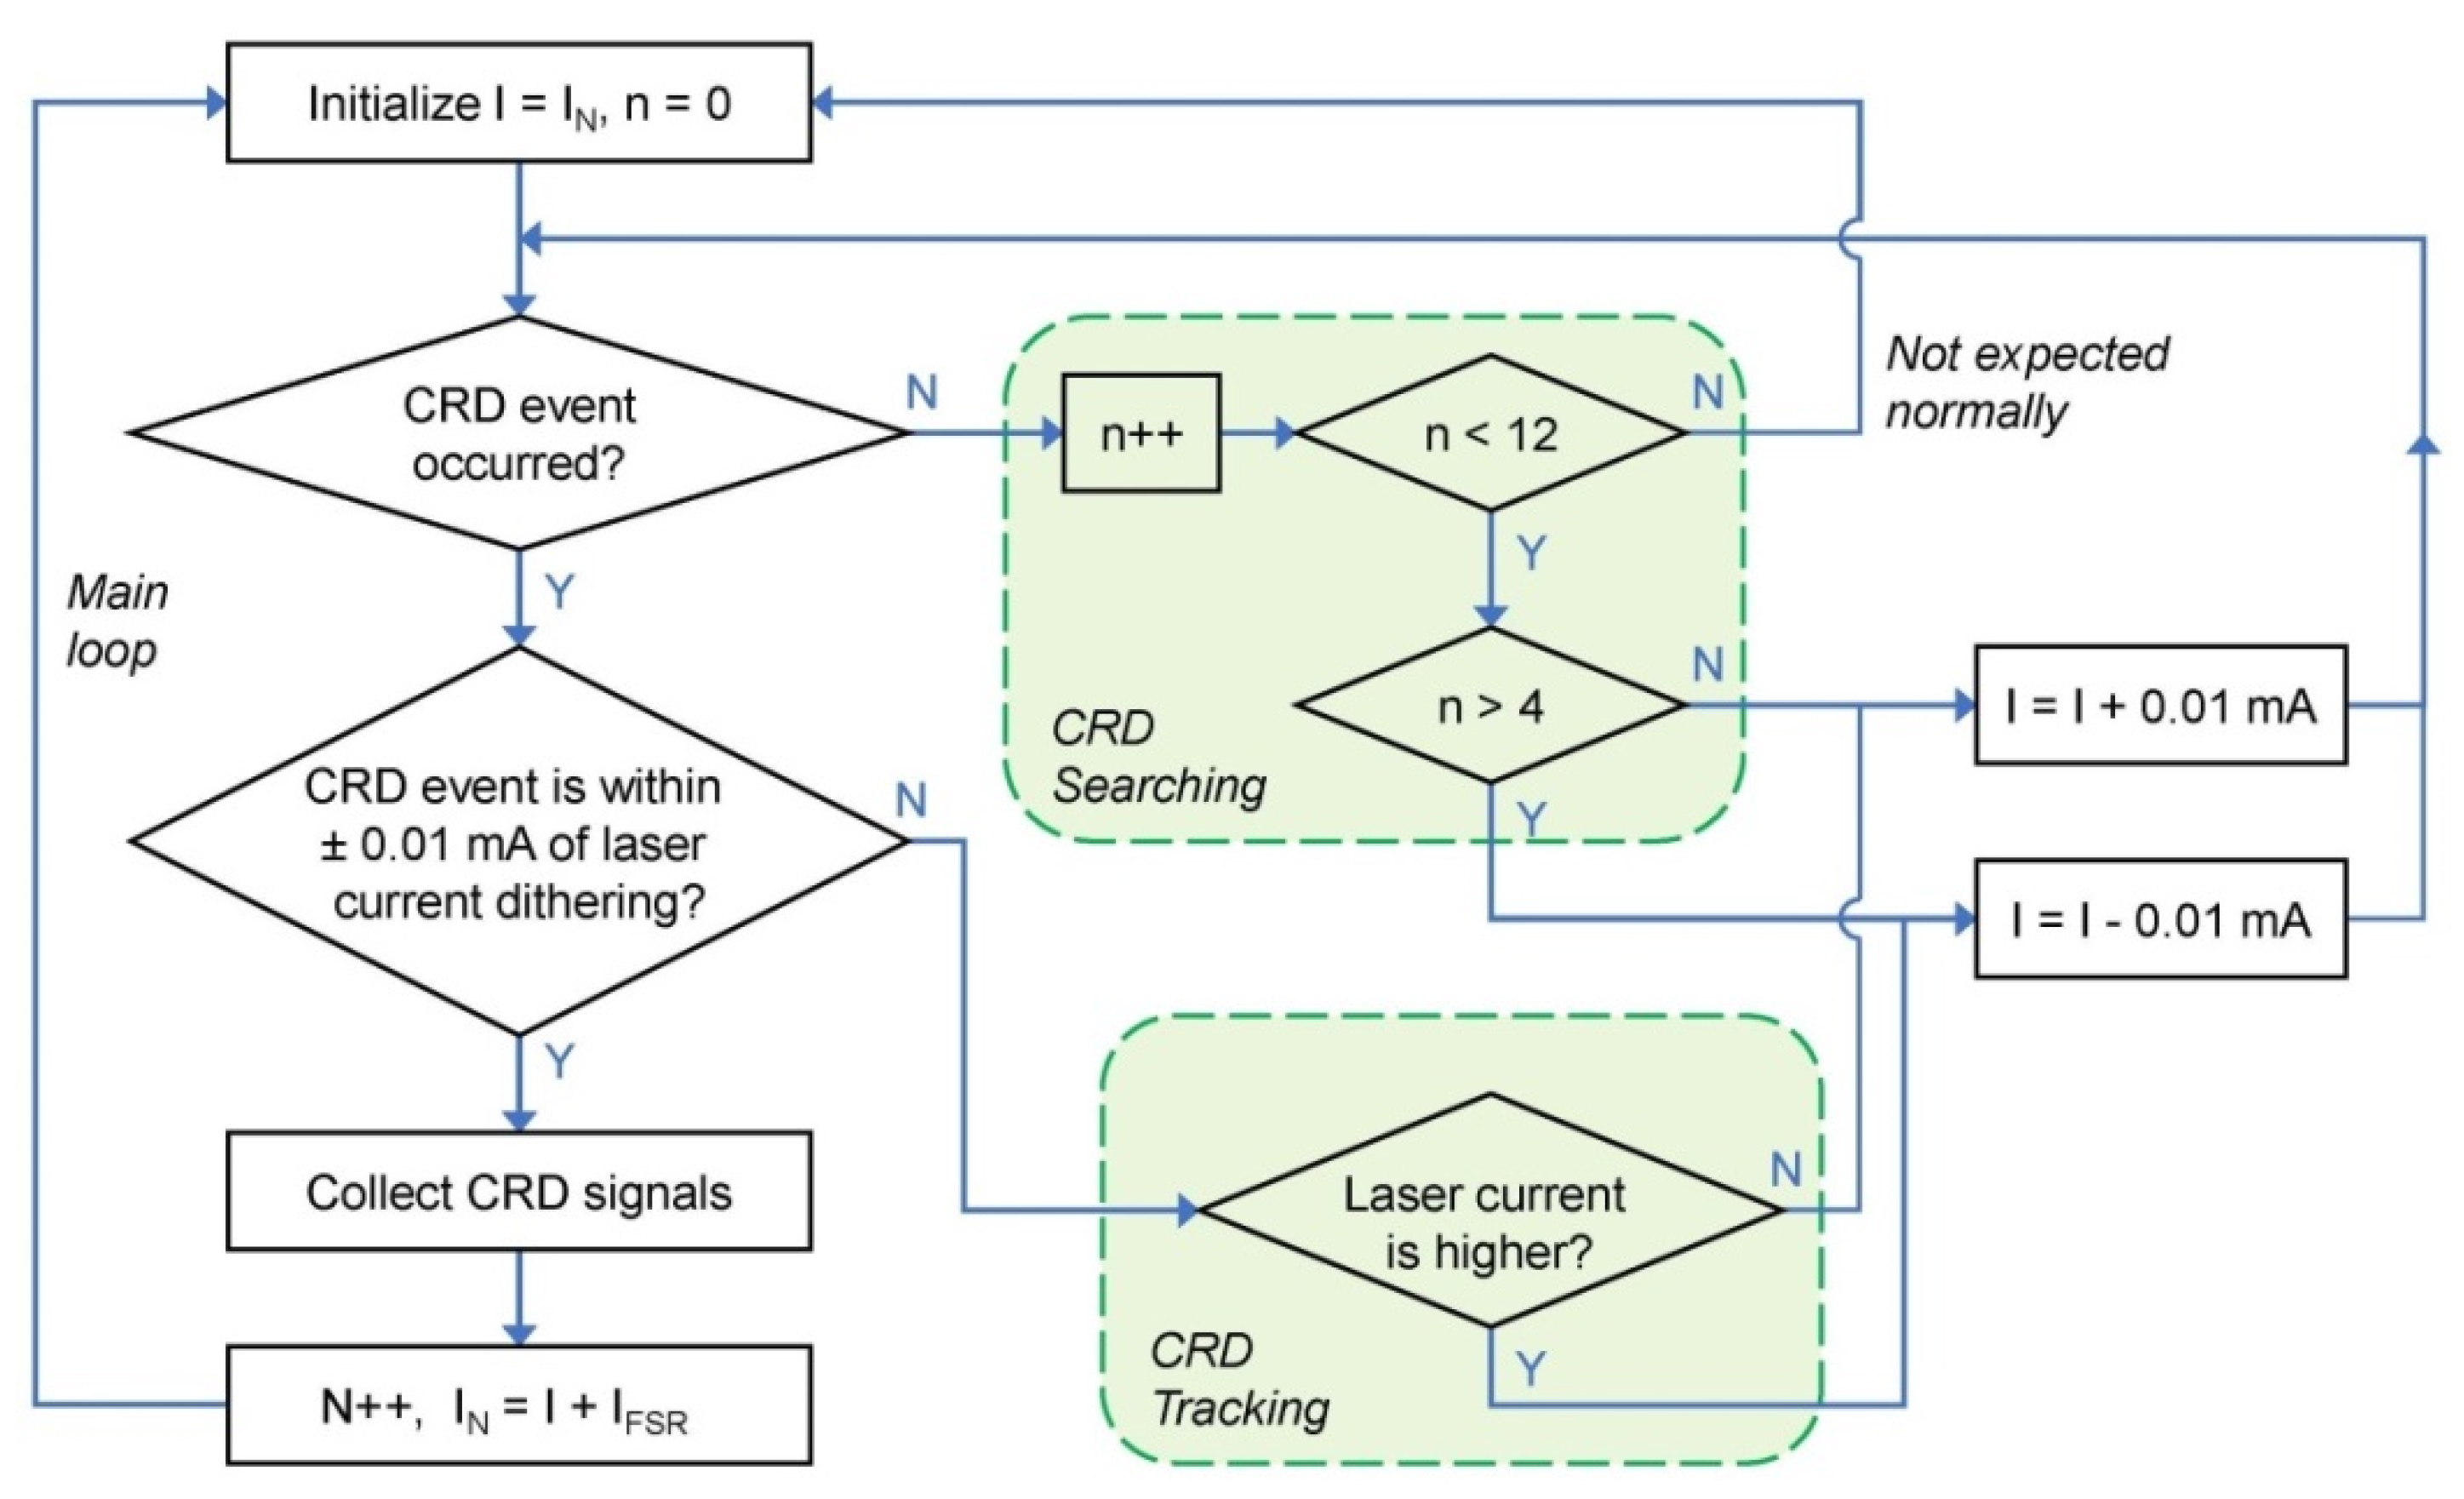
3.1. Step-Scanning Laser Frequency for Achieving Cavity Optical Resonances

Optical resonance between input laser radiation and an optical cavity occurs when the round-trip optical path length of the cavity is approximately an integer multiple of the laser wavelength. Therefore, we could tune and dither the laser wavelength for achieving an optical resonance [33,34] instead of an active stabilization of the laser wavelength. During an optical resonance process, the low-power laser radiation will be effectively coupled through the highly-reflective mirror into the cavity so that subsequent cavity ringdown decay could be facilitated by switching off the input laser beam [35,36,37] or moving the laser wavelength off resonance with the cavity [11]. In this study, we use a fixed-length cavity and step-scan the laser wavelength in combination with a small wavelength dithering. The periodic resonance frequencies of a fixed-length cavity serve as an accurate frequency scale for the measurement spectra. The longitudinal mode frequencies of the ringdown cavity are:
ν N = ν 0 + N × F S R ,
where ν 0 is the offset starting frequency of the cavity mode, N is an integer number for the cavity mode, and FSR is the free spectral range (i.e., periodicity of the resonance frequencies) of the cavity.
As the CRDS cavity uses highly-reflective mirrors, the bandwidth of an optical resonance is very narrow (~kHz). The exact resonance frequency of the cavity is susceptible to mechanical vibrations and temperature fluctuations from the external environment. Furthermore, the stability of DFB-type diode lasers (as used in this work) is typically in the order of ~MHz. Therefore, we modulated the laser wavelength slightly to achieve the optical resonance. The magnitude of the modulation is about FSR/4. This will ensure that the laser radiation interacts with a unique cavity mode and does not interfere with an adjacent cavity mode during the spectral scanning process [38].
We can feedback control the laser wavelength by probing the position of a mode matching during the triangle dithering and by adjusting the laser operation current to create resonance around the middle region of dithering, as shown in Figure 2. After multiple ringdown events have been measured, the laser current is step advanced by an amount corresponding to a laser frequency change in the vicinity of the consecutive cavity resonance, and the cycle is repeated until a preset range of spectral points has been acquired. The flow chart of this laser wavelength control scheme is shown in Figure 3. The steps on the left-hand side in Figure 3 form the main loop. The tracking loop is for centering the laser wavelength onto cavity resonances, whereas the searching loop is for moving the laser current until a CRD event happens within the triangle dithering. The temperature of the laser is maintained constant to an accuracy of ~1 mK. The triangular signal for current dithering was set at ~100 Hz, with an amplitude for making a laser frequency change of about 1/4 of the FSR. This small modulation amplitude ensures that the laser interacts with only one longitudinal cavity mode at a time and ringdown events can occur efficiently.
In order to verify and demonstrate the feasibility of the scheme, a spectrum was measured that continuously recorded 20 ringdown events at each scan step of the laser wavelength for consecutive cavity resonance frequencies. Figure 4 shows a step-scanned absorption feature of 13CH4 at 1658.689 nm, demonstrating that the laser frequency scan and CRDS measurements over an absorption feature were reliable.

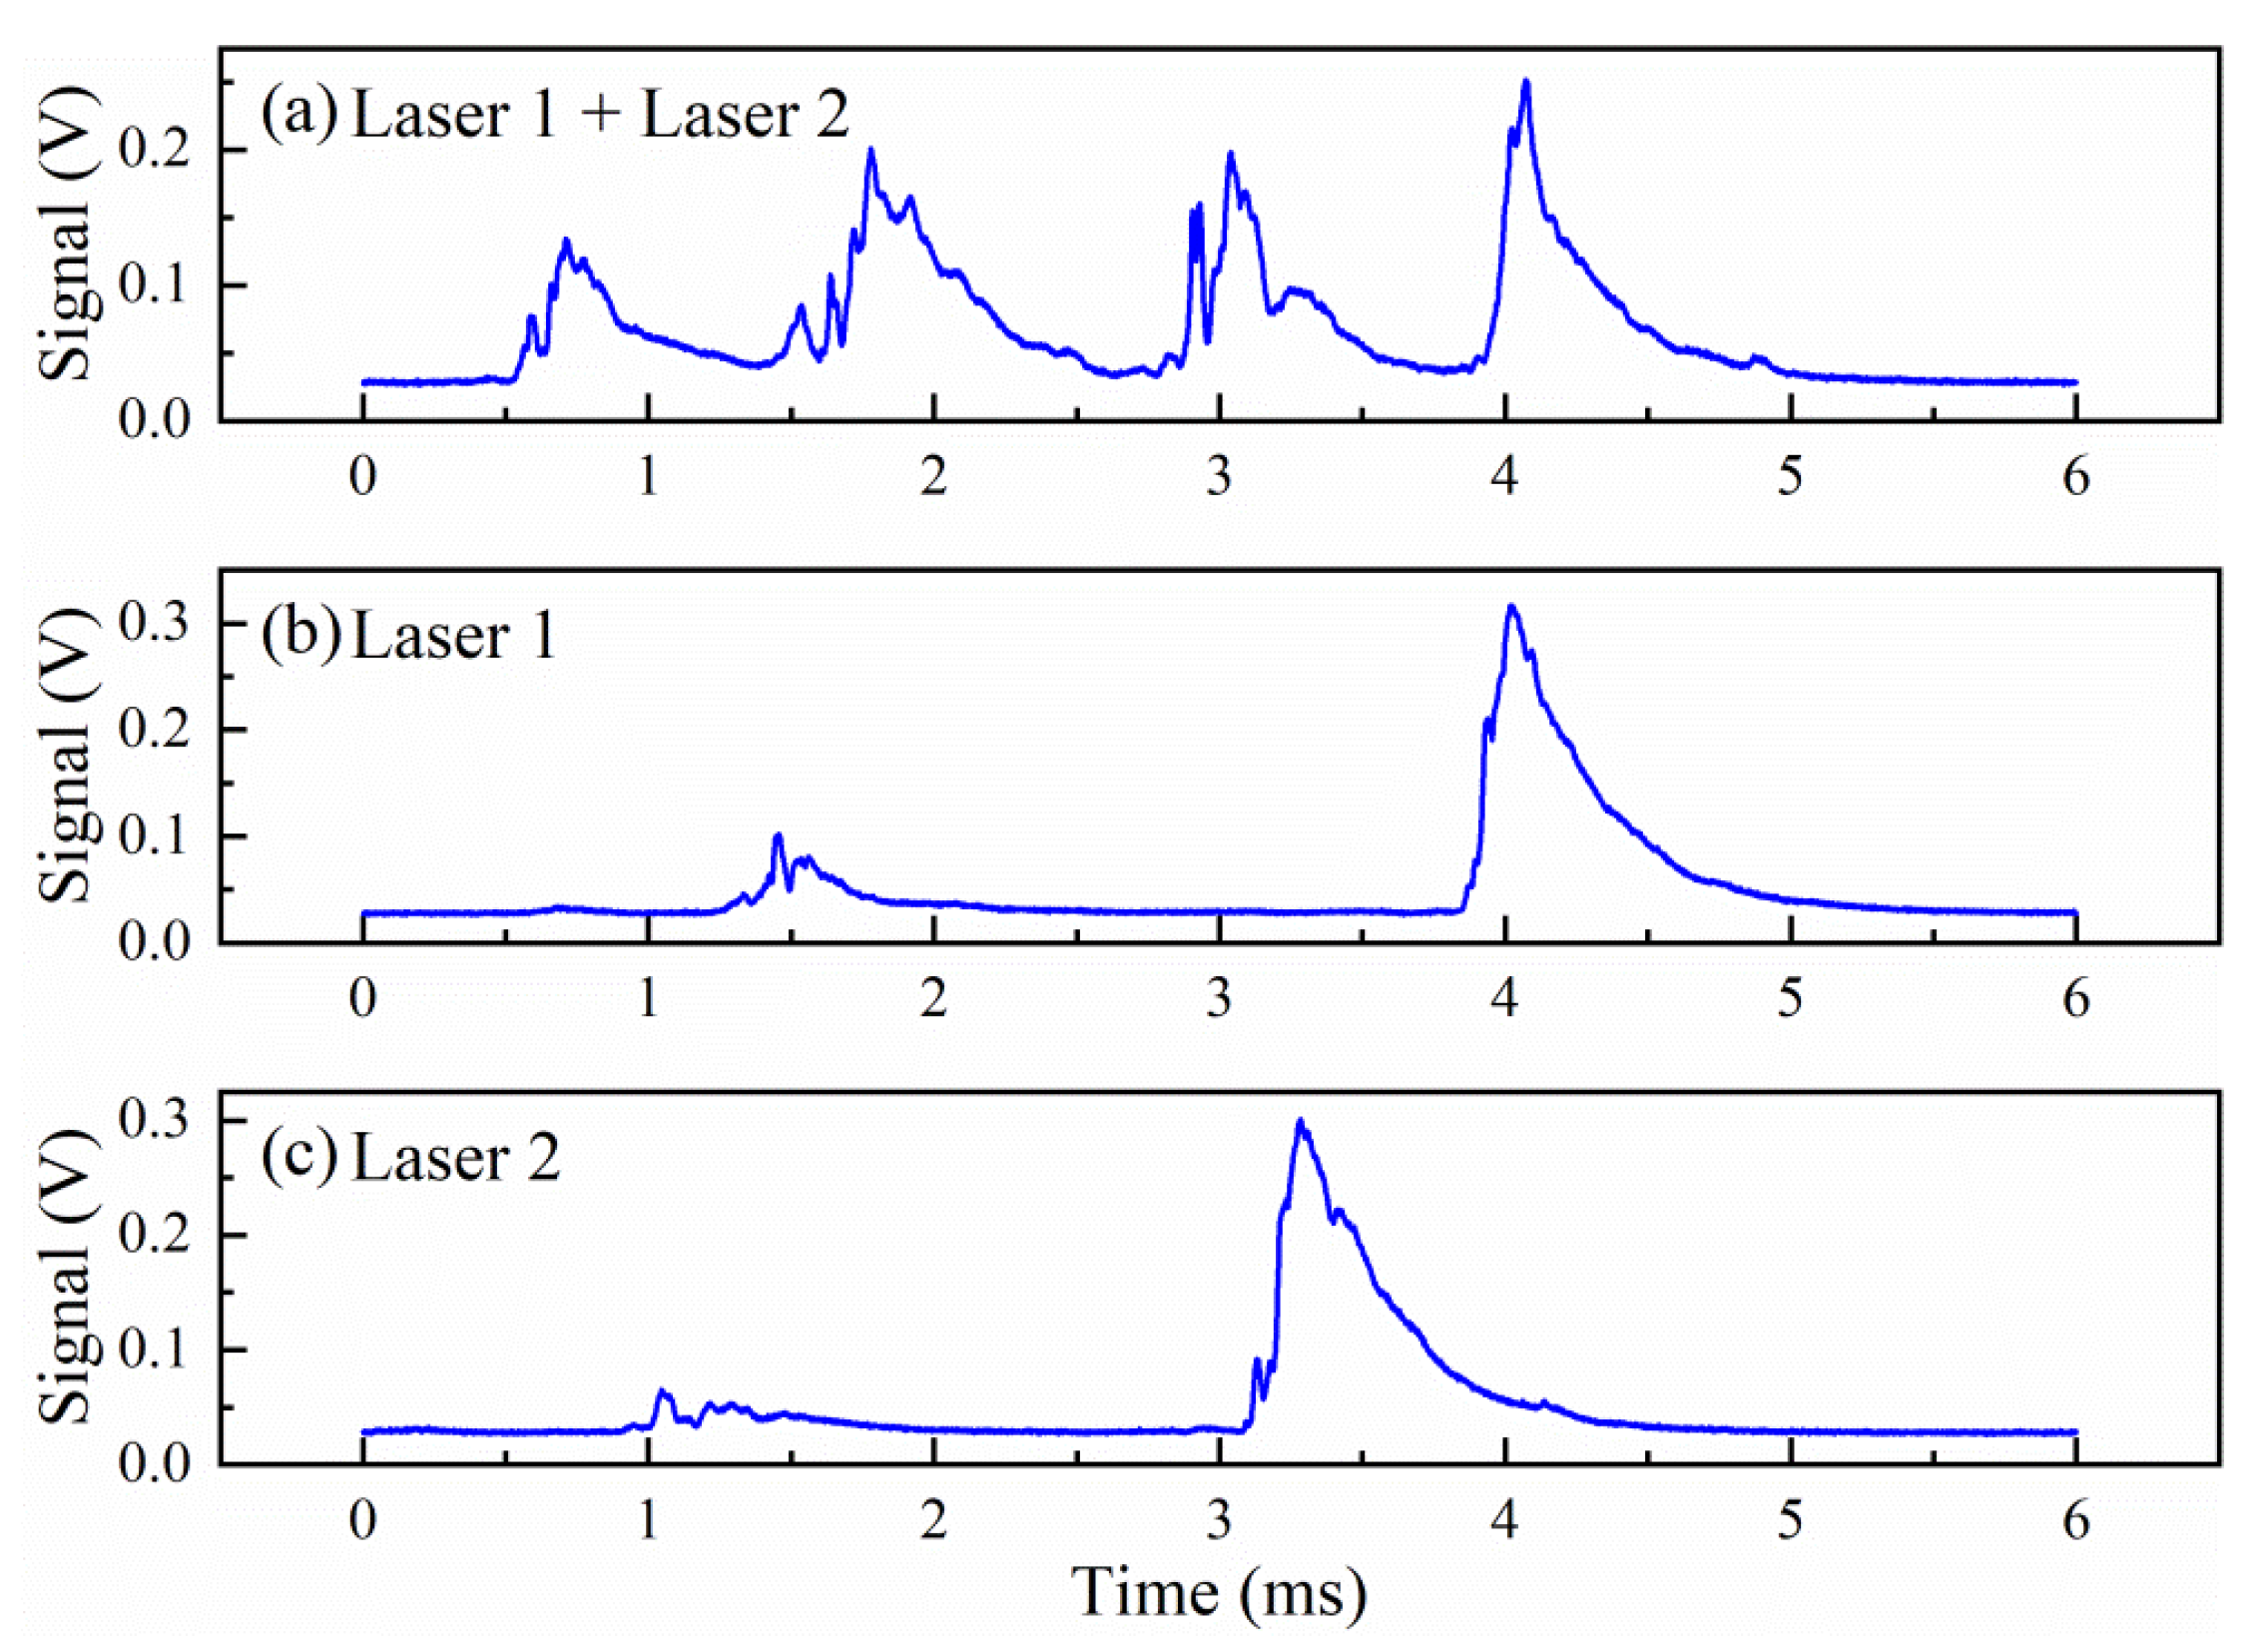
3.2. Simultaneous Multi-Wavelength Operation with Two or More Lasers

A single DFB diode laser has a limited wavelength coverage range. Therefore, multiple lasers might be required for spectral measurements of different absorption features or different gas species [39]. One approach is to use an optical switch for the selecting light output from one of the multiple laser sources. In this paper, we report a new method. We track the wavelengths of all the lasers relative to the cavity resonance frequencies of a fixed-length cavity and bring only one laser at a time to resonance with the cavity while all the other lasers are kept off-resonance with the cavity. The highly-reflective cavity mirrors block all the light of the non-resonant lasers. Therefore, the detectable cavity transmission is from a single laser only.
Figure 5 shows cavity transmission with two lasers. When both laser frequencies are modulated simultaneously around cavity resonance, cavity transmission signals interfere with each other, as shown in Figure 5a, and the ringdown signals can overlap. By keeping one laser off resonance and modulate only one of the lasers across the cavity resonance, a clear single-wavelength ringdown event can be created and measured, as shown in Figure 5b,c. We used the wavelength tracking scheme explained before and shown in Figure 3 to identify the operation conditions for each of the lasers at resonance with the cavity. For setting lasers off resonance with the cavity, we offset its operation current corresponding to a frequency shift of FSR/2. Quasi simultaneous detection at two or more different wavelengths is achieved by alternating one laser on resonance and all the other lasers off resonance with the cavity.

4. Results and Discussion

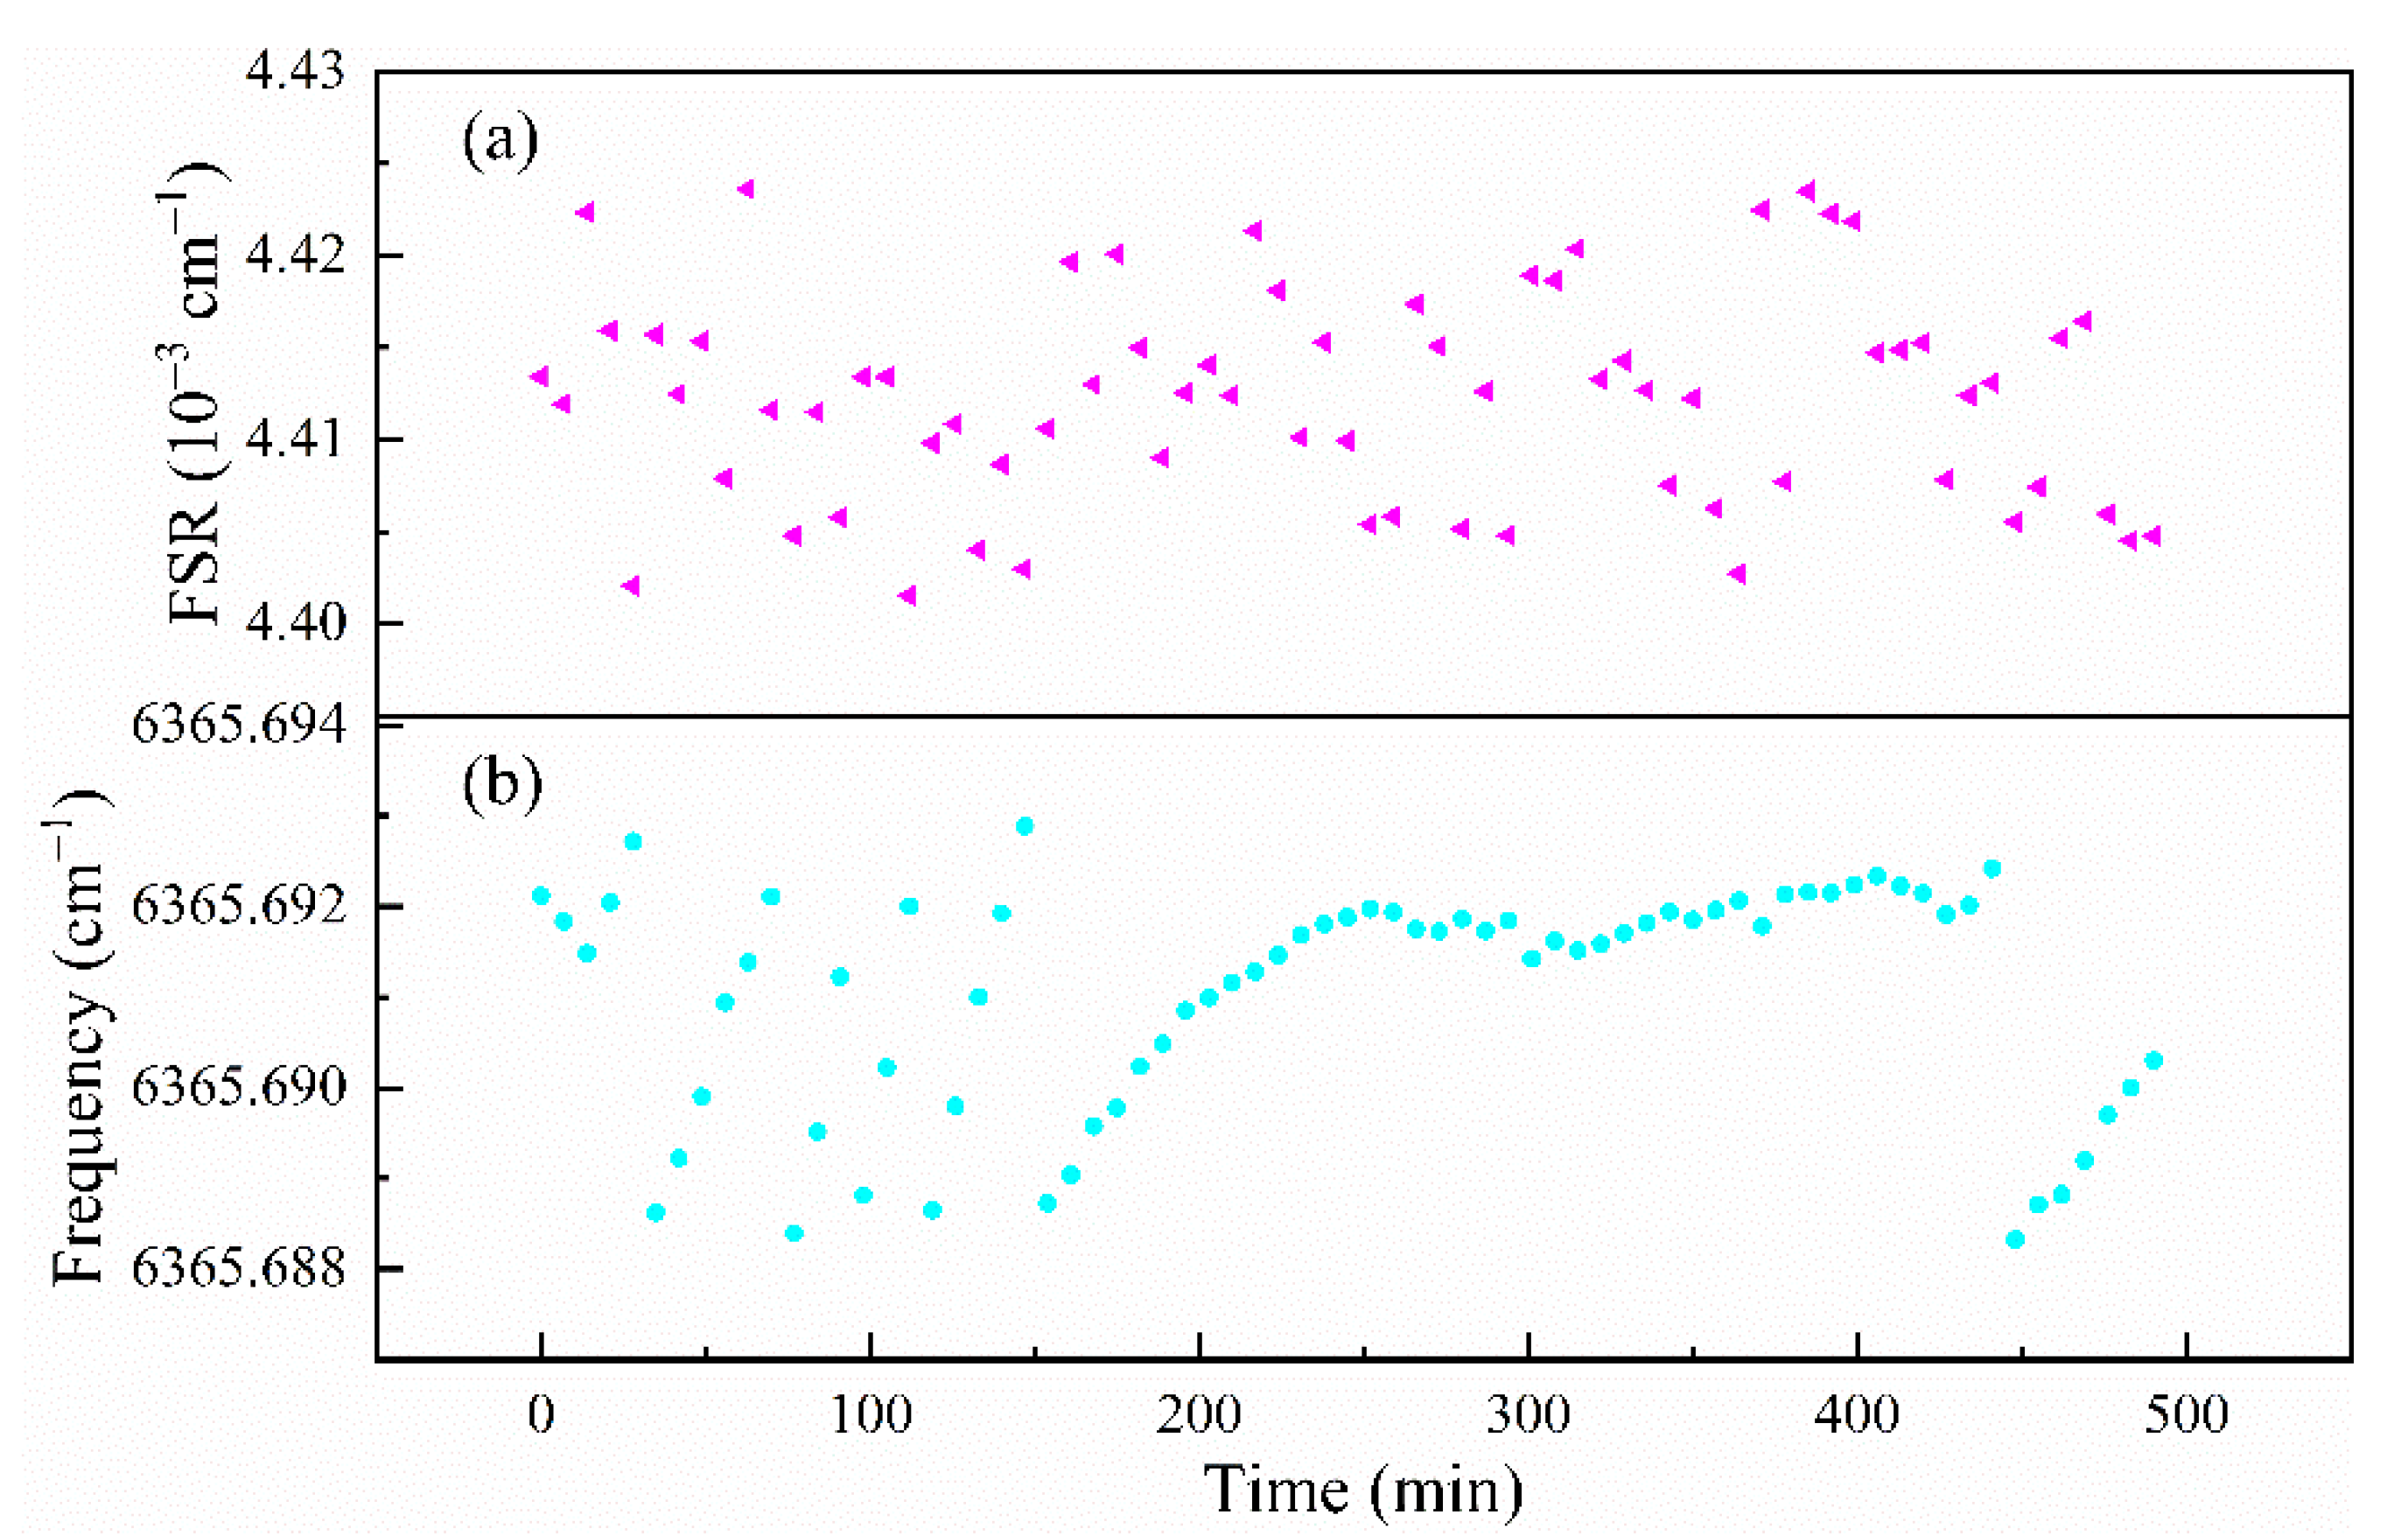
4.1. Measurements of the Cavity’s FSR Serve as a Frequency Scale of Spectral Scans

The FSR value of an optical cavity is related to its optical path length. By directly measuring the cavity length, one can estimate its FSR. For example, a two-mirror cavity of 0.5 m length has an FSR of ~300 MHz. In practice, the error of such estimation is relatively large. A better way of determining the FSR is to simultaneously record a reference spectrum of well-known transition frequencies and the cavity transmission. The frequency interval and the corresponding number of cavity resonances enable the determination of the FSR via a straight-line fitting of Equation (1). By using widely separated spectral features, the accuracy of FSR can be improved further as needed. This process is illustrated in Figure 6. The absorption spectral frequencies of CH4 in the range of 6365.19–6365.81 cm−1 are from the HITRAN2016 database. The choice of this wavelength range is based on the fact that there are multiple absorption peaks in a smaller wavelength range, and it is within the operation range of the diode laser used.
We repeated such measurements many times for 500 min. The FSR values and the slow drift of one cavity resonance frequency (i.e., cavity length) are displayed in Figure 7. The estimated average FSR value was (4.412 ± 0.006) × 10−3 cm−1, and the corresponding cavity length was 113.33 ± 0.15 cm. The good matching between the measurement spectrum and its modeling (see Figure 6) confirms that there are no missing spectral data points in the step-scanned spectrum over the cavity resonances. Figure 7b shows a drift of the cavity length and the associated exact resonance frequencies which varied during the 500 min (~8 h), as they were affected by the variation of room and cavity temperature. Please note that the large step change of about 0.0044 cm−1 (one FSR) is due to a shift in mode assignment to an adjacent longitudinal mode. As each spectrum is recorded within a short time, and only the spacing (FSR) between the spectral data points is relevant, the slow drift of the cavity has no impact on spectral measurements of gas concentrations.

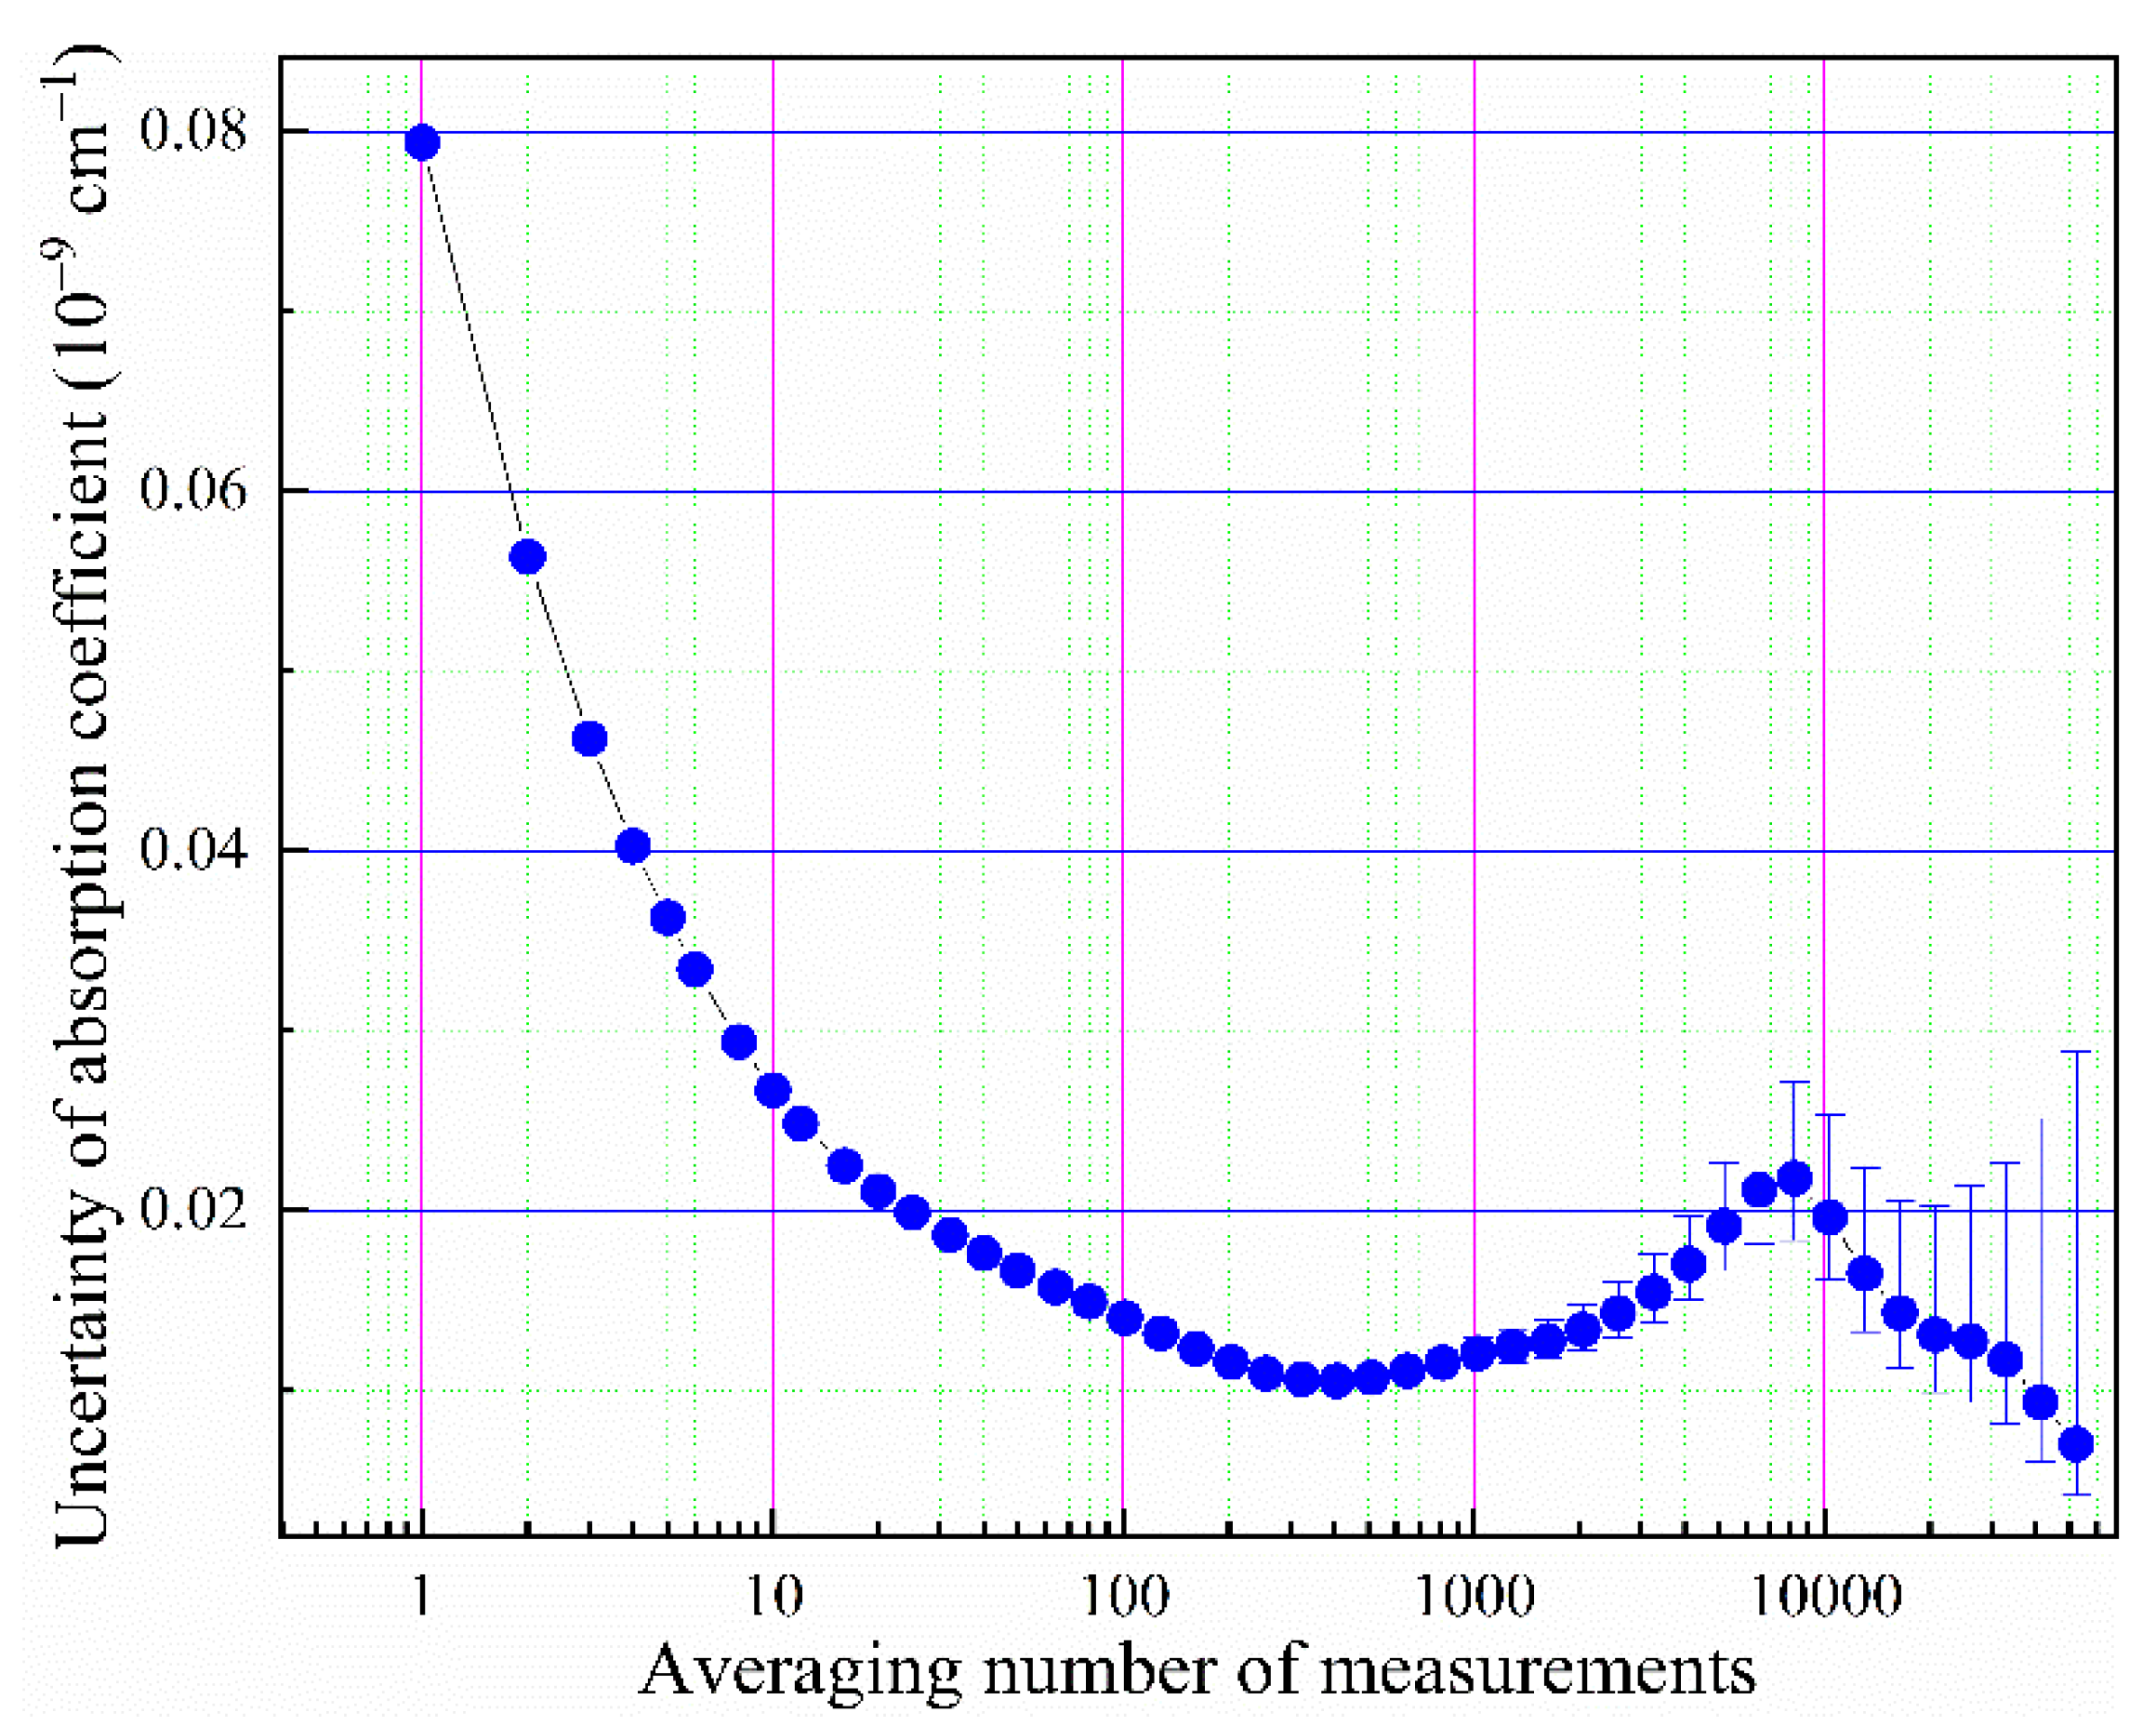
4.2. Instrument Sensitivity

The detection sensitivity, or the minimum detectable absorption coefficient ( α min ), of the system is usually characterized by the noise-equivalent absorption coefficient (NEA), which is the smallest change in the absorption coefficient that can be detected in a unit time [40]. Averaging over time could reduce the detection noise, until the drift in detection becomes dominant [41]. Allan variance analysis is a useful tool for evaluating the long-term stability of the system, its detection limit, and its optimal integration time [42]. We evaluated the system performance by continuous measurements at one resonance frequency of the empty ringdown cavity evacuated by a turbopump. The ringdown time of the empty cavity was about 340 µs. As shown in Figure 8, the Allan variance plot shows that the optimal average number CRDS measurements is 270 times, which corresponds to the integration time of 30 s. The data rate was 9 measurements per second. The NEA of the system is estimated to be 2.8 × 10⁻¹¹ cm−1 Hz−1/2 (at the position of 9 measurements in Figure 8) and α min is 1×10⁻¹¹ cm−1 after reaching the optimal integration time of 30 s (at the position of ~270 measurements in Figure 8).

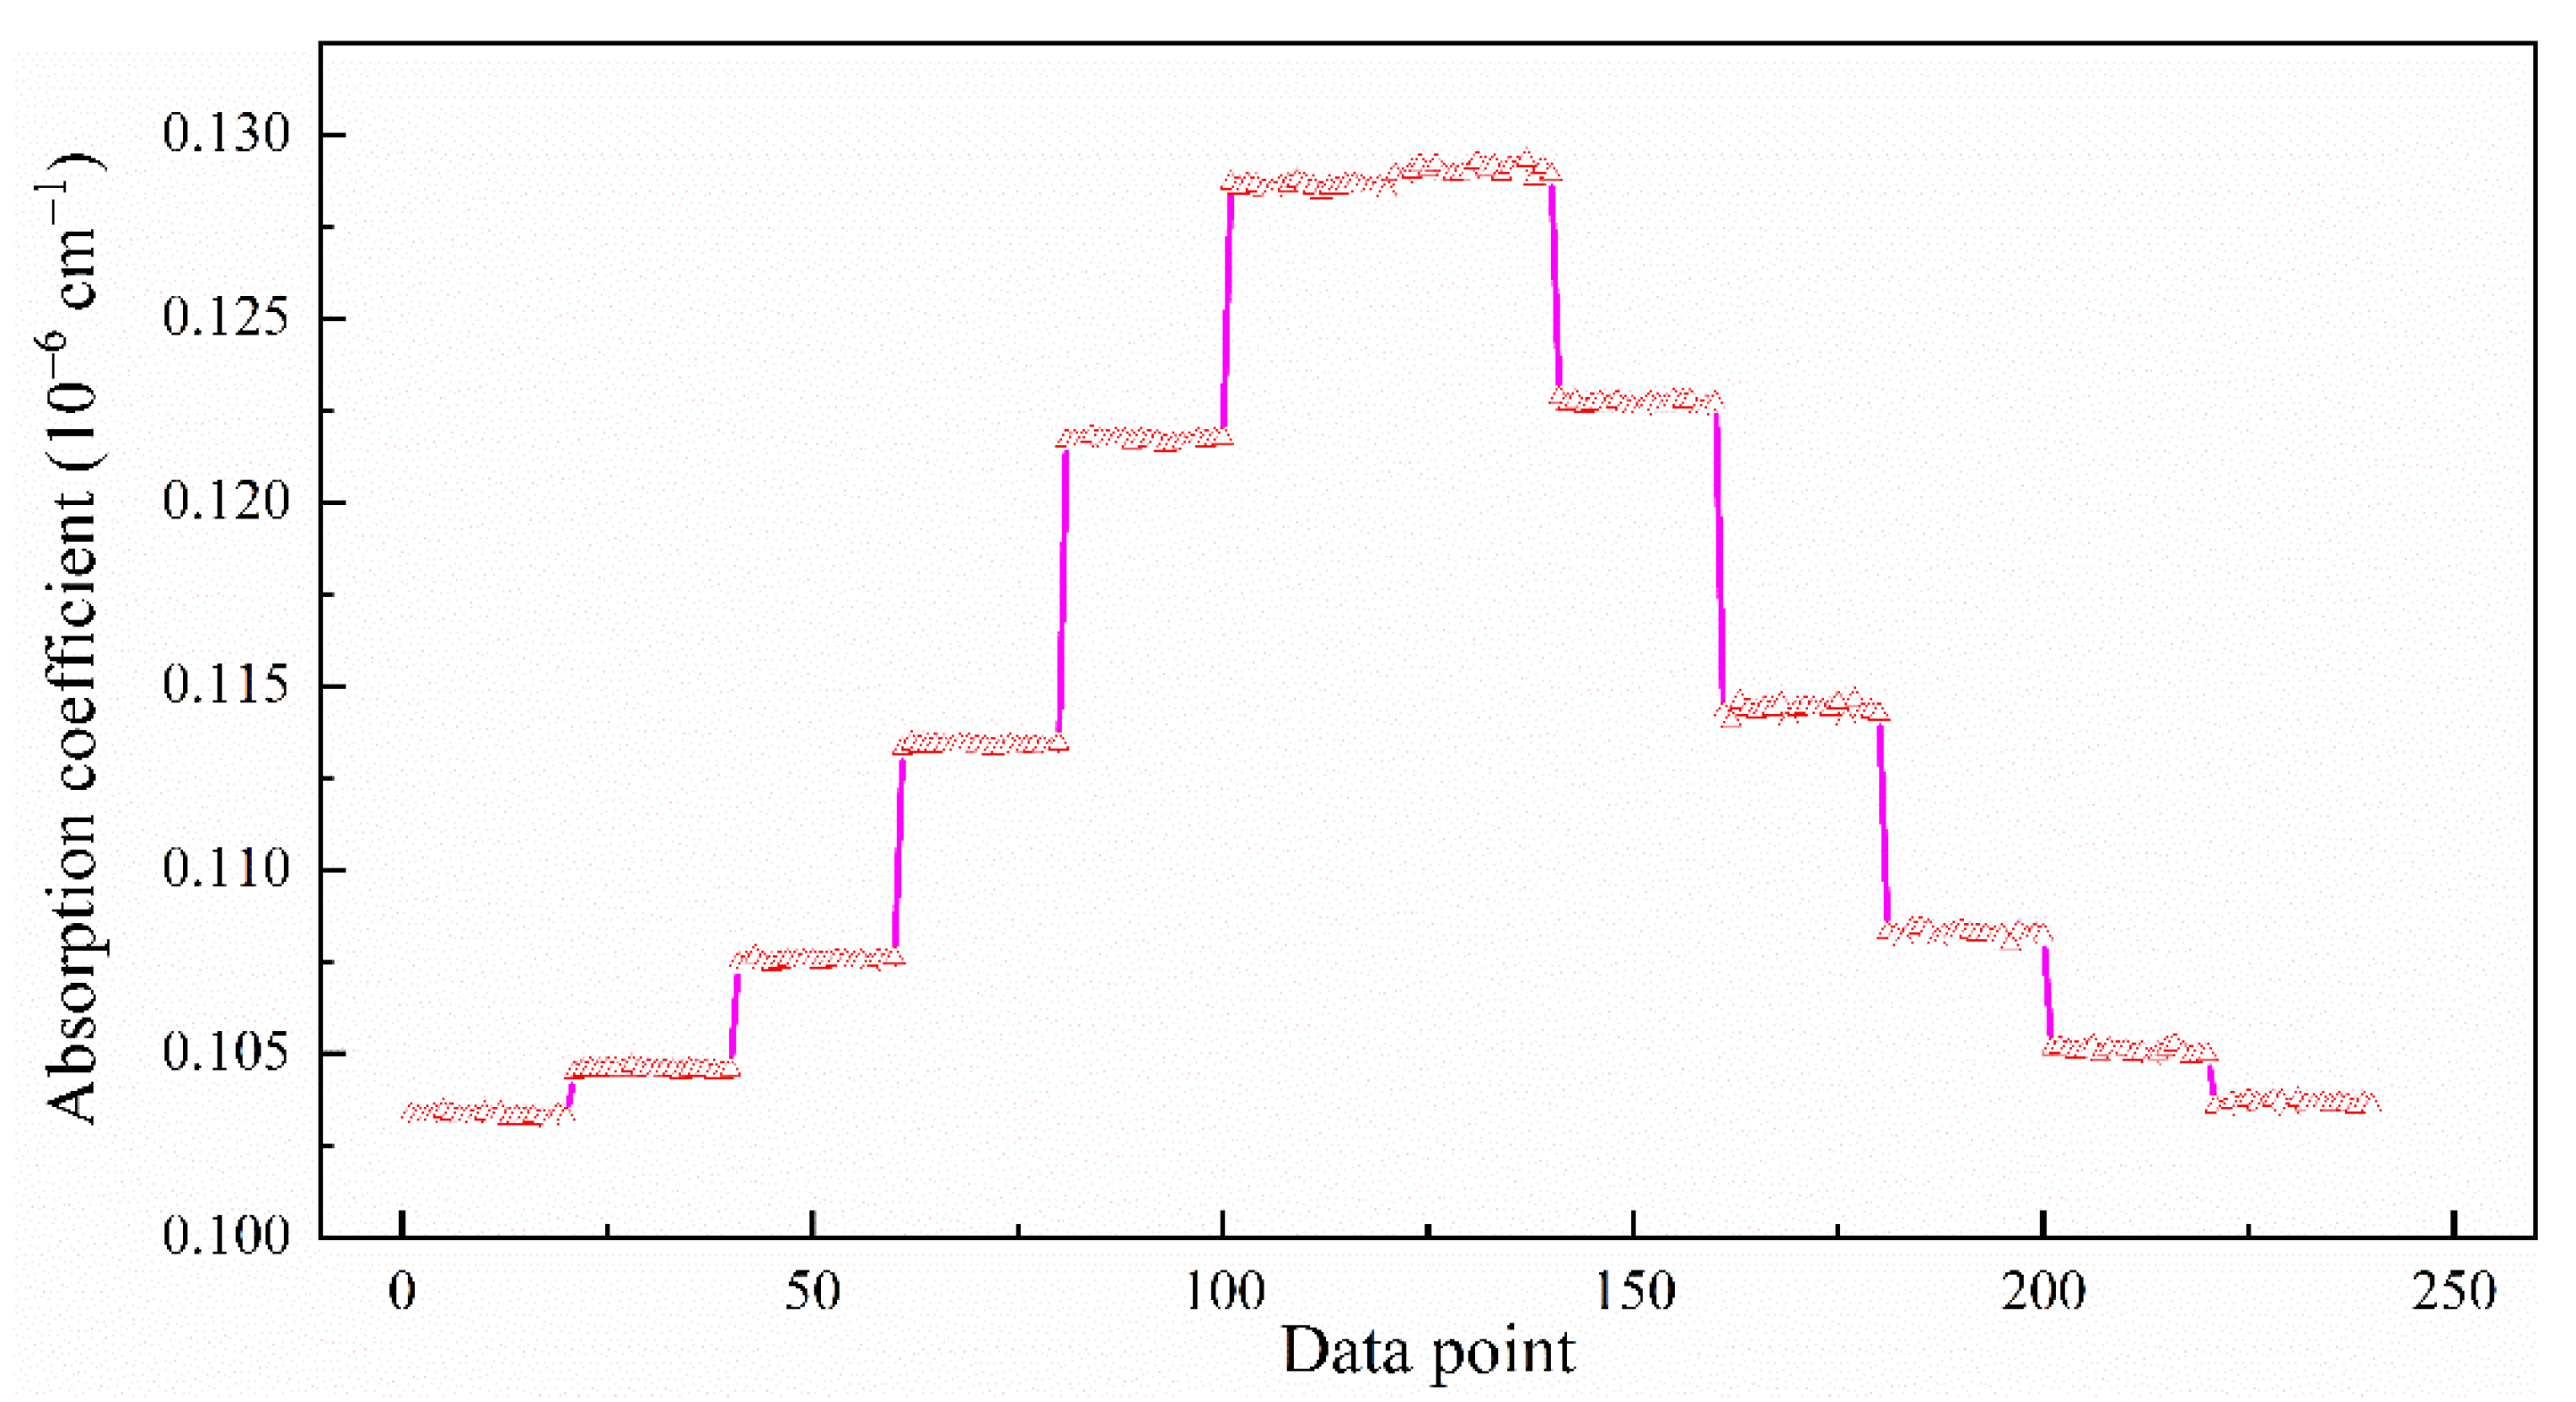
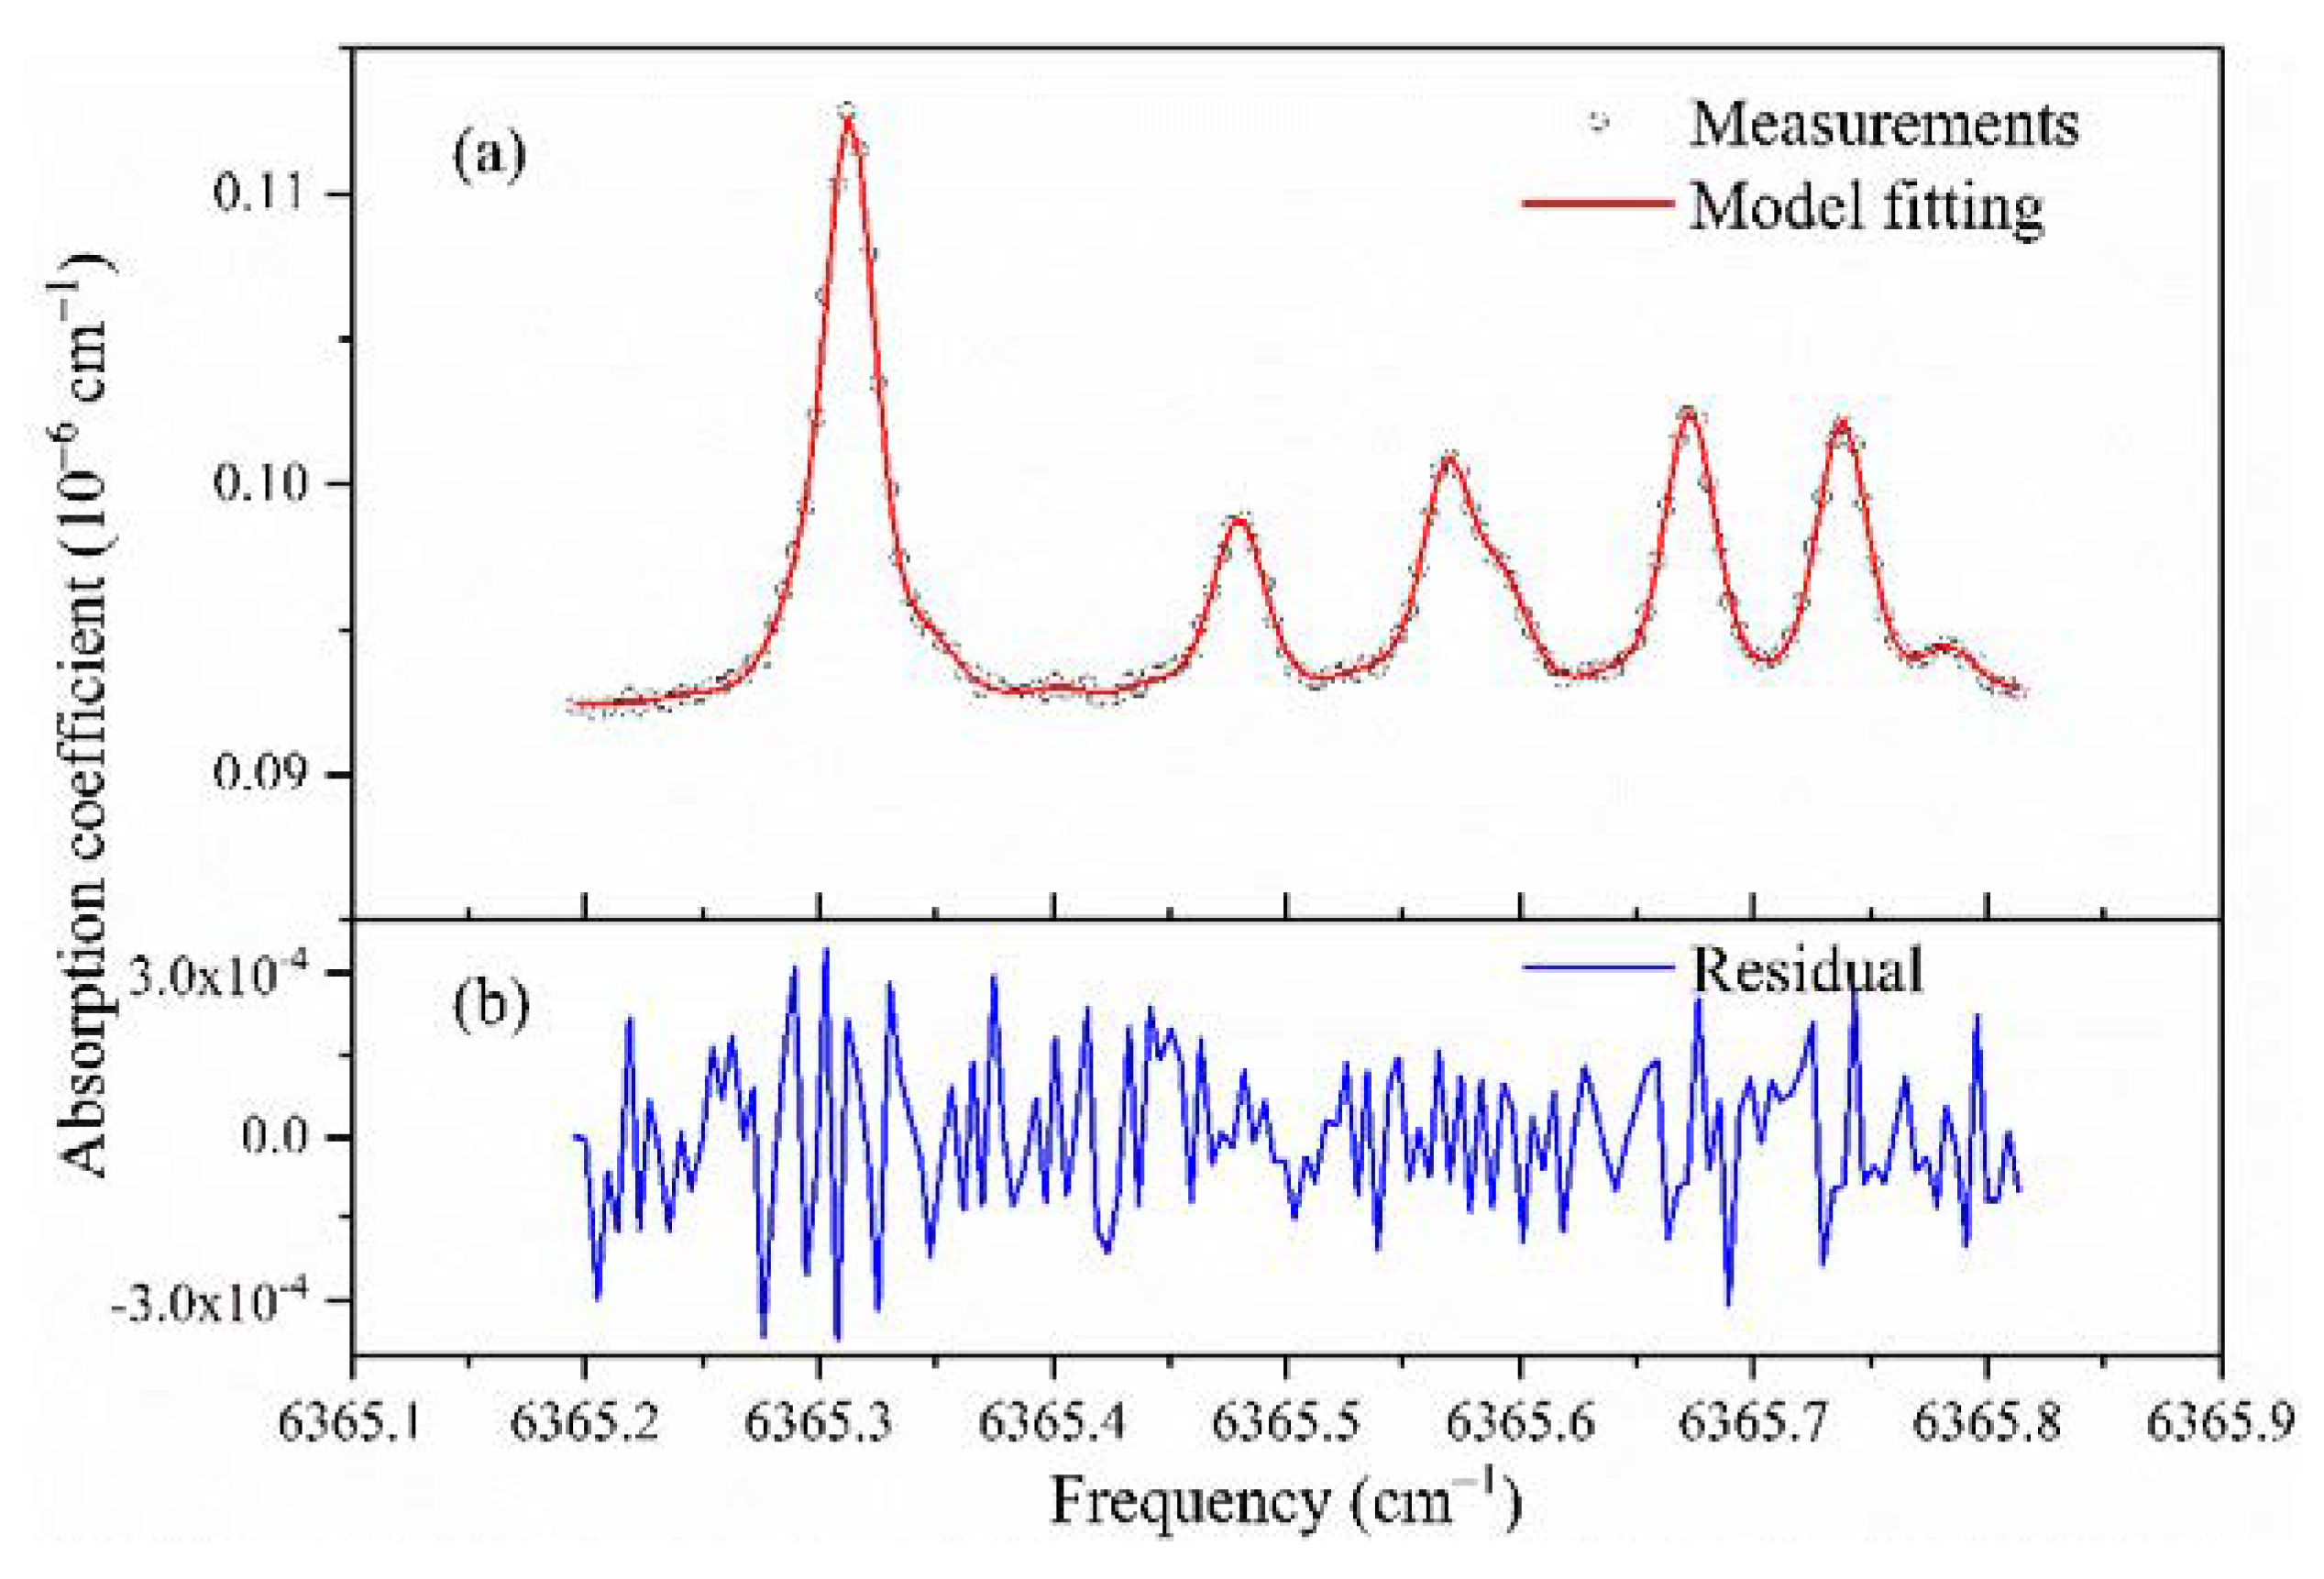
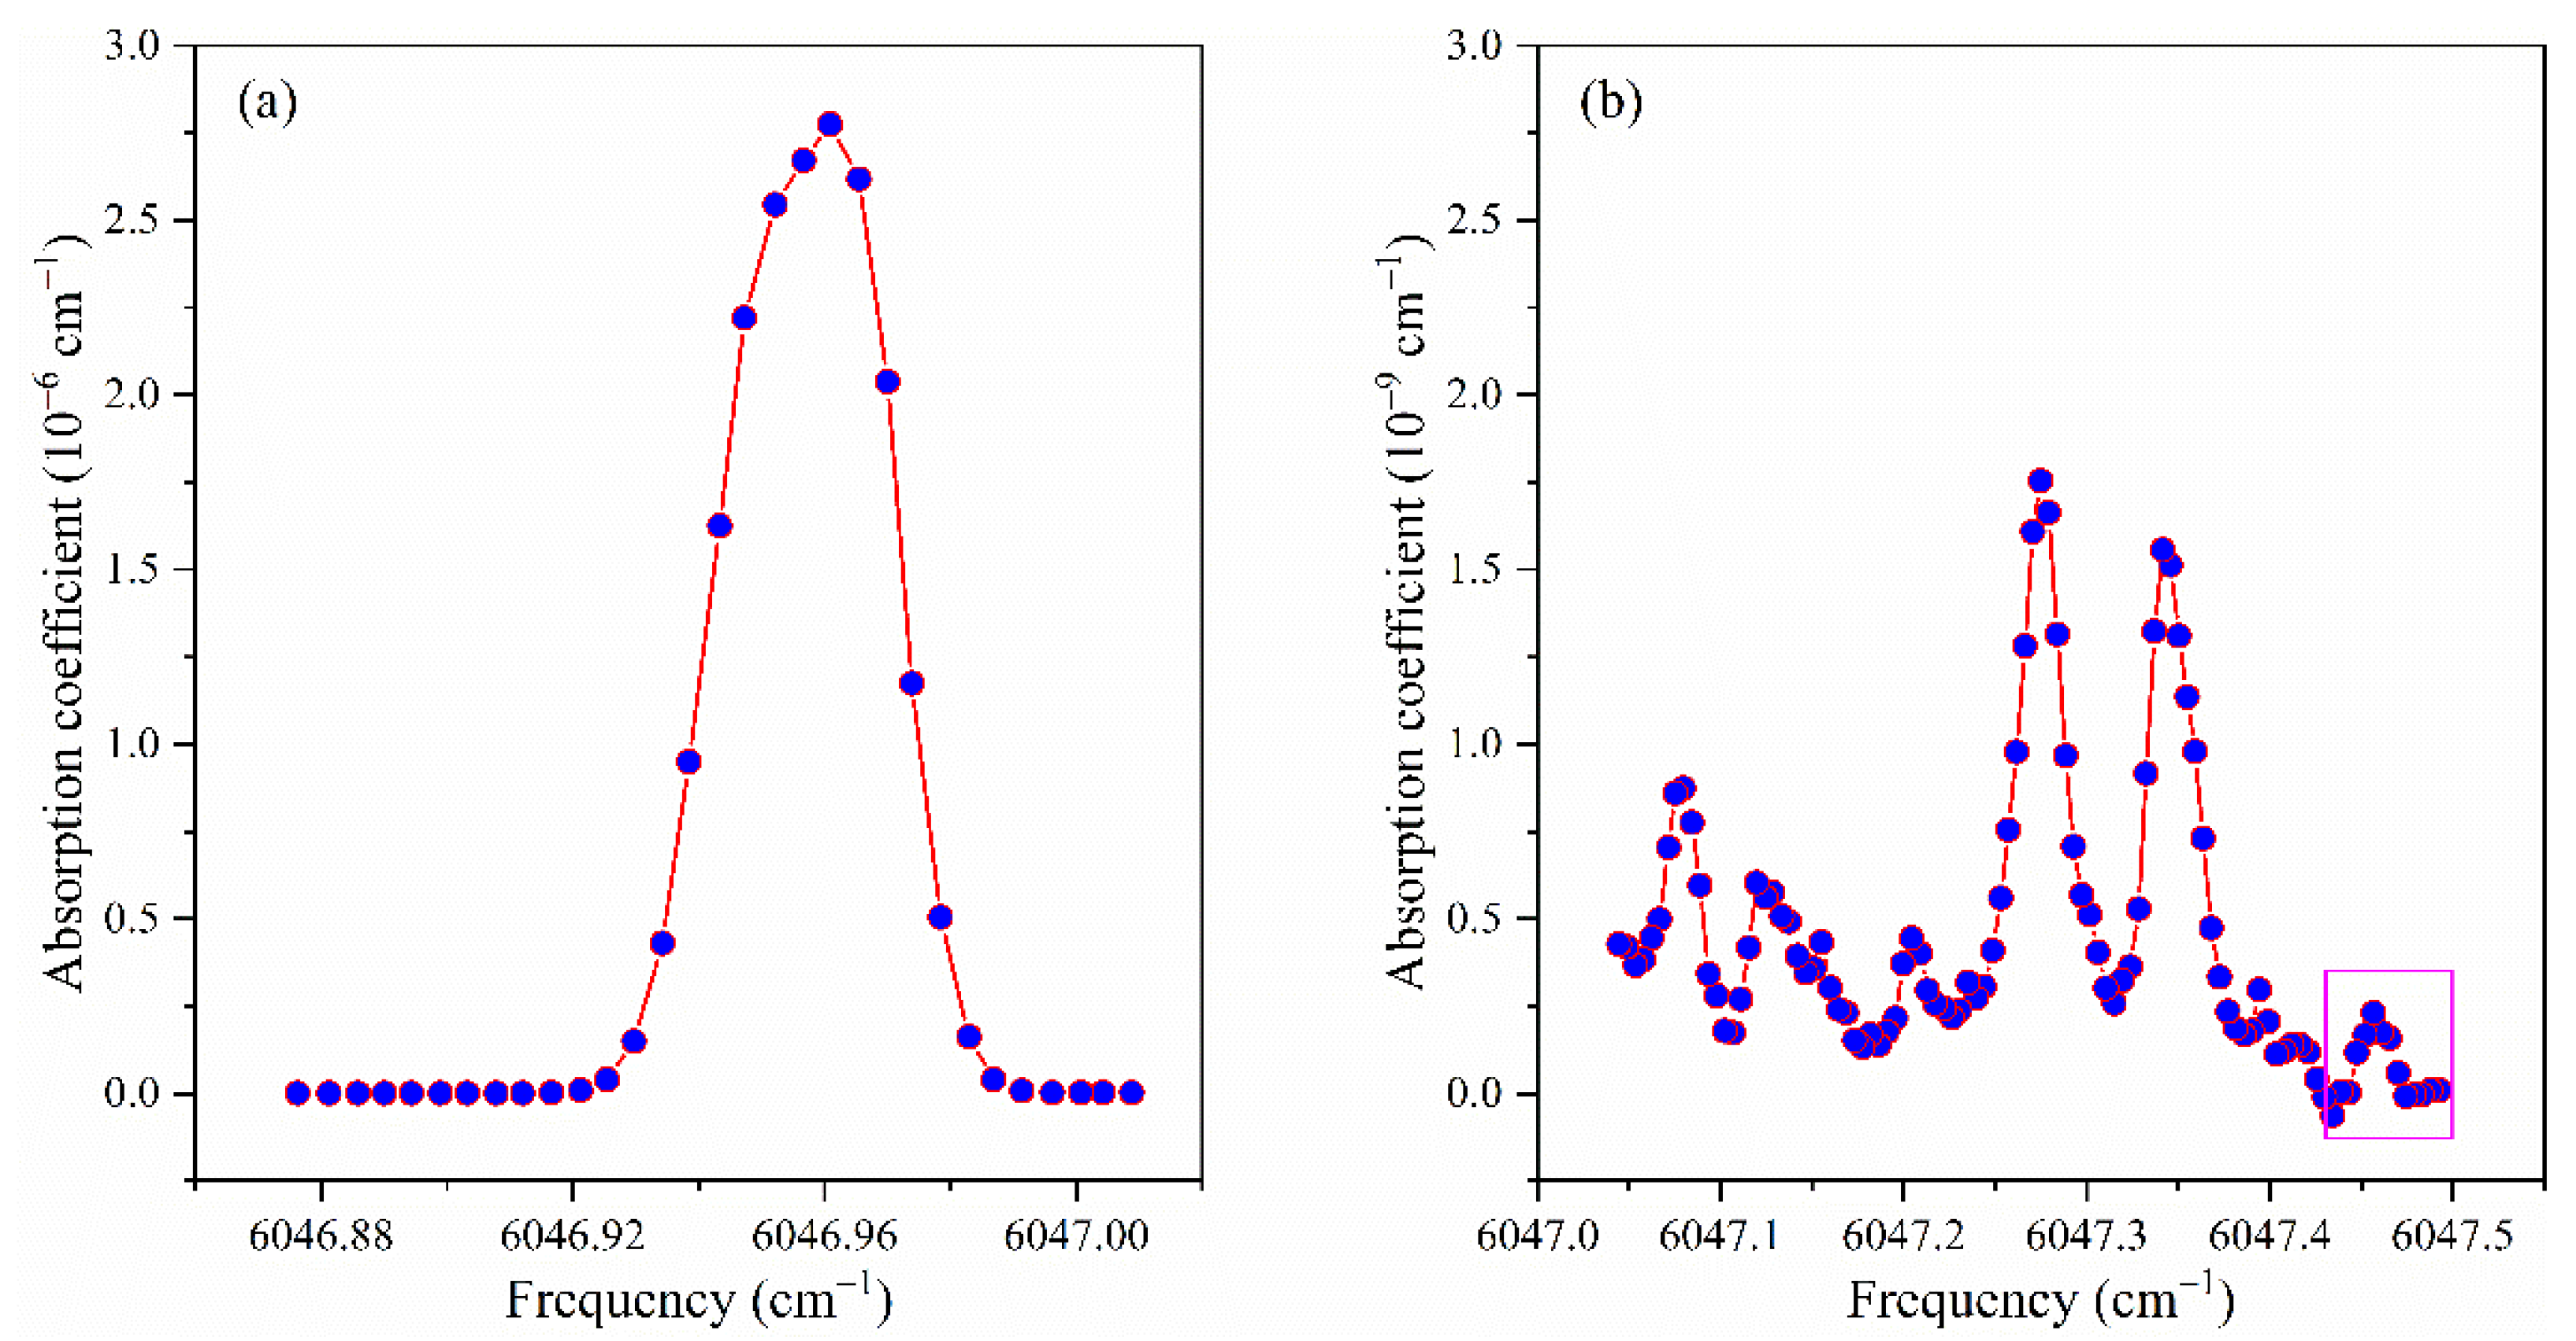
4.3. Large Range of Absorption Measurements

The trace CH4 detection capability of the system is proved by measuring the residual CH4 in the cavity when the cavity is flowed with CH4 gas sample and continuously evacuated to maintain the pressure in the cavity at 0.07 pa. Such a measurement result is shown in Figure 9. The partial pressure of methane in the cavity is estimated to be 4.55 × 10⁻⁵ pa by fitting the measured absorption spectrum of three unresolved CH4 absorption lines. The residual noise level indicates that the detection limit of methane partial pressure is less than 10−6 pa. Figure 10 shows the measured spectrum of methane with an estimated partial pressure of 0.1 pa when the total pressure of CH4 and N2 in the cavity is 1 pa. The small rectangular box in Figure 10b shows that the absorption coefficient corresponding to this absorption line is in the order of 10−10 cm−1. This demonstrates that the instrument is capable of measuring a large range of absorption coefficients from ~10−6 cm−1 to ~10−10 cm−1. By selecting absorption features of different line strengths, the instrument could cover a large concentration range of CH4 measurements.

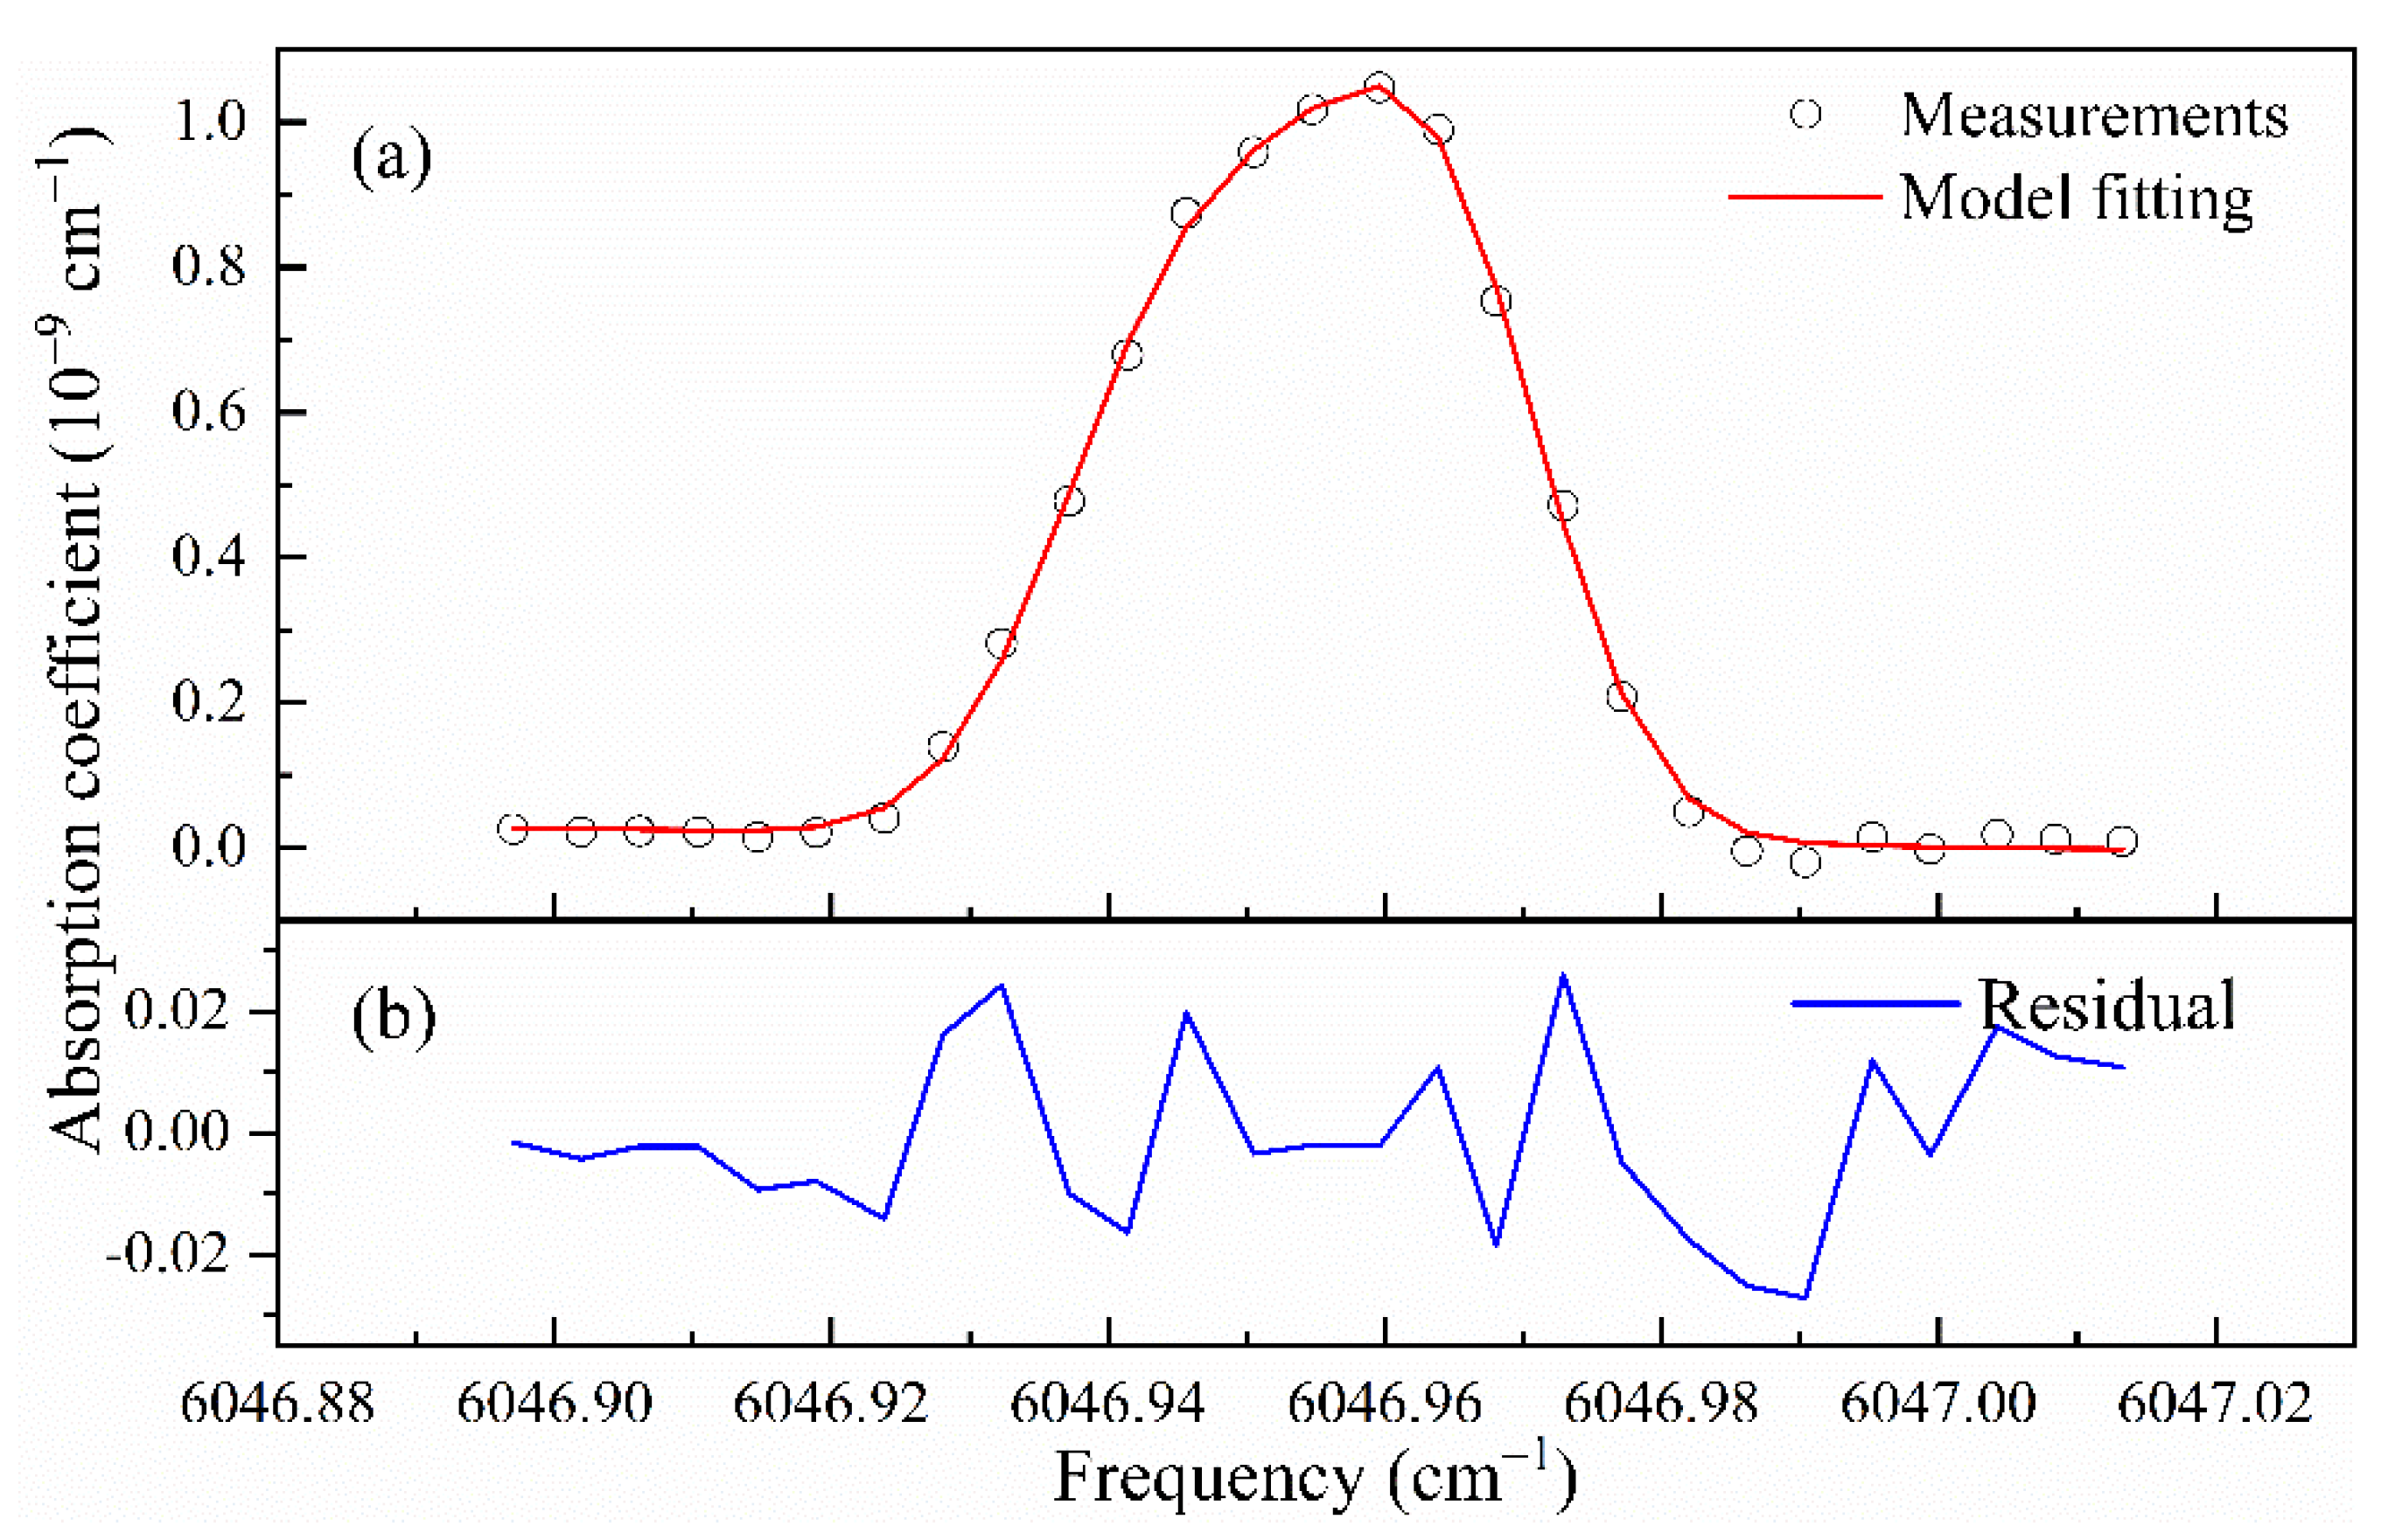
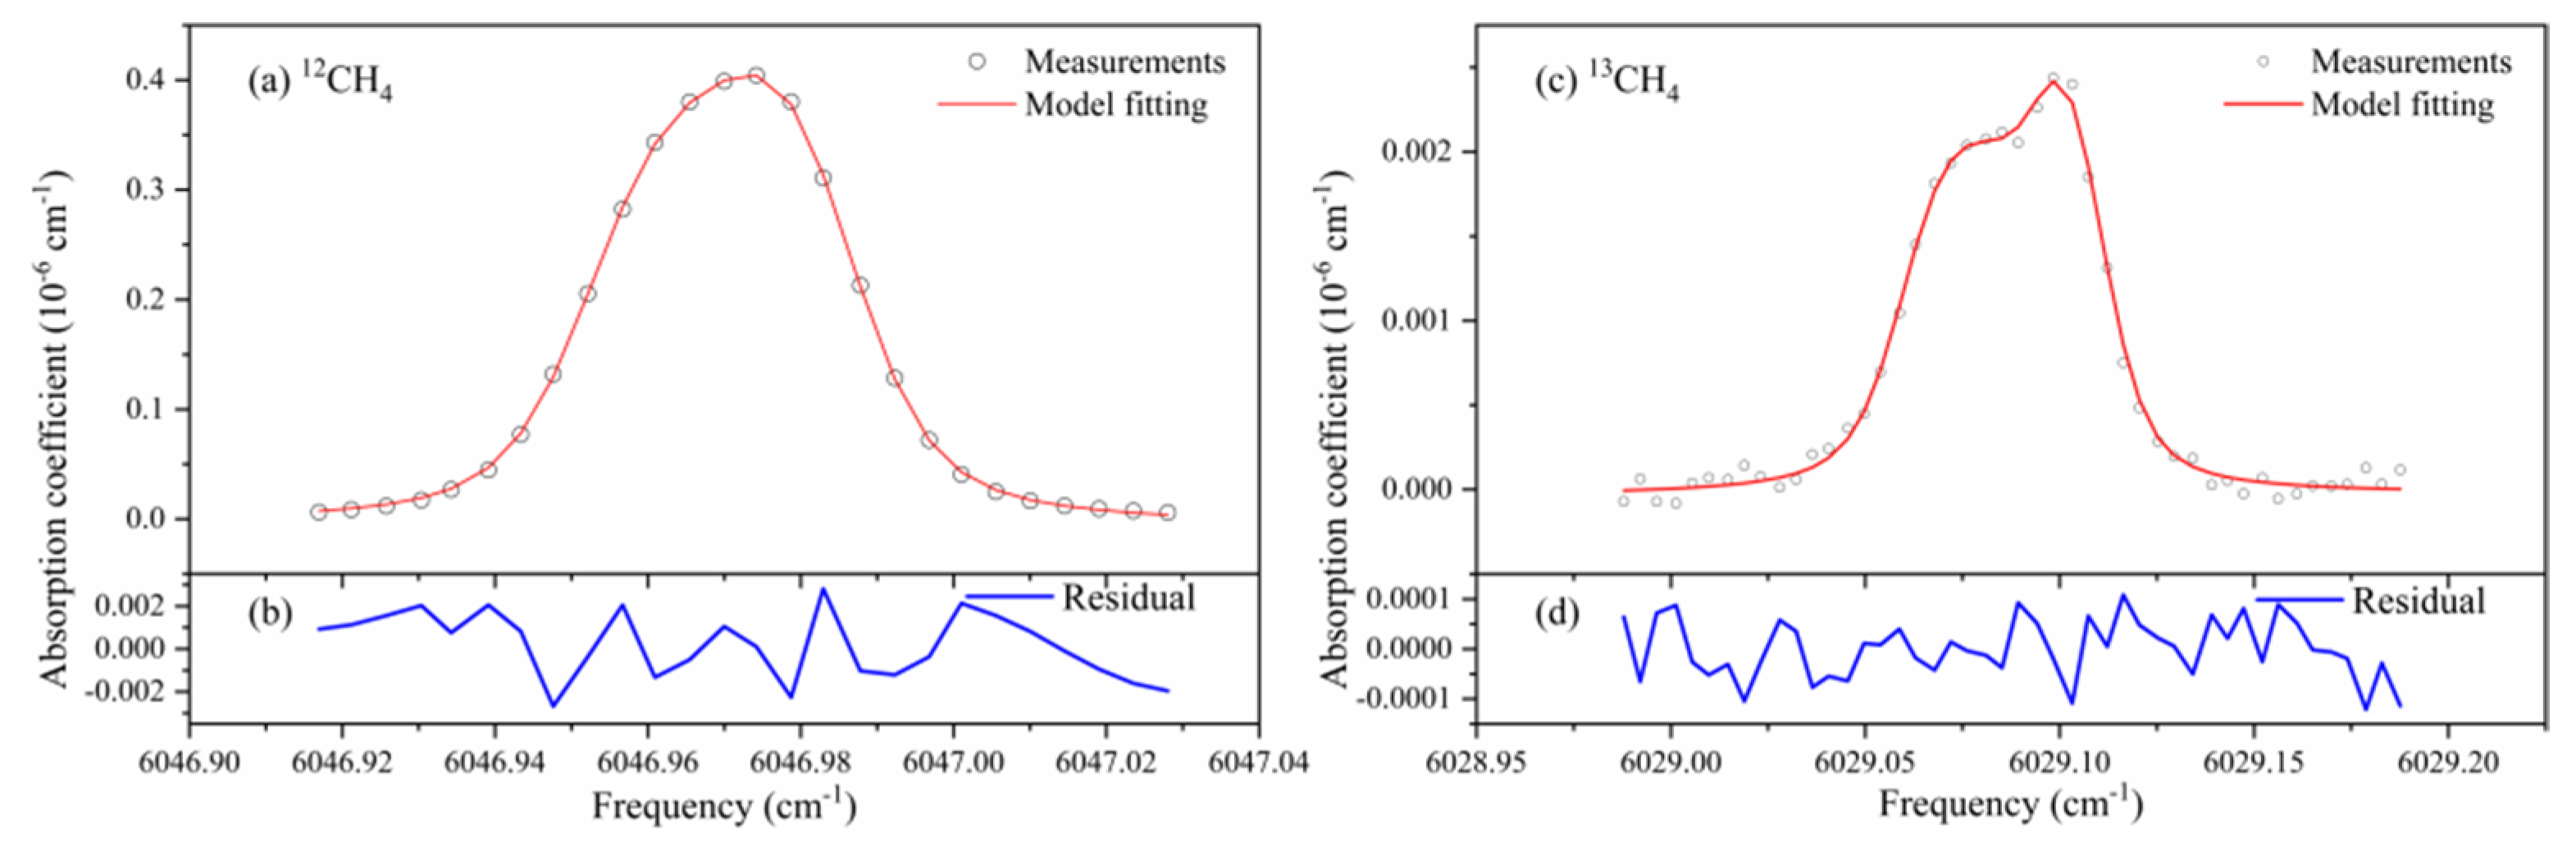
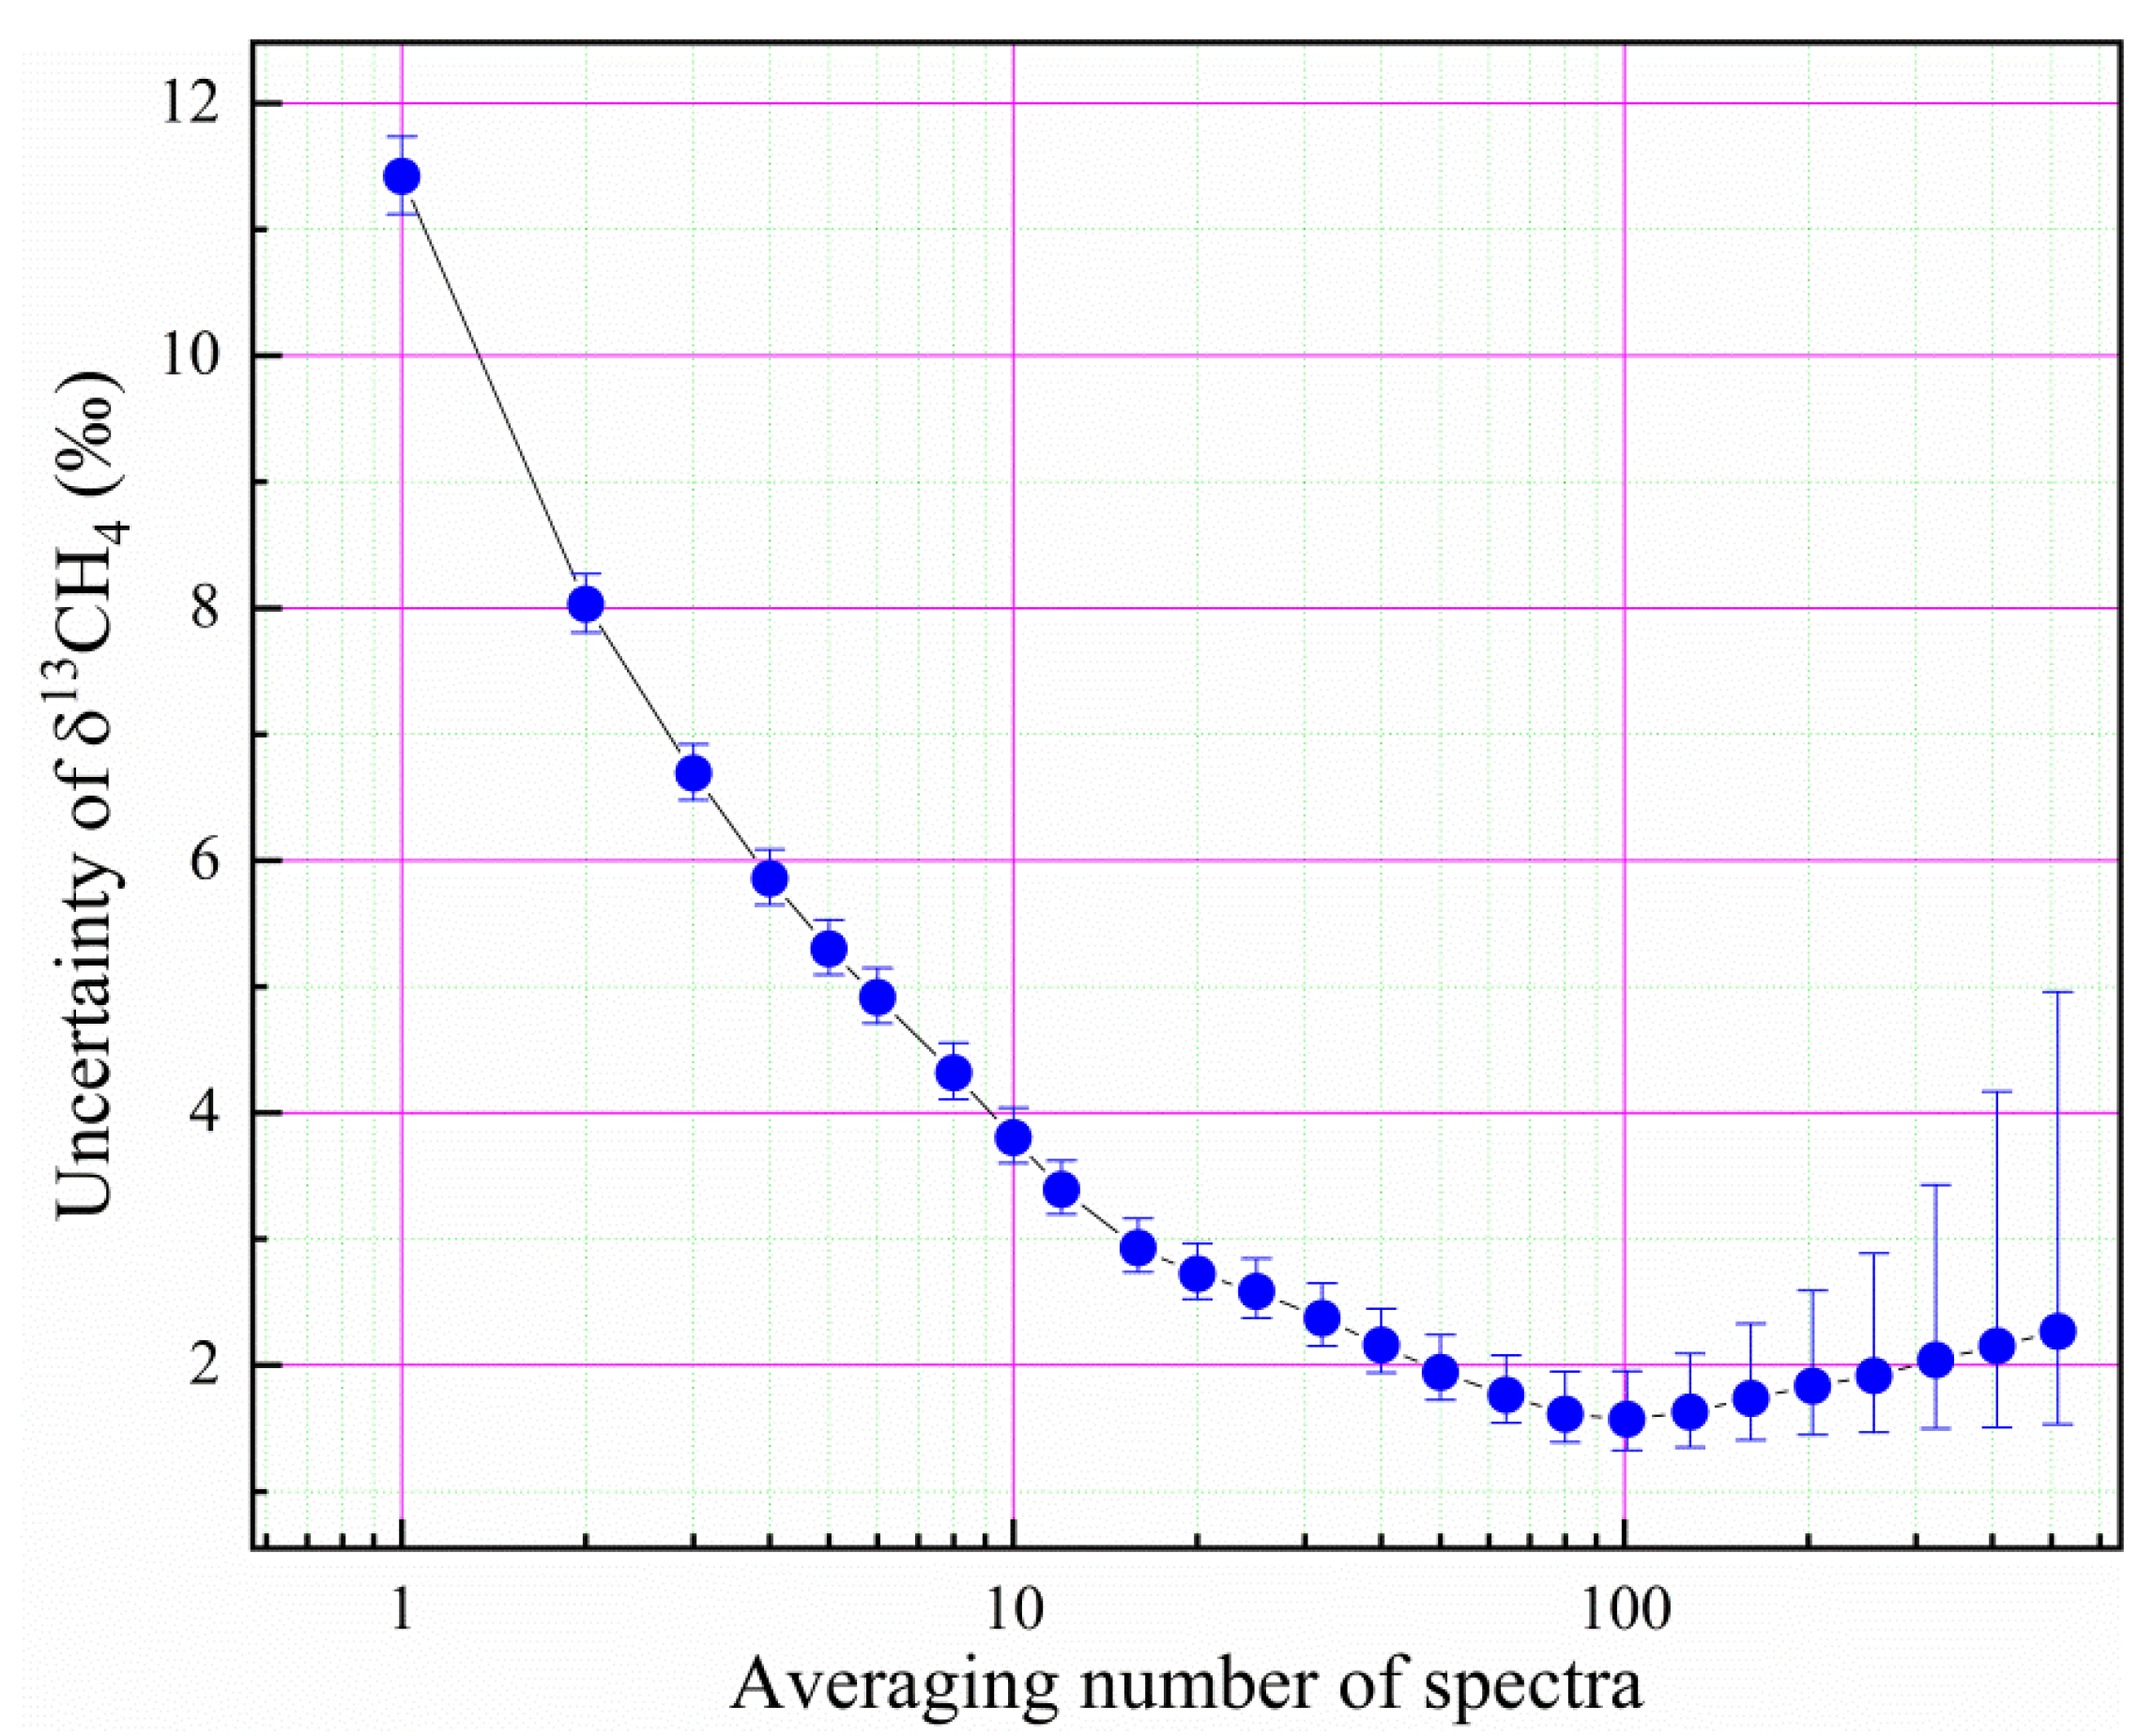
4.4. CH4 Isotope Analysis

The abundance of stable isotopes is usually expressed by the value of the parameter δ , which is defined as the deviation from the value of the international reference standard Vienna Pee Dee Belemnite (VPDB) for carbon isotopes:
δ 13 C = ( ( C H 4 13 / C H 4 12 ) s a m p l e ( C H 4 13 / C H 4 12 ) V P D B 1 ) × 1000   .
The 12CH4 has an absorption feature in the near infrared region around wavelength 1.6537 µm (or frequency 6046.98 cm−1), whereas the isotope 13CH4 has its absorption feature around 1.6586 µm (or frequency 6029.10 cm−1). We have employed two DFB-type diode lasers for their spectral detections, respectively. Figure 11 shows measurement spectra of 12CH4 and 13CH4 in ambient air using the dual-wavelength detection method presented in the previous sections. The pressure in the cavity was controlled at 10,000 pa and the temperature was stabilized at 299 ± 0.01 K. Each data point of the 12CH4 spectrum in Figure 11a was the result of a single ringdown event, and the much weaker 13CH4 spectrum averages 20 ringdown events into one data point in Figure 11b. We repeated such spectral measurements 2000 times and performed an analysis of Allan deviation on δ C H 4 13 values, as shown in Figure 12. The results indicate that the instrument is capable of a precision of 1.3‰ on δ C H 4 13 by averaging the measurement results of 100 spectra. One factor that affects the precision of isotope measurement was a large temperature gradient (0.2 K) in the cavity. This was based on the temperature difference measured between the two ends of the cavity. It is expected to achieve higher accuracy if the temperature uniformity was better.

5. Conclusions

This paper presents a CRDS system that combines a scheme for matching laser wavelengths to optical cavity resonances and dual-laser spectral measurements. A scanning algorithm is applied to step-scan and track the laser wavelength to the optical cavity resonance. In order to avoid the mutual interference of ringdown signals between the two lasers, we operated the laser coupling to the cavity in a time-multiplex fashion. The highly reflective cavity mirrors helped to block off non-resonant lasers. We determined the free spectra range (FSR) of the fixed-length cavity by counting the steps of a step-scanned CH4 spectrum with known spectral line positions in the region of 6365.19–6365.81 cm−1. The FSR interval serves as a frequency scale of measurement spectra. The α min and NEA of the system are 1 × 10⁻¹¹ cm−1 and 2.8 × 10⁻¹¹ cm−1 Hz−1/2, respectively. By selecting absorption features of different strengths, measurements can detect a wide range of methane concentrations. The dual-laser measurements (1654 nm and 1658 nm) achieved a high-precision determination of atmospheric δ C H 4 13 (1.3‰). This optical instrument will be useful for future environmental monitoring applications and can be extended for other gas species by using additional lasers operating at different wavelengths. A recent innovative development exploited quartz tuning forks (QTFs) as a photodetector based on a light-induced thermo-elastic effect [43]. It offers advantages of high sensitivity and no wavelength limitation for future optical measuring systems, as reported for an ultra-high sensitive detection of carbon monoxide using a mid-infrared quantum cascade laser [44].

Author Contributions

Conceptualization, G.M. and B.C.; Methodology, G.M. and B.C.; Project management, R.K.; Software, G.M., X.W. and H.D.; Validation, B.C. and R.K.; Formal Analysis, Z.Z. and Y.L.; Writing-Initial Draft Preparation, G.M.; Writing-Revising, Y.H. and G.M. All authors have read and agreed to the published version of the manuscript.

Funding

This research was funded by the National Program on Key Research and Development Project of China under Grant ZDKYYQ20200006, the National Natural Science Foundation of China under Grant 41901081.

Institutional Review Board Statement

Not applicable.

Informed Consent Statement

Not applicable.

Conflicts of Interest

The authors declare no conflict of interest.

References

  1. Yung, Y.L.; Chen, P.; Nealson, K.; Atreya, S.; Beckett, P.; Blank, J.G.; Ehlmann, B.; Eiler, J.; Etiope, G.; Ferry, J.G.; et al. Methane on Mars and habitability: Challenges and responses. Astrobiology 2018, 18, 1221–1242. [Google Scholar] [CrossRef] [PubMed]
  2. Wuebbles, D.J.; Hayhoe, K. Atmospheric methane and global change. Earth-Sci. Rev. 2002, 57, 177–210. [Google Scholar] [CrossRef]
  3. MacDonald, G.J. The future of methane as an energy resource. Annu. Rev. Energy 1990, 15, 53–83. [Google Scholar] [CrossRef]
  4. Ferry, J.G. Enzymology of one-carbon metabolism in methanogenic pathways. FEMS Microbiol. Rev. 1999, 23, 13–38. [Google Scholar] [CrossRef]
  5. Stolper, D.A.; Martini, A.M.; Clog, M.; Douglas, P.M.; Shusta, S.S.; Valentine, D.L.; Sessions, A.L.; Eiler, J.M. Distinguishing and understanding thermogenic and biogenic sources of methane using multiply substituted isotopologues. Geochim. Et Cosmochim. Acta 2015, 161, 219–247. [Google Scholar] [CrossRef] [Green Version]
  6. Yarnes, C. δ13C and δ2H measurement of methane from ecological and geological sources by gas chromatography/ combustion/ pyrolysis isotope-ratio mass spectrometry. Rapid Commun. Mass Spectrom. 2013, 27, 1036–1044. [Google Scholar] [CrossRef]
  7. Brass, M.; Röckmann, T. Continuous-flow isotope ratio mass spectrometry method for carbon and hydrogen isotope measurements on atmospheric methane. Atmos. Meas. Tech. 2010, 3, 1707–1721. [Google Scholar] [CrossRef] [Green Version]
  8. Sigrist, M.W.; Bartlome, R.; Marinov, D.; Rey, J.M.; Vogler, D.E.; Wächter, H. Trace gas monitoring with infrared laser-based detection schemes. Appl. Phys. B 2008, 90, 289–300. [Google Scholar] [CrossRef]
  9. Dong, L.; Tittel, F.K.; Li, C.; Sanchez, N.P.; Wu, H.; Zheng, C.; Yu, Y.; Sampaolo, A.; Griffin, R.J. Compact TDLAS based sensor design using interband cascade lasers for mid-IR trace gas sensing. Opt. Express 2016, 24, A528–A535. [Google Scholar] [CrossRef]
  10. He, Y.; Orr, B.J. Ringdown and cavity-enhanced absorption spectroscopy using a continuous-wave tunable diode laser and a rapidly swept optical cavity. Chem. Phys. Lett. 2000, 319, 131–137. [Google Scholar] [CrossRef]
  11. Orr, B.J.; He, Y. Rapidly swept continuous-wave cavity-ringdown spectroscopy. Chem. Phys. Lett. 2011, 512, 1–20. [Google Scholar] [CrossRef]
  12. Bergamaschi, P.; Schupp, M.; Harris, G.W. High-precision direct measurements of 13CH4/12CH4 and 12CH3D/12CH4 ratios in atmospheric methane sources by means of a long-path tunable diode laser absorption spectrometer. Appl. Opt. 1994, 33, 7704–7716. [Google Scholar] [CrossRef] [Green Version]
  13. Durry, G.; Li, J.S.; Vinogradov, I.; Titov, A.; Joly, L.; Cousin, J.; Decarpenterie, T.; Amarouche, N.; Liu, X.; Parvitte, B.; et al. Near infrared diode laser spectroscopy of C2H2, H2O, CO2 and their isotopologues and the application to TDLAS, a tunable diode laser spectrometer for the martian PHOBOS-GRUNT space mission. Appl. Phys. B 2010, 99, 339–351. [Google Scholar] [CrossRef]
  14. Deng, H.; Yang, C.; Wang, W.; Shan, C.; Xu, Z.; Chen, B.; Yao, L.; Hu, M.; Kan, R.; He, Y. Near infrared heterodyne radiometer for continuous measurements of atmospheric CO2 column concentration. Infrared Phys. Technol. 2019, 101, 39–44. [Google Scholar] [CrossRef]
  15. Li, X.; Yuan, F.; Hu, M.; Chen, B.; He, Y.; Yang, C.; Shi, L.; Kan, R. Compact open-path sensor for fast measurements of CO2 and H2O using scanned-wavelength modulation spectroscopy with 1f-phase method. Sensors 2020, 20, 1910. [Google Scholar] [CrossRef] [Green Version]
  16. Berden, G.; Richard, E. (Eds.) Cavity Ring-Down Spectroscopy: Techniques and Applications; John Wiley & Sons: Hoboken, NJ, USA, 2009. [Google Scholar]
  17. Chen, H.; Winderlich, J.; Gerbig, C.; Hoefer, A.; Rella, C.W.; Crosson, E.R.; Van Pelt, A.D.; Steinbach, J.; Kolle, O.; Beck, V.; et al. High-accuracy continuous airborne measurements of greenhouse gases (CO2 and CH4) using the cavity ring-down spectroscopy (CRDS) technique. Atmos. Meas. Tech. 2010, 3, 375–386. [Google Scholar] [CrossRef] [Green Version]
  18. Yuan, F.; Hu, M.; He, Y.; Chen, B.; Yao, L.; Xu, Z.; Kan, R. Development of an in situ analysis system for methane dissolved in seawater based on cavity ringdown spectroscopy. Rev. Sci. Instrum. 2020, 91, 083106. [Google Scholar] [CrossRef] [PubMed]
  19. Yver Kwok, C.; Laurent, O.; Guemri, A.; Philippon, C.; Wastine, B.; Rella, C.W.; Vuillemin, C.; Truong, F.; Delmotte, M.; Kazan, V.; et al. Comprehensive laboratory and field testing of cavity ring-down spectroscopy analyzers measuring H2O, CO2, CH4 and CO. Atmos. Meas. Tech. 2015, 8, 3867–3892. [Google Scholar] [CrossRef] [Green Version]
  20. Butler, T.J.A.; Miller, J.L.; Orr-Ewing, A.J. Cavity ring-down spectroscopy measurements of single aerosol particle extinction. I. The effect of position of a particle within the laser beam on extinction. J. Chem. Phys. 2007, 126, 174302. [Google Scholar] [CrossRef] [PubMed]
  21. Butler, T.J.A.; Mellon, D.; Kim, J.; Litman, J.; Orr-Ewing Andrew, J. Optical-feedback cavity ring-down spectroscopy measurements of extinction by aerosol particles. J. Phys. Chem. A 2009, 113, 3963–3972. [Google Scholar] [CrossRef]
  22. Guo, R.; Teng, J.; Cao, K.; Dong, H.; Cui, W.; Zhang, T. Comb-assisted, Pound-Drever-Hall locked cavity ring-down spectrometer for high-performance retrieval of transition parameters. Opt. Express 2019, 27, 31850–31863. [Google Scholar] [CrossRef]
  23. Long, D.A.; Wojtewicz, S.; Miller, C.E.; Hodges, J.T. Frequency-agile, rapid scanning cavity ring-down spectroscopy (FARS-CRDS) measurements of the (30012)←(00001) near-infrared carbon dioxide band. J. Quant. Spectrosc. Radiat. Transf. 2015, 161, 35–40. [Google Scholar] [CrossRef]
  24. Leshchishina, O.; Kassi, S.; Gordon, I.E.; Rothman, L.S.; Wang, L.; Campargue, A. High sensitivity CRDS of the a1Δg− X3Σg− band of oxygen near 1.27 μm: Extended observations, quadrupole transitions, hot bands and minor isotopologues. J. Quant. Spectrosc. Radiat. Transf. 2010, 111, 2236–2245. [Google Scholar] [CrossRef] [Green Version]
  25. Crosson, E.R.; Ricci, K.N.; Richman, B.A.; Chilese, F.C.; Owano, T.G.; Provencal, R.A.; Todd, M.W.; Glasser, J.; Kachanov, A.A.; Paldus, B.A.; et al. Stable isotope ratios using cavity ring-down spectroscopy: Determination of 13C/12C for carbon dioxide in human breath. Anal. Chem. 2002, 74, 2003–2007. [Google Scholar] [CrossRef]
  26. Sahay, P.; Scherrer, S.T.; Wang, C. Measurements of the weak UV absorptions of isoprene and acetone at 261–275 nm using cavity ringdown spectroscopy for evaluation of a potential portable ringdown breath analyzer. Sensors 2013, 13, 8170–8187. [Google Scholar] [CrossRef] [PubMed] [Green Version]
  27. Fritsch, T.; Hering, P.; Mürtz, M. Infrared laser spectroscopy for online recording of exhaled carbon monoxide—A progress report. J. Breath Res. 2007, 1, 014002. [Google Scholar] [CrossRef]
  28. Dahnke, H.; Kleine, D.; Urban, W.; Hering, P.; Mürtz, M. Isotopic ratio measurement of methane in ambient air using mid-infrared cavity leak-out spectroscopy. Appl. Phys. B 2001, 72, 121–125. [Google Scholar] [CrossRef]
  29. Maity, A.; Pal, M.; Banik, G.D.; Maithani, S.; Pradhan, M. Cavity ring-down spectroscopy using an EC-QCL operating at 7.5 µm for direct monitoring of methane isotopes in air. Laser Phys. Lett. 2017, 14, 115701. [Google Scholar] [CrossRef]
  30. Chen, Y.; Lehmann, K.K.; Kessler, J.; Sherwood Lollar, B.; Lacrampe Couloume, G.; Onstott, T.C. Measurement of the 13C/12C of atmospheric CH4 using near-infrared (NIR) cavity ring-down spectroscopy. Anal. Chem. 2013, 85, 11250–11257. [Google Scholar] [CrossRef]
  31. Rella, C.W.; Hoffnagle, J.; He, Y.; Tajima, S. Local-and regional-scale measurements of CH4, δ13CH4, and C2H6 in the Uintah Basin using a mobile stable isotope analyzer. Atmos. Meas. Tech. 2015, 8, 4539–4559. [Google Scholar] [CrossRef] [Green Version]
  32. Maher, D.T.; Santos, I.R.; Leuven, J.R.F.W.; Oakes, J.M.; Erler, D.V.; Carvalho, M.C.; Eyre, B.D. Novel use of cavity ring-down spectroscopy to investigate aquatic carbon cycling from microbial to ecosystem scales. Environ. Sci. Technol. 2013, 47, 12938–12945. [Google Scholar] [CrossRef]
  33. Schulz, K.J.; Simpson, W.R. Frequency-matched cavity ring-down spectroscopy. Chem. Phys. Lett. 1998, 297, 523–529. [Google Scholar] [CrossRef]
  34. He, Y.; Orr, B.J. Rapidly swept, continuous-wave cavity ringdown spectroscopy with optical heterodyne detection: Single- and multi-wavelength sensing of gases. Appl. Phys. B 2002, 75, 267–280. [Google Scholar] [CrossRef]
  35. Romanini, D.; Kachanov, A.A.; Sadeghi, N.; Stoeckel, F. CW cavity ring down spectroscopy. Chem. Phys. Lett. 1997, 264, 316–322. [Google Scholar] [CrossRef]
  36. Kassi, S.; Campargue, A. Cavity ring down spectroscopy with 5 × 10⁻¹³ cm−1 sensitivity. J. Chem. Phys. 2012, 137, 234201. [Google Scholar] [CrossRef]
  37. Paldus, B.A.; Kachanov, A.A. An historical overview of cavity-enhanced methods. Can. J. Phys. 2005, 83, 975–999. [Google Scholar] [CrossRef]
  38. Chen, B.; Sun, Y.R.; Zhou, Z.Y.; Chen, J.; Liu, A.W.; Hu, S.M. Ultrasensitive, self-calibrated cavity ring-down spectrometer for quantitative trace gas analysis. Appl. Opt. 2014, 53, 7716–7723. [Google Scholar] [CrossRef]
  39. He, Y.; Kan, R.; Englich, F.V.; Liu, W.; Orr, B.J. Simultaneous multi-laser, multi-species trace-level sensing of gas mixtures by rapidly swept continuous-wave cavity-ringdown spectroscopy. Opt. Express 2010, 18, 20059–20071. [Google Scholar] [CrossRef]
  40. Moyer, E.J.; Sayres, D.S.; Engel, G.S.; St. Clair, J.M.; Keutsch, F.N.; Allen, N.T.; Kroll, J.H.; Anderson, J.G. Design considerations in high-sensitivity off-axis integrated cavity output spectroscopy. Appl. Phys. B 2008, 92, 467–474. [Google Scholar] [CrossRef]
  41. Huang, H.; Lehmann, K.K. Long-term stability in continuous wave cavity ringdown spectroscopy experiments. Appl. Opt. 2010, 49, 1378–1387. [Google Scholar] [CrossRef] [Green Version]
  42. Werle, P.O.; Mücke, R.; Slemr, F. The limits of signal averaging in atmospheric trace-gas monitoring by tunable diode-laser absorption spectroscopy (TDLAS). Appl. Phys. B 1993, 57, 131–139. [Google Scholar] [CrossRef]
  43. Russo, S.D.; Zifarelli, A.; Patimisco, P.; Sampaolo, A.; Wei, T.; Wu, H.; Dong, L.; Spagnolo, V. Light-induced thermo-elastic effect in quartz tuning forks exploited as a photodetector in gas absorption spectroscopy. Opt. Express 2020, 28, 19074–19084. [Google Scholar] [CrossRef] [PubMed]
  44. Qiao, S.; Ma, Y.; He, Y.; Patimisco, P.; Sampaolo, A.; Spagnolo, V. Ppt level carbon monoxide detection based on light-induced thermoelastic spectroscopy exploring custom quartz tuning forks and a mid-infrared QCL. Opt. Express 2021, 29, 25100–25108. [Google Scholar] [CrossRef] [PubMed]
Figure 1. Schematic of the experimental setup with two lasers. FC, fiber-optic combiner; OI, optical isolator; AOM, acousto-optic modulator as an optical switch; PD, photodiode detector; DAQ, data acquisition.
Sensors 21 07622 g001
Figure 2. Mode matching the laser wavelength to the resonance of an optical cavity by feedback controlling the laser operation current so that the resonance occurs in the middle region of a small dithering of laser current.
Sensors 21 07622 g002
Figure 3. Flowchart of the control scheme for searching, tracking, and step-scanning the laser wavelength to match optical cavity resonances.
Sensors 21 07622 g003
Figure 4. Recording of a step-scanned spectrum across an absorption line of 13CH4 at 1658.689 nm. At each laser frequency set to a consecutive cavity resonance frequency, 20 ringdown events were measured.
Sensors 21 07622 g004
Figure 5. (a) Ringdown signals when both lasers are in resonance with the cavity within a short period of time, causing interference. (b) and (c) Ringdown signal when only one laser is dithered around cavity resonance while the other laser is set off resonance with the cavity. The signal fluctuation is caused by frequency fluctuation of the DFB diode lasers.
Sensors 21 07622 g005
Figure 6. (a) A CH4 absorption spectrum measured at discrete frequency points of cavity resonances, together with spectral modelling. (b) The established CH4 wavelengths help to determine the cavity mode spacing (i.e., its free spectral range—FSR).
Sensors 21 07622 g006
Figure 7. (a) Repeated measurements of the FSR value of the ringdown cavity and (b) the slow drift of one of the cavity resonance frequencies as a result of optical cavity length drift. The large step change of about 0.0044 cm−1 is due to the FSR periodicity in resonance frequency assignment.
Sensors 21 07622 g007
Figure 8. Allan variance analysis of the noise-equivalent absorption coefficient of the empty cavity as a function of the number of ringdown measurements, together with indications of 95% confidence intervals. The data rate is 9 measurements per second.
Sensors 21 07622 g008
Figure 9. (a) Trace CH4 measurements near 6046.95 cm−1 and (b) fitting residuals.
Sensors 21 07622 g009
Figure 10. Spectral measurements around (a) 6046.95 cm−1 and (b) 6047.30 cm−1, with an estimated CH4 partial pressure of 0.1 pa. The vertical scale of (b) is 1000 times smaller than that of (a).
Sensors 21 07622 g010
Figure 11. Spectral measurements of (a) 12CH4 and (c) 13CH4 isotope in ambient air, together with model fittings. (b) and (d) are fitting residuals.
Sensors 21 07622 g011
Figure 12. Allan variance analysis for the precision of CH4 isotope measurements, together with indications of 95% confidence intervals.
Sensors 21 07622 g012
Publisher’s Note: MDPI stays neutral with regard to jurisdictional claims in published maps and institutional affiliations.

