
A Simple Phase-Sensitive Surface Plasmon Resonance Sensor Based on Simultaneous Polarization Measurement Strategy


Abstract
:1. Introduction
2. Materials and Methods
2.1. Reagents
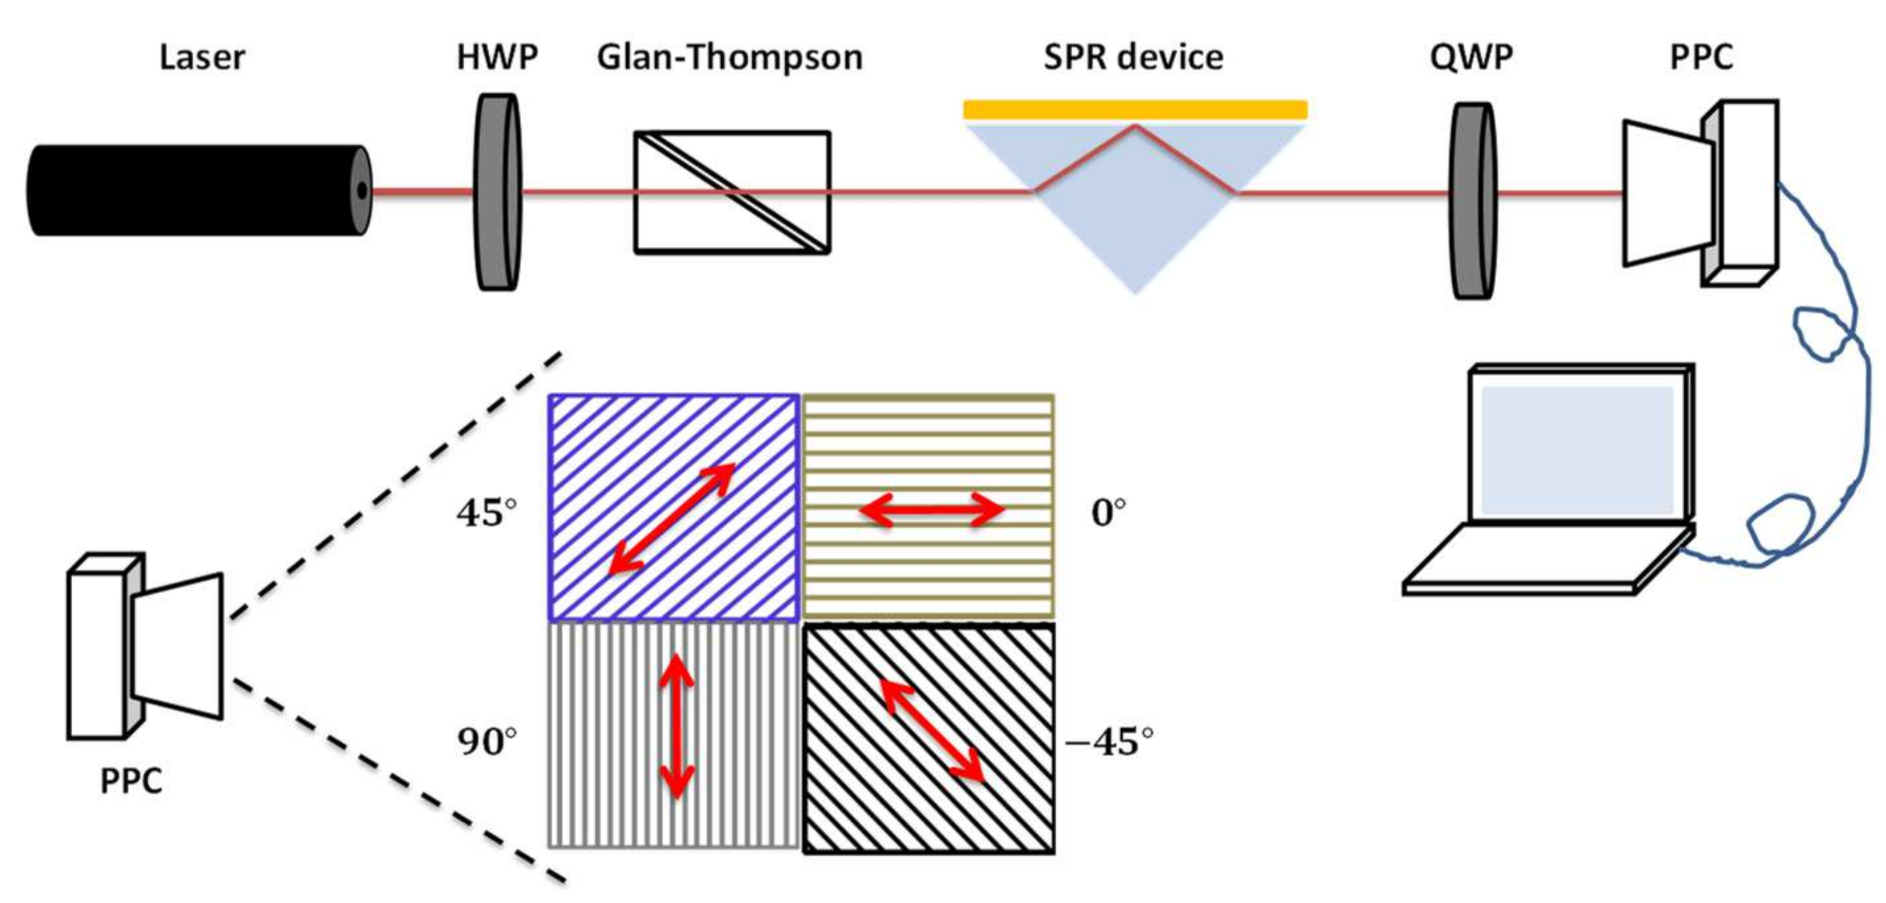
2.2. Optical Setup
2.3. Preparation of the SPR Sensing Chip
3. Results and Discussion
3.1. Principle of the Phase Extraction Method
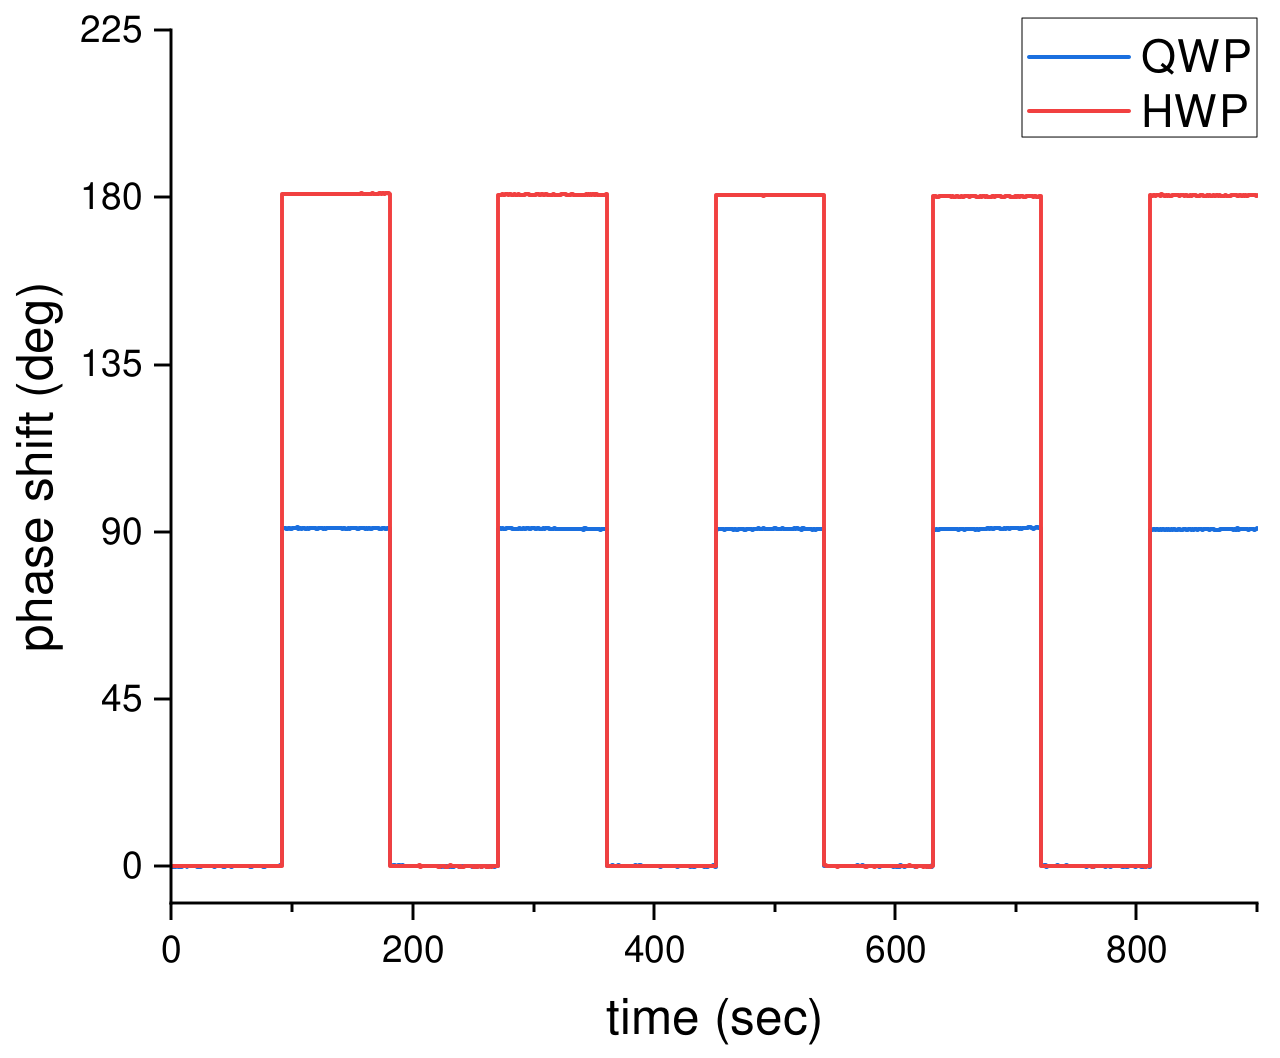
3.2. Validation of the Phase Difference Calculation Method
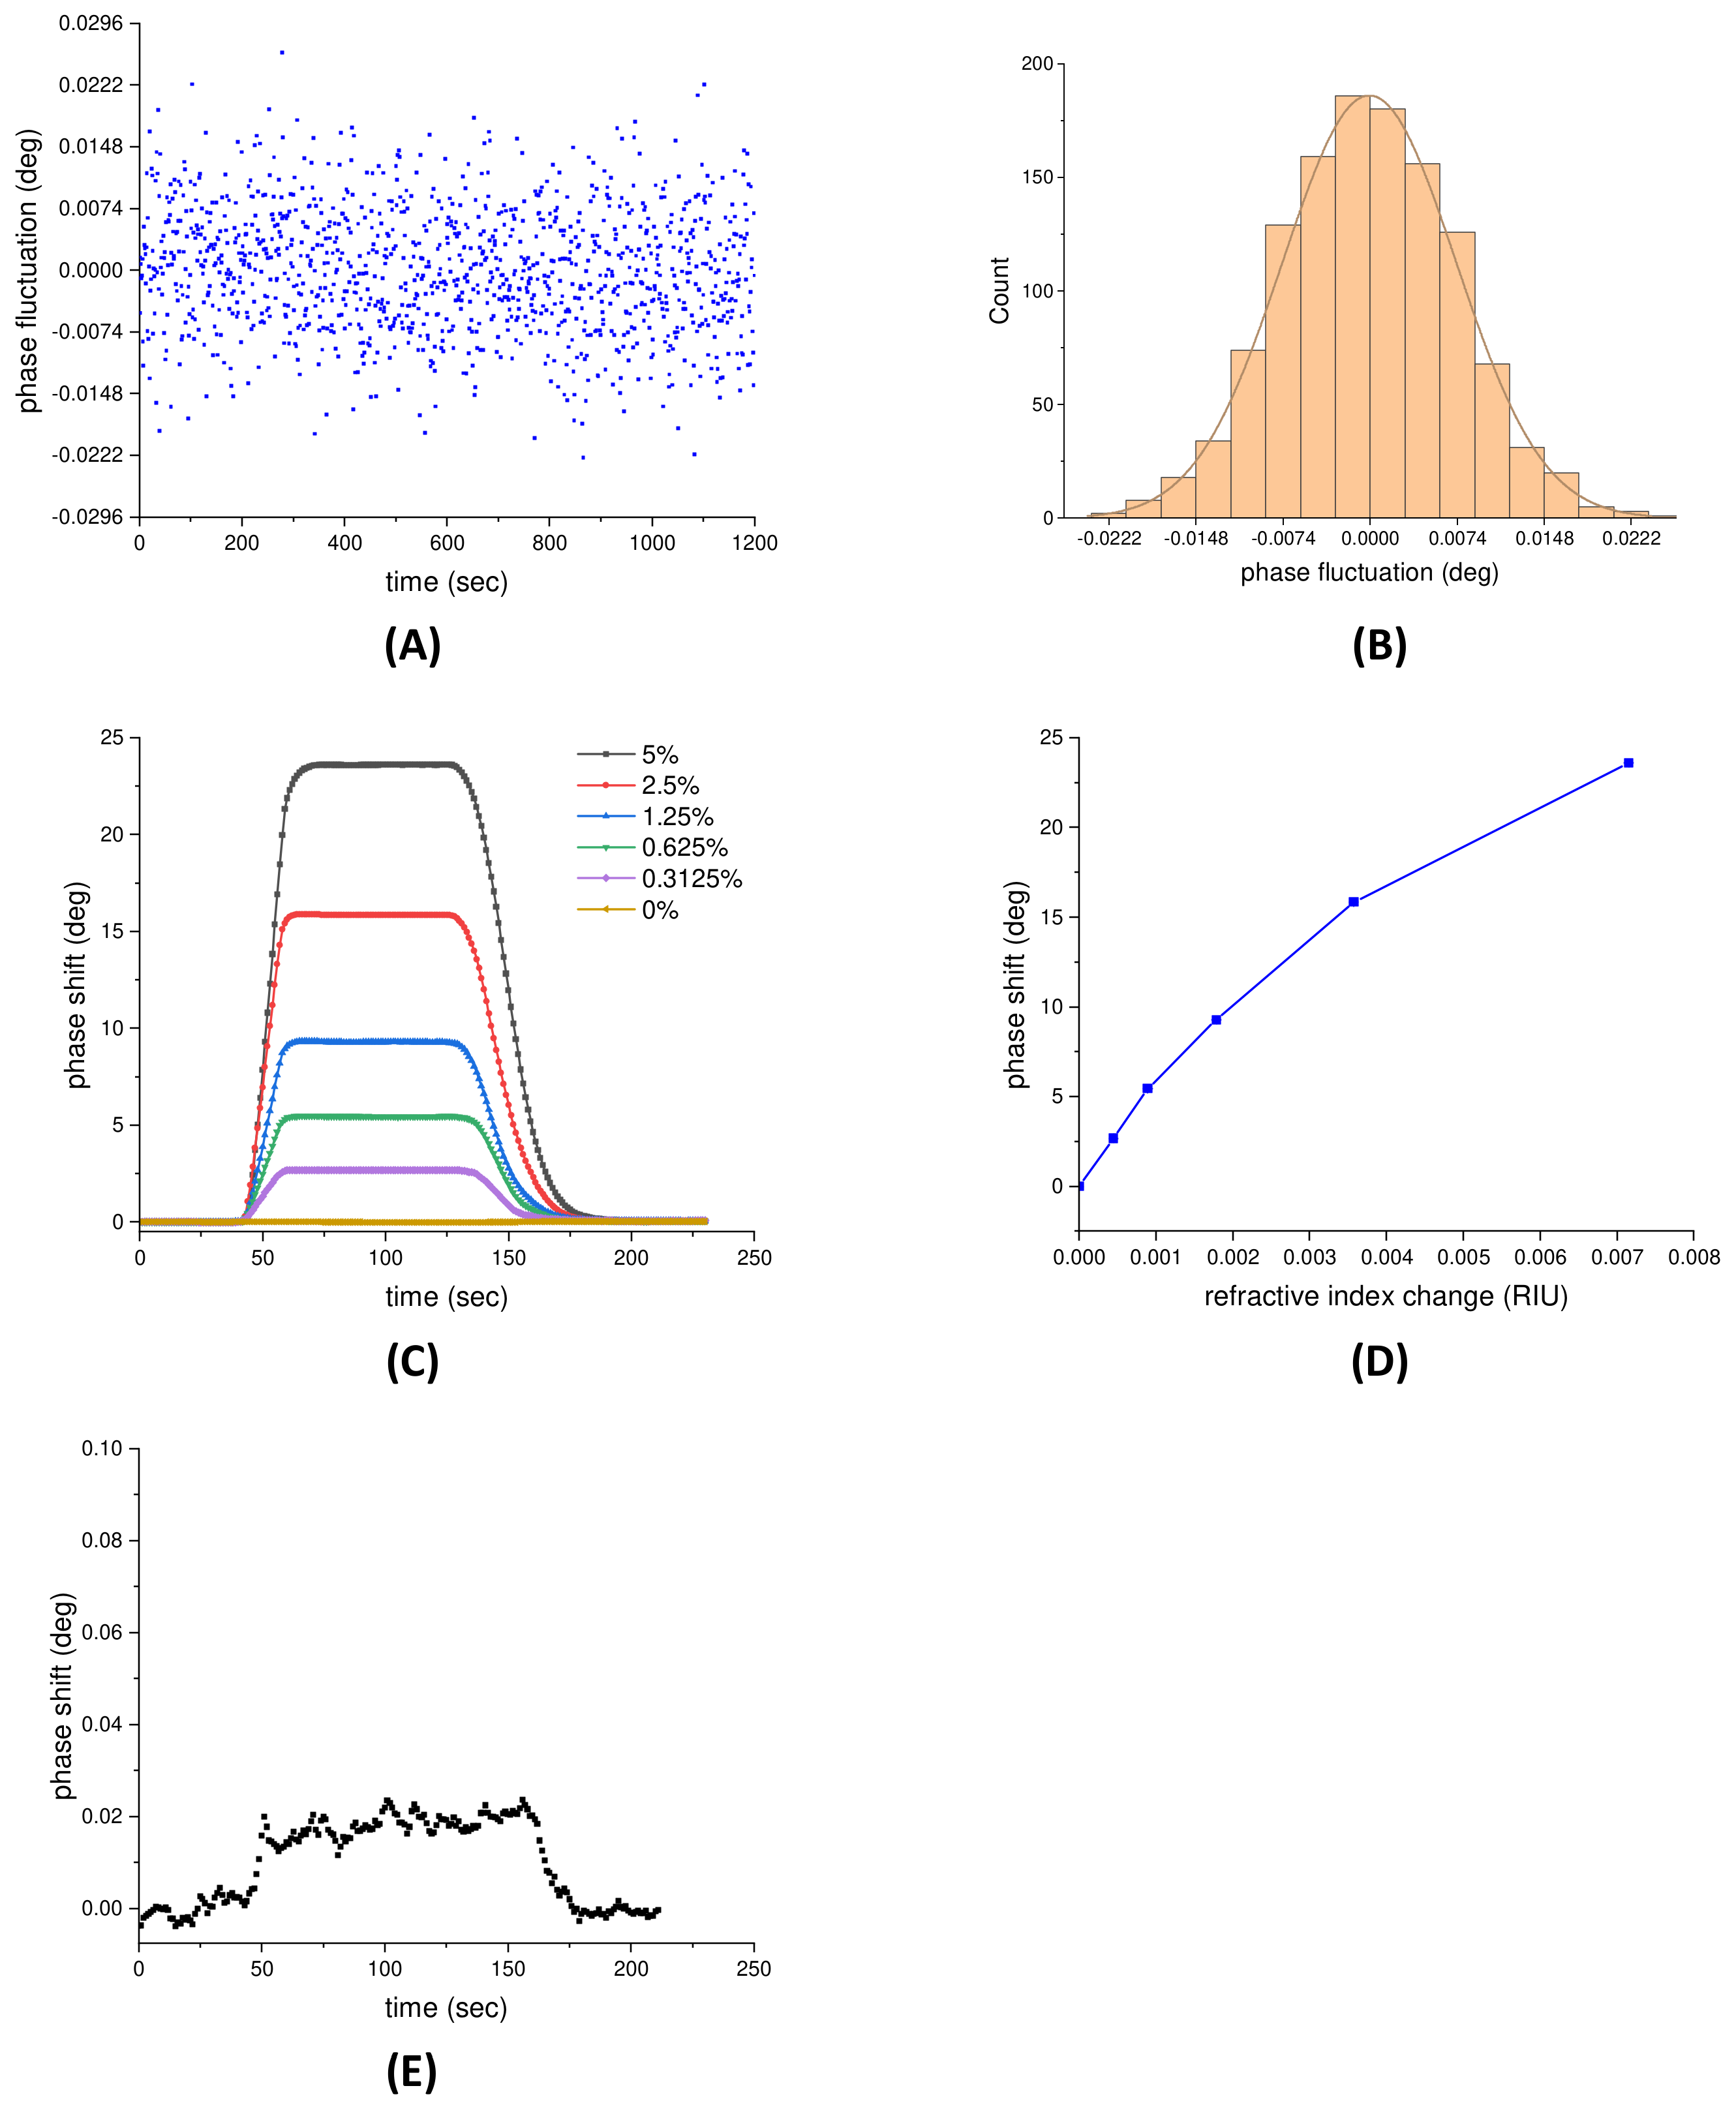
3.3. Stability and Detection Performance of the Proposed Phase-Sensitive SPR Sensor
3.4. Application to Glyphosate Detection
4. Conclusions
Author Contributions
Funding
Institutional Review Board Statement
Informed Consent Statement
Data Availability Statement
Acknowledgments
Conflicts of Interest
References
- Homola, J. Surface Plasmon Resonance Based Sensors; Springer: New York, NY, USA, 2006. [Google Scholar]
- Springer, T.; Hemmerova, E.; Finocchiaro, G.; Kristofikova, Z.; Vyhnalek, M.; Homola, J. Surface plasmon resonance biosensor for the detection of tau-amyloid beta complex. Sens. Actuators B Chem. 2020, 316, 128146. [Google Scholar] [CrossRef]
- Otto, A. Excitation of nonradiative surface plasma waves in silver by the method of frustrated total reflection. Z. Phys. 1968, 216, 398–410. [Google Scholar] [CrossRef]
- Raether, H. Surface Plasmons on Smooth and Rough Surfaces and on Gratings; Springer: New York, NY, USA, 1988. [Google Scholar]
- Nylander, C.; Liedberg, B.; Lind, T. Gas detection by means of surface plasmons resonance. Sens. Actuators 1982, 3, 79–88. [Google Scholar] [CrossRef]
- Yanga, N.; Su, X.; Tjong, V.; Knoll, W. Evaluation of two- and three-dimensional streptavidin binding platforms for surface plasmon resonance spectroscopy studies of DNA hybridization and protein-DNA binding. Biosens. Bioelectron. 2007, 22, 2700–2706. [Google Scholar] [CrossRef]
- Dostálek, J.; Vaisocherova, H.; Homola, J. Multichannel surface plasmon resonance biosensor with wavelength division multiplexing. Sens. Actuators B Chem. 2005, 108, 758–764. [Google Scholar] [CrossRef]
- Boozer, C.; Ladd, J.; Chen, S.; Jiang, S. DNA-Directed Protein Immobilization for Simultaneous Detection of Multiple Analytes by Surface Plasmon Resonance Biosensor. Anal. Chem. 2006, 78, 1515–1519. [Google Scholar] [CrossRef]
- Chen, S.; Liu, Y.; Yu, Q.; Peng, W. Self-referencing SPR biosensing with an ultralow limit-of-detection using long-wavelength excitation. Sens. Actuators B Chem. 2021, 327, 128935. [Google Scholar] [CrossRef]
- Chang, Y.-F.; Chou, Y.-T.; Cheng, C.-Y.; Hsu, J.-F.; Su, L.-C.; Ho, J.A. Amplification-free detection of cytomegalovirus miRNA using a modification-free surface plasmon resonance biosensor. Anal. Chem. 2021, 93, 8002–8009. [Google Scholar] [CrossRef]
- Aoki, H.; Corn, R.M.; Matthews, B. MicroRNA detection on microsensor arrays by SPR imaging measurements with enzymatic signal enhancement. Biosens. Bioelectron. 2019, 142, 111565. [Google Scholar] [CrossRef] [Green Version]
- Chang, Y.-F.; Wang, W.-H.; Hong, Y.-W.; Yuan, R.-Y.; Chen, K.-H.; Huang, Y.-W.; Lu, P.-L.; Chen, Y.-H.; Chen, Y.-M.A.; Su, L.-C.; et al. Simple strategy for rapid and sensitive detection of avian influenza A H7N9 virus based on intensity-modulated SPR biosensor and new generated antibody. Anal. Chem. 2018, 90, 1861–1869. [Google Scholar] [CrossRef]
- Schasfoort, R.B.M. Chapter 1. Introduction to Surface Plasmon Resonance. In Handbook of Surface Plasmon Resonance; Schasfoort, R.B.M., Ed.; Royal Society of Chemistry (RSC): Cambridge, UK, 2017; pp. 1–26. [Google Scholar]
- Halpern, A.R.; Chen, Y.; Corn, R.M.; Kim, D. Surface plasmon resonance phase imaging measurements of patterned monolayers and DNA adsorption onto microarrays. Anal. Chem. 2011, 83, 2801–2806. [Google Scholar] [CrossRef] [PubMed] [Green Version]
- Mohammadzadeh-Asl, S.; Keshtkar, A.; Dolatabadi, J.E.N.; de la Guardia, M. Nanomaterials and phase sensitive based signal enhancement in surface plasmon resonance. Biosens. Bioelectron. 2018, 110, 118–131. [Google Scholar] [CrossRef] [PubMed]
- Yang, C.-H.; Wu, T.-H.; Chang, C.-C.; Lo, H.-Y.; Liu, H.-W.; Huang, N.-T.; Lin, C.-W. Biosensing amplification by hybridization chain reaction on phase-sensitive surface plasmon resonance. Biosensors 2021, 11, 75. [Google Scholar] [CrossRef] [PubMed]
- Kabashin, A.V.; Patskovsky, S.; Grigorenko, A.N. Phase and amplitude sensitivities in surface plasmon resonance bio and chemical sensing. Opt. Express 2009, 17, 21191–21204. [Google Scholar] [CrossRef] [PubMed]
- Markowicz, P.P.; Law, W.C.; Baev, A.; Prasad, P.N. Phase-sensitive time-modulated surface plasmon resonance polarimetry for wide dynamic range biosensing. Opt. Express 2007, 21, 1745–1754. [Google Scholar] [CrossRef] [PubMed]
- Hlubina, P.; Duliakova, M.; Kadulova, M.; Ciprian, D. Spectral interferometry-based surface plasmon resonance sensor. Opt. Commun. 2015, 354, 240–245. [Google Scholar] [CrossRef]
- Zeng, Y.; Wang, X.; Zhou, J.; Miyan, R.; Qu, J.; Ho, H.P.; Zhou, K.; Gao, B.Z.; Shao, Y. Phase interrogation SPR sensing based on white light polarized interference for wide dynamic detection range. Opt. Express 2020, 28, 3442–3450. [Google Scholar] [CrossRef] [PubMed] [Green Version]
- Wu, S.Y.; Ho, H.P.; Law, W.C.; Lin, C.; Kong, S.K. Highly sensitive differential phase-sensitive surface plasmon resonance biosensor based on the Mach–Zehnder configuration. Opt. Lett. 2004, 29, 2378–2380. [Google Scholar] [CrossRef]
- Wong, C.L.; Ho, H.P.; Suen, Y.K.; Kong, S.K.; Chen, Q.L.; Yuan, W.; Wu, S.Y. Real-time protein biosensor arrays based on surface plasmon resonance differential phase imaging. Biosens. Bioelectron. 2008, 24, 606–612. [Google Scholar] [CrossRef]
- Nelson, S.G.; Johnston, K.S.; Yee, S.S. High sensitivity surface plasmon resonance sensor based on phase detection. Sens. Actuators B Chem. 1996, 36, 187–191. [Google Scholar] [CrossRef]
- Sun, R.-J.; Huang, H.J.; Hsiao, C.-N.; Lin, Y.-W.; Liao, B.-H.; Chou Chau, Y.-F.; Chiang, H.-P. Reusable TiN substrate for surface plasmon resonance heterodyne phase interrogation sensor. Nanomaterials 2020, 10, 1325. [Google Scholar] [CrossRef] [PubMed]
- Su, L.-C.; Tian, Y.-C.; Chang, Y.-F.; Chou, C.; Lai, C.-S. Rapid detection of urinary polyomavirus BK by heterodyne-based surface plasmon resonance biosensor. J. Biomed. Opt. 2014, 19, 011013. [Google Scholar] [CrossRef]
- Ho, H.P.; Law, W.C.; Wu, S.Y.; Liu, X.H.; Wong, S.P.; Lin, C.; Kong, S.K. Phase-sensitive surface plasmon resonance biosensor using the photoelastic modulation technique. Sens. Actuators B Chem. 2006, 114, 80–84. [Google Scholar] [CrossRef]
- Su, Y.-D.; Chen, S.-J.; Yeh, T.-L. Common-path phase-shift interferometry surface plasmon resonance imaging system. Opt. Lett. 2005, 30, 1488–1490. [Google Scholar] [CrossRef] [PubMed]
- Huang, Y.H.; Ho, H.P.; Wu, S.Y.; Kong, S.K.; Wong, W.W.; Shum, P. Phase sensitive SPR sensor for wide dynamic range detection. Opt. Lett. 2011, 36, 4092–4094. [Google Scholar] [CrossRef]
- Watad, I.; Abdulhalim, I. Phase-shifted polarimetric surface plasmon resonance sensor using a liquid crystal retarder and a diverging beam. Opt. Lett. 2019, 44, 1607–1610. [Google Scholar] [CrossRef]
- Shan, Y.; Hu, G.; Grilli, M.L.; He, H.; Zhu, M.; Zhao, Y.; Shao, J. Measuring ultrathin metal coatings using SPR spectroscopic ellipsometry with a prism-dielectric-metal-liquid configuration. Opt. Express 2019, 27, 7912–7921. [Google Scholar] [CrossRef]
- Zheng, Z.; Wan, Y.; Zhao, X.; Zhu, J. Spectral interferometric measurement of wavelength-dependent phase response for surface plasmon resonance sensors. Appl. Opt. 2009, 48, 2491–2495. [Google Scholar] [CrossRef] [PubMed]
- Ng, S.P.; Loo, F.C.; Wu, S.Y.; Kong, S.K.; Wu, C.M.L.; Ho, H.P. Common-path spectral interferometry with temporal carrier for highly sensitive surface plasmon resonance sensing. Opt. Express 2013, 21, 20268–20273. [Google Scholar] [CrossRef]
- Kanok, R.; Ciprian, D.; Hlubina, P. Surface plasmon resonance-based sensing utilizing spatial phase modulation in an imaging interferometer. Sensors 2020, 21, 1616. [Google Scholar] [CrossRef] [PubMed] [Green Version]
- Westphal, P.; Bornmann, A. Biomolecular detection by surface plasmon enhanced ellipsometry. Sens. Actuators B Chem. 2002, 84, 278–282. [Google Scholar] [CrossRef]
- Naraoka, R.; Kajikaw, K. Phase detection of surface plasmon resonance using rotating analyzer method. Sens. Actuators B Chem. 2005, 107, 952–956. [Google Scholar] [CrossRef]
- Sinha, R.K. A simple and inexpensive surface plasmon resonance setup for phase detection using rotating analyser ellipsometric method. Laser Phys. 2020, 30, 026202. [Google Scholar] [CrossRef]
- Chen, F.; Li, G.; Liu, H.; Leung, C.-H.; Ma, D.-L. G-quadruplex-based detection of glyphosate in complex biological systems by a time-resolved luminescent assay. Sens. Actuators B Chem. 2020, 320, 128393. [Google Scholar] [CrossRef]
- Jiang, M.; Chen, C.; He, J.; Zhang, H.; Xu, Z. Fluorescence assay for three organophosphorus pesticides in agricultural products based on Magnetic-Assisted fluorescence labeling aptamer probe. Food Chem. 2020, 307, 125534. [Google Scholar] [CrossRef] [PubMed]
- Piliarik, M.; Homola, J. Surface plasmon resonance (SPR) sensors: Approaching their limits? Opt. Express 2009, 17, 16505–16517. [Google Scholar] [CrossRef] [PubMed]
- Liu, Q.; Zhang, R.; Yu, B.; Liang, A.; Jiang, Z. A highly sensitive gold nanosol SERS aptamer assay for glyphosate with a new COF nanocatalytic reaction of glycol-Au(III). Sens. Actuators B Chem. 2021, 344, 130288. [Google Scholar] [CrossRef]
- Drinking Water Standards and Health Advisories, 2018th ed.; United States Environmental Protection Agency (USEPA): Washington, DC, USA, 2018.
- Cuhra, M. Review of GMO safety assessment studies: Glyphosate residues in Roundup Ready crops is an ignored issue. Environ. Sci. Eur. 2015, 27, 20. [Google Scholar] [CrossRef] [Green Version]
- Yuan, Y.; Jiang, J.; Liu, S.; Yang, J.; Zhang, H.; Yan, J.; Hu, X. Fluorescent carbon dots for glyphosate determination based on fluorescence resonance energy transfer and logic gate operation. Sens. Actuat. B Chem. 2017, 242, 545–553. [Google Scholar] [CrossRef]


| Physical Detection Limit | Reference | |
|---|---|---|
| electronic modulators | 1.2 × 10⁻⁶ RIU~5.5 × 10⁻⁸ RIU | [21,22,23,24,26,27,28,29] |
| spectral phase modulation | 8.0 × 10⁻⁶ RIU~2.0 × 10⁻⁸ RIU | [20,31,32] |
| rotating analyzer | 10−6 RIU~10−7 RIU | [35,36] |
| this method | 4.6 × 10⁻⁷ RIU |
Publisher’s Note: MDPI stays neutral with regard to jurisdictional claims in published maps and institutional affiliations. |
© 2021 by the authors. Licensee MDPI, Basel, Switzerland. This article is an open access article distributed under the terms and conditions of the Creative Commons Attribution (CC BY) license (https://creativecommons.org/licenses/by/4.0/).
Share and Cite
Li, M.-C.; Chen, K.-R.; Kuo, C.-C.; Lin, Y.-X.; Su, L.-C. A Simple Phase-Sensitive Surface Plasmon Resonance Sensor Based on Simultaneous Polarization Measurement Strategy. Sensors 2021, 21, 7615. https://doi.org/10.3390/s21227615
Li M-C, Chen K-R, Kuo C-C, Lin Y-X, Su L-C. A Simple Phase-Sensitive Surface Plasmon Resonance Sensor Based on Simultaneous Polarization Measurement Strategy. Sensors. 2021; 21(22):7615. https://doi.org/10.3390/s21227615
Chicago/Turabian StyleLi, Meng-Chi, Kai-Ren Chen, Chien-Cheng Kuo, Yu-Xen Lin, and Li-Chen Su. 2021. "A Simple Phase-Sensitive Surface Plasmon Resonance Sensor Based on Simultaneous Polarization Measurement Strategy" Sensors 21, no. 22: 7615. https://doi.org/10.3390/s21227615
APA StyleLi, M.-C., Chen, K.-R., Kuo, C.-C., Lin, Y.-X., & Su, L.-C. (2021). A Simple Phase-Sensitive Surface Plasmon Resonance Sensor Based on Simultaneous Polarization Measurement Strategy. Sensors, 21(22), 7615. https://doi.org/10.3390/s21227615