Abstract
The ability to monitor Sprained Ankle Rehabilitation Exercises (SPAREs) in home environments can help therapists ascertain if exercises have been performed as prescribed. Whilst wearable devices have been shown to provide advantages such as high accuracy and precision during monitoring activities, disadvantages such as limited battery life and users’ inability to remember to charge and wear the devices are often the challenges for their usage. In addition, video cameras, which are notable for high frame rates and granularity, are not privacy-friendly. Therefore, this paper proposes the use and fusion of privacy-friendly and Unobtrusive Sensing Solutions (USSs) for data collection and processing during SPAREs in home environments. The present work aims to monitor SPAREs such as dorsiflexion, plantarflexion, inversion, and eversion using radar and thermal sensors. The main contributions of this paper include (i) privacy-friendly monitoring of SPAREs in a home environment, (ii) fusion of SPAREs data from homogeneous and heterogeneous USSs, and (iii) analysis and comparison of results from single, homogeneous, and heterogeneous USSs. Experimental results indicated the advantages of using heterogeneous USSs and data fusion. Cluster-based analysis of data gleaned from the sensors indicated an average classification accuracy of 96.9% with Neural Network, AdaBoost, and Support Vector Machine, amongst others.
1. Introduction
Developments in sensing technologies have made positive impacts on many applications ranging from aerospace to automotive and healthcare. In the medical and health sectors, biosensors are deployed to monitor patient’s physiological conditions in hospital environments. Although the hospital environment has advantages such as direct supervision by specialists, appointment booking, logistical concerns, and a feeling of discomfort are some of the disadvantages.
Several activities and rehabilitation exercises can be monitored outside the hospital settings, such as assisted living and home environments [1]. Whilst the assisted living communities are noted for increased physical activities and socialisation opportunities, the home environment offers a more relaxed and convenient setting for rehabilitation exercises such as spinal cord injury rehabilitation exercises [2], cardio rehabilitation [3], post-stroke rehabilitation exercises [4,5], and Home-Based Ankle Rehabilitation [6].
Sprained ankles are injuries sustained due to inappropriate movement of the ankle. Although they are generally regarded as common injuries, they can degenerate into lifelong problems if not adequately treated. Common causes of a sprained ankle include ankle twists during a fall, awkward landing during sports activities, and stepping on uneven surfaces during walking or exercising. Sprained Ankle Rehabilitation Exercises (SPAREs) include a range of exercises aimed at helping recovery from these injuries [7]. Typical SPAREs include Range of Motion (RoM), balance, stretching, control, and strengthening exercises [8,9]. RoM exercises entail trying to move the ankle in all directions or some specific directions. The sufferer can take a sitting position, place the non-affected foot flat on the floor while attempting to move the affected foot in predetermined directions [8]. Common examples of RoM include controlled-resistant cycling and cord-assisted stretching. While RoM can be active, there is also evidence of the performance of passive RoM.
Balance and control exercises can involve the use of wobble boards with supports to avoid tipping [10]. It is often recommended for those with little or no pain on the sprained ankle. In addition, the duration of the exercise can span between a minute or more and up to six times in each session [8]. Balance exercises can include standing on the affected leg with the hands to the sides of the body or folded across the chest. Stretching exercises, on the other hand, involve extending the calf muscle and the Achilles tendon by pushing against a wall with the affected foot stretched out at the back. Strengthening exercises can include foot dorsiflexion, plantarflexion, inversion, and eversion [10]. Home-based SPAREs include a range of exercises that can be performed within the home environment to help recovery. Whilst some of these exercises can be performed using common devices such as elastic bands, wobble boards, and deformable plastic materials, sophisticated instruments, namely, treadmills, actuators, and cycling machines, can also be used.
The ability to monitor SPAREs can help to understand if the exercises and activities have been performed as prescribed. The monitoring devices can include a range of wearables and non-wearables, such as video cameras, gyroscopes, and accelerometers. Whilst video cameras pose issues ranging from privacy to storage capacity, accelerometers and gyroscopes require users to remember to charge and wear the devices. Battery life problems, data disruption, and a feeling of discomfort due to skin irritations from bands and cuffs are also common challenges with the use of wearables [11].
This study considers the sprained ankle strengthening exercises involving foot movement in the four fundamental directions. The present work aims to monitor SPAREs such as dorsiflexion, plantarflexion, inversion, and eversion using Unobtrusive Sensing Solutions (USSs) such as radar and thermal sensors. The main contributions of this paper include (i) privacy-friendly monitoring of SPAREs in a home environment, (ii) fusion of SPAREs data from homogeneous and heterogeneous USSs, and (iii) analysis and comparison of results from single, homogeneous, and heterogeneous USSs.
The remainder of the paper is organised as follows. Section 2 reviews Sensing Solutions (SSs) in home-based SPAREs monitoring, Section 3 presents the materials and methods for data acquisition and analysis, Section 4 presents experimental results, Section 5 discusses findings from the study, and Section 6 presents the conclusion.
2. Sensing Solutions in Home-Based Sprained Ankle Rehabilitation Exercises Monitoring
This section reviews the state-of-the-art in home-based SPAREs monitoring ranging from wearables to video-based Sensing Solutions.
2.1. Wearable Sensing Solutions
The use of wearables such as triaxial accelerometers, gyroscopes, and inertial sensors to monitor and estimate the orientations of a body has been widely researched [12,13,14,15,16]. The sensors’ usage has included measurement of the acceleration of the upper extremity post-stroke [17], indoor activity monitoring and classification [18,19,20,21,22,23], behaviour monitoring [24,25], and home-based motor functions rehabilitation [16], amongst others. In SPAREs, wearables such as foot-mounted inertial sensors have been used to estimate the orientation of the ankle [26]. Although inertial-based motion sensors can be used to obtain locomotion parameters, they are sometimes influenced by the temperature of the sensing environment [16,27].
Azizi et al. [7] proposed the use of a gyro-based system that included WiFi and microcontroller modules in determining ankle inclination and orientation. This study was noted to have provided significant improvement to the patients although it failed to estimate the percentage at which the participants recovered from the ailment. In [28], the use of a microcontroller-based system alongside an accelerometer to monitor the angular inclination of the ankle during SPAREs is proposed. The two degrees of freedom allowed by this system placed restrictions on the movement of the ankle during the exercises. The authors in [29] considered the major trends in SPAREs assistive and monitoring devices. Whilst devices with middle complexity were mostly wearables, high-complexity devices such as the Biodex multi-joint devices were noted for their bulkiness, high cost, professionalism requirements, and suitability for use in only clinical environments.
2.2. Video-Based Sensing Solutions
Video-based SS such as Kinect in home-based monitoring has become popular in recent years [30]. Kinect provides a 3D estimation of users’ postures and allows for real-time tracking of room occupants. It can also provide information on the joint segments of targeted persons [16,31,32]. Despite the remarkable usefulness of the Kinect sensors in games and rehabilitation, sensitivity to external infrared sources and reflective materials are the main drawbacks of their usage in home-based settings [33]. For these reasons, amongst others, such as privacy concerns [34], the Kinect sensor was not appropriate for this study [35].
A further study by [36] proposed a video game-based approach to SPAREs. The approach, which was measured against traditional exercises, was said to be effective in restoring the ankle functions based on indexes such as mood, pain perception, and readiness to return to active sports, amongst others. Furthermore, a game-based solution by [37] was compared with physical therapy and a controlled group. The study, which suggested six weeks of treatment, noted significant improvements in pain reduction. The authors of [38] proposed the use of augmented reality to help patients and physiotherapists in SPAREs. The study focused on the importance of using autonomous devices during SPAREs. In all the studies, monitoring processes were either performed using human observation or a video camera. While the former is prone to optical illusion and error, the latter requires higher storage space. In addition, video recordings can intrude into the privacy of the users of these technologies.
A privacy-friendly Sensing Solution (SS) was proposed by [39]. The work involved the use of a thermal imaging camera to study temperature variations in human ankles by comparing blood flow on sprained and non-sprained ankles. Although the thermal camera offered a privacy-friendly solution, parameters such as the range, velocity, and angle of the movement were not considered in the study. In addition, the extent of recovery was through human observation. Therefore, to ensure the effectiveness of these rehabilitation approaches and processes, Data Mining (DM) and Machine Learning (ML) algorithms should be used for their data analysis for pattern assessment and clustering. A comparison of the SSs is presented in Table 1.

Table 1.
Comparison of Sensing Solutions (SSs) in Sprained Ankle Rehabilitation Exercises (SPAREs) monitoring.
Research evidence has suggested that most SPAREs monitored through face-to-face interaction and supervision of a physiotherapist can be monitored remotely [40,41]. Performing SPAREs in a remote environment, such as the home setting, can include following a set of instructional guides provided by a therapist [6,42,43]. The home-based approach can help address problems related to insufficient therapists and cost [44]. Unlike other rehabilitation exercises, monitoring SPAREs can be difficult owing to smaller angular movements of the ankle and the possibility of occlusion. Whilst video cameras pose privacy issues, Wearable Sensing Solutions (WeSSs) such as gyroscopes and accelerometers pose battery life and wearability problems. On the other hand, human observation can be prone to optical illusions and errors [11].
The present work proposes the use of unobtrusive and privacy-friendly SSs in the form of thermal and radar sensors to monitor SPAREs in a home environment. It also considers the use of DM and ML algorithms to perform Classification by Clustering (CbyC) of thermal images and blobs and other parameters such as range, speed, and the Angle of Approach or Retreat (AAR).
3. Materials and Methods
The methods employed in this work included data collection through experiments and preprocessing of the acquired (thermal and radar SSs) data. Others included thermal and radar sensors data processing using a Sensor Data Fusion (SDF) architecture. The sensors data were processed as single, homogeneous, and heterogeneous datasets. The SDF architecture presents two algorithmic pathways: Hierarchical Clustering Algorithm (HCA) and the K-Means++ Algorithm (KMA). Further analysis of the datasets with KMA is made to compare the averages of the model.
The statistical analysis method in the present work considered the averaging of model parameters against selecting the best model in order to aid subsequent computations. This includes obtaining the row averages of metrics such as Area Under the Curve (AUC), Classification Accuracy (CA), F1, Precision, and Recall for each model. Then, the row averages from KMA, HCA, fused homogeneous, and fused heterogeneous datasets are tabulated for column-wise averages. T-Test and descriptive analysis using ANOVA are performed on the column data referred to as KMA Averages (KMA-A), HCA Averages (HCA-A), data fusion averages from the side-facing and the front-facing ITA-32 sensors (SF-Fusion), and data fusion averages from the Infrared Thermopile Array (ITA-32) and Radar sensor (Rad-T Fusion). The averaging method was chosen against the best model method to avoid bias and present more data points in further analysis, such as T-Test and ANOVA.
The experimental setup involved the use of multiple sensors to record SPAREs in a laboratory living room that mimics a real-world living room. They included (i) one Frequency Modulated Continuous Wave (FMCW) radar sensor, (ii) one Multi-Chirp Frequency Modulated Continuous Wave Mono-pulse (MC-FMCW-M) radar sensor, (iii) two ITA-32 sensors, and (iv) two Shimmer-3 accelerometer (S3BA) SSs. The S3BAs were used for ground truth measurement of velocity. While the radar and thermal sensors were mounted on tripod stands and placed for side and frontal views of the ankles, the two S3BAs were attached to the metatarsal to record the acceleration of each foot in the X, Y, and Z directions. The rationale for taking measurements from the front and side views was to avoid the effects of occlusion. The rationale for using multiple sensors was to allow for complementary monitoring, redundancy, and cross-validation of measurements. The setting of the study, including the Living Lab in which the study was conducted, the physical location of the participants, and the SSs are presented in Figure 1.

Figure 1.
Sprained Ankle Rehabilitation Exercise setting: (a) the Living Lab where the study was conducted, and (b) the Sensing Solutions (SSs) used during the study. In Figure 1a, the red, white, and yellow spots indicted the locations of the side-facing SSs, the front-facing SSs, and the participants, respectively, during the study.
In Figure 1a, the red and the white spots indicate the location of the side-facing and the front-facing SS that were used to monitor the SPAREs. The yellow spot indicates where the participants sat during data collection. Whilst their legs were usually stretched towards the white spot (front-facing SS), side views of their actions were obtained with the side-facing SS to avoid occlusion. A total of 15 healthy participants, randomly selected from the School of Computing, took part in this study. In an upright sitting position, 20 directional movements were performed by the participants for 20 s on each leg. These included twisting the ankle in 4 fundamental directions of human ankle movement: (i) dorsiflexion, (ii) plantarflexion, (iii) eversion, and (iv) inversion. These movements were recorded simultaneously by all the sensors. The parameters measured included the angular orientation of the ankles and postures. Other parameters included their ranges and velocities at instances of dorsiflexion, plantarflexion, eversion, and inversion. However, data from the wearable sensors (S3BAs) were not considered in the data analysis. The rationale for not considering the S3BA data is that data analysis involving the S3BAs and the FMWC radar (aimed at comparing their velocity values) was considered in our previous study [45]. Data obtained by the thermal sensors were stored in a bespoke time-series database (SensorCentral) [46].
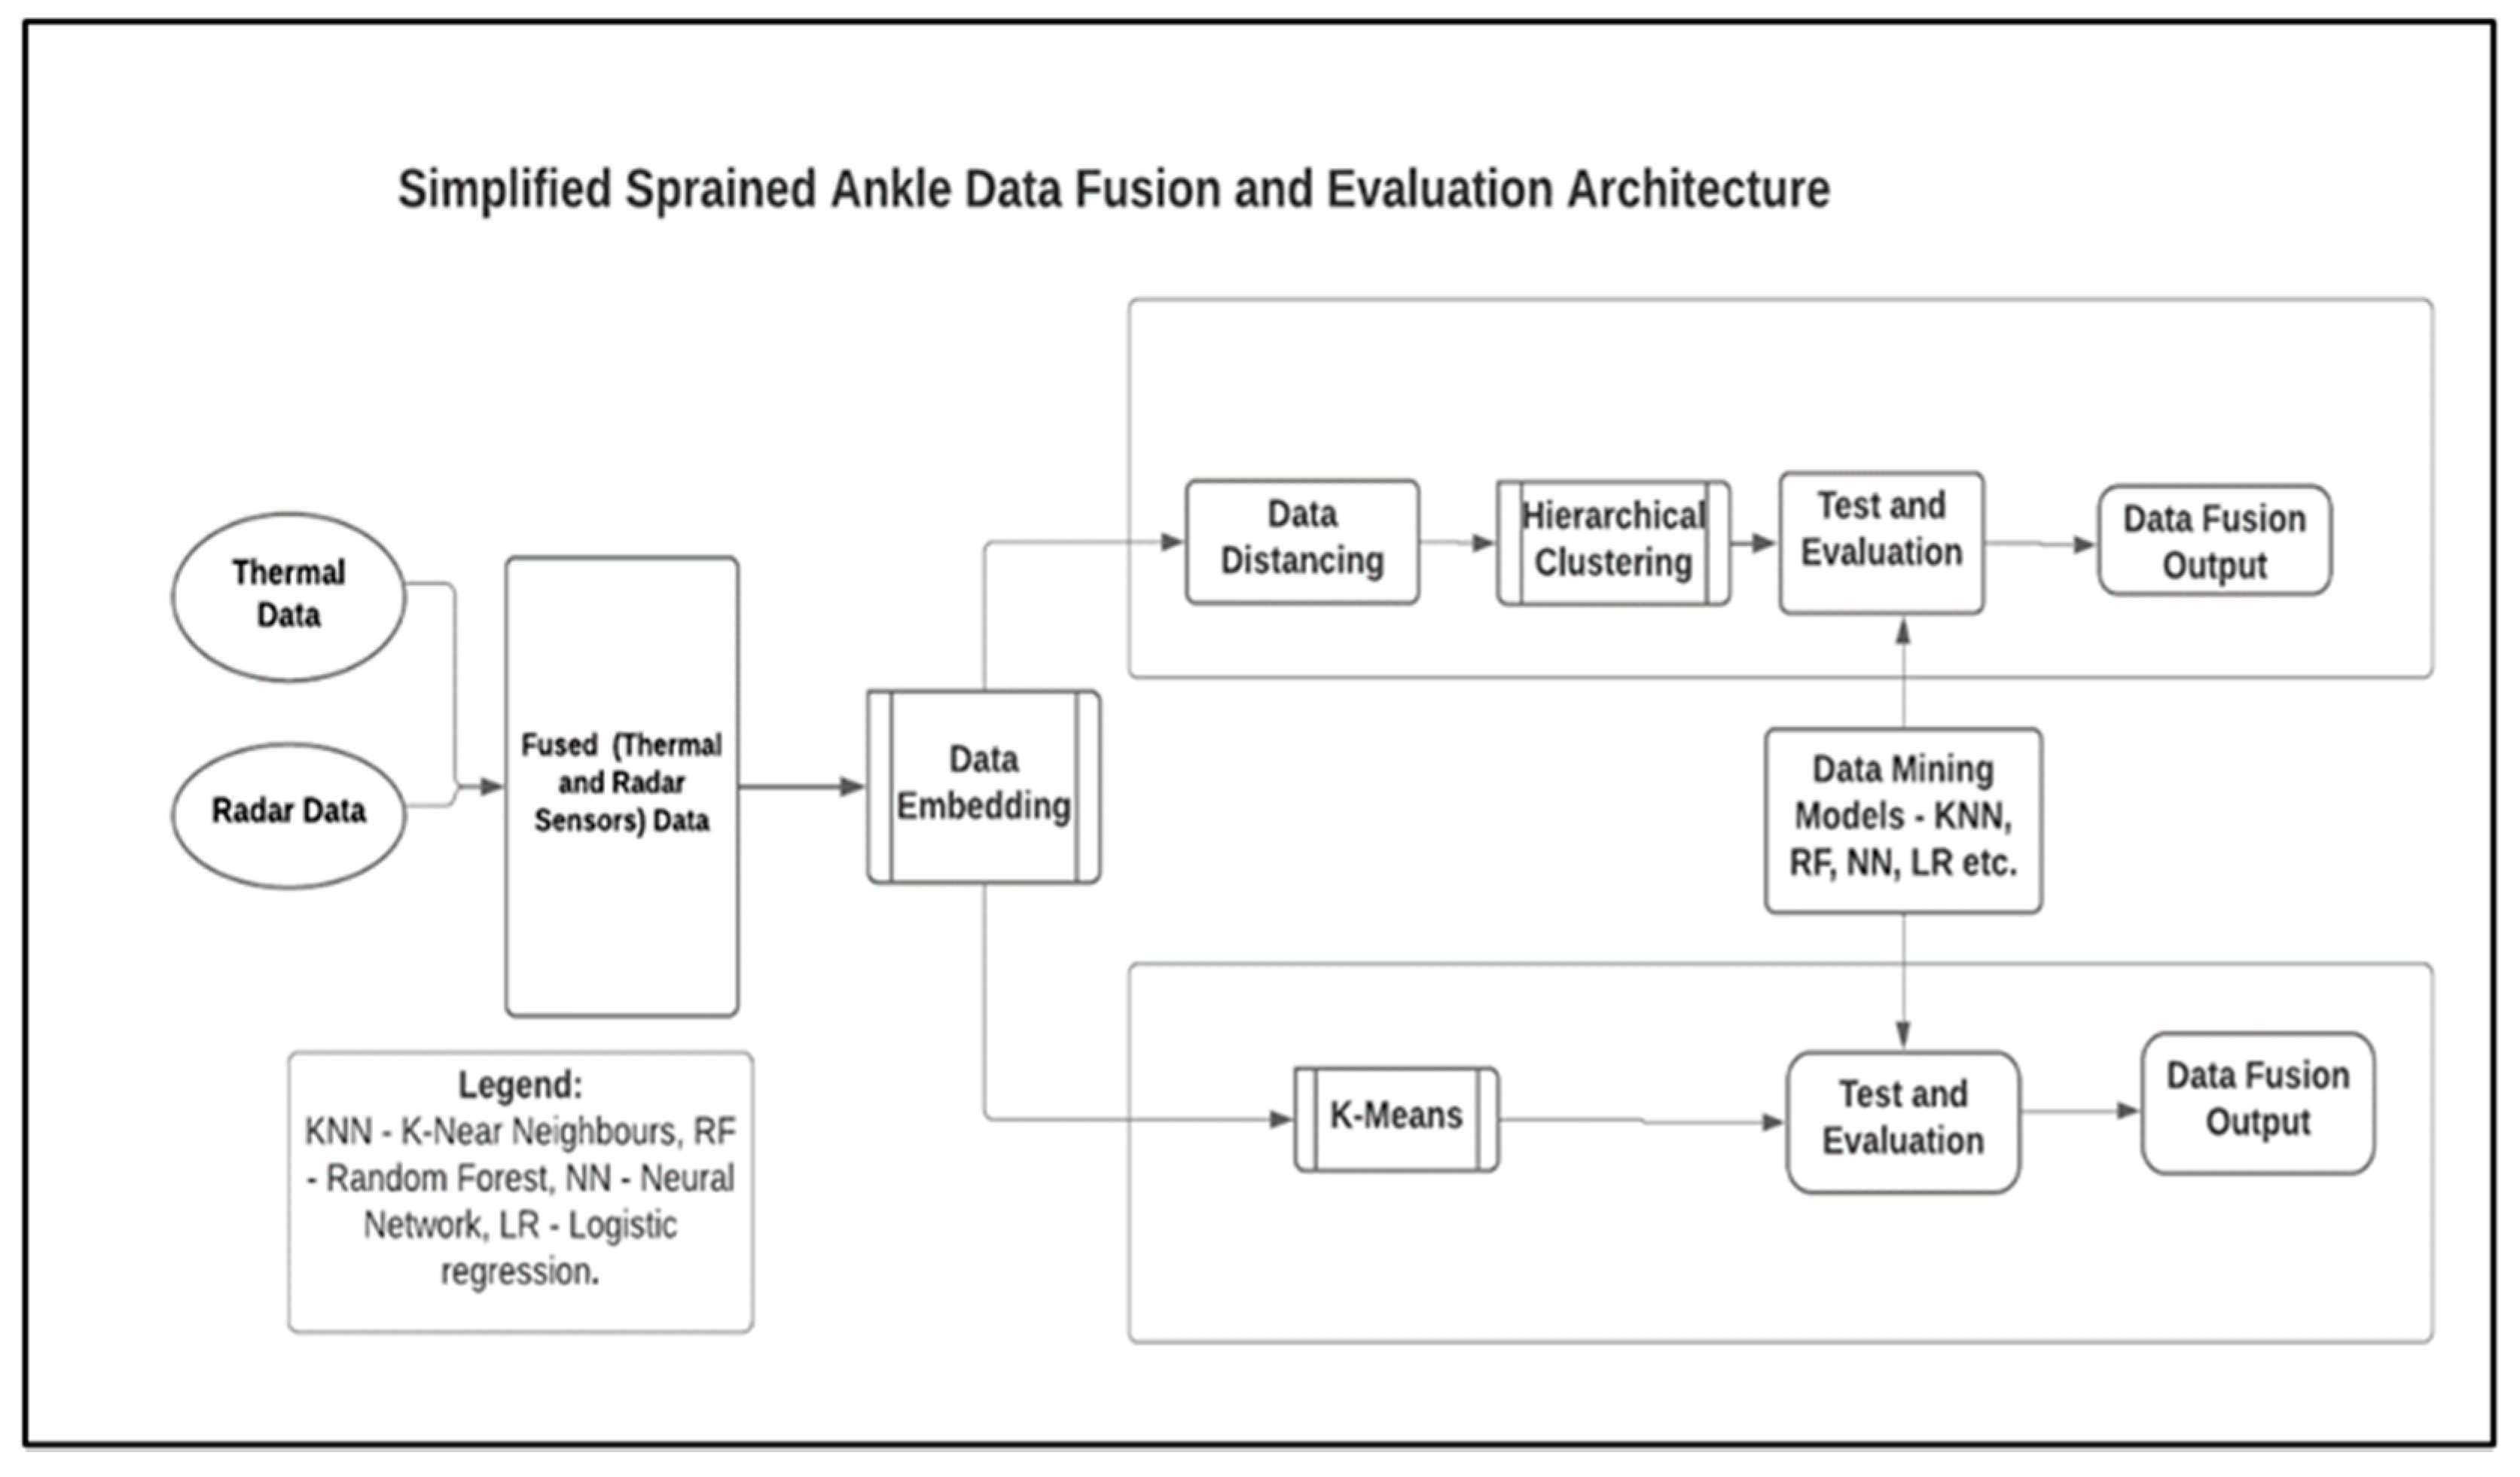
Data collected during this study were analysed using an SDF architecture referred to as Modified Distributed Sensor Data Fusion and Evaluation Architecture (MDSFEA) [23], as presented in Figure 2. The MDSFEA is an architecture suitable for data analysis ranging from homogeneous to heterogeneous datasets.
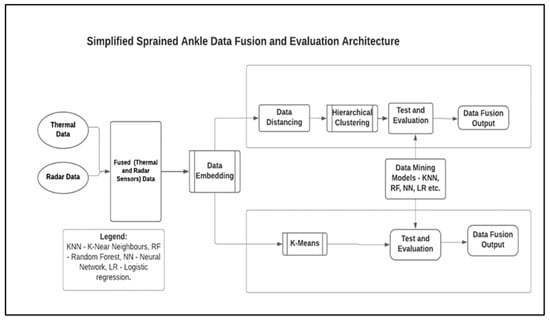
Figure 2.
The Sensor Data Fusion and Evaluation Architecture.
In Figure 2, data from thermal and radar SSs can be imported to the architecture with the help of the image and data import toolkits, respectively [47]. While the radar sensors data are stored in a CSV file, the thermal sensors data are stored as PNG files. Information such as the range of participants, speed, and the AAR from the radar SS were fused to the corresponding thermal images with the help of their timestamps using the data merging system. After the preliminary feature extraction that took place at the data merging system, Definitive Feature Extraction (DFE) began automatically. The DFE leveraged the data embedding toolkit to extract up to 1000 features from the datasets and represented them as vectors (n0 to n999) [48]. Although the MDSFEA description (in Figure 2) suits heterogeneous datasets such as those from thermal and radar SSs, it should be noted that the same architecture was used for the single and homogeneous datasets analysis.
Two main algorithms were used to further process the sensors datasets after the DFE stage namely, the HCA and the KMA. While the HCA used the Distance Toolbox (DT) to access the data embedder, the K-Means toolkit dissected the datasets (from the embedder) into clusters and conveyed them directly to the Test and Evaluation Toolkit (TET) (see Figure 2). The DT used Euclidean Distance Matrix (EDM) to further perform feature-based segregation on the datasets. The rationale for using the EDM includes the ability to perform distancing on raw data without previous analysis being affected by the addition of new data [49]. The HCA used Weighted Average Linkage (WAL) on the distanced features before the TET. The implementation of WAL on the datasets enhances feature prioritisation and the discriminant ability of the HCA algorithm [50,51,52]. DM models such as K-Nearest Neighbours (KNN), Support Vector Machine (SVM), Stochastic Gradient Descent (SGD), Random Forest (RF), and Neural Network (NN), amongst others, were used to evaluate the performance of the architecture.
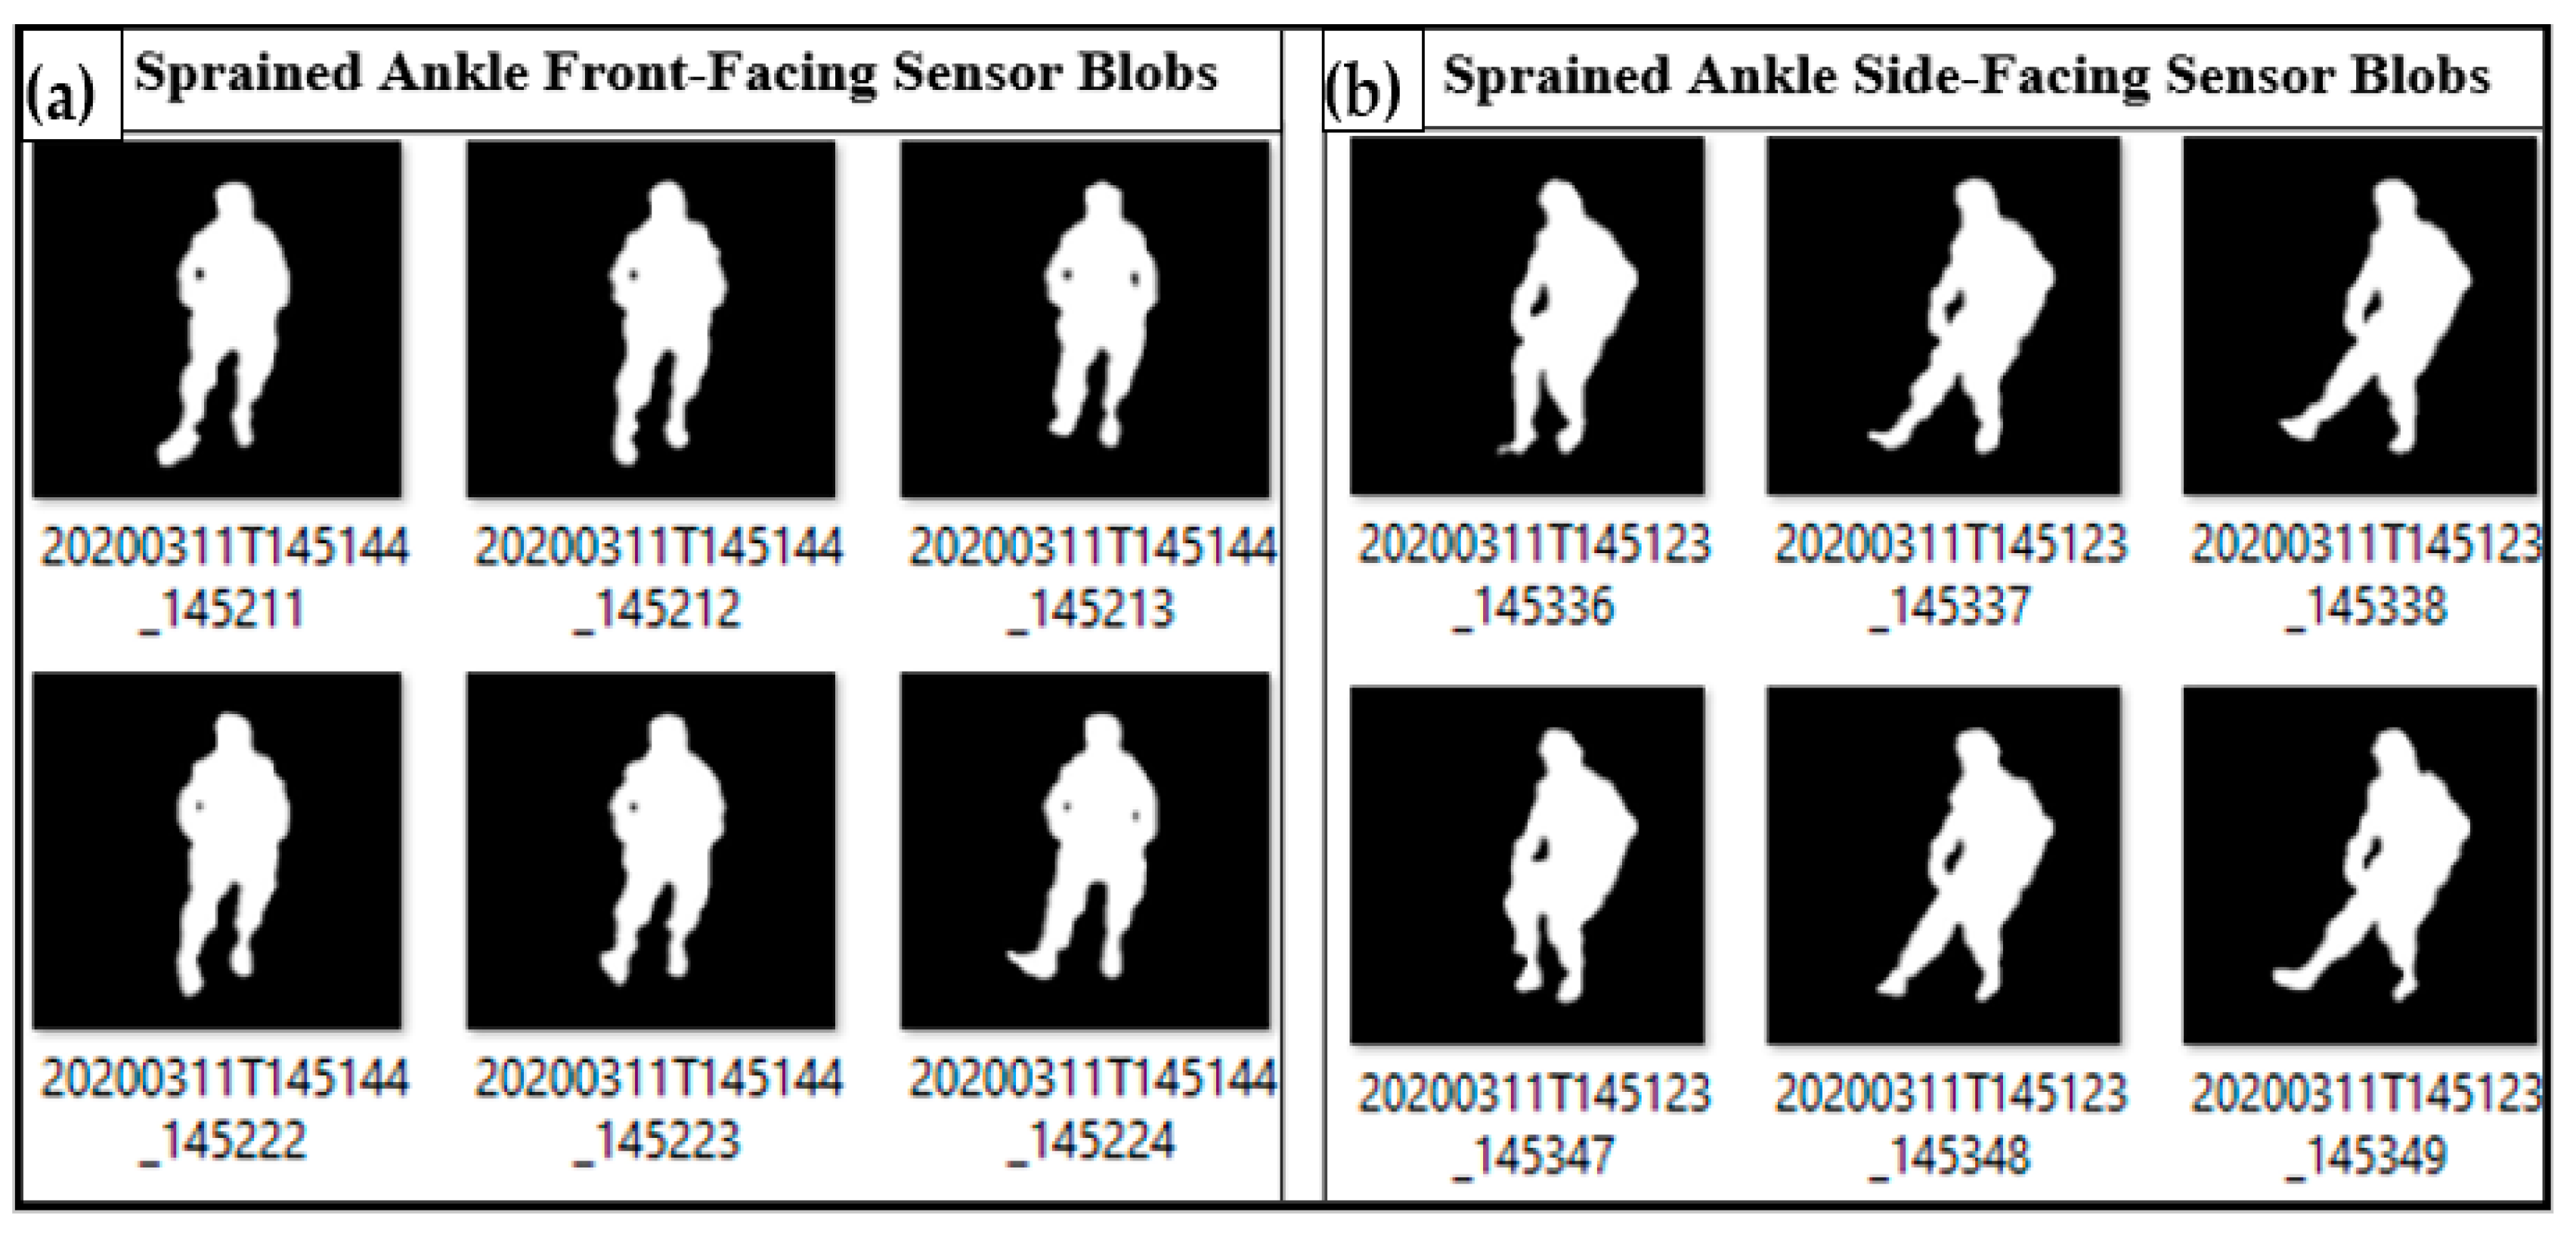
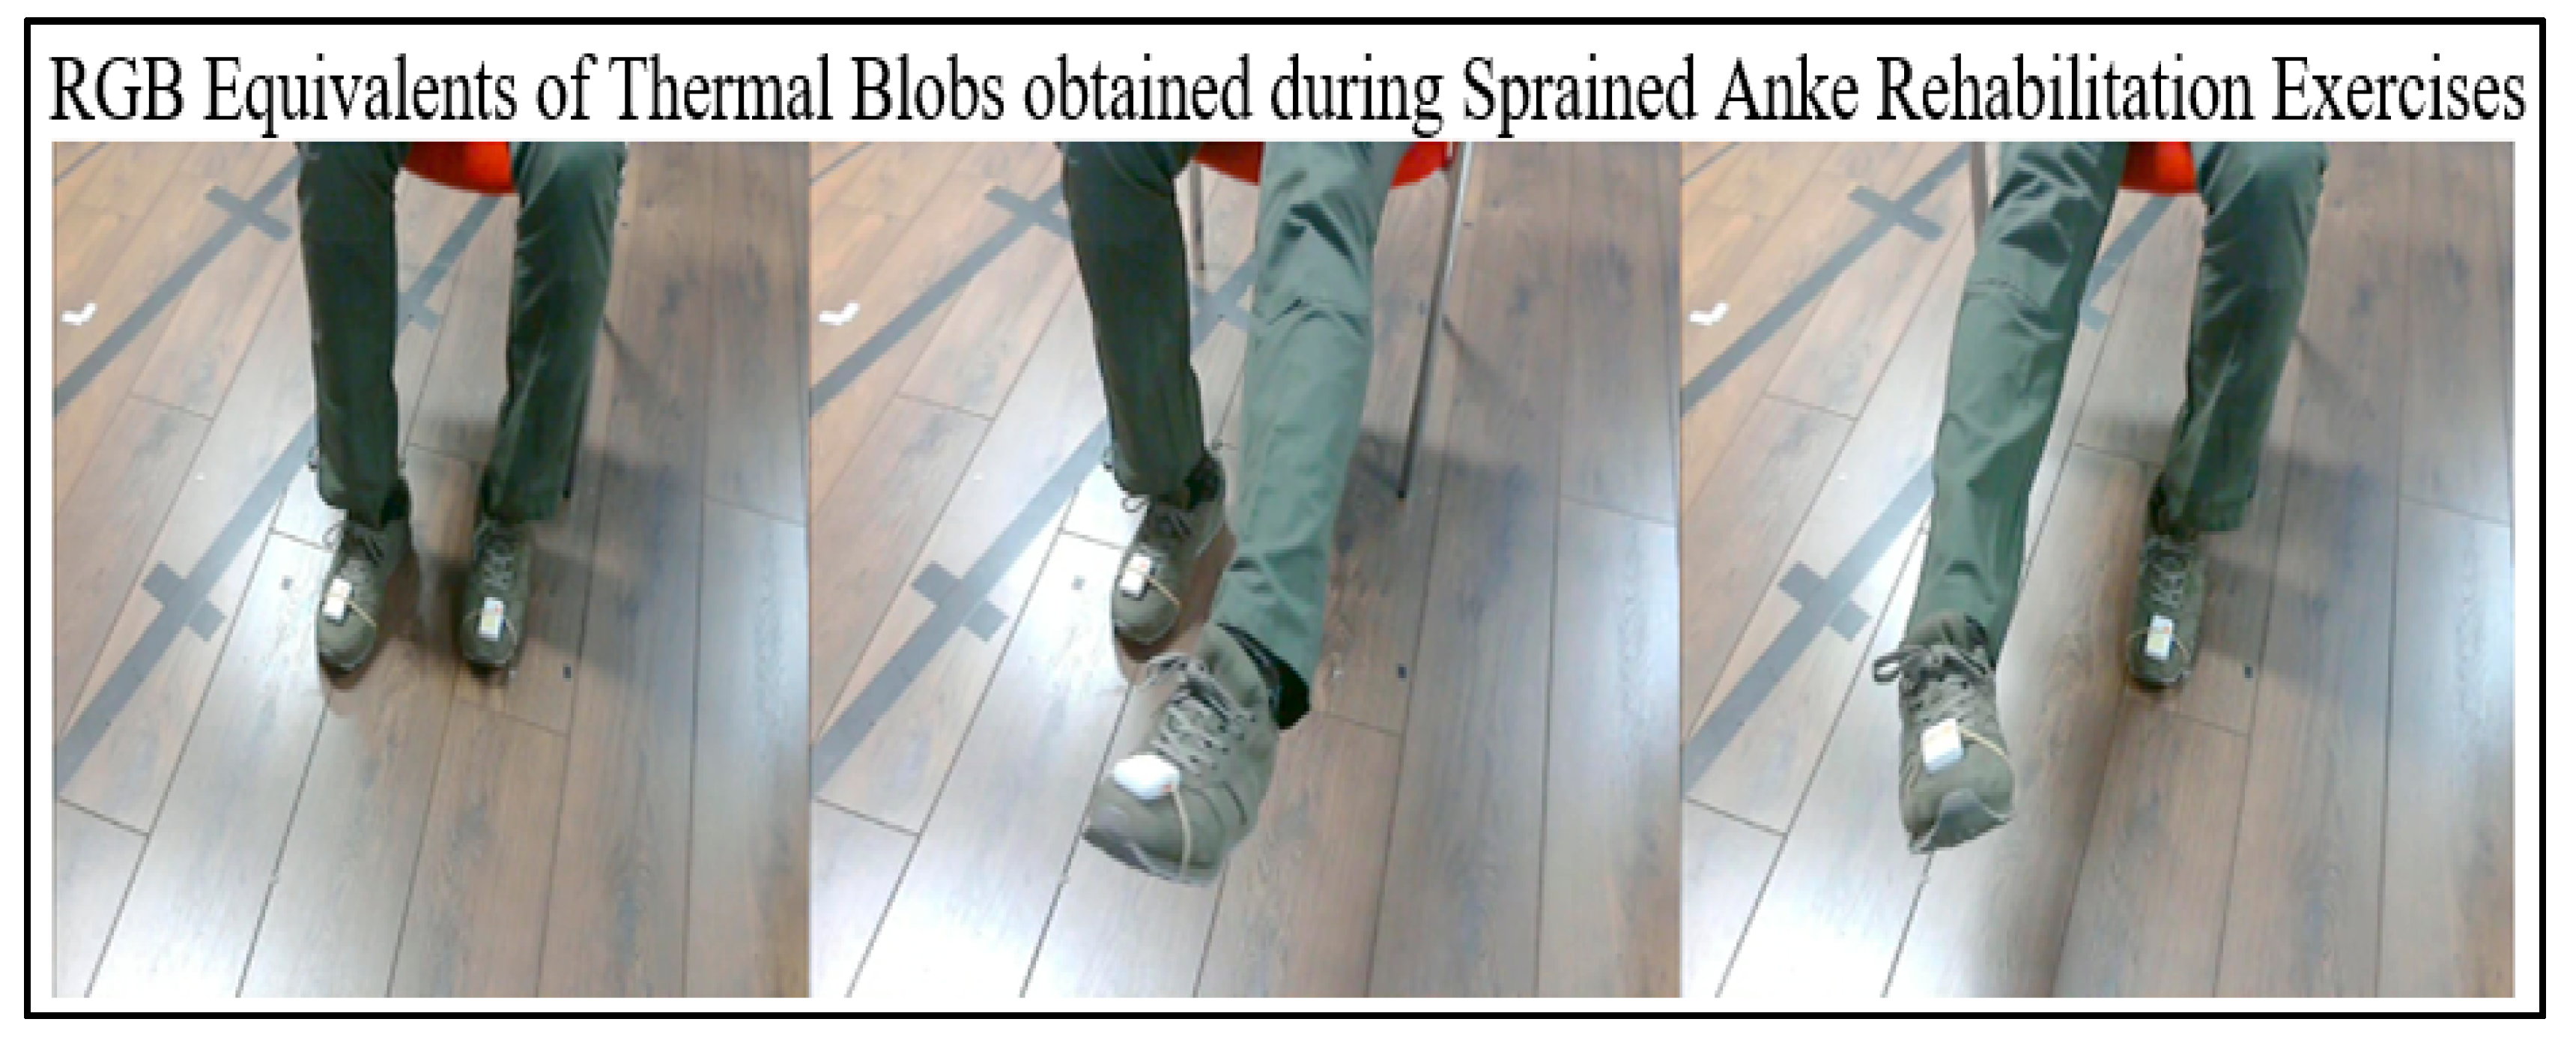
Thermal blobs from the ITA-32 thermal sensors were automatically binarised using a sequence of codes in MATLAB. To remove excess blobs from heating and electrical devices, a blob-based background subtraction algorithm was used [53,54,55]. Hence, the clear and distinct thermal blobs are presented in Figure 3a,b. The RGB equivalents demonstrating similar actions by the ITA thermal SS are shown in Figure 4.
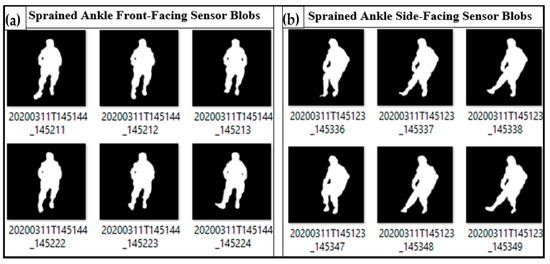
Figure 3.
Instances of right-ankle and foot dorsiflexion, plantarflexion, eversion, and inversion as recorded by ITA-32 thermal sensors: (a) thermal blobs from the front-facing camera and (b) thermal blobs from the side-facing camera.
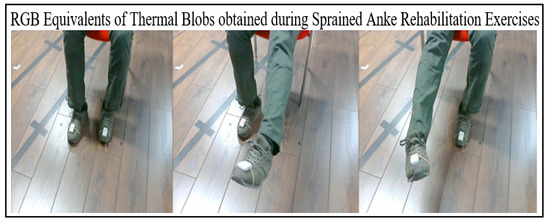
Figure 4.
RGB equivalents of the thermal images recorded during sprained ankle rehabilitation exercise. A Shimmer-3 accelerometer is worn on metatarsals (on both legs) for ground-truth velocity measurements.
4. Results
Data gleaned from the thermal SS indicated instances of the four directional movements on the right leg, as presented in Figure 3. To aid description, the last two digits of the thermal images’ timestamps are used for the analysis in this work. For example, thermal images code-named 20200311T145144_145211 and 20200311T145144_145222 (Figure 3a) are represented as T-11 and T-22, respectively.
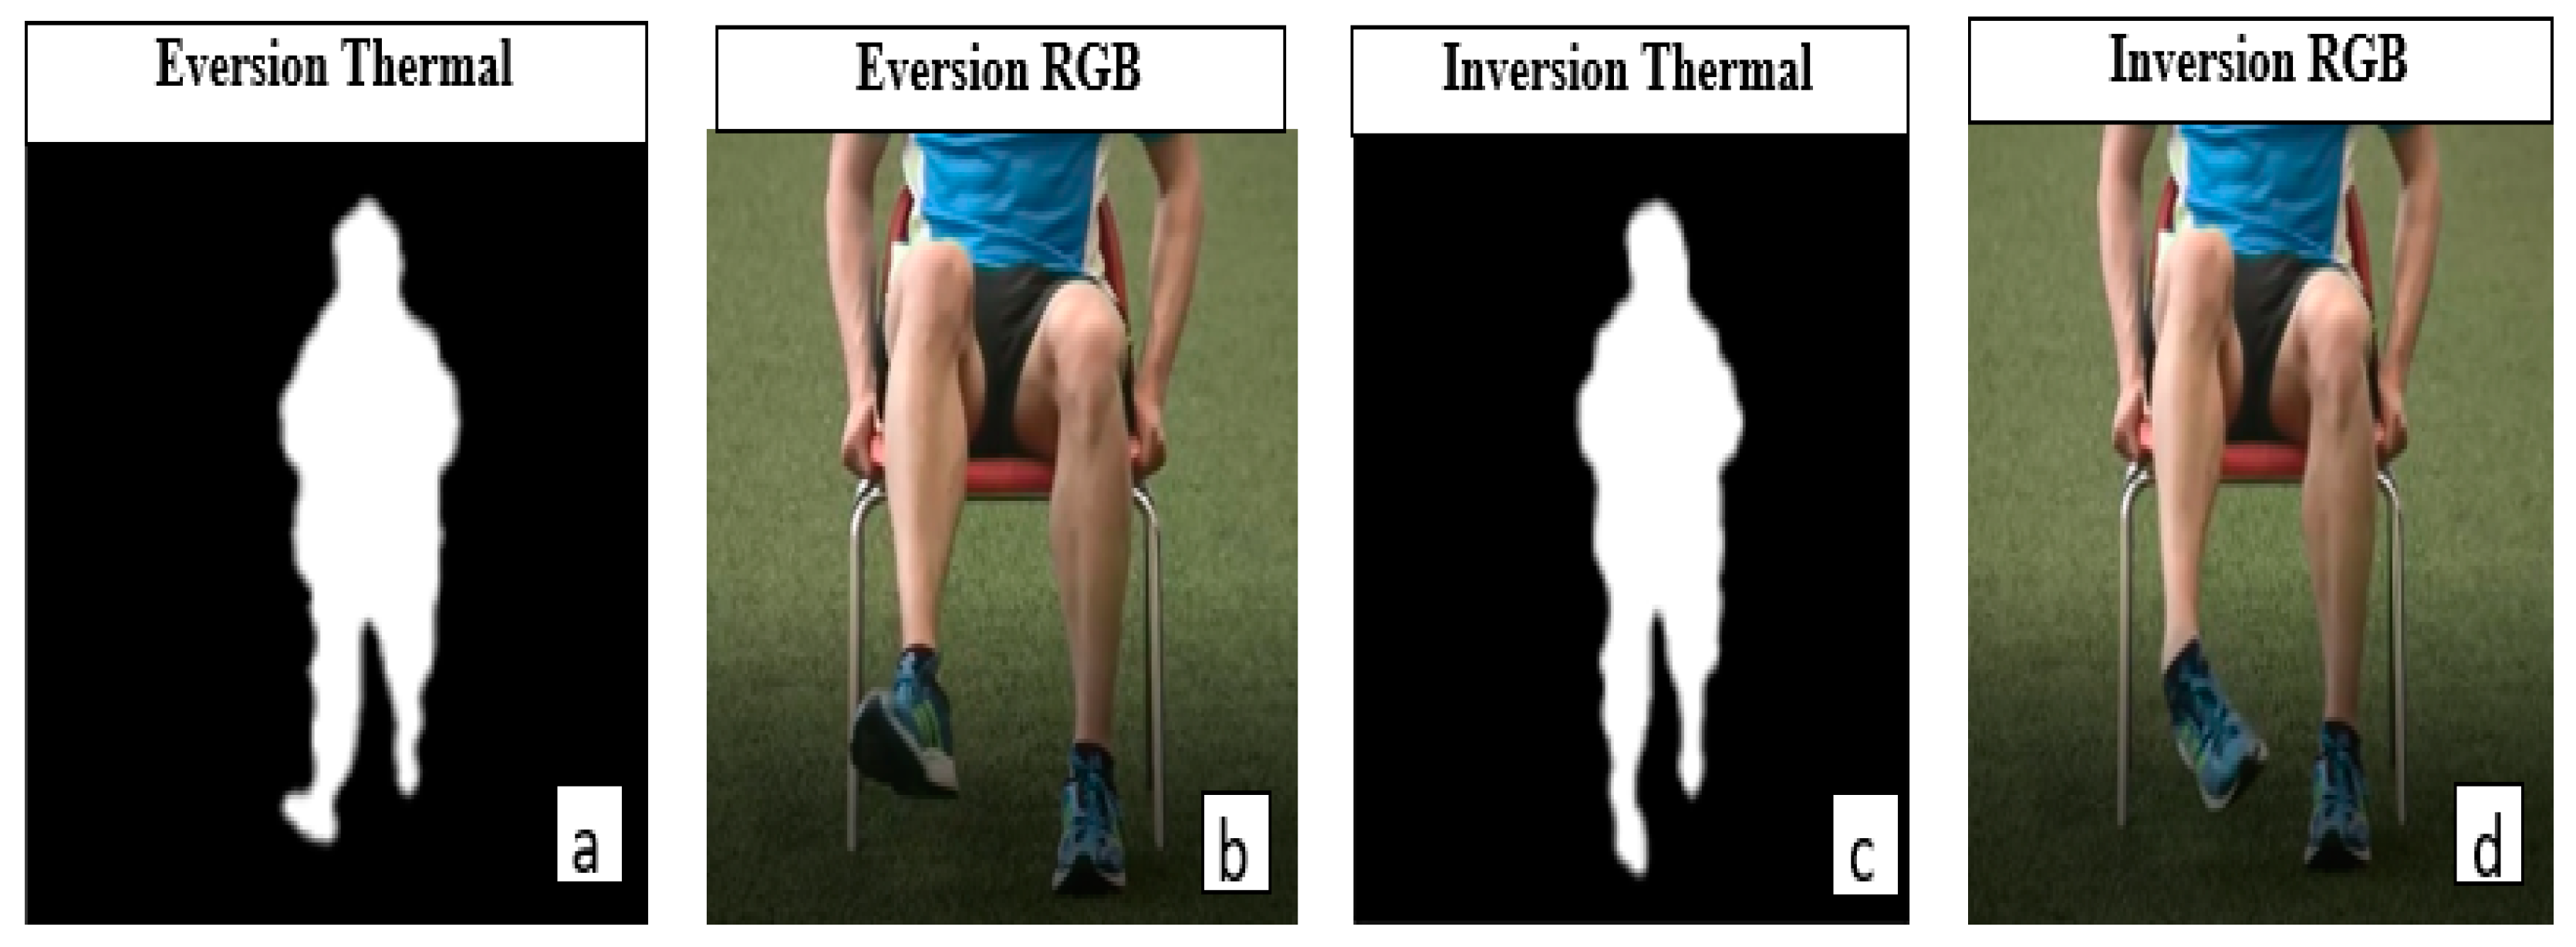
In Figure 3, T-11 and T-49 indicated instances of eversion; T-12, T-22, and T-48 presented instances of inversion. Furthermore, plantarflexion is observed in T-37, T-38, and T-49, while dorsiflexion is indicated in T-23 and T-24. The background subtraction and image binarisation algorithms utilised in this study enhanced the granularity of the images, thus helping to clarify the direction of the ankle and foot by eliminating heat blobs from other individuals and devices [53,55]. A comparison of instances of eversion and inversion of the ankle as recorded by an RGB and the ITA (thermal) sensors are presented in Figure 5.
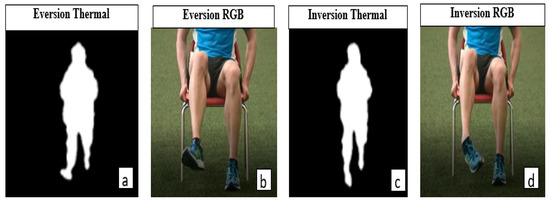
Figure 5.
Instances of eversion and inversion of the ankle as presented by RGB and ITA-32 thermal sensors. (a) An instance of eversion by an ITA-32 thermal sensor, (b) an instance of eversion by an RGB camera, (c) an instance of inversion by an ITA-32 thermal sensor, and (d) an instance of inversion by an RGB camera.
4.1. Single Dataset Analysis
On a single dataset analysis such as data from the front-facing ITA-32 thermal sensor, image embedding took place automatically after data import. This was followed by data distancing using the Inception-v3 Architecture (IV3A). The rationale for using IV3A included low computational requirements [56] and high performance in image analysis [57]. KMA and HCA were used simultaneously to perform CbyC on the datasets, and their results were evaluated using separate TETs. Moreover, while the K-Means toolbox was initialised with KMA to a maximum of 300 iterations, the hierarchical clustering toolkit used a 10-fold cross-validation function based on a 66% training set. The results of these analyses are presented in Table 2 and Table 3.

Table 2.
Evaluation results showing the accuracies of data mining models during Classification-by-Clustering of a set of sprained ankle rehabilitation exercises data using K-Means++ Algorithm (KMA).

Table 3.
Evaluation results showing the accuracies of data mining models during Classification-by-Clustering of a set of sprained ankle rehabilitation exercises data using the Hierarchical Clustering Algorithm (HCA).
A close comparison of Table 2 and Table 3 indicated that the best average accuracies of the metrics were obtained using the HCA. Although KMA with four models—NN, SVM, SGD, and LR—obtained an accuracy of more than 98% for AUC, CA, F1, Precision, and Recall, the accuracies obtained in CN2 inducer and AdaBoost affected the overall accuracy of KMA. CN2 rule inducer had the least accuracy values for all the metrics in both KMA and HCA, as presented in Table 2 and Table 3.
4.2. Homogeneous Sensor Data Fusion
On homogeneous data fusion involving the front-facing and side-facing thermal sensors, data from the sensors were fused using a Matching Pairs of Rows Method (MPoRM). The rationale for using the MPoRM is that it allows for the proper fusion of homogenous data without information mismatch [47,58]. With the help of the image-embedding toolkit and its SqueezeNet architecture, a lightweight convolutional neural network model for image recognition [23], the merged data were routed to the Louvain Clustering Toolbox (LCT). The LCT automatically discovered eight clusters from the fused dataset by performing Euclidean distancing and Principal Component Analysis (PCA). The rationale for using EDM includes the ability to perform distancing on raw data without previous analysis being affected by the addition of new data [49]. On the other hand, using PCA helps to improve the clustering of the dataset. It differs from Linear Discriminant Analysis (LDA) because it is a variance-based algorithm, whereas LDA is based on class information [59,60]. Moreover, PCA is best suited for unsupervised data clustering, such as that used in this analysis [23].
The KMA involving up to eight clusters and 300 iterations was used for clustering the unified data. The rationale for using K-Means included simplicity and the ability to increase similarities within clusters and reduce the same outside the group [61,62]. This includes defining and associating k centroids for each cluster. Therefore, with the help of the KMA, the DM models related to the TET were capable of computing the accuracies of the processes based on a 10-fold cross-validation and average over classes, as presented in Table 4.

Table 4.
Evaluation results of the front and side-facing ITA-32 thermal sensor data using a 10-fold cross-validation and the average of classes. The fused data were obtained during sprained ankle rehabilitation exercises.
From Table 4, it can be observed that SGD and NN scored more than 98% in all the parameters such as AUC, CA, F1, Precision, and Recall. An accuracy of more than 90% was obtained in KNN, Decision Tree, SVM, SGD, RF, NN, and LR in all their parameters presented in Table 4. While SGD had the highest accuracy of more than 99% in all the parameters, the CN2 rule inducer scored the least. A further breakdown of the latter indicated the least accuracy of 85.6% for AUC and approximately 72% in CA, F1, Precision, and Recall. The average accuracies for all parameters were more than 90%.
4.3. Heterogeneous Sensor Data Fusion
Heterogeneous sensor data such as those from the side-facing ITA-32 thermal and radar sensors were also fused using the data merging toolkit. These data were first uploaded and processed using the import toolkits before being merged using the matching row appending rule. The fusion outcome was trained using the VGG-19, which is a-19-layer image recognition algorithm [63]. The merged data were normalised and distanced using the Manhattan Distance Metric (MDM). The rationale for using the MDM instead of others such as the cosine rule, included the grid-like behaviour of the former, which is a useful characteristic when dealing with heterogeneous data [64]. The accuracies of the CbyC with respect to heterogeneous data fusion are presented in Table 5.

Table 5.
Evaluation results of ITA-32 thermal and FMCW radar sensor data using a stratified 10-fold cross-validation and the average of classes. The fused data were obtained during sprained ankle rehabilitation exercises.
As presented in Table 5, Stratified Cross-Validation (SCV) involved dividing the data into smaller sub-groups (strata). The rationale for using the SCV includes their ability to identify shared attributes in a dataset [64,65,66]. Moreover, all the metrics returned an average accuracy of more than 96%.
A further test on the averages of the models from Table 2, Table 3, Table 4 and Table 5 represented as KMA-A, HCA-A, SF-Fusion, and Rad-T Fusion, respectively, is presented in Table 6. The models considered were KNN, Decision Tree, SVM, SGD, RF, NN, Naives Bayes, and AdaBoost. However, models that were not common to the tested models in a column were excluded from the test. The rationale for excluding them was to achieve a balanced and unbiased dataset at each instance. Considering the averages presented in Table 6, the highest average accuracy value was obtained in Rad-T Fusion as 96.9%.

A two-sample T-Test of the KMA-A values and the HCA-A values at 95% confidence interval indicated that there was no significant difference (p = 0.448) between the samples. This implied that the accuracy values obtained in Table 2 and Table 3 were within a close range. On the other hand, a two-sample T-Test of the KMA-A and the Rad-T Fusion values (Table 6) indicated a significant difference between the values (p = 0.032). Similarly, a two-sample T-Test between SF-Fusion and Rad-T values also showed a significant difference between the values (p = 0.034). The significant differences (p = 0.032 and p = 0.034) obtained in the two instances involving Rad-T indicated that the accuracy values of the heterogeneous sensor fusion datasets (in Table 5) were distinct and different from those obtained from the homogenous and single datasets. Hence, a descriptive analysis of the parameters in Table 6 (KMA-A, HCA-A, SF-Fusion, and Rad-T Fusion) based on one-way ANOVA is presented in Table 7. The row containing Naive Bayes was not included in the computation of the mean because of the non-availability of a value for HCA-A.

Table 7.
Descriptive analysis of KMA-A, HCA-A, SF-Fusion, and Rad-T Fusion average values.
In Table 7, one-way ANOVA involving KMA-A, HCA-A, SF-Fusion, and Rad-T Fusion indicated the latter (Rad-T Fusion) as the parameter with the highest range of values at 95% confidence interval. From the result, Rad-T Fusion still maintained its highest average value. It also has the least standard deviation of 3.9, which further indicated the proximity of its values.
5. Discussion
5.1. Discussion on Research Findings
The average results in Table 6 and Table 7 indicated that the highest average percentage accuracy was obtained in the heterogeneous datasets involving thermal and radar SS as 96.9%. Hence, it can be suggested that complementary monitoring involving heterogeneous SSs, such as the approach demonstrated in this study, yields higher accuracy compared with a single or homogeneous monitoring solution.
SPAREs using USSs such as the MC-FMCW-M radar and ITA-32 thermal SSs offers the ability to visualise the movement of the ankle in the four fundamental movements of the human ankle. The level of details such as the direct computation of the speed and range of motion of the ankle presents the FMCW radar variants as better alternatives to wearables such as the S3BAs, which are not capable of direct computation of speed. In addition, the privacy-friendly images obtained from the ITA-32 thermal SS are best suited for home-based monitoring compared with the RGB images produced by video cameras, which can negatively affect their users’ privacy.
5.2. Comparison of the Present Work with Related Work
Data gleaned from the USSs in this work required less storage space, less computational time, and fewer resources compared with the RGB-based approach proposed in [36]. Additionally, our approach is privacy-friendly compared with the work in [38]. Compared to similar research in [67,68], our work utilised a cluster-based approach; it computes the accuracy of the clustered datasets and compares results from single, homogeneous, and heterogeneous datasets using statistical methods such as T-Test and ANOVA. Although the use of wearables in SPAREs proposed in [7,26] has been shown to provide high usability and accuracy, our approach featured additional information such as participants’ postures, which can help therapists determine if SPAREs have been performed as prescribed. Additionally, frequent (re)charging processes, which can result in data loss or disruption, were not required in our work, since the sensors were plugged in to AC supply. Hence, the proposed USSs are better candidates for home-based monitoring of SPAREs compared with wearables such as the battery-powered gyro-based systems.
Whilst some research [8,29,69] in SPAREs has been through human observation without a clear indication of the monitoring accuracy, the present work indicated the accuracy of the monitoring processes. Another advantage of this work is the use of heterogeneous USSs compared with wearables proposed in [7,26,70], which could be a source of discomfort to the technology users.
The MDSFEA proposed in the present work offered added advantages in feature extraction, visualisation, and model evaluation compared with the widely used method in [26,71]. Instead of processing each model separately, which can be time consuming, the models all learnt from the TETs and simultaneously produced comprehensive results on the TETs. The fusion of data from the SSs gives useful and additional information such as the speed and the AAR of the ankle at every second during the exercise. Information such as the posture, speed, range, and the AAR related to the ankle movement during SPARE can help physiotherapists ascertain if exercises have been performed as prescribed.
5.3. Limitations of the Present Work
One of the limitations of this study is that homogeneous data fusion involving the front-facing and the side-facing ITA-32 thermal sensors did not produce evaluation results with HCA when the datasets were fused with MPoRM. This issue was resolved by using the “instance IDs” of the datasets for results scoring and evaluation. Another limitation is that ML models such as LR and Naive Bayes were not computed for all dataset types. The rationale for this exclusion included their incompatibility with the datasets and the data fusion algorithms.
6. Conclusions
This paper presented the use of privacy-friendly USSs such as thermal and radar sensors to monitor SPAREs in home environments. Data gleaned from the USSs were analysed and fused using the MDSFEA on instances involving single, homogeneous, and heterogeneous SS. Experimental results from model averages indicated mean accuracy values of 91.9%, 92.4%, 92.0%, and 96.9% for KMA-A, HCA-A, SF-Fusion, and Rad-T Fusion, respectively, with models such as KNN, Decision Tree, SVM, SGD, RF, NN, Naïve Bayes, and CN2 inducer. Descriptive analysis of the model averages further indicated that the highest average percentage accuracy was obtained in the heterogeneous datasets involving thermal and radar sensors, demonstrating the added advantages of using heterogeneous USSs and data fusion in home-based SPAREs.
Author Contributions
Conceptualisation, I.E. and C.N.; methodology, I.E.; software, I.E.; validation, M.G.-C. and C.N.; formal analysis, I.E.; investigation, I.E. and M.G.-C.; resources, C.N.; data curation, I.E. and M.G.-C.; writing—original draft preparation, I.E.; writing—review and editing, Y.D.-S. and M.G.-C.; visualisation, M.G.-C.; supervision, C.N. and J.M.; project administration, C.N.; funding acquisition, J.M. All authors have read and agreed to the published version of the manuscript.
Funding
EU’s INTERREG VA program, IVA5034.
Institutional Review Board Statement
Not Applicable.
Informed Consent Statement
Not Applicable.
Data Availability Statement
Not Applicable.
Acknowledgments
Research is funded by the EU’s INTERREG VA program, managed by the Special EU Program Body (SEUPB).
Conflicts of Interest
The authors declare no conflict of interest.
References
- Gladman, J.; Forster, A.; Young, J. Hospital- and Home-Based Rehabilitation after Discharge from Hospital for Stroke Patients: Analysis of Two Trials. Age Ageing 1995, 24, 49–53. [Google Scholar] [CrossRef] [PubMed]
- Schuhfried, O.; Crevenna, R.; Fialka-Moser, V.; Paternostro-Sluga, T. Non-Invasive Neuromuscular Electrical Stimulation in Patients with Central Nervous System Lesions: An Educational Review. J. Rehabil. Med. 2012, 44, 99–105. [Google Scholar] [CrossRef] [PubMed]
- Anderson, L.; Sharp, G.; Norton, R.; Zawada, J.; Dalal, H.; Dean, S.; Jolly, K.; Cowie, A.; Taylor, R. Home-based versus Centre-based Cardiac Rehabilitation. Cochrane Database Syst. Rev. 2017. [Google Scholar] [CrossRef]
- Tajuddin, A.; Zukifley, M.A.; Hussain, A.; Mustafa, M.M. Post-Stroke Rehabilitation: Stick Exercise Monitoring Using Kalman Filter. J. Teknol. 2015, 77, 7–11. [Google Scholar] [CrossRef][Green Version]
- Ekerete, I.; Giggins, O.M.; Cleland, I.; Nugent, C.; McLaughlin, J. Unobtrusive Monitoring of Home-Based Post-Stroke Rehabilitation Exercises Using Heterogeneous Sensors. In Proceedings of the 2019 IEEE EMBS International Conference on Biomedical & Health Informatics (BHI), Chicago, IL, USA, 19–22 May 2019. [Google Scholar]
- Ee Chin, L.C.; Basah, S.N.; Affandi, M.; Shah, M.N.; Yaacob, S.; Ewe Juan, Y.; Din, M.Y. Home-Based Ankle Rehabilitation System: Literature Review and Evaluation. J. Teknol. 2017, 79. [Google Scholar] [CrossRef]
- Azizi, M.A.R.; Jaafar, A.; Osman, K. Performance Analysis for Sprain Ankle Rehabilitation System Using Gyro Sensor. Int. J. Adv. Sci. Technol. 2020, 29, 860–872. [Google Scholar]
- Hecht, M. 15 Exercises for Your Sprained Ankle. Available online: www.journalofathletictraining.org (accessed on 29 August 2020).
- NHS Ankle Sprain Advice. Oxford Univ. Hosp. 2015.
- Den, B. Rehabilitation Protocol Ankle Sprain. Twin Cities Orthop. 2009, 3–8. [Google Scholar]
- Motti, V.G. Wearable Health: Opportunities and Challenges. In Proceedings of the 13th EAI International Conference on Pervasive Computing Technologies for Healthcare, ACM, Trento, Italy, 20–23 May 2019; pp. 356–359. [Google Scholar] [CrossRef]
- Gharghan, S.K.; Mohammed, S.L.; Al-Naji, A.; Abu-AlShaeer, M.J.; Jawad, H.M.; Jawad, A.M.; Chahl, J. Accurate Fall Detection and Localization for Elderly People Based on Neural Network and Energy-Efficient Wireless Sensor Network. Energies 2018, 11, 2866. [Google Scholar] [CrossRef]
- Choi, Y.; Yoo, K.; Kang, S.J.; Seo, B.; Kim, S.K. Development of a Low-Cost Wearable Sensing Glove with Multiple Inertial Sensors and a Light and Fast Orientation Estimation Algorithm. J. Supercomput. 2018, 74, 3639–3652. [Google Scholar] [CrossRef]
- Veena, S. A Survey on Sensor Tools for Healthcare Applications. Int. J. Res. Appl. Sci. Eng. Technol. 2018, 6, 1702–1705. [Google Scholar] [CrossRef]
- Kepski, M.; Kwolek, B. Event-Driven System for Fall Detection Using Body-Worn Accelerometer and Depth Sensor. IET Comput. Vis. 2018, 12, 48–58. [Google Scholar] [CrossRef]
- Milosevic, B.; Leardini, A.; Farella, E. Kinect and Wearable Inertial Sensors for Motor Rehabilitation Programs at Home: State of the Art and an Experimental Comparison. Biomed. Eng. Online 2020, 19, 1–26. [Google Scholar] [CrossRef]
- Noorkõiv, M.; Rodgers, H.; Price, C.I. Accelerometer Measurement of Upper Extremity Movement after Stroke: A Systematic Review of Clinical Studies. J. Neuroeng. Rehabil. 2014, 11, 1–11. [Google Scholar] [CrossRef] [PubMed]
- Ouchi, K.; Doi, M. Smartphone-Based Monitoring System for Activities of Daily Living for Elderly People and Their Relatives Etc. In Proceedings of the 2012 IEEE 11th International Conference on Cybernetic Intelligent Systems (CIS), Limerick, Ireland, 23–24 August 2012; pp. 103–106. [Google Scholar]
- Wagenaar, R.C.; Sapir, I.; Zhang, Y.; Markovic, S.; Vaina, L.M.; Little, T.D.C. Continuous Monitoring of Functional Activities Using Wearable, Wireless Gyroscope and Accelerometer Technology. In Proceedings of the 2011 Annual International Conference of the IEEE Engineering in Medicine and Biology Society, Boston, MA, USA, 30 August–3 September 2011; pp. 4844–4847. [Google Scholar]
- Casaburi, R. Activity Monitoring in Assessing Activities of Daily Living. COPD: J. Chronic Obstr. Pulm. Dis. 2007, 4, 251–255. [Google Scholar] [CrossRef] [PubMed]
- Kang, D.W.; Choi, J.S.; Lee, J.W.; Chung, S.C.; Park, S.J.; Tack, G.R. Real-Time Elderly Activity Monitoring System Based on a Tri-Axial Accelerometer. Disabil. Rehabil. Assist. Technol. 2010, 5, 247–253. [Google Scholar] [CrossRef]
- Mannini, A.; Sabatini, A.M. On-Line Classification of Human Activity and Estimation of Walk-Run Speed from Acceleration Data Using Support Vector Machines. In Proceedings of the Annual International Conference of the IEEE Engineering in Medicine and Biology Society, Boston, MA, USA, 30 August–3 September 2011; pp. 3302–3305. [Google Scholar]
- Ekerete, I.F.; Garcia-Constantino, M.; Diaz, Y.; Giggins, O.M.; Mustafa, M.A.; Konios, A.; Pouliet, P.; Nugent, C.D.; McLaughlin, J. Data Mining and Fusion of Unobtrusive Sensing Solutions for Indoor Activity Recognition. In Proceedings of the 2020 42nd Annual International Conference of the IEEE Engineering in Medicine & Biology Society (EMBC), Montreal, QC, Canada, 20–24 July 2020; pp. 5357–5361. [Google Scholar] [CrossRef]
- Konios, A.; Garcia-Constantino, M.; Christopoulos, S.-R.G.; Mustafa, M.A.; Ekerete, I.; Shewell, C.; Nugent, C.; Morrison, G. Probabilistic Analysis of Temporal and Sequential Aspects of Activities of Daily Living for Abnormal Behaviour Detection. In Proceedings of the 2019 IEEE SmartWorld, Ubiquitous Intelligence & Computing, Advanced & Trusted Computing, Scalable Computing & Communications, Cloud & Big Data Computing, Internet of People and Smart City Innovation (SmartWorld/SCALCOM/UIC/ATC/CBDCom/IOP/SCI), Leicester, UK, 19–23 August 2019; pp. 723–730. [Google Scholar] [CrossRef]
- Rodriguez-Ayllon, M.; Esteban-Cornejo, I.; Verdejo-Román, J.; Muetzel, R.L.; Migueles, J.H.; Mora-Gonzalez, J.; Solis-Urra, P.; Erickson, K.I.; Hillman, C.H.; Catena, A.; et al. Physical Activity, Sedentary Behavior, and White Matter Microstructure in Children with Overweight or Obesity. Med. Sci. Sports Exerc. 2020, 52, 1218–1226. [Google Scholar] [CrossRef] [PubMed]
- Gómez-Espinosa, A.; Espinosa-Castillo, N.; Valdés-Aguirre, B. Foot-Mounted Inertial Measurement Units-Based Device for Ankle Rehabilitation. Appl. Sci. 2018, 8, 2032. [Google Scholar] [CrossRef]
- Xia, D.; Chen, S.; Wang, S.; Li, H. Microgyroscope Temperature Effects and Compensation-Control Methods. Sensors 2009, 9, 8349–8376. [Google Scholar] [CrossRef]
- Boukhenous, S.; Benbakhti, A.; Touchen, A.; Attari, M. A 2DOF Platform for Ankle Sprain Rehabilitation. In Proceedings of the 2013 International Conference on Electronics, Computer and Computation, Ankara, Turkey, 7–9 November 2013; pp. 25–27. [Google Scholar]
- Alcocer, W.; Vela, L.; Blanco, A.; Gonzalez, J.; Oliver, M. Major Trends in the Development of Ankle Rehabilitation Devices. Dyna 2012, 79, 45–55. [Google Scholar]
- Chang, Y.; Chen, S.; Huang, J. Research in Developmental Disabilities A Kinect-Based System for Physical Rehabilitation : A Pilot Study for Young Adults with Motor Disabilities. Res. Dev. Disabil. 2011, 32, 2566–2570. [Google Scholar] [CrossRef] [PubMed]
- Yamamoto, S.; Karkee, M.; Kobayashi, Y.; Nakayama, N.; Tsubota, S.; Thi Thanh, L.N.; Konya, T. 3D Reconstruction of Apple Fruits Using Consumer-Grade RGB-Depth Sensor. Eng. Agric. Environ. Food 2018, 11, 159–168. [Google Scholar] [CrossRef]
- Hg, R.I.; Jasek, P.; Rofidal, C.; Nasrollahi, K.; Moeslund, T.B.; Tranchet, G. An RGB-D Database Using Microsoft’s Kinect for Windows for Face Detection. In Proceedings of the 2012 Eighth International Conference on Signal Image Technology and Internet Based Systems, Naples, Italy, 25–29 November 2012; pp. 42–46. [Google Scholar]
- Martin Martin, R.; Lorbach, M.; Brock, O. Deterioration of Depth Measurements Due to Interference of Multiple RGB-D Sensors. In Proceedings of the 2014 IEEE/RSJ International Conference on Intelligent Robots and Systems, Chicago, IL, USA, 14–18 September 2014; pp. 4205–4212. [Google Scholar] [CrossRef]
- Riquelme, F.; Espinoza, C.; Rodenas, T.; Minonzio, J.G.; Taramasco, C. Ehomeseniors Dataset: An Infrared Thermal Sensor Dataset for Automatic Fall Detection Research. Sensors 2019, 19, 4565. [Google Scholar] [CrossRef]
- Kadambi, A.; Bhandari, A.; Raskar, R. 3D Depth Cameras in Vision: Benefits and Limitations of the Hardware. In Computer Vision and Machine Learning with RGB-D Sensors; Springer: Cham, Switzerland, 2014; pp. 3–26. [Google Scholar] [CrossRef]
- Arvinen-Barrow, M.; Maresh, N.; Earl-Boehm, J. Functional Outcomes and Psychological Benefits of Active Video Games in the Rehabilitation of Lateral Ankle Sprains: A Case Report. J. Sport Rehabil. 2020, 29, 213–224. [Google Scholar] [CrossRef] [PubMed]
- Punt, I.M.M.; Ziltener, J.-L.L.; Monnin, D.; Allet, L. Wii FitTM Exercise Therapy for the Rehabilitation of Ankle Sprains: Its Effect Compared with Physical Therapy or No Functional Exercises at All. Scand. J. Med. Sci. Sports 2016, 26, 816–823. [Google Scholar] [CrossRef] [PubMed]
- Garcia, J.A.J.A.; Navarro, K.F.K.F. The Mobile RehAppTM: An AR-Based Mobile Game for Ankle Sprain Rehabilitation. In Proceedings of the 2014 IEEE 3nd International Conference on Serious Games and Applications for Health (SeGAH), Rio de Janeiro, Brazil, 14–16 May 2014. [Google Scholar]
- Kozarski, Ł.; Kuźma, T.; Pisz, A.; Łabuz-Roszak, B.; Kozarska, M.; Szindler, M.; Roszak, M. Visualisation of Ankle Injury Using a Thermal Imaging Camera. Arch. Mater. Sci. Eng. 2016, 80, 59–63. [Google Scholar] [CrossRef][Green Version]
- Bleakley, C.M.C.M.; Taylor, J.B.J.B.; Dischiavi, S.L.S.L.; Doherty, C.; Delahunt, E. Rehabilitation Exercises Reduce Reinjury Post Ankle Sprain, But the Content and Parameters of an Optimal Exercise Program Have Yet to Be Established: A Systematic Review and Meta-Analysis. Arch. Phys. Med. Rehabil. 2019, 100, 1367–1375. [Google Scholar] [CrossRef]
- McKeon, P.O.; Donovan, L. A Perceptual Framework for Conservative Treatment and Rehabilitation of Ankle Sprains: An Evidence-Based Paradigm Shift. J. Athl. Train. 2019, 54, 628–638. [Google Scholar] [CrossRef]
- Gustafsson, K.; Fältström, A.; Öberg, U.; Kammerlind, A.S.A.-S. Written Instructions versus Physiotherapist-Supervised Rehabilitation after Acute Ankle Sprain. Eur. J. Physiother. 2017, 19, 76–83. [Google Scholar] [CrossRef]
- Delahunt, E.; Bleakley, C.M.; Bossard, D.S.; Caulfield, B.M.; Docherty, C.L.; Doherty, C.; Fourchet, F.; Fong, D.T.; Hertel, J.; Hiller, C.E.; et al. Clinical Assessment of Acute Lateral Ankle Sprain Injuries (ROAST): 2019 Consensus Statement and Recommendations of the International Ankle Consortium. Br. J. Sports Med. 2018, 52, 1304–1310. [Google Scholar] [CrossRef] [PubMed]
- Chin, L.C.; Basah, S.N.B.; Yaacob, S.B.; Juan, Y.E. Conceptual Design and Implementation for Visual Tracking Ankle Rehabilitation System. J. Mech. Eng. Sci. 2014, 7, 1208–1218. [Google Scholar] [CrossRef]
- Ekerete, I.; Giggins, O.M.; Garcia-Constantino, M.; Nugent, C.; Mclaughlin, J. Unobtrusive Measurement of Upper Extremity Velocity during Post-Stroke Rehabilitation Exercises. In Proceedings of the 2019 IEEE EMBS International Conference on Biomedical & Health Informatics (BHI 2019), Chicago, IL, USA, 19–22 May 2019. [Google Scholar]
- Cleland, I.; McClean, S.; Rafferty, J.; Synnott, J.; Nugent, C.; Ennis, A.; Catherwood, P.; McChesney, I. A Scalable, Research Oriented, Generic, Sensor Data Platform. IEEE Access 2018, 6, 45473–45484. [Google Scholar] [CrossRef]
- Hosseini, S.; Sardo, S.R. Data Mining Tools—A Case Study for Network Intrusion Detection. Multimed. Tools Appl. 2021, 80, 4999–5019. [Google Scholar] [CrossRef]
- Iandola, F.N.; Han, S.; Moskewicz, M.W.; Ashraf, K.; Dally, W.J.; Keutzer, K. SqueezeNet: AlexNet-Level Accuracy with 50x Fewer Parameters and <0.5 MB Model Size. arXiv 2016, arXiv:1602.07360. [Google Scholar]
- Bora, M.D.J.; Gupta, D.A.K. Effect of Different Distance Measures on the Performance of K-Means Algorithm: An Experimental Study in Matlab. arXiv 2014, arXiv:1405.7471. [Google Scholar]
- Ackerman, M.; Ben-David, S.; Brânzei, S.; Loker, D. Weighted Clustering. Proc. Natl. Conf. Artif. Intell. 2012, 2, 858–863. [Google Scholar]
- Leng, L.; Zhang, J.; Khan, M.K.; Chen, X.; Alghathbar, K. Dynamic Weighted Discrimination Power Analysis: A Novel Approach for Face and Palmprint Recognition in DCT Domain. Int. J. Phys. Sci. 2010, 5, 2543–2554. [Google Scholar]
- Leng, L.; Li, M.; Kim, C.; Bi, X. Dual-Source Discrimination Power Analysis for Multi-Instance Contactless Palmprint Recognition. Multimed. Tools Appl. 2017, 76, 333–354. [Google Scholar] [CrossRef]
- Albawendi, S.G. Automated Human Fall Recognition from Visual Data. Ph.D. Thesis, Nottingham Trent University, Nottingham, UK, 2019. [Google Scholar]
- Rasoulidanesh, M.S.M.S.; Payandeh, S. A Novel Change-Detection Scheduler for a Network of Depth Sensors. J. Vis. Commun. Image Represent. 2020, 66, 102733. [Google Scholar] [CrossRef]
- Rakibe, R.S.; Patil, B.D. Background Subtraction Algorithm Based Human Motion Detection. Int. J. Sci. Res. Publ. 2013, 3, 3–6. [Google Scholar]
- Wahed, R.B.; Nivrito, A.K. Comparative Analysis between Inception-V3 and Other Learning Systems Using Facial Expressions Detection. Ph.D. Thesis, BRAC University, Dhaka, Bangladesh, 2016; pp. 1–48. [Google Scholar]
- Szegedy, C.; Vanhoucke, V.; Ioffe, S.; Shlens, J.; Wojna, Z. Rethinking the Inception Architecture for Computer Vision. In Proceedings of the IEEE Conference on Computer Vision and Pattern Recognition (CVPR), Las Vegas, NV, USA, 27–30 June 2016; pp. 2818–2826. [Google Scholar] [CrossRef]
- Witten, I.H.; Frank, E.; Hall, M.A. Data Mining; Morgan Kaufmann: Burlington, MA, USA, 2011; ISBN 9780123748560. [Google Scholar]
- Jolliffe, I.T.; Cadima, J.; Cadima, J. Principal Component Analysis : A Review and Recent Developments Subject Areas. Phil. Trans. R. Soc. A 2016, 374, 1–16. [Google Scholar] [CrossRef] [PubMed]
- Lu, L.; Jiashu, Z.; Gao, C.; Muhammad, K.K.; Khaled, A. Two-Directional Two-Dimensional Random Projection and Its Variations for Face and Palmprint Recognition. In Computational Science and Its Applications—ICCSA 2011; LNCS; Springer: Berlin/Heidelberg, Germany, 2011; Volume 6786, pp. 458–470. ISBN 9783642219337. [Google Scholar]
- Morissette, L.; Chartier, S. The K-Means Clustering Technique: General Considerations and Implementation in Mathematica. Tutor. Quant. Methods Psychol. 2013, 9, 15–24. [Google Scholar] [CrossRef]
- Elbattah, M.; Molloy, O. Data-Driven Patient Segmentation Using K-Means Clustering: The Case of Hip Fracture Care in Ireland. ACM Int. Conf. Proceeding Ser. 2017, 3–10, 1–8. [Google Scholar] [CrossRef]
- Mateen, M.; Wen, J.; Nasrullah; Song, S.; Huang, Z. Fundus Image Classification Using VGG-19 Architecture with PCA and SVD. Symmetry 2019, 11, 1. [Google Scholar] [CrossRef]
- Han, J.; Kamber, M.; Pei, J. Data Mining: Data Mining Concepts and Techniques; Morgan Kaufmann: Burlington, MA, USA, 2014; ISBN 9780769550138. [Google Scholar]
- Lui, J.; Menon, C. Would a Thermal Sensor Improve Arm Motion Classification Accuracy of a Single Wrist-Mounted Inertial Device? Biomed. Eng. Online 2019, 18, 53. [Google Scholar] [CrossRef]
- Huang, J.; Ling, C.X. Using AUC and Accuracy in Evaluating Learning Algorithms. IEEE Trans. Knowl. Data Eng. 2005, 17, 299–310. [Google Scholar] [CrossRef]
- Fraser, J.J.; Hart, J.M.; Saliba, S.F.; Park, J.S.; Tumperi, M.; Hertel, J. Multisegmented Ankle-Foot Kinematics during Gait Initiation in Ankle Sprains and Chronic Ankle Instability. Clin. Biomech. 2019, 68, 80–88. [Google Scholar] [CrossRef]
- Abassi, M.; Bleakley, C.; Whiteley, R. Athletes at Late Stage Rehabilitation Have Persisting Deficits in Plantar- and Dorsiflexion, and Inversion (but Not Eversion) after Ankle Sprain. Phys. Ther. Sport 2019, 38, 30–35. [Google Scholar] [CrossRef] [PubMed]
- Kern-Steiner, R.; Washecheck, H.S.S.; Kelsey, D.D.D. Strategy of Exercise Prescription Using an Unloading Technique for Functional Rehabilitation of an Athlete with an Inversion Ankle Sprain. J. Orthop. Sports Phys. Ther. 1999, 29, 282–287. [Google Scholar] [CrossRef]
- Farjadian, A.B.; Nabian, M.; Holden, M.K.; Mavroidis, C. Development of 2-DOF Ankle Rehabilitation System. In Proceedings of the 2014 40th Annual Northeast Bioengineering Conference (NEBEC), Boston, MA, USA, 25–27 April 2014; pp. 1–2. [Google Scholar]
- Taborri, J.; Palermo, E.; Rossi, S.; Cappa, P. Gait Partitioning Methods: A Systematic Review. Sensors 2016, 16, 66. [Google Scholar] [CrossRef]
Publisher’s Note: MDPI stays neutral with regard to jurisdictional claims in published maps and institutional affiliations. |
© 2021 by the authors. Licensee MDPI, Basel, Switzerland. This article is an open access article distributed under the terms and conditions of the Creative Commons Attribution (CC BY) license (https://creativecommons.org/licenses/by/4.0/).


