
A Power-Efficient Sensing Approach for Pulse Wave Palpation-Based Heart Rate Measurement

 ,
, 
Abstract
:1. Introduction
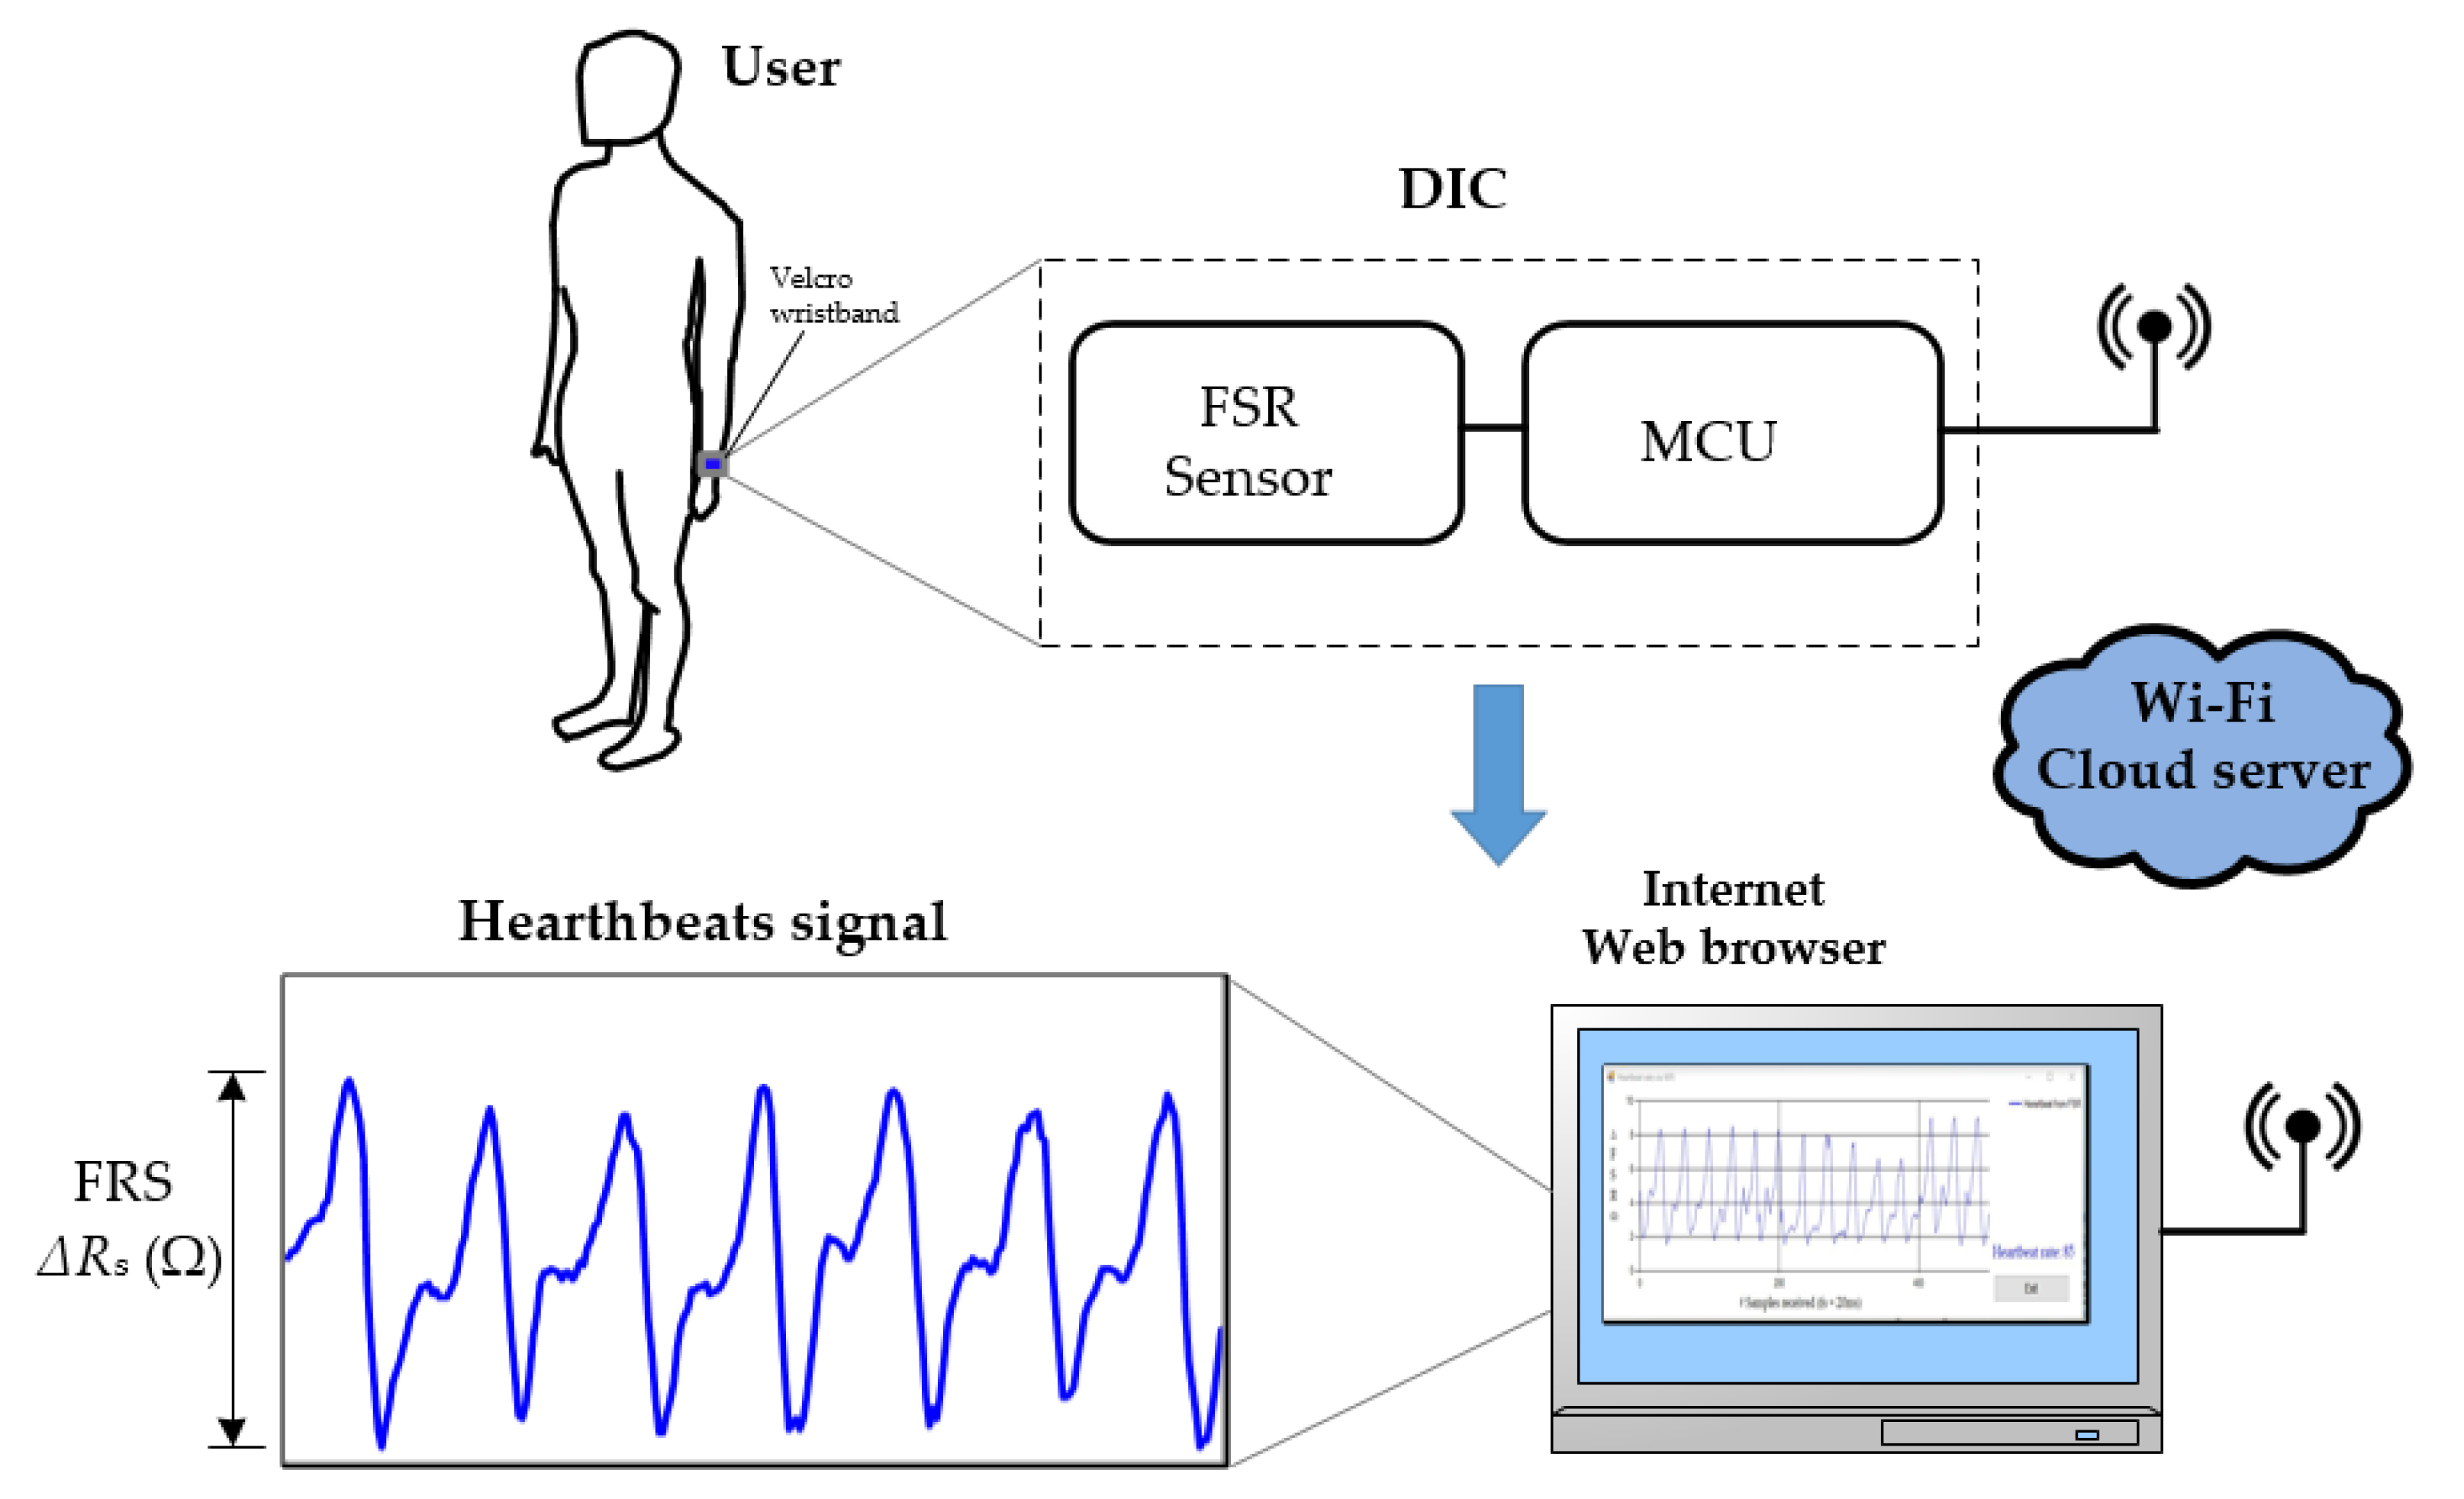
2. Sensing Approach
2.1. Heartbeat Signal Detection
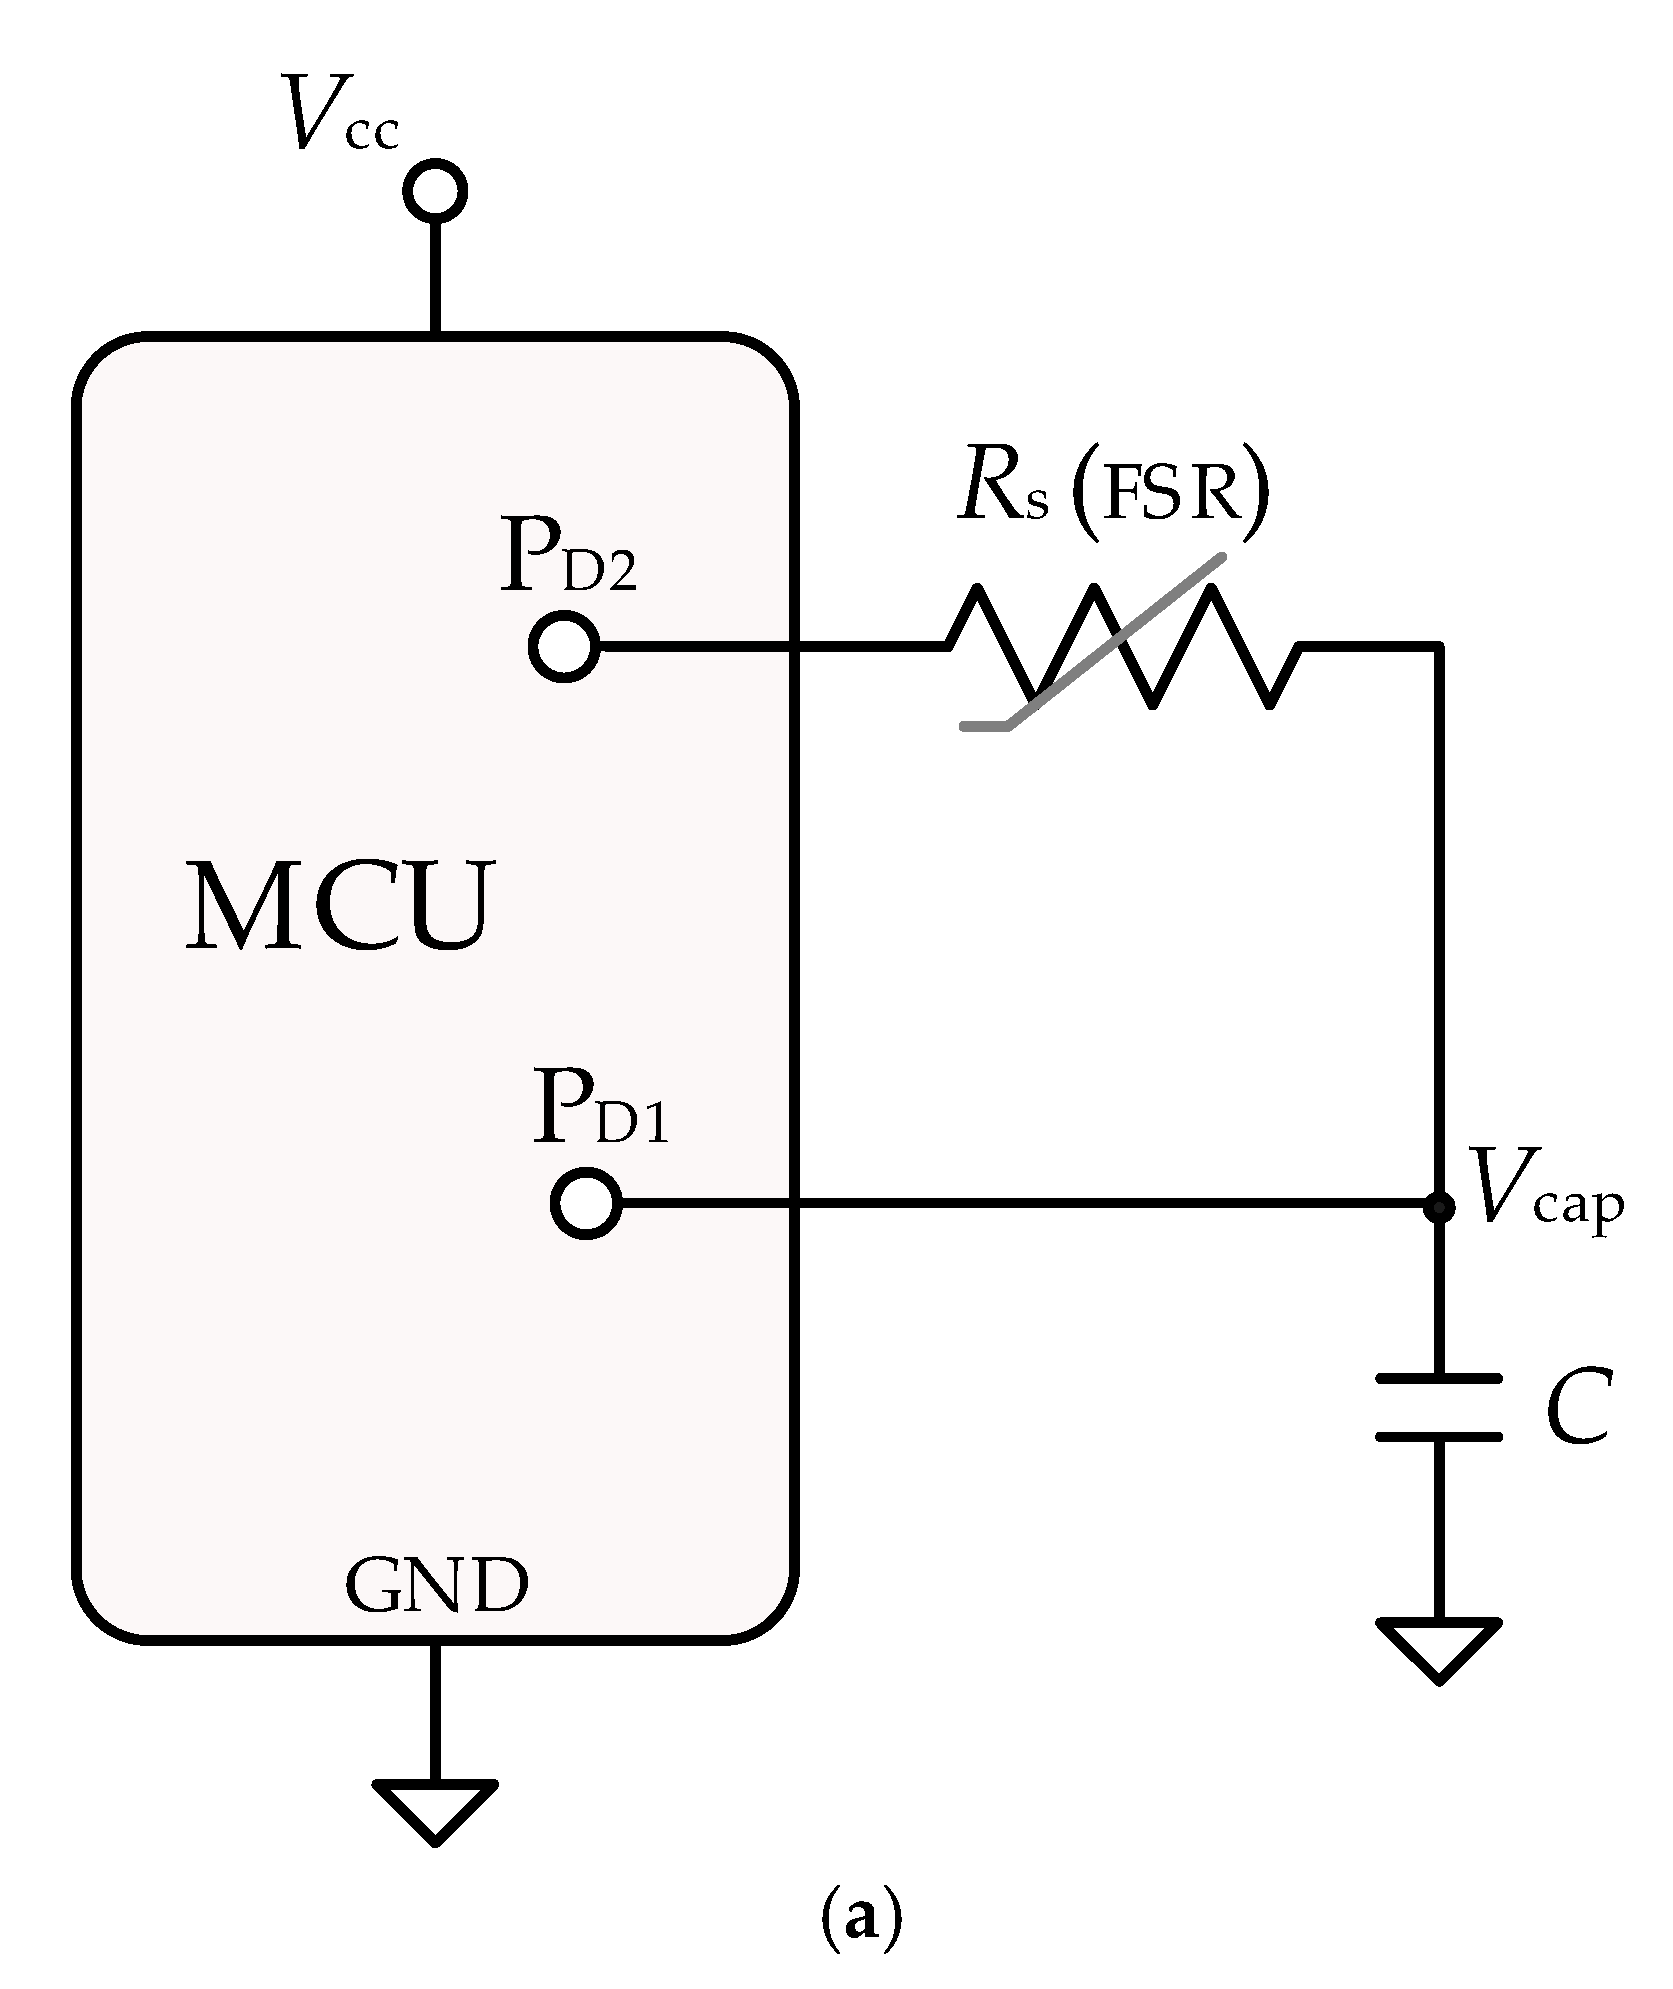
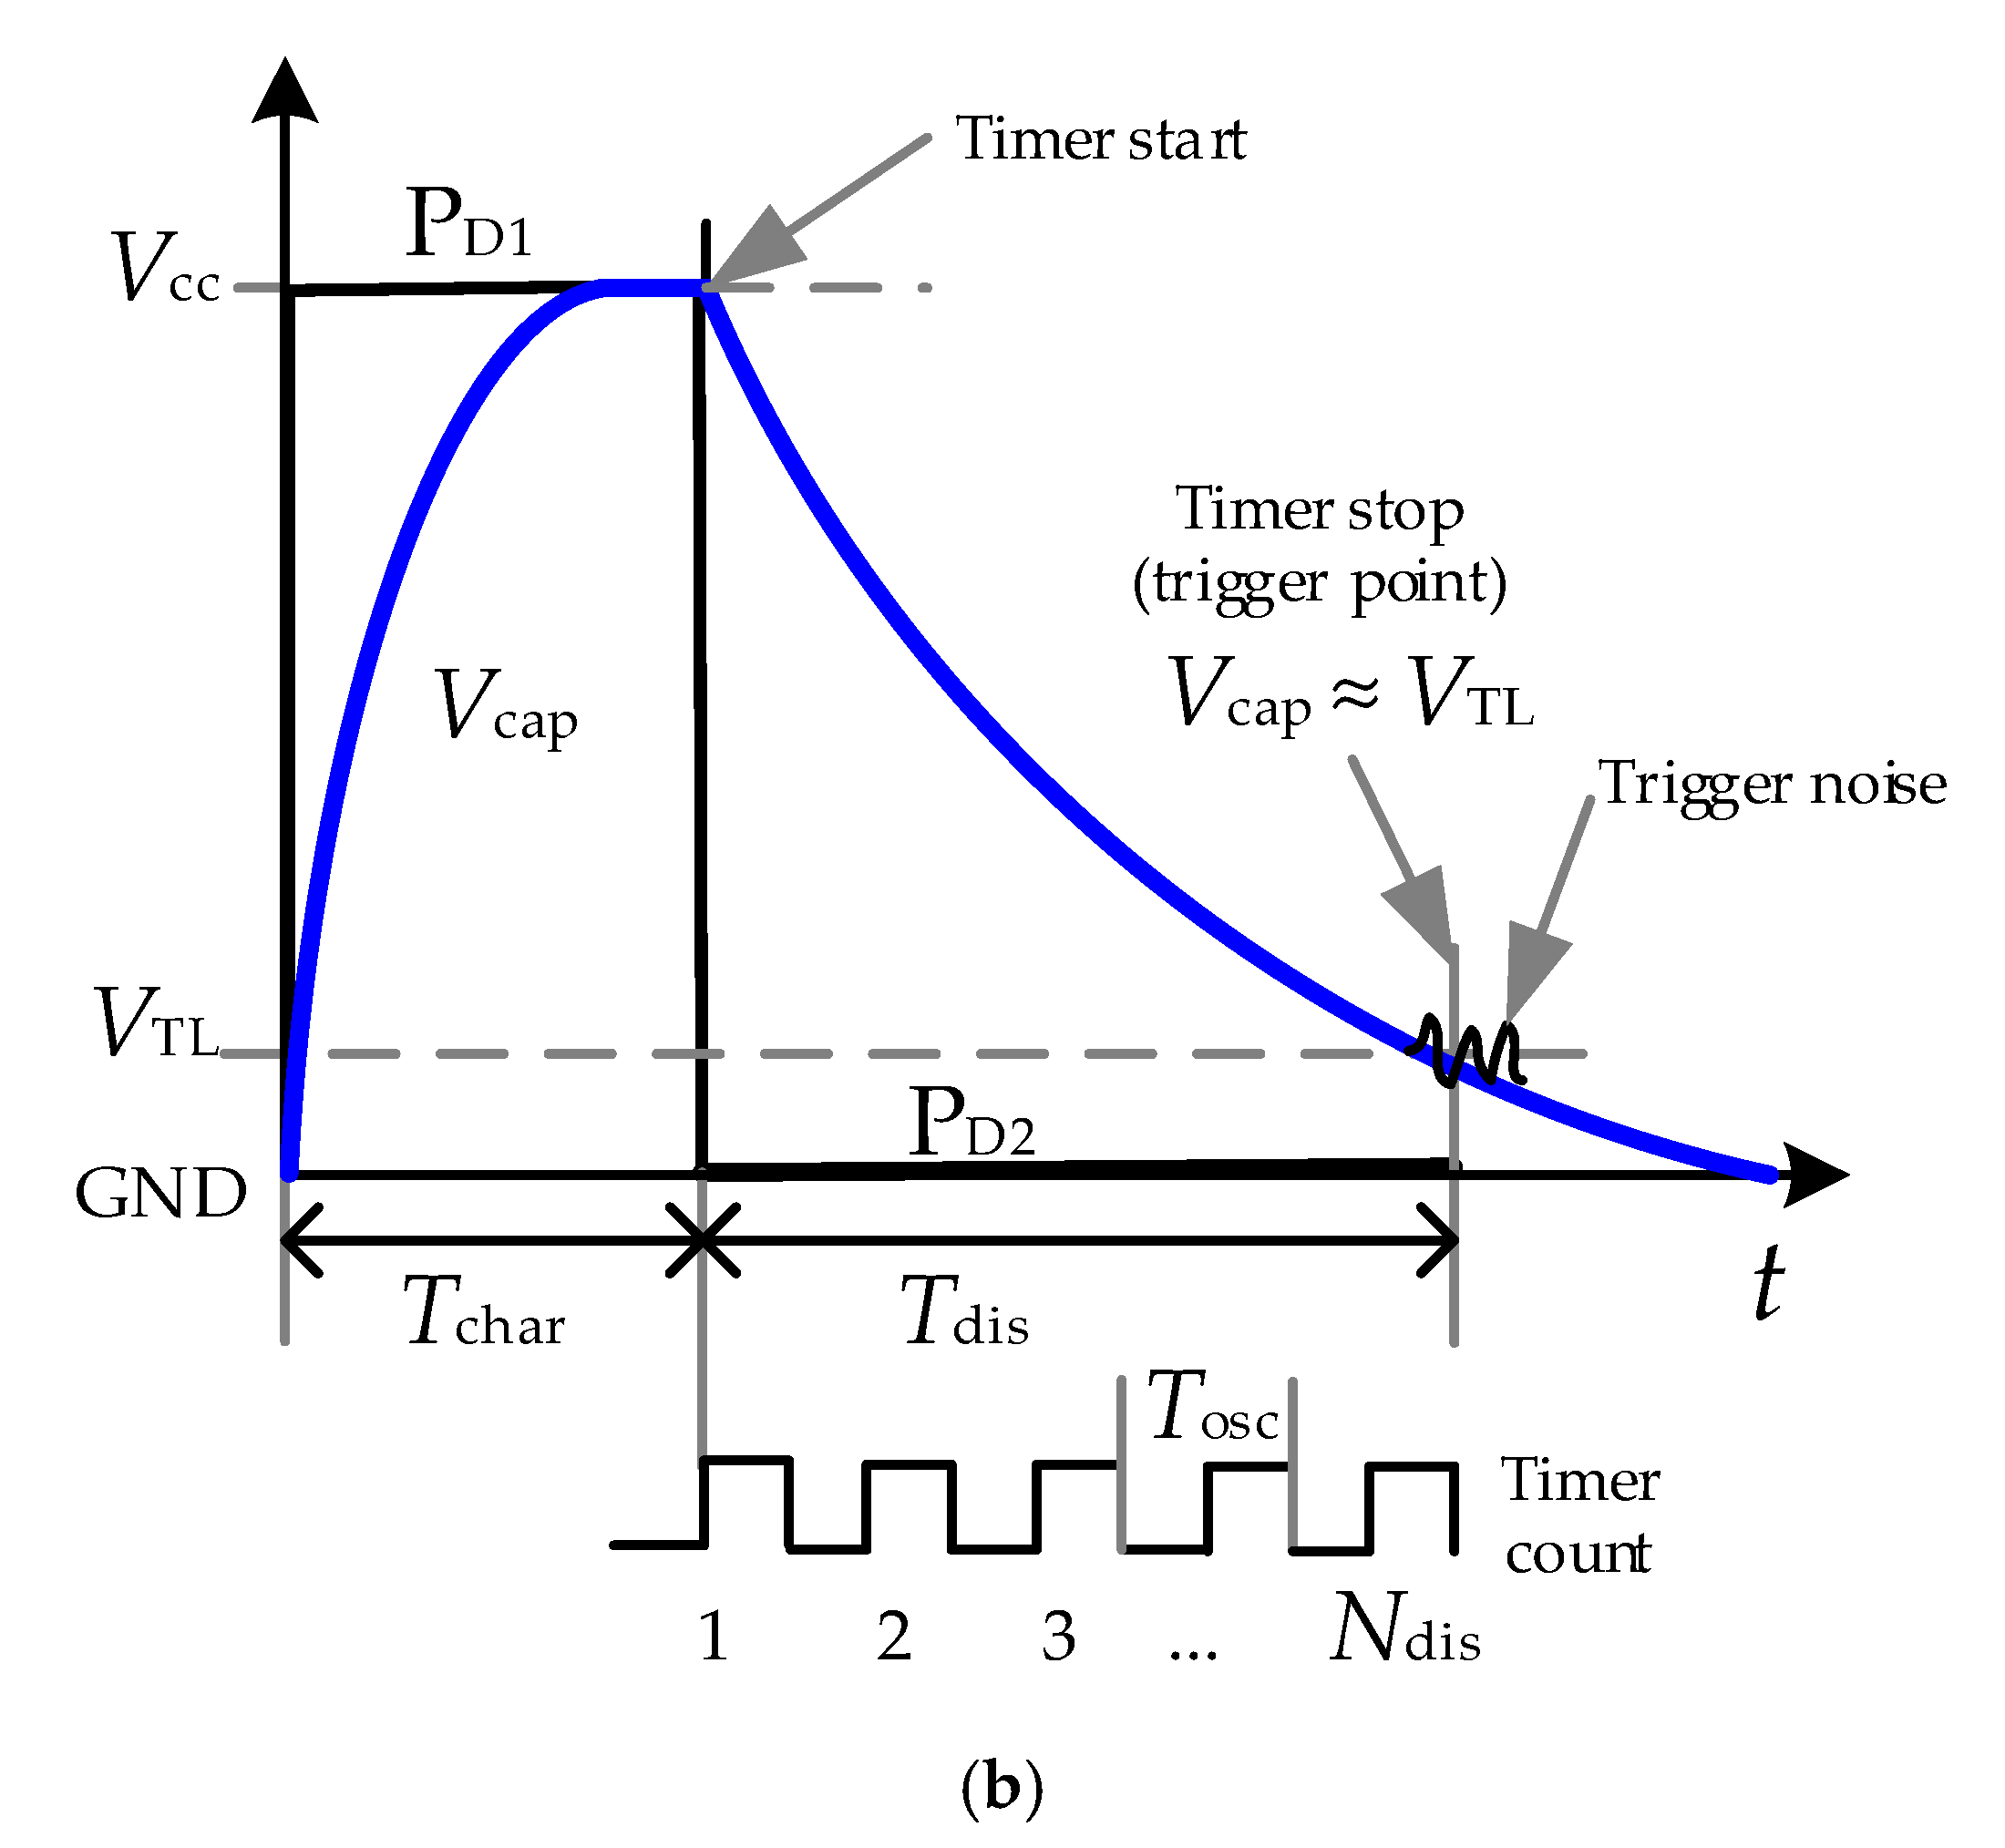
2.2. Direct Interface Circuit
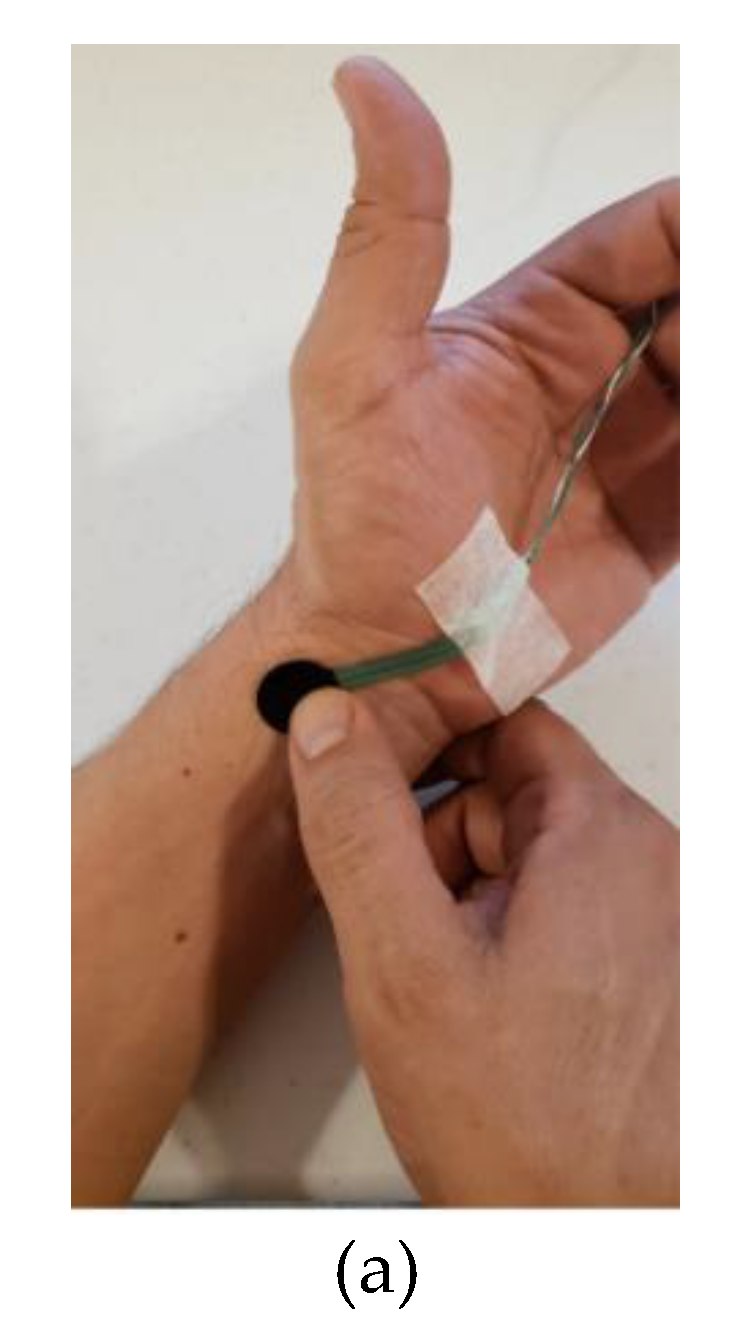
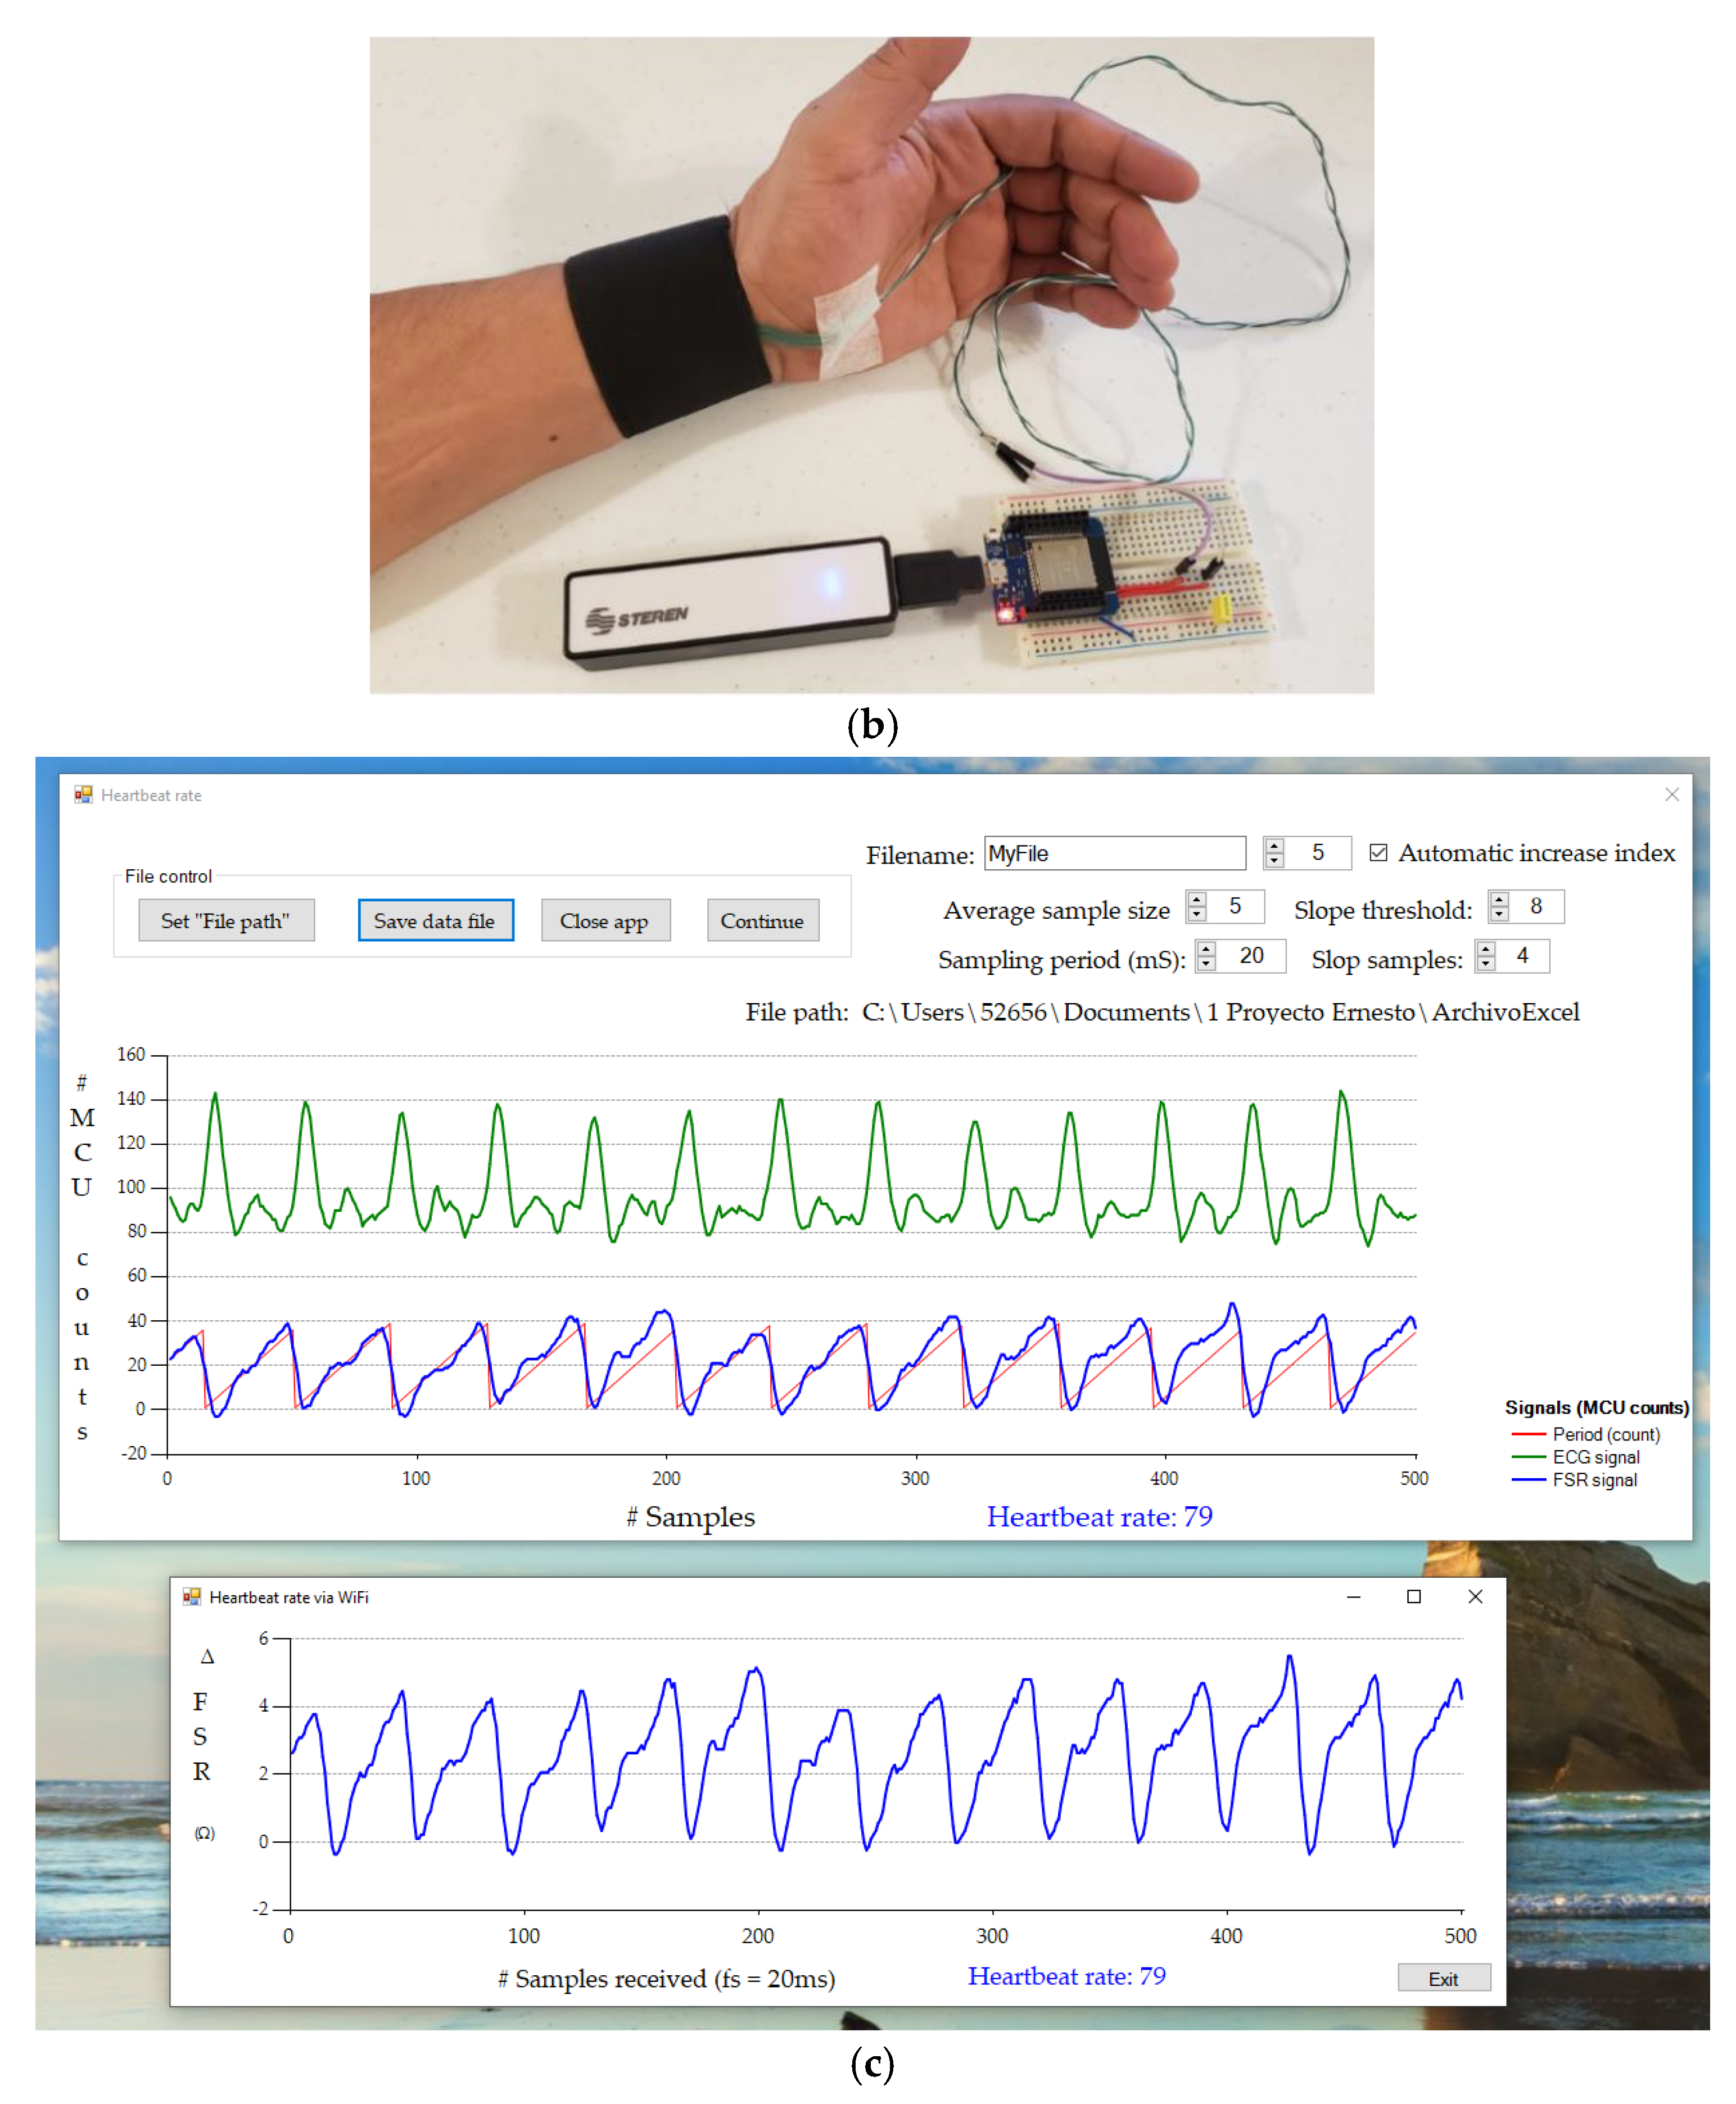
3. Materials and Method
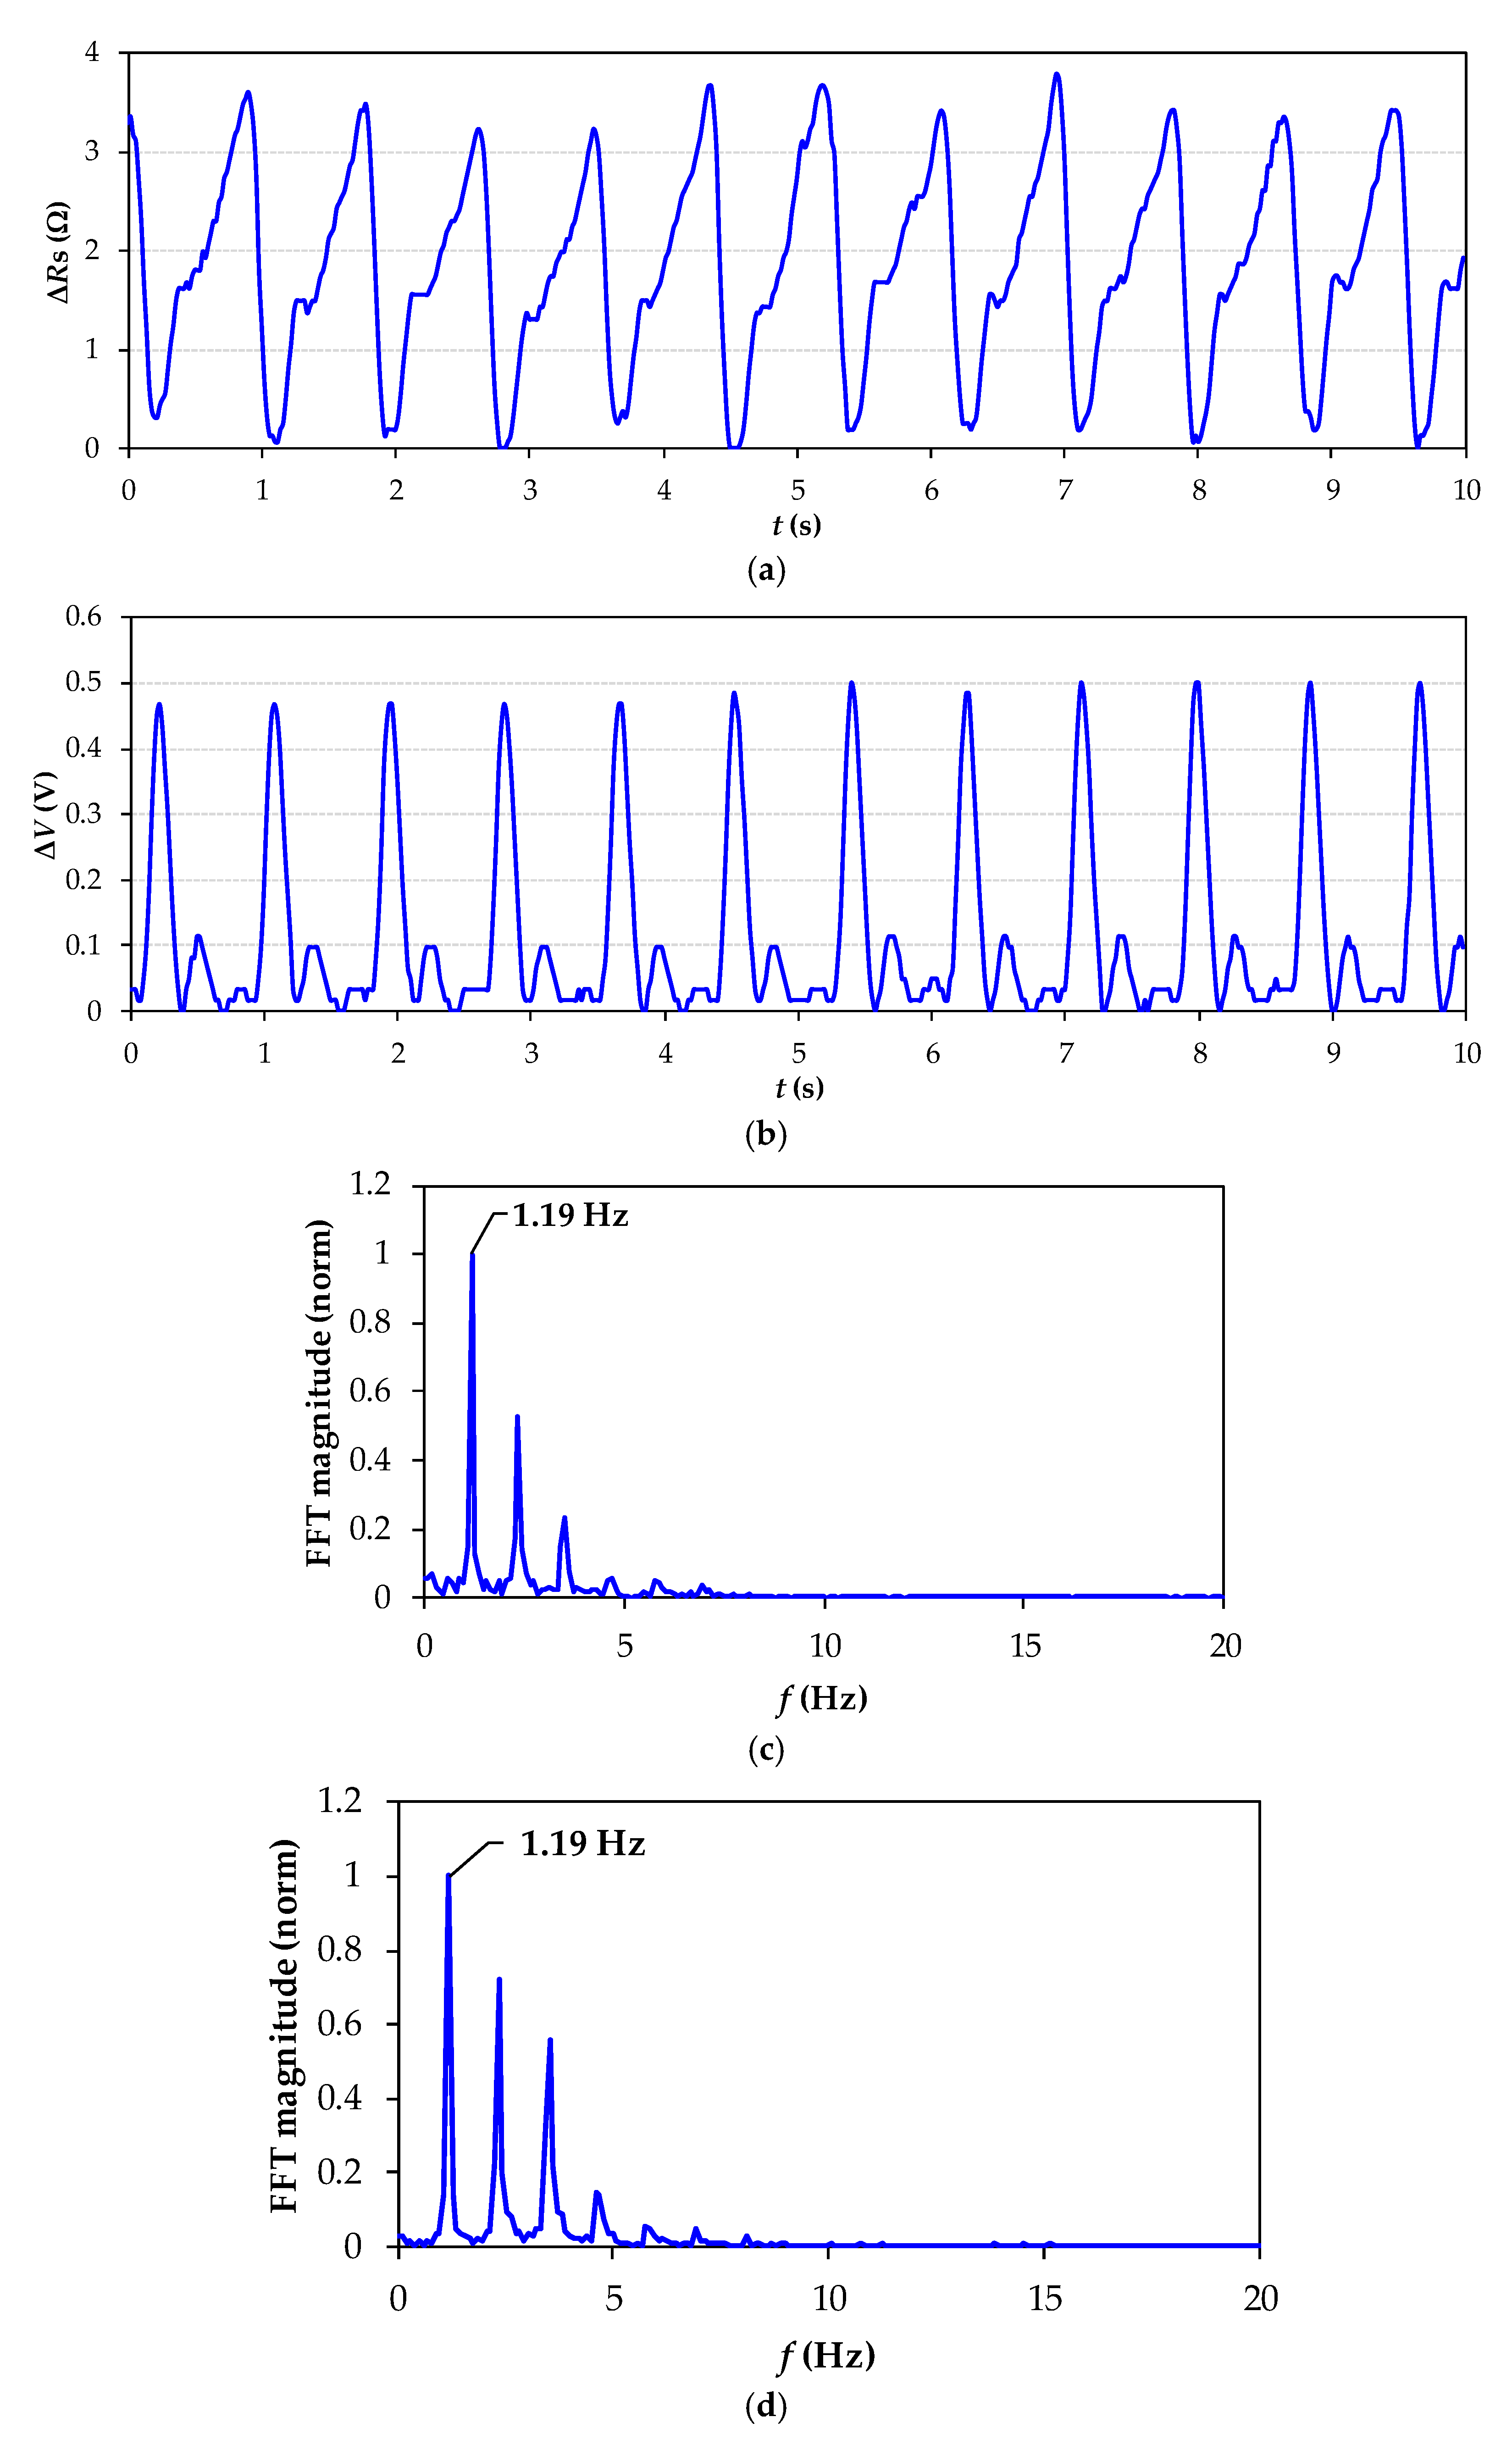
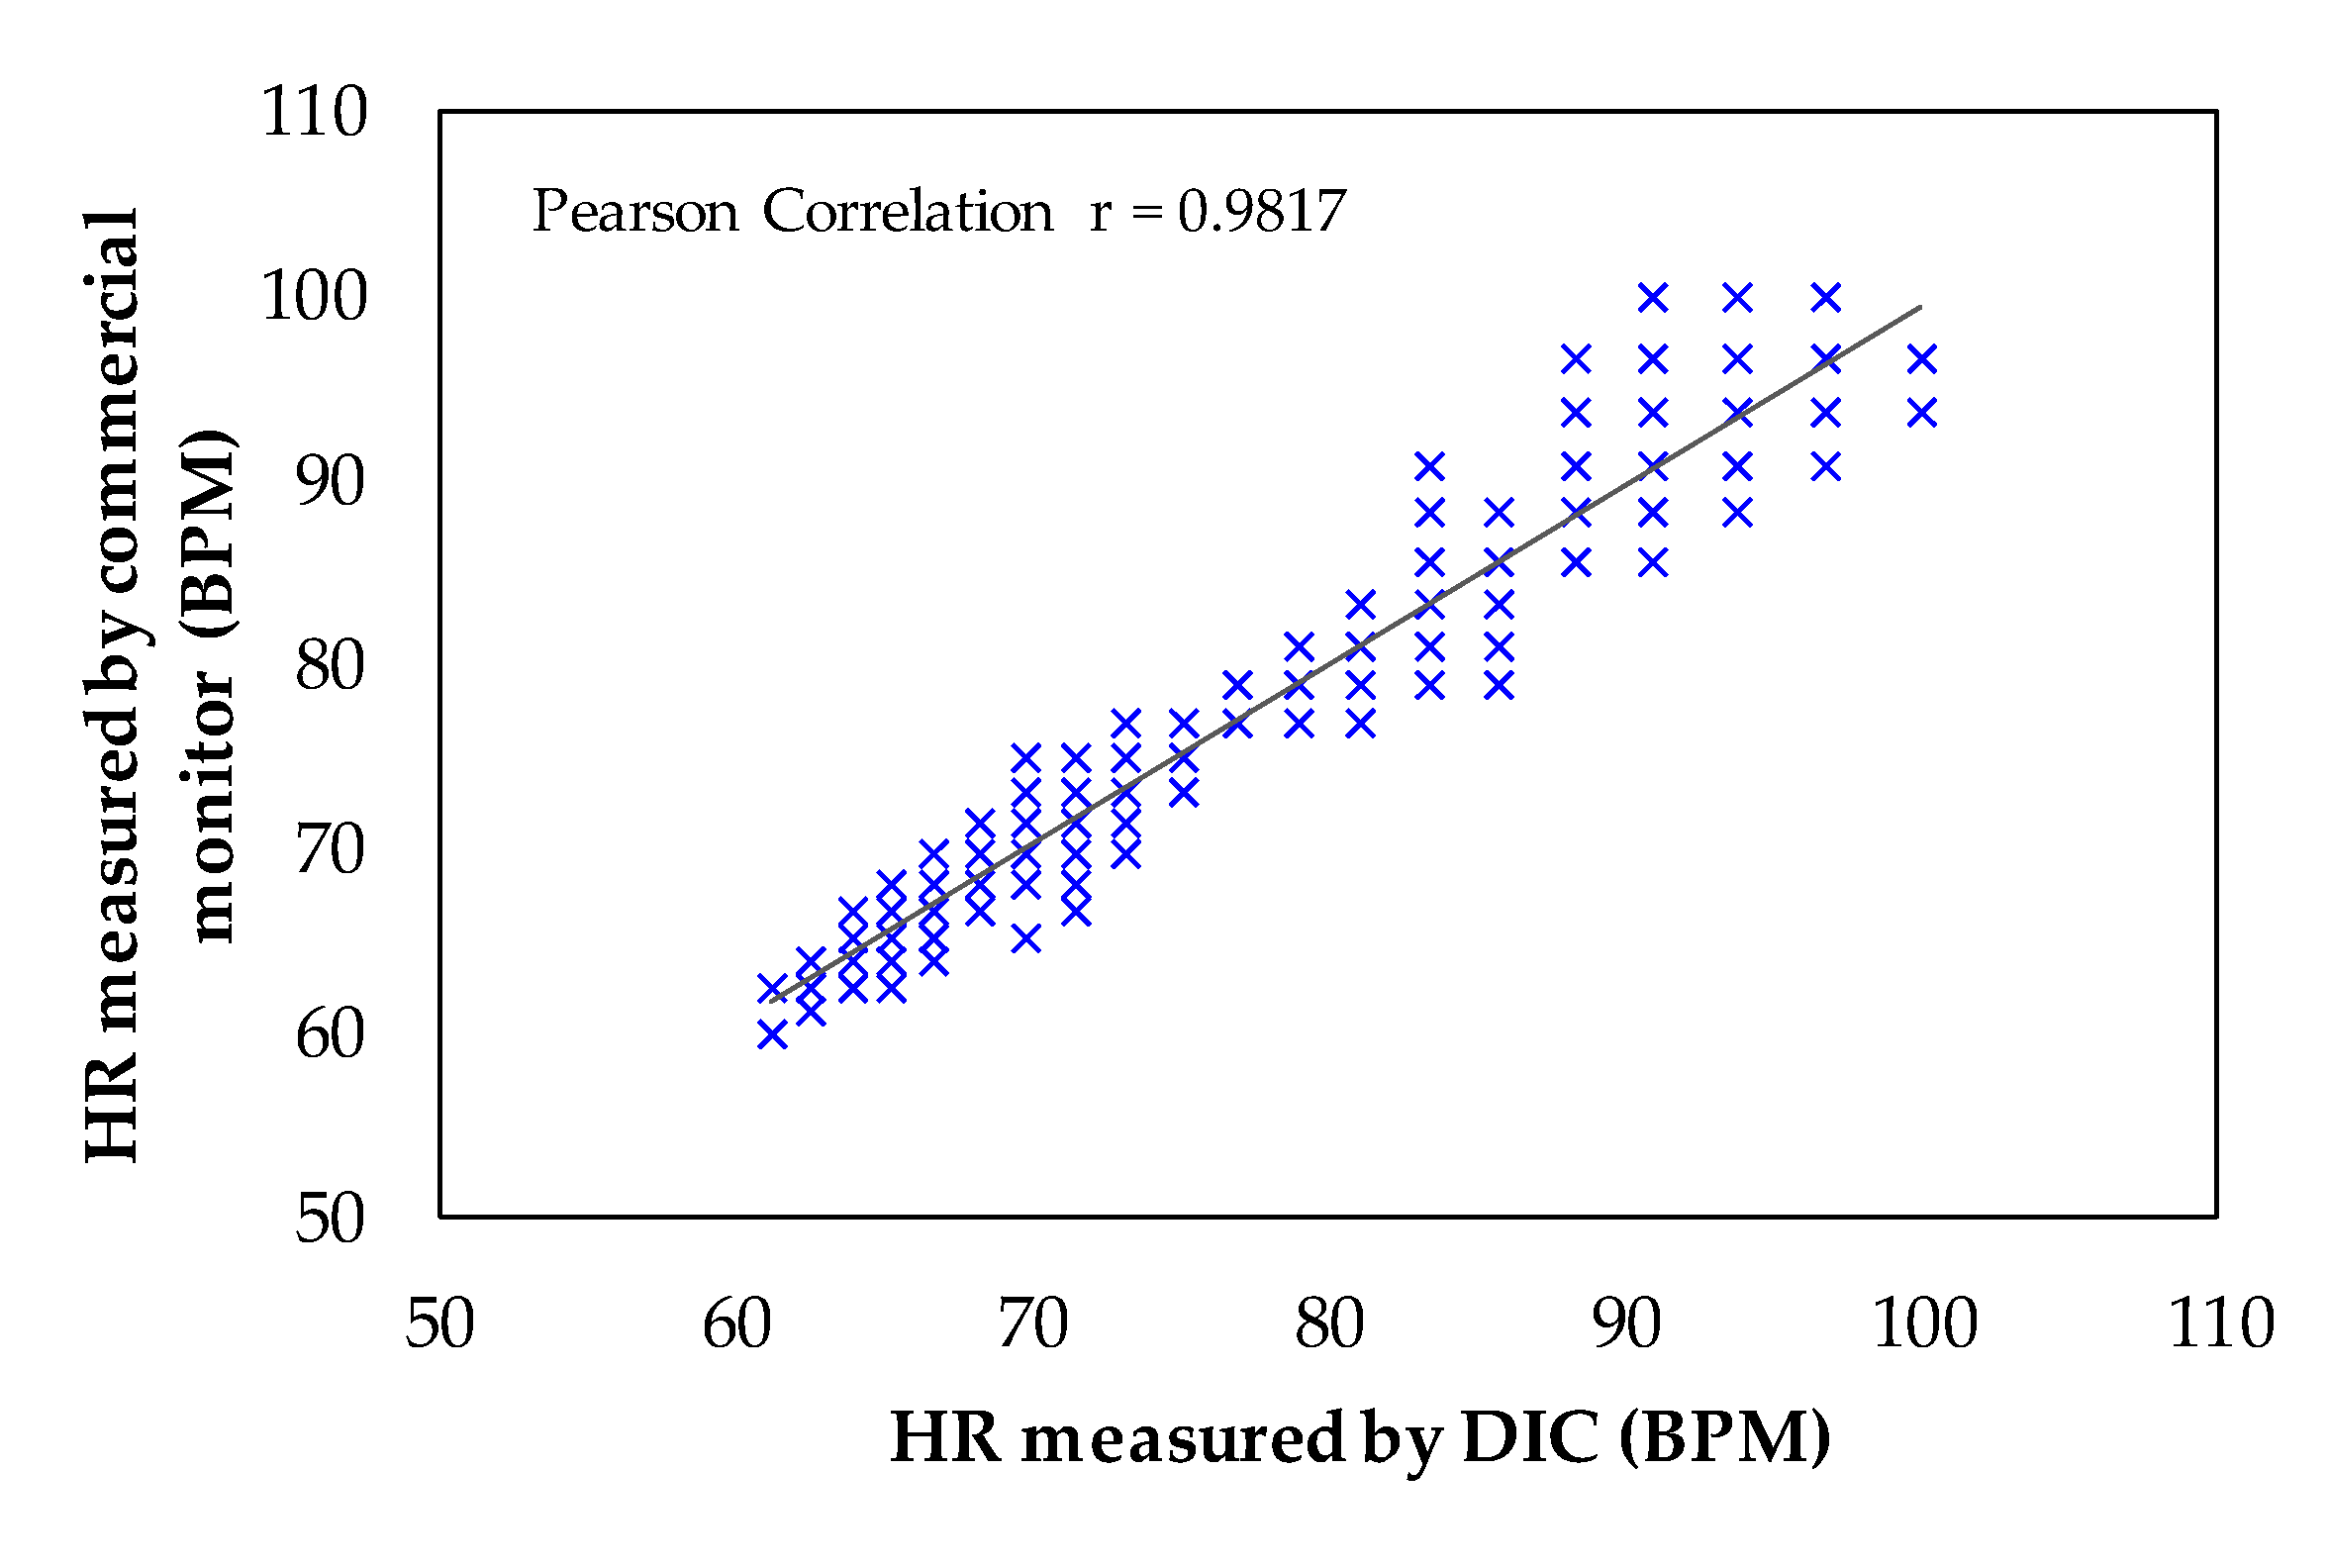
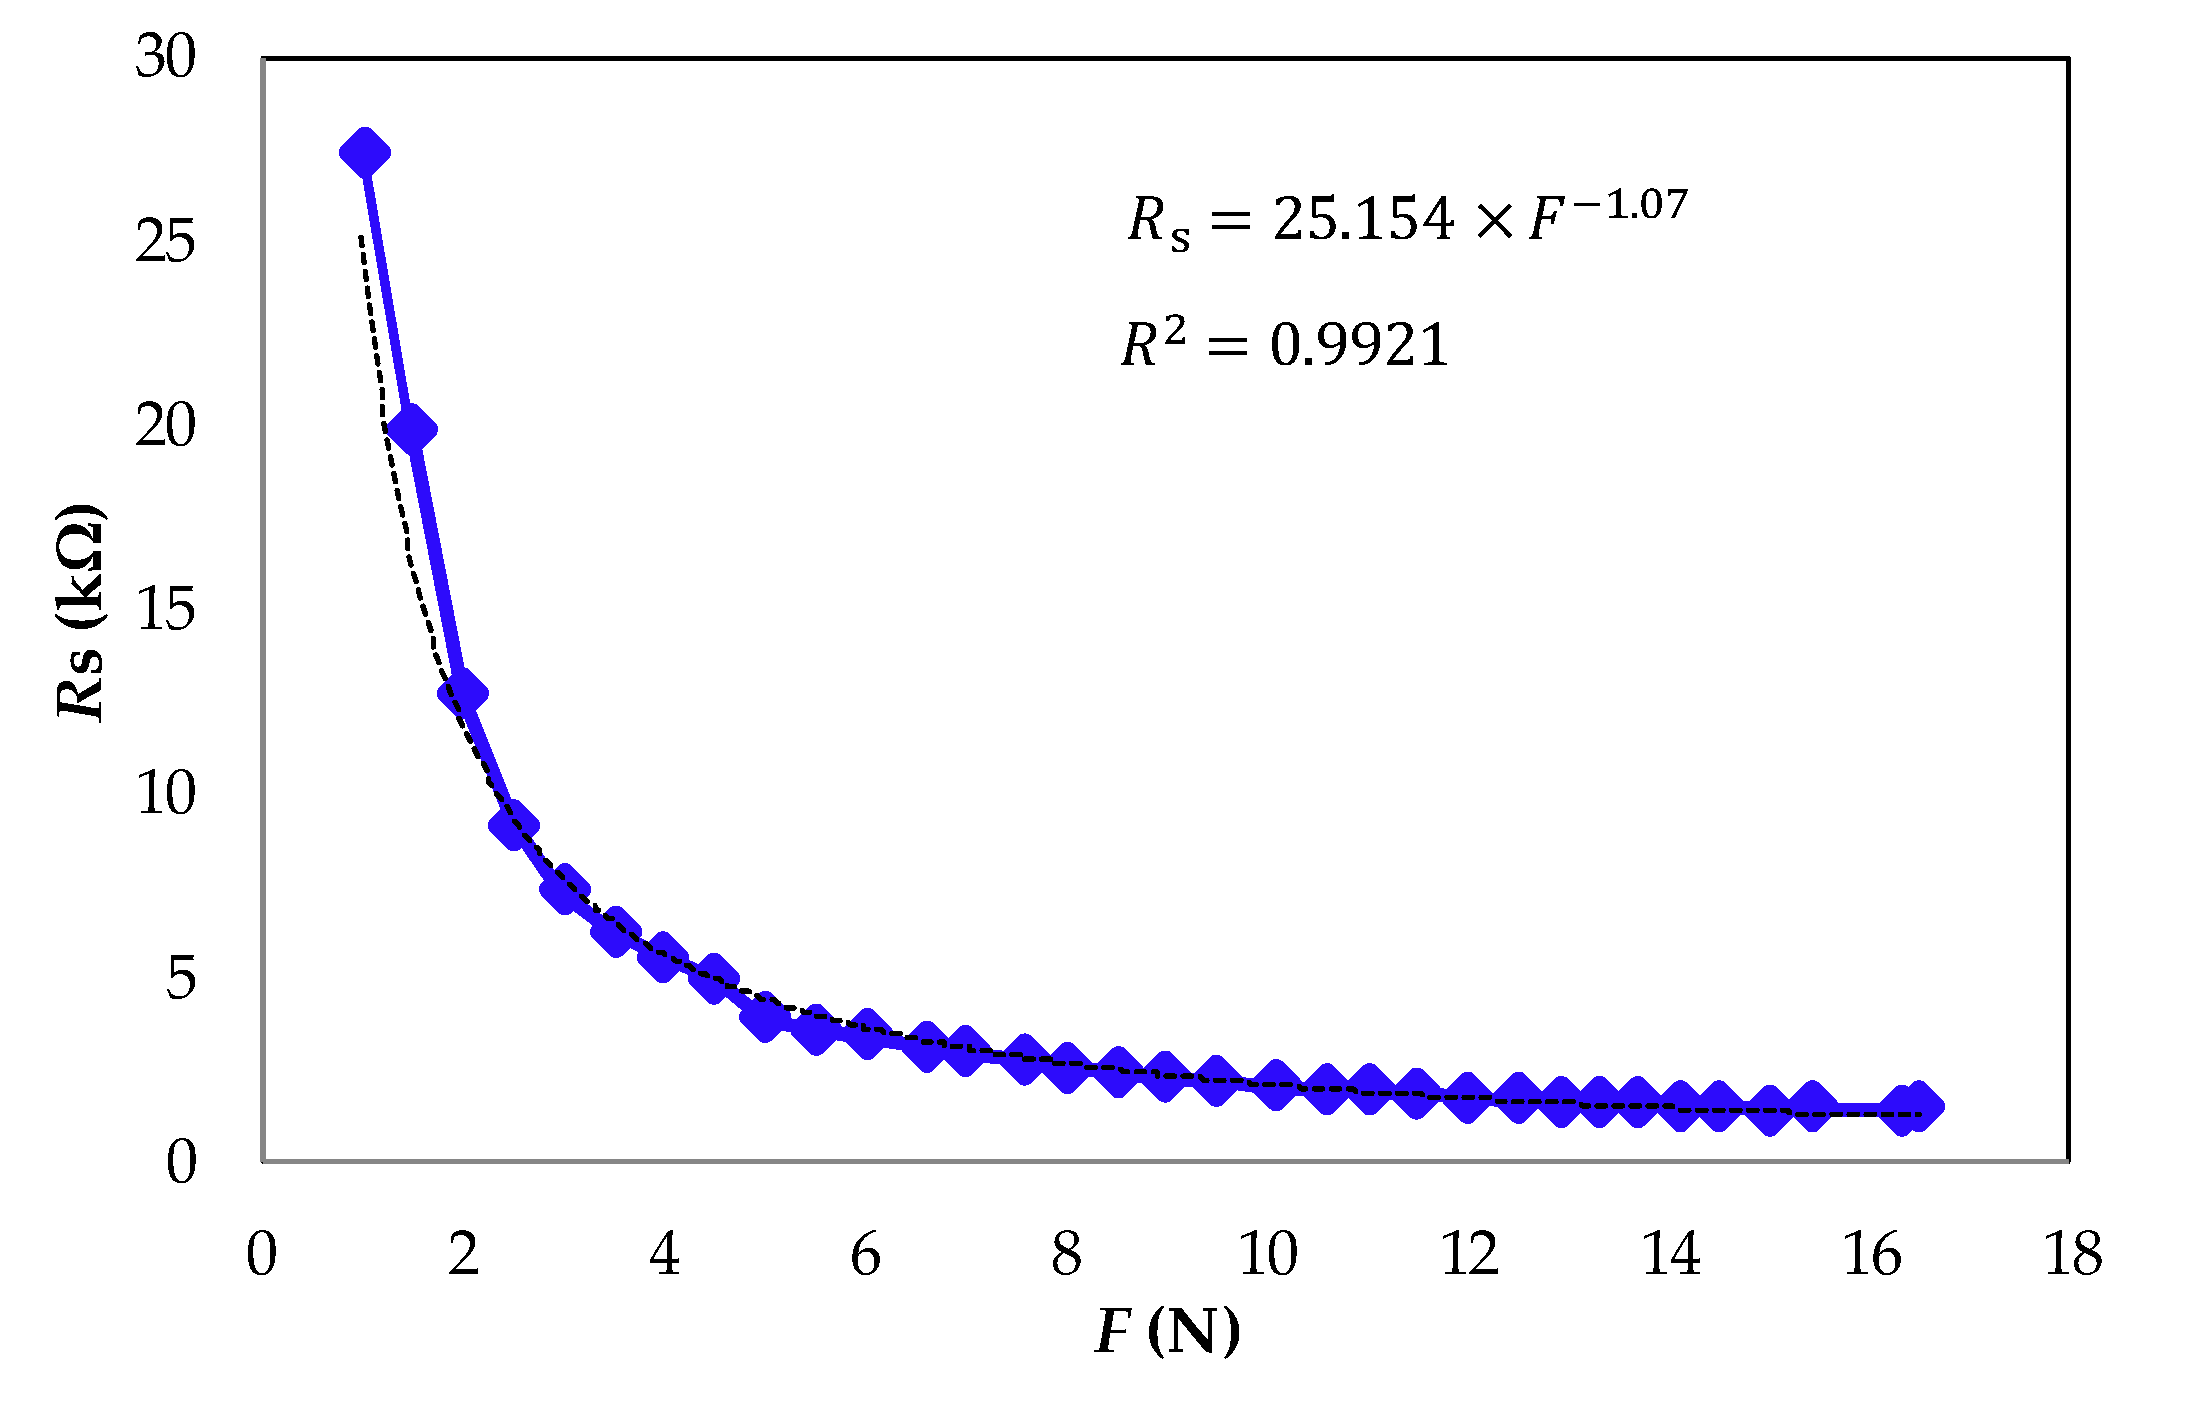
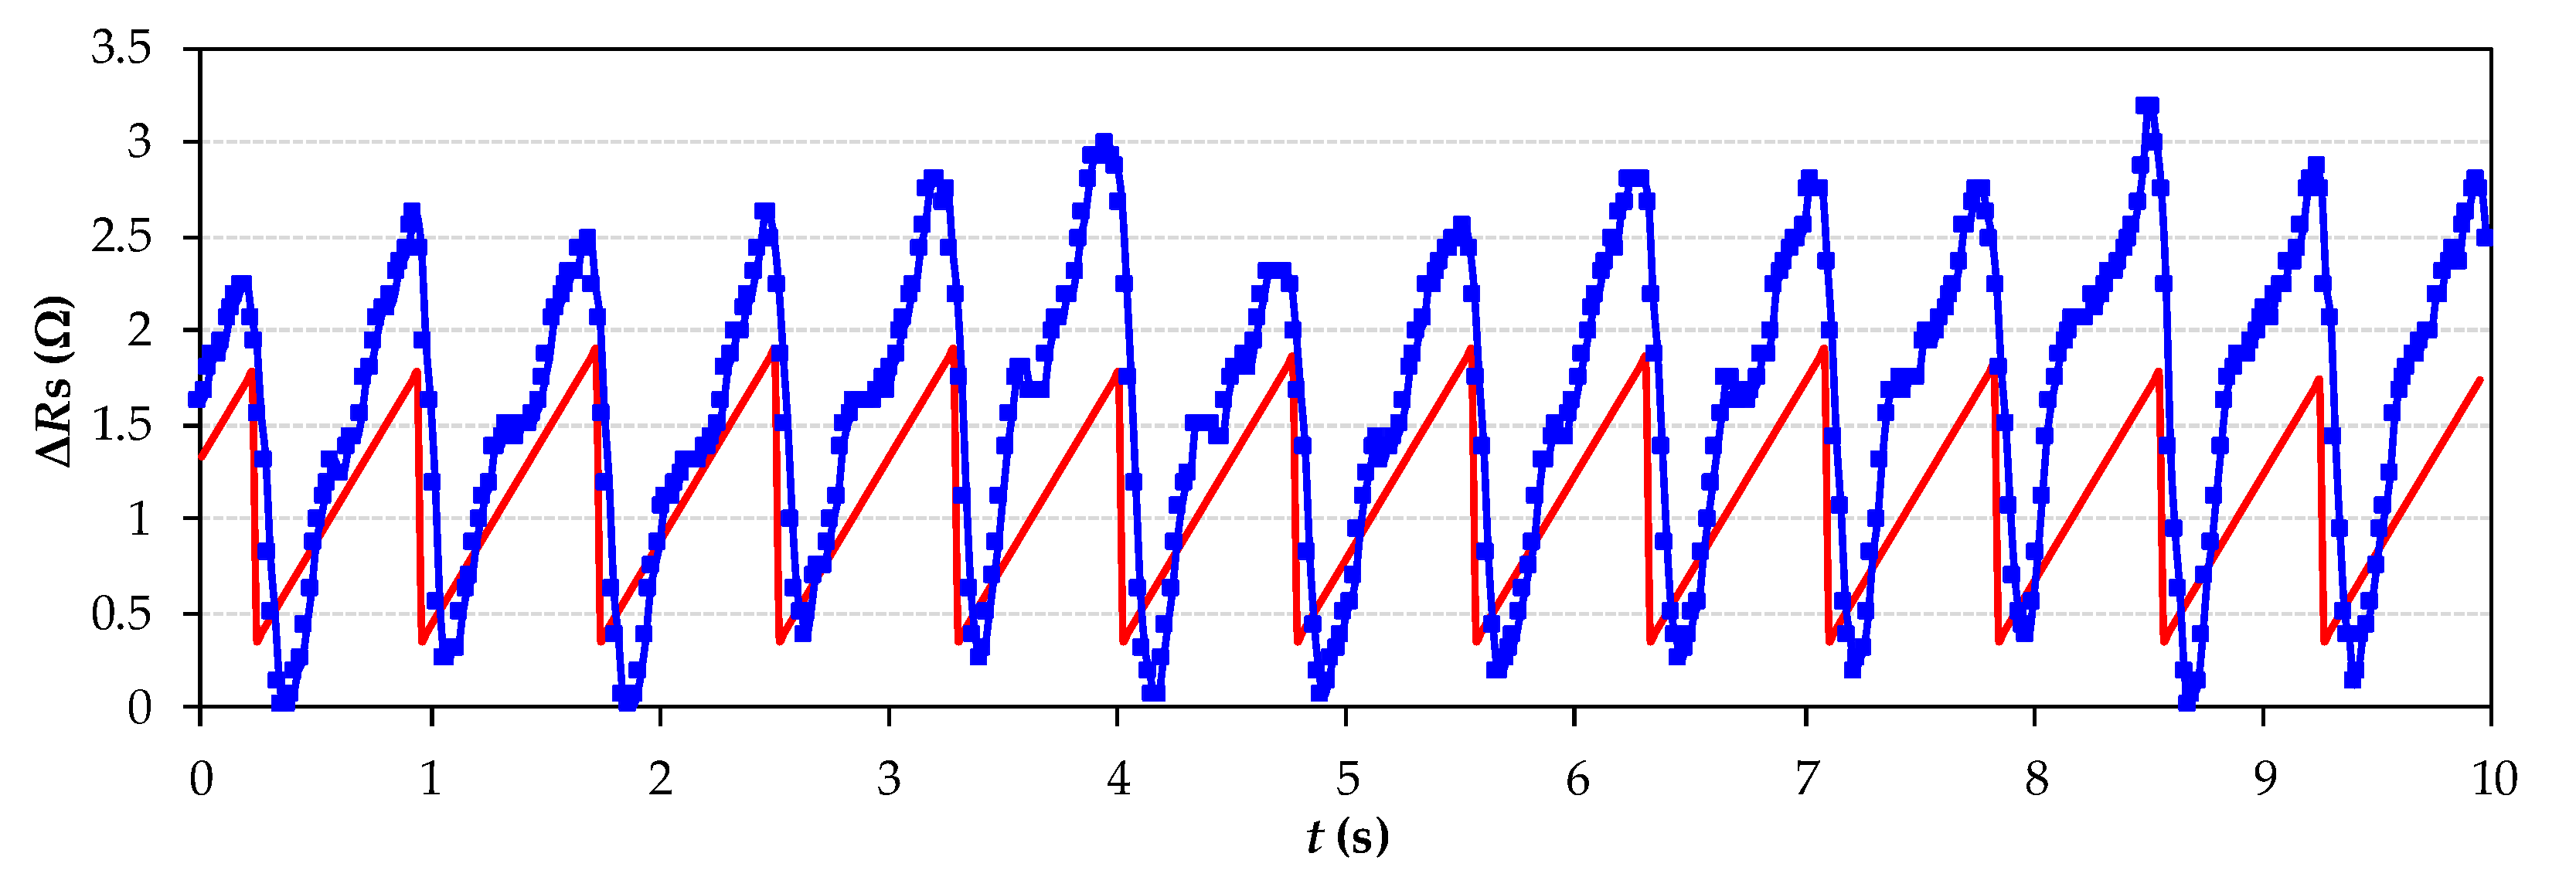
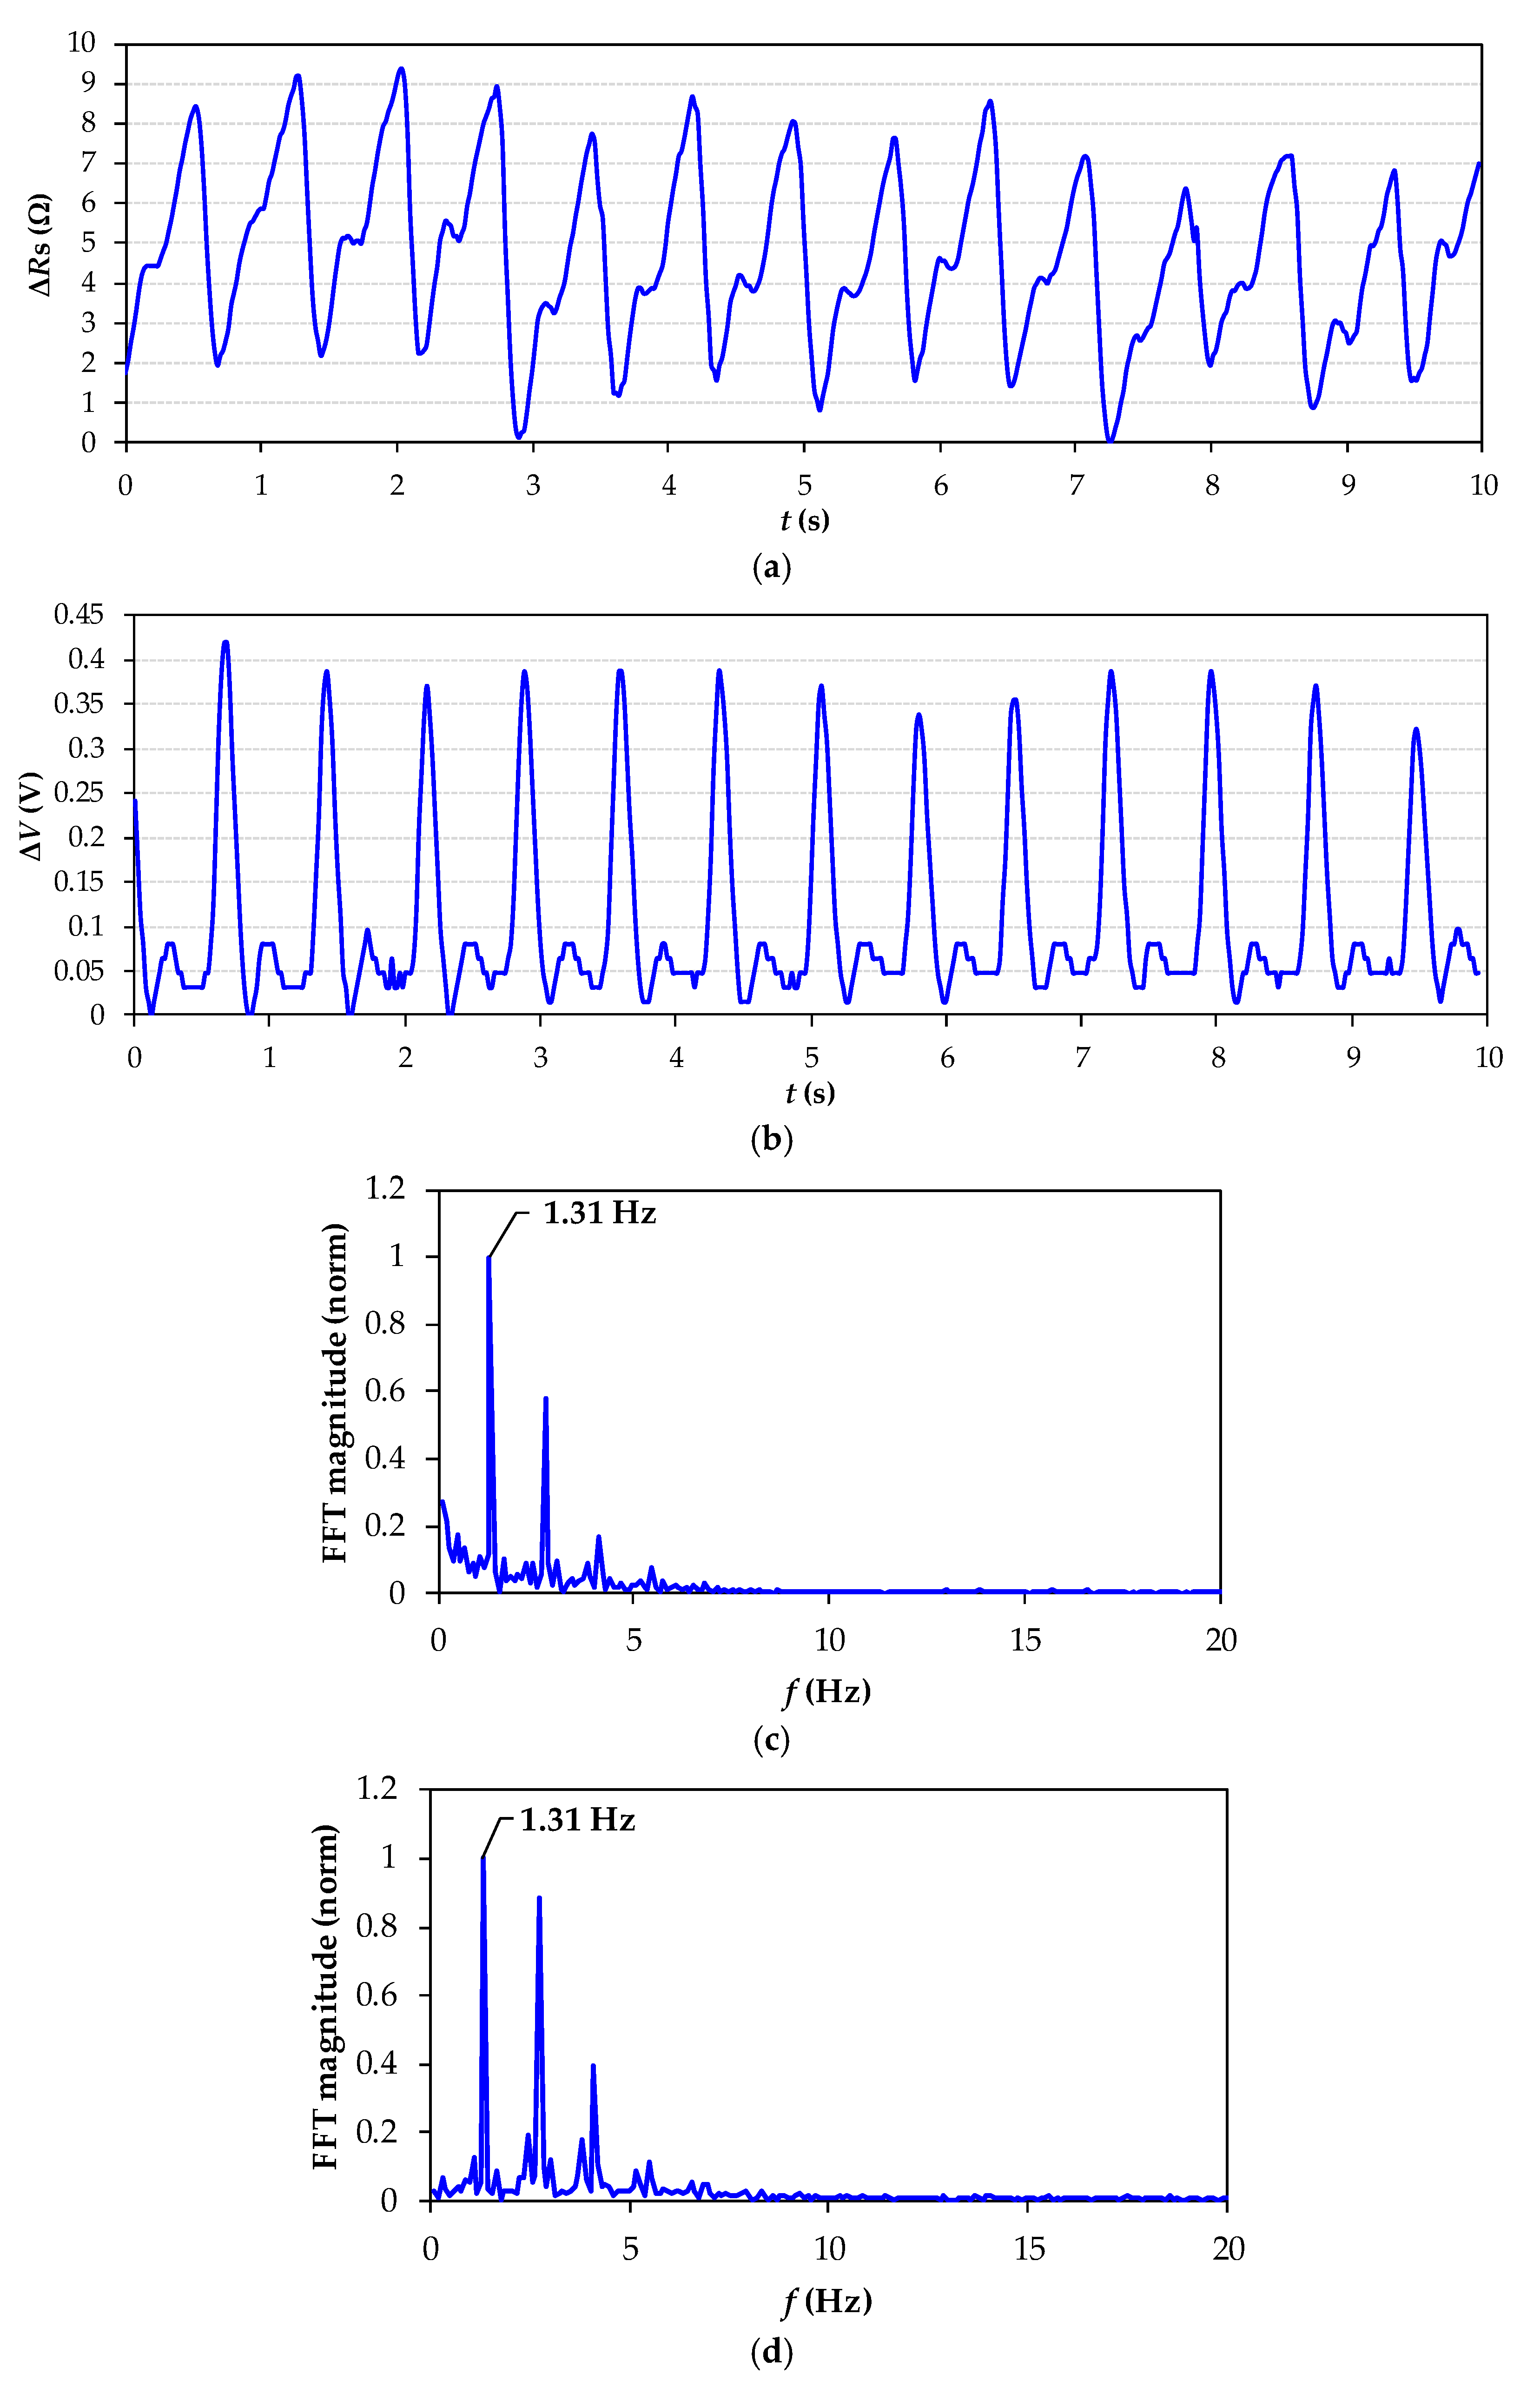
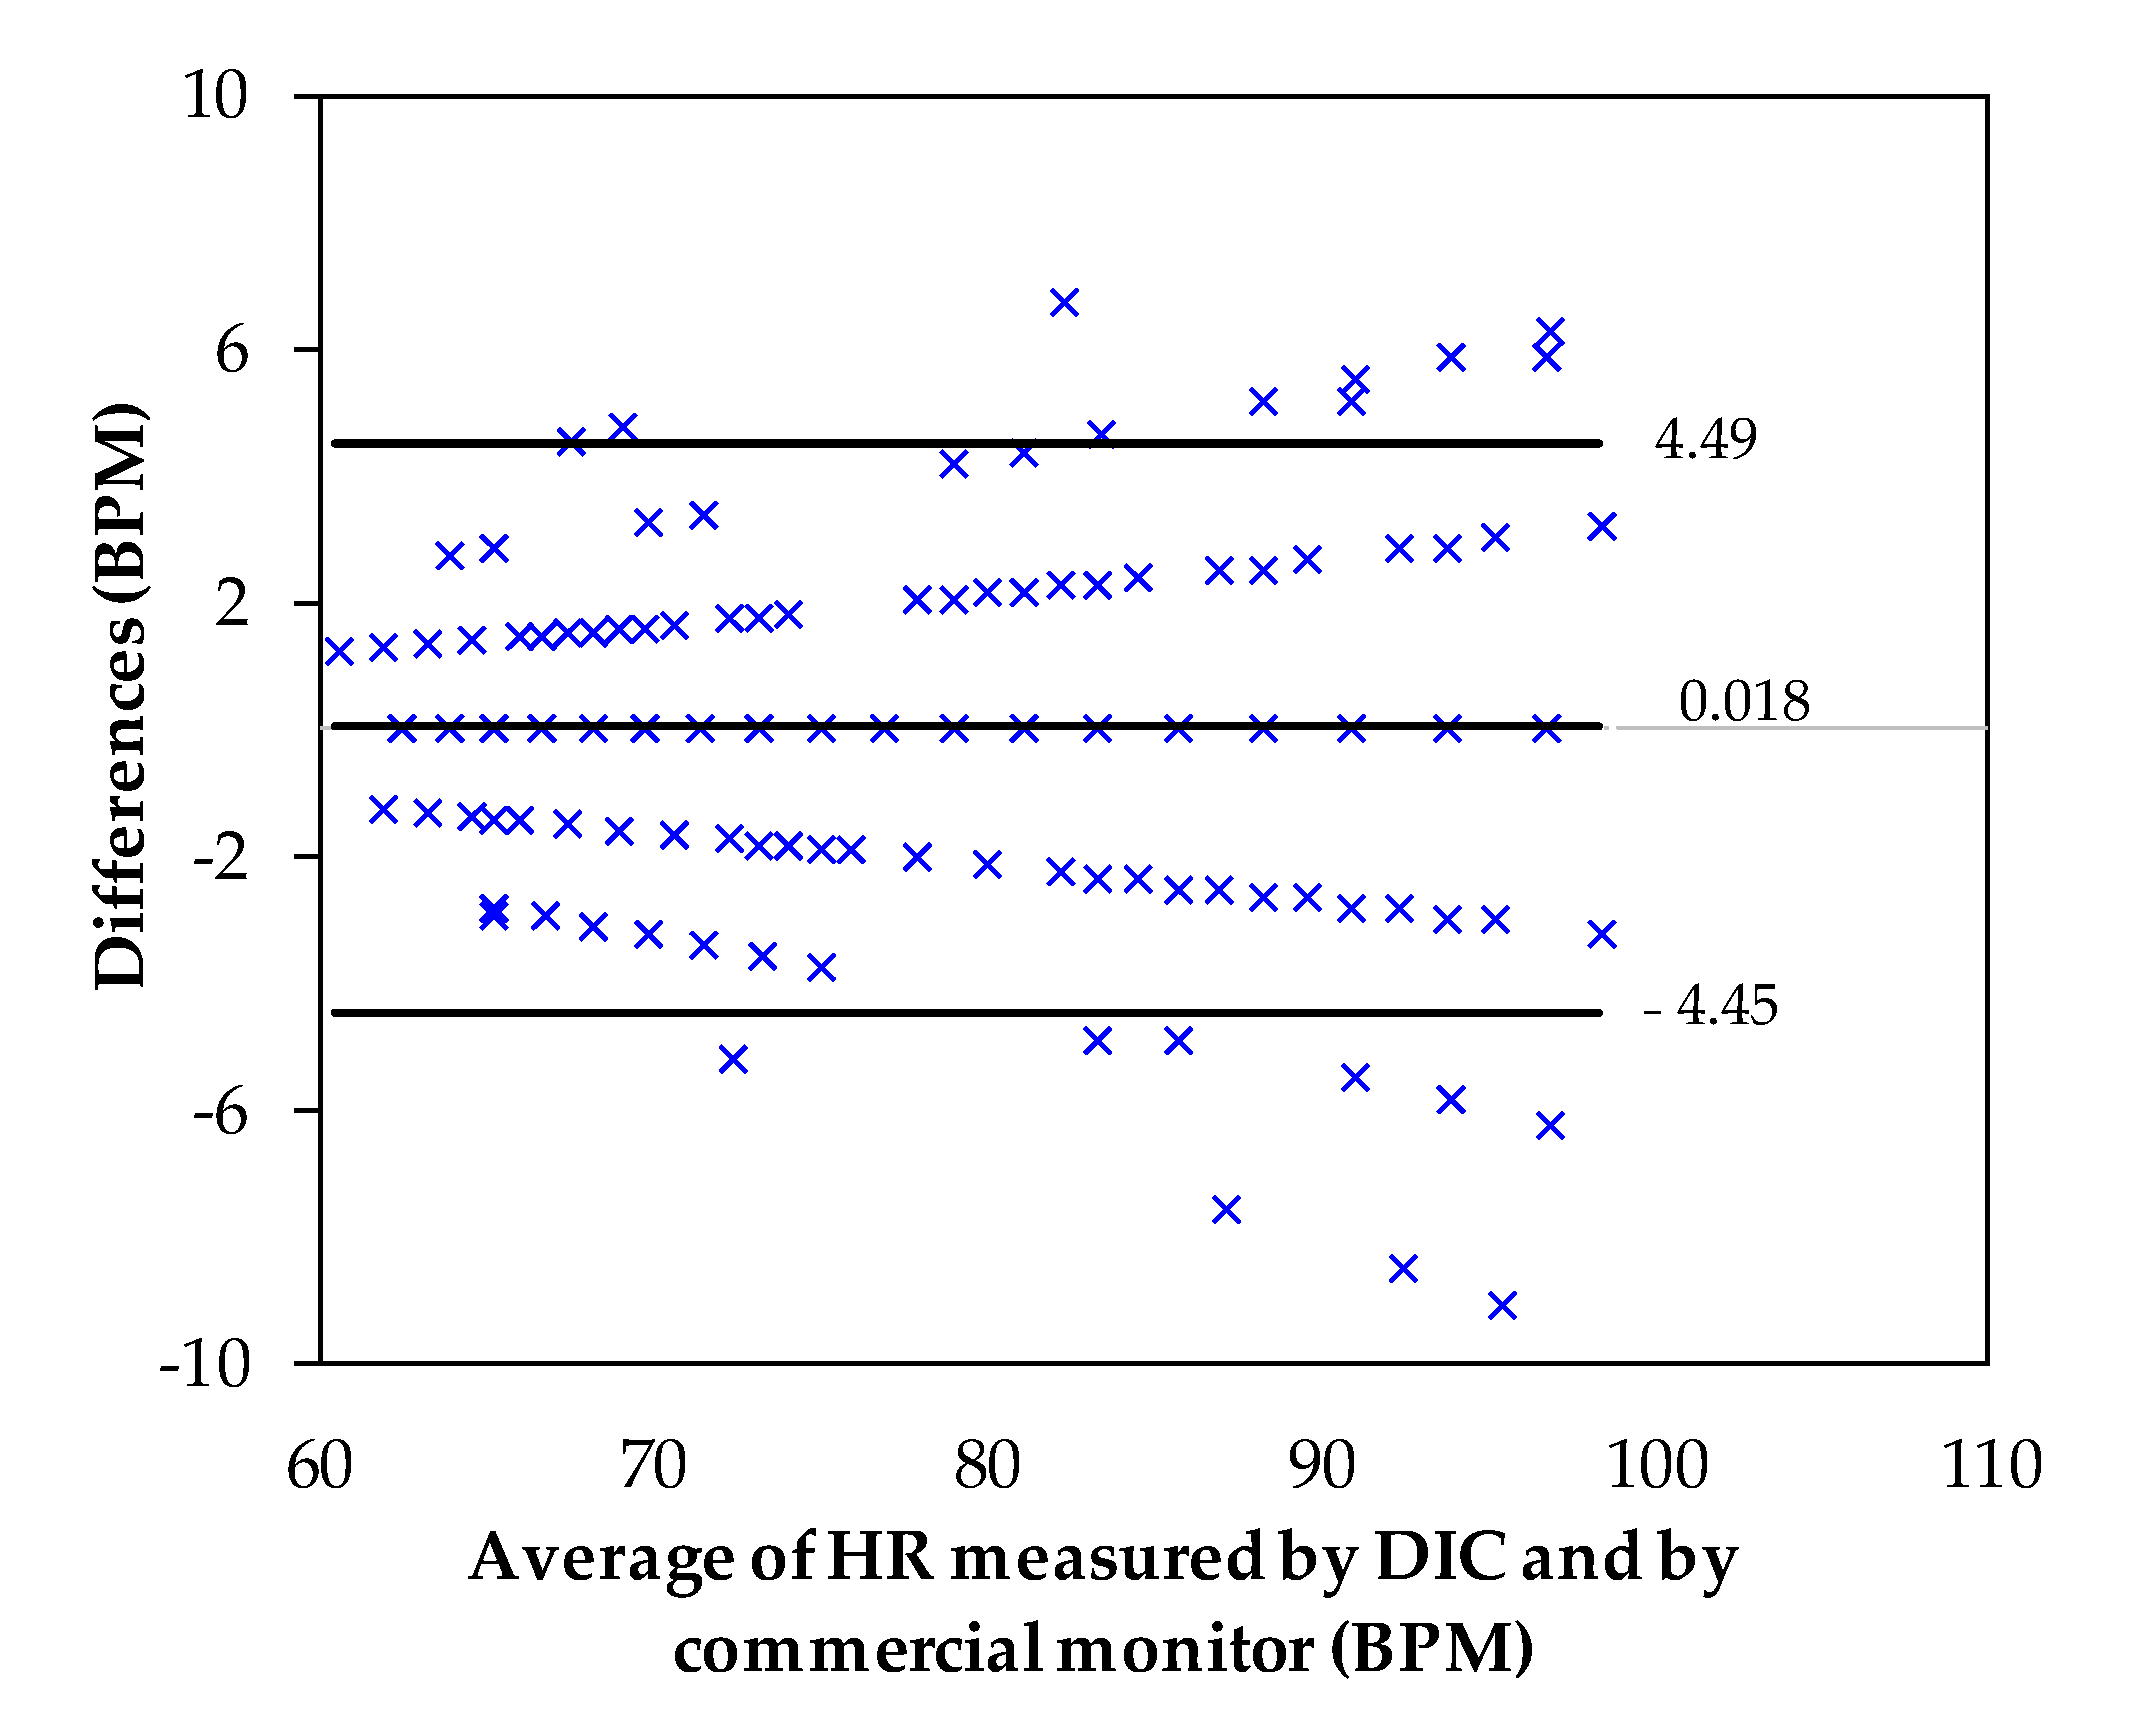
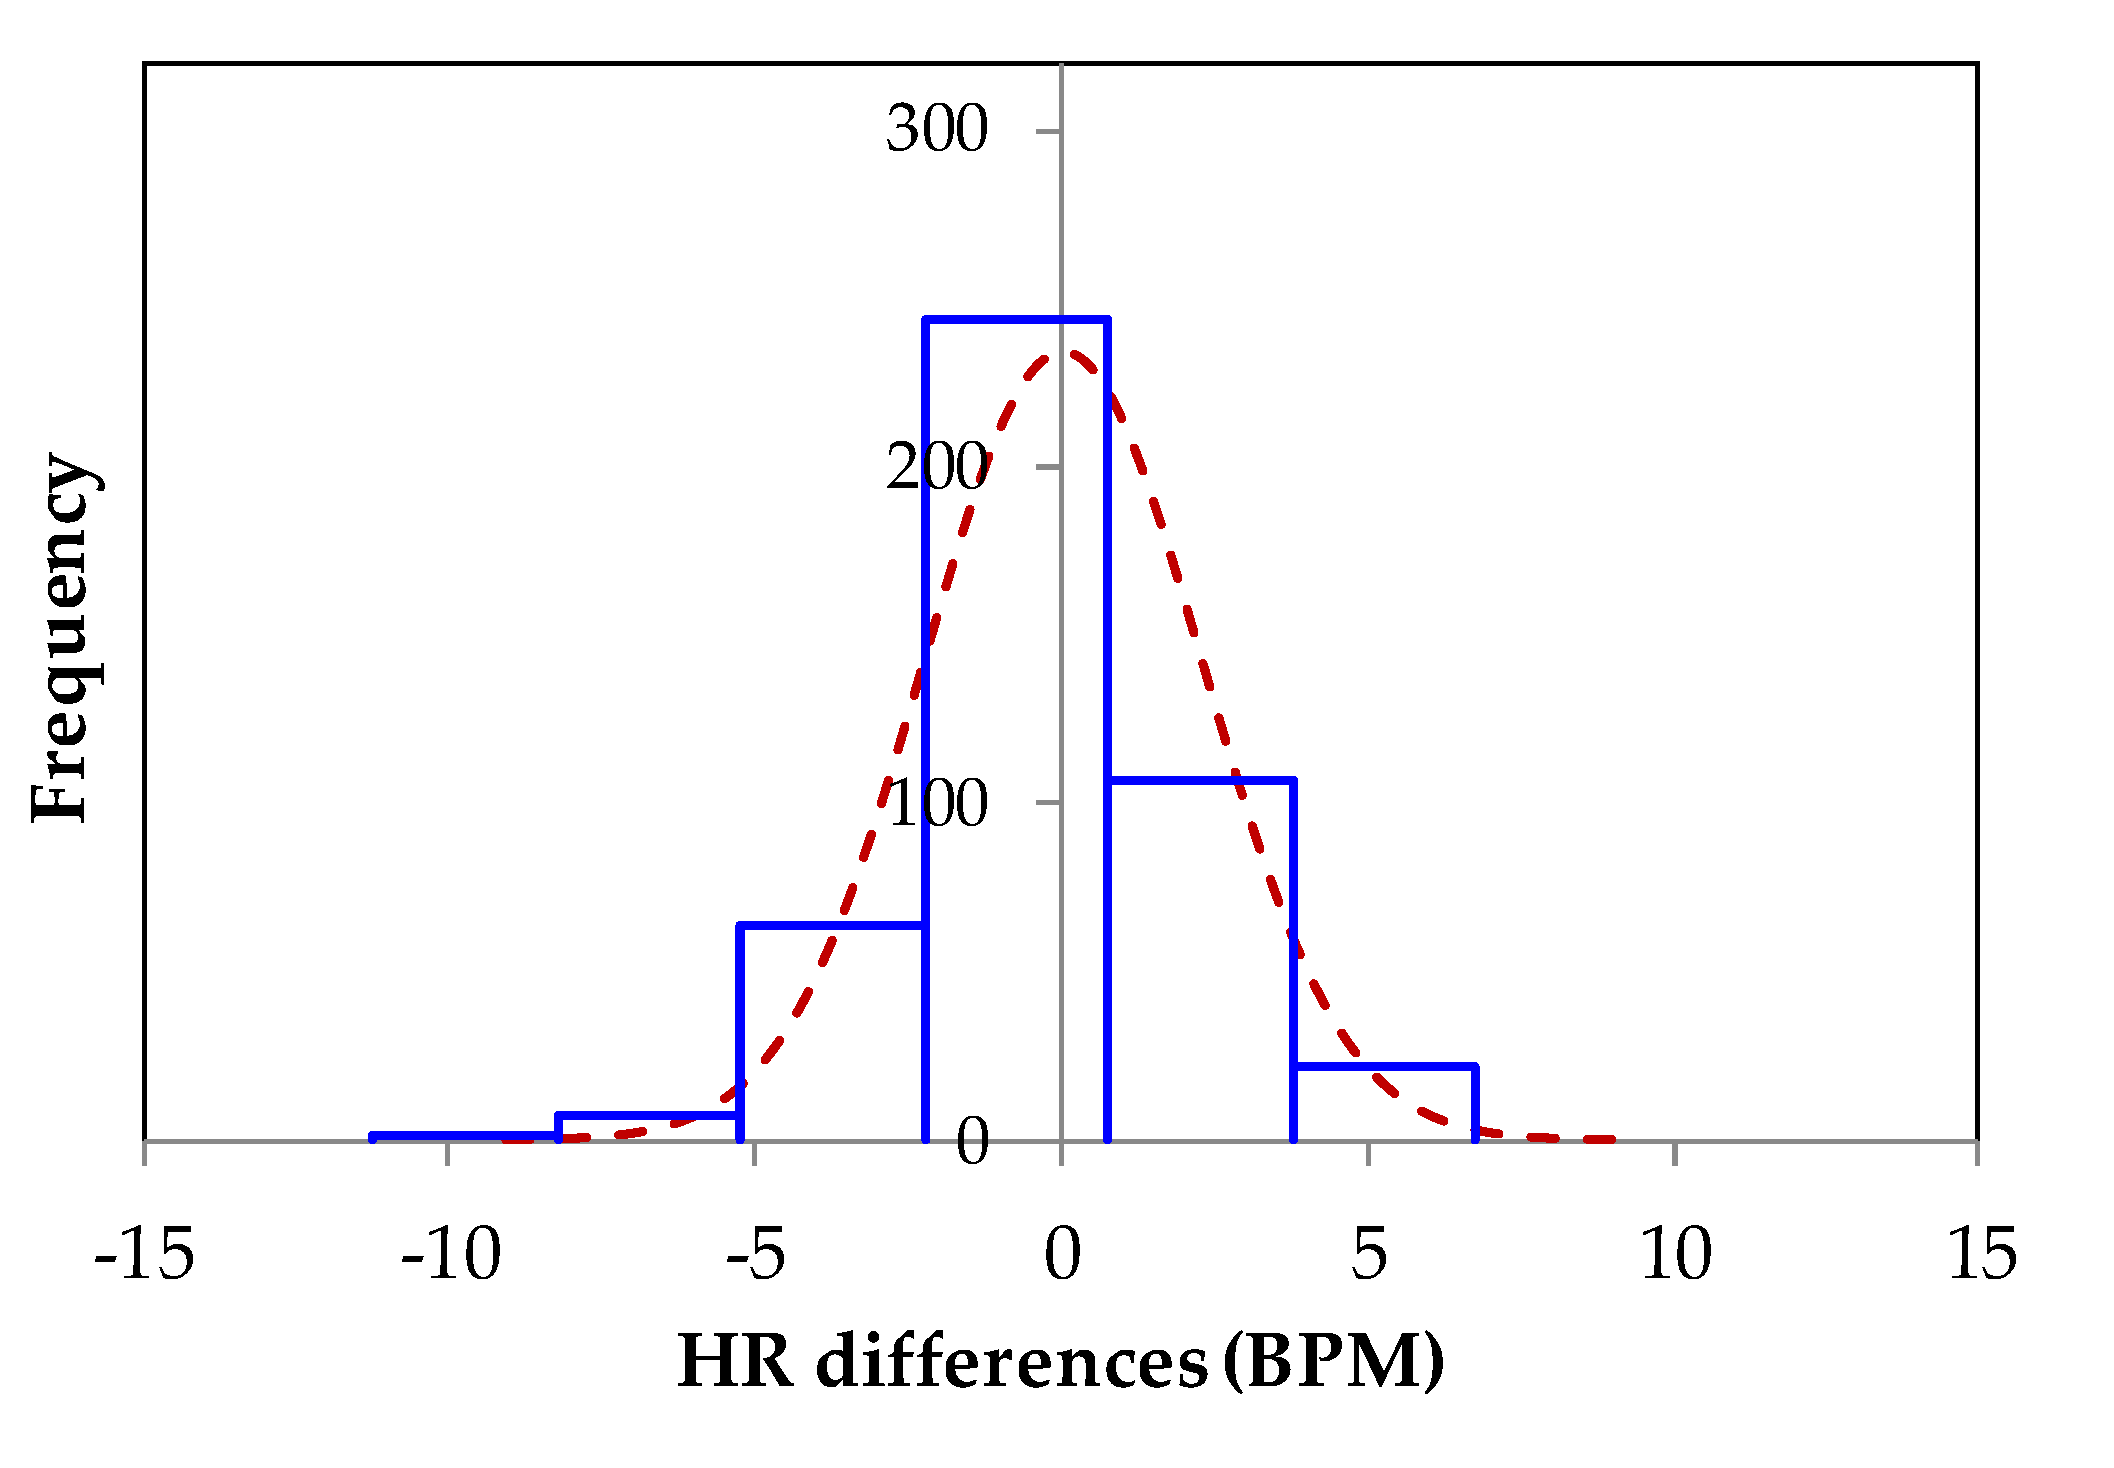
4. Experimental Results and Discussion
5. Conclusions
Author Contributions
Funding
Institutional Review Board Statement
Informed Consent Statement
Data Availability Statement
Conflicts of Interest
References
- Brüser, C.; Antink, C.H.; Wartzek, T.; Walter, M.; Leonhardt, S. Ambient and Unobtrusive Cardiorespiratory Monitoring Techniques. Biomed. Eng. IEEE Rev. 2015, 8, 30–43. [Google Scholar] [CrossRef]
- Ding, X.; Clifton, D.; Ji, N.; Lovell, N.H.; Bonato, P.; Chen, W.; Zhang, Y.T. Wearable sensing and telehealth technology with potential applications in the coronavirus pandemic. IEEE Rev. Biomed. Eng. 2020, 14, 48–70. [Google Scholar] [CrossRef] [PubMed]
- Siivola, J. New noninvasive piezoelectric transducer for recording of respiration, heart rate and body movements. Med. Biol. Eng. Comput. 1989, 27, 423–424. [Google Scholar] [CrossRef] [PubMed]
- Koivistoinen, T.; Junnila, S.; Värri, A.; Kööbi, T. A New Method for Measuring the Ballistocardiogram using EMFi Sensors in a Normal Chair. In Proceedings of the 26th Annual International Conference of the IEEE EMBS, San Francisco, CA, USA, 1–5 September 2004; pp. 2026–2029. [Google Scholar]
- Lin, Y.; Leng, H.; Yang, G.; Cai, H. An intelligent noninvasive sensor for driver pulse wave measurement. Sens. J. IEEE 2007, 7, 790–799. [Google Scholar] [CrossRef]
- Griffiths, E.; Scott, T.; Bernheim, A.J. Health chair: Implicitly sensing heart and respiratory rate. In Proceedings of the 2014 ACM International Joint Conference on Pervasive and Ubiquitous Computing, Seattle, WA, USA, 13–17 September 2014; pp. 661–671. [Google Scholar]
- Hamdani, S.T.A.; Fernando, A. The Application of a Piezo-Resistive Cardiorespiratory Sensor System in a Automobile Safety Belt. Sensors 2015, 15, 7742–7753. [Google Scholar] [CrossRef] [PubMed] [Green Version]
- Wang, D.; Zhang, D.; LU, G. A Novel Multichannel Wrist Pulse System With Different Sensor Arrays. Instrum. Meas. IEEE Trans. 2015, 64, 2020–2034. [Google Scholar] [CrossRef]
- Yaniger, S.I. Force sensing resistors: A review of the technology. In Proceedings of the Electro International IEEE, New York, NY, USA, 16–18 April 1991; pp. 666–668. [Google Scholar]
- Samaun, S.; Wise, K.; Nielsen, E.; Angell, J. An IC piezoresistive pressure sensor for biomedical instrumentation. Biomed. Eng. IEEE Trans. 1973, 2, 101–109. [Google Scholar] [CrossRef] [PubMed]
- Paradiso, R.; Loriga, G.; Taccini, N. A wearable health care system based on knitted integrated sensors. Inf. Technol. Biomed. 2005, 9, 337–344. [Google Scholar] [CrossRef]
- Taccini, N.; Loriga, G.; Pacelli, M.; Paradiso, R. Wearable monitoring system for chronic cardio-respiratory diseases. In Proceedings of the Engineering in Medicine and Biology Society, EMBS, Vancouver, Canada, 20–25 August 2008; pp. 3690–3693. [Google Scholar]
- Hu, Q.; Tang, X.; Tang, W. A smart chair sitting posture recognition system using flex sensors and FPGA implemented artificial neural network. IEEE Sens. J. 2020, 20, 8007–8016. [Google Scholar] [CrossRef]
- Morales, I.; González-Landaeta, R.; Simini, F. Pressure sensors used as bioimpedance plantar electrodes: A feasibility study. In Proceedings of the 2021 IEEE International Symposium on Medical Measurements and Applications (MeMeA), Lausanne, Switzerland, 23–25 June 2021; pp. 1–6. [Google Scholar]
- Esposito, D.; Andreozzi, E.; Fratini, A.; Gargiulo, G.D.; Savino, S.; Niola, V.; Bifulco, P. A piezoresistive sensor to measure muscle contraction and mechanomyography. Sensors 2018, 18, 2553. [Google Scholar] [CrossRef] [PubMed] [Green Version]
- Sifuentes, E.; Gonzalez-Landaeta, R.; Cota-Ruiz, J.; Reverter, F. Seat occupancy detection based on a low-power microcontroller and a single FSR. Sensors 2019, 19, 699. [Google Scholar] [CrossRef] [PubMed] [Green Version]
- Pallàs-Areny, R.; Webster, J.G. Sensors and Signal Conditioning, 2nd ed.; John Wiley & Sons: New York, NY, USA, 2001; pp. 94–109. [Google Scholar]
- Reverter, F.; Pallàs-Areny, R. Direct Sensor-to-Microcontroller Interface Circuits, 1st ed.; Marcombo: Barcelona, Spain, 2005; pp. 94–109. [Google Scholar]
- Reverter, F. The art of directly interfacing sensors to microcontrollers. Low Power Electron. Appl. J. 2012, 2, 265–281. [Google Scholar] [CrossRef] [Green Version]
- Reverter, F. Direct interface circuits for sensors. In Smart Sensors and MEMS: Intelligent Devices and Microsystems for Industrial Applications, 1st ed.; Nihtianov, S., Luque, A., Eds.; Woodhead Publishing: Sawston, Cambridge, UK, 2014; pp. 27–62. [Google Scholar]
- Anandanatarajan, R.; Mangalanathan, U.; Gandhi, U. Enhanced microcontroller interface of resistive sensors through resistance-to-time converter. IEEE Trans. Instrum. Meas. 2019, 69, 2698–2706. [Google Scholar] [CrossRef]
- Sifuentes, E.; Cota-Ruiz, J.; González-Landaeta, R. Respiratory Rate Detection by a Time-Based Measurement System. Rev. Mex. De Ing. Bioméd. 2016, 37, 91–99. [Google Scholar]
- Shu, Y.; Li, C.; Wang, Z.; Mi, W. A Pressure Sensing System for Heart Rate Monitoring with Polymer-Based Pressure Sensors and an Anti-Interference Post Processing Circuit. Sensors 2015, 15, 3224–3235. [Google Scholar] [CrossRef] [Green Version]
- Reverter, F.; Pallàs-Areny, R. Effective number of resolution bits in direct sensor-to-microcontroller interfaces. Meas. Sci. Technol. 2004, 15, 2157–2162. [Google Scholar] [CrossRef]
- Sifuentes, E.; Gonzalez-Landaeta, R.; Cota-Ruiz, J.; Reverter, F. Measuring dynamic signals with direct sensor-to-microcontroller interfaces applied to a magnetoresistive sensor. Sensors 2017, 17, 1150. [Google Scholar] [CrossRef] [PubMed] [Green Version]
- Bland, J.M.; Altman, D. Statistical methods for assessing agreement between two methods of clinical measurement. Lancet 1986, 327, 307–310. [Google Scholar] [CrossRef]
- Bland, J.M.; Altman, D.G. Agreement between methods of measurement with multiple observations per individual. J. Biopharm. Stat. 2007, 17, 571–582. [Google Scholar] [CrossRef] [PubMed] [Green Version]
- Nie, L.; Berckmans, D.; Wang, C.; Li, B. Is continuous heart rate monitoring of livestock a dream or is it realistic? A review. Sensors 2020, 20, 2291. [Google Scholar] [CrossRef]
- Lee, J.; Kim, M.; Park, H.-K.; Kim, I.Y. Motion Artifact Reduction in Wearable Photoplethysmography Based on Multi-Channel Sensors with Multiple Wavelengths. Sensors 2020, 20, 1493. [Google Scholar] [CrossRef] [PubMed] [Green Version]


Publisher’s Note: MDPI stays neutral with regard to jurisdictional claims in published maps and institutional affiliations. |
© 2021 by the authors. Licensee MDPI, Basel, Switzerland. This article is an open access article distributed under the terms and conditions of the Creative Commons Attribution (CC BY) license (https://creativecommons.org/licenses/by/4.0/).
Share and Cite
Bravo, G.; Silva, J.M.; Noriega, S.A.; Martínez, E.A.; Enríquez, F.J.; Sifuentes, E. A Power-Efficient Sensing Approach for Pulse Wave Palpation-Based Heart Rate Measurement. Sensors 2021, 21, 7549. https://doi.org/10.3390/s21227549
Bravo G, Silva JM, Noriega SA, Martínez EA, Enríquez FJ, Sifuentes E. A Power-Efficient Sensing Approach for Pulse Wave Palpation-Based Heart Rate Measurement. Sensors. 2021; 21(22):7549. https://doi.org/10.3390/s21227549
Chicago/Turabian StyleBravo, Gabriel, Jesús M. Silva, Salvador A. Noriega, Erwin A. Martínez, Francisco J. Enríquez, and Ernesto Sifuentes. 2021. "A Power-Efficient Sensing Approach for Pulse Wave Palpation-Based Heart Rate Measurement" Sensors 21, no. 22: 7549. https://doi.org/10.3390/s21227549
APA StyleBravo, G., Silva, J. M., Noriega, S. A., Martínez, E. A., Enríquez, F. J., & Sifuentes, E. (2021). A Power-Efficient Sensing Approach for Pulse Wave Palpation-Based Heart Rate Measurement. Sensors, 21(22), 7549. https://doi.org/10.3390/s21227549