
Individualised Ball Speed Prediction in Baseball Pitching Based on IMU Data

_Veeger.png)
 ,
,  and
and
Abstract
:1. Introduction
2. Materials and Methods
2.1. Participants
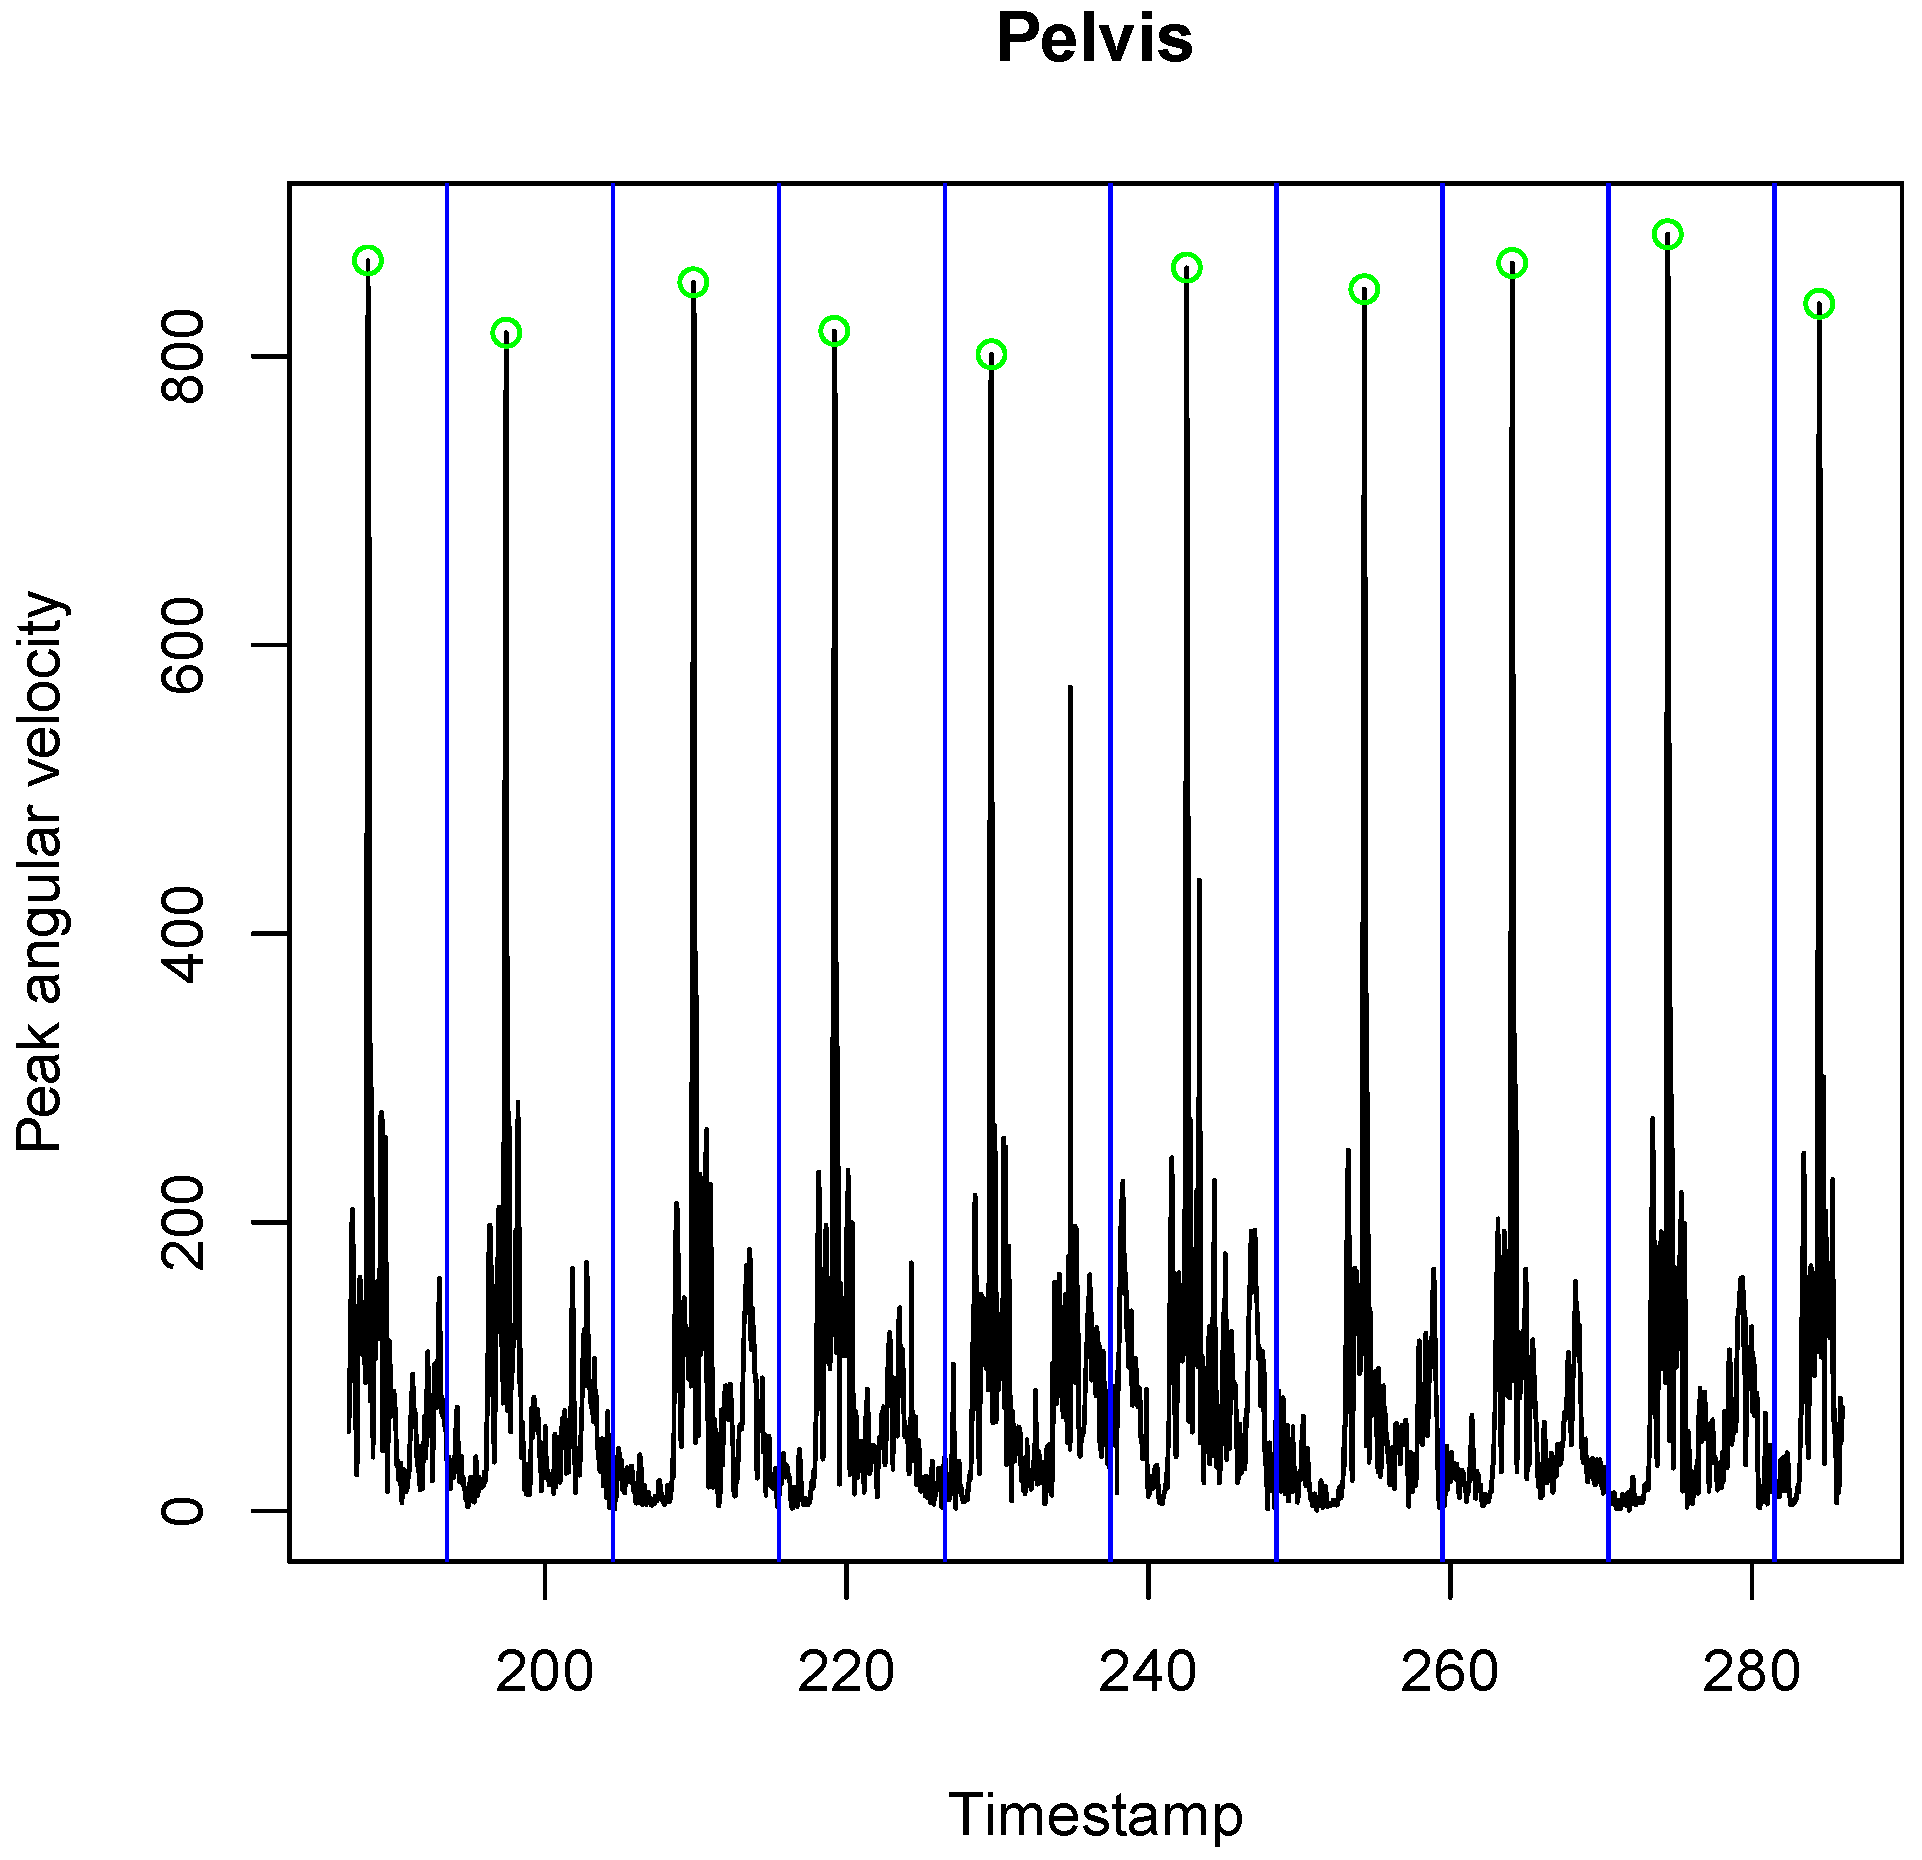
2.2. Methodology
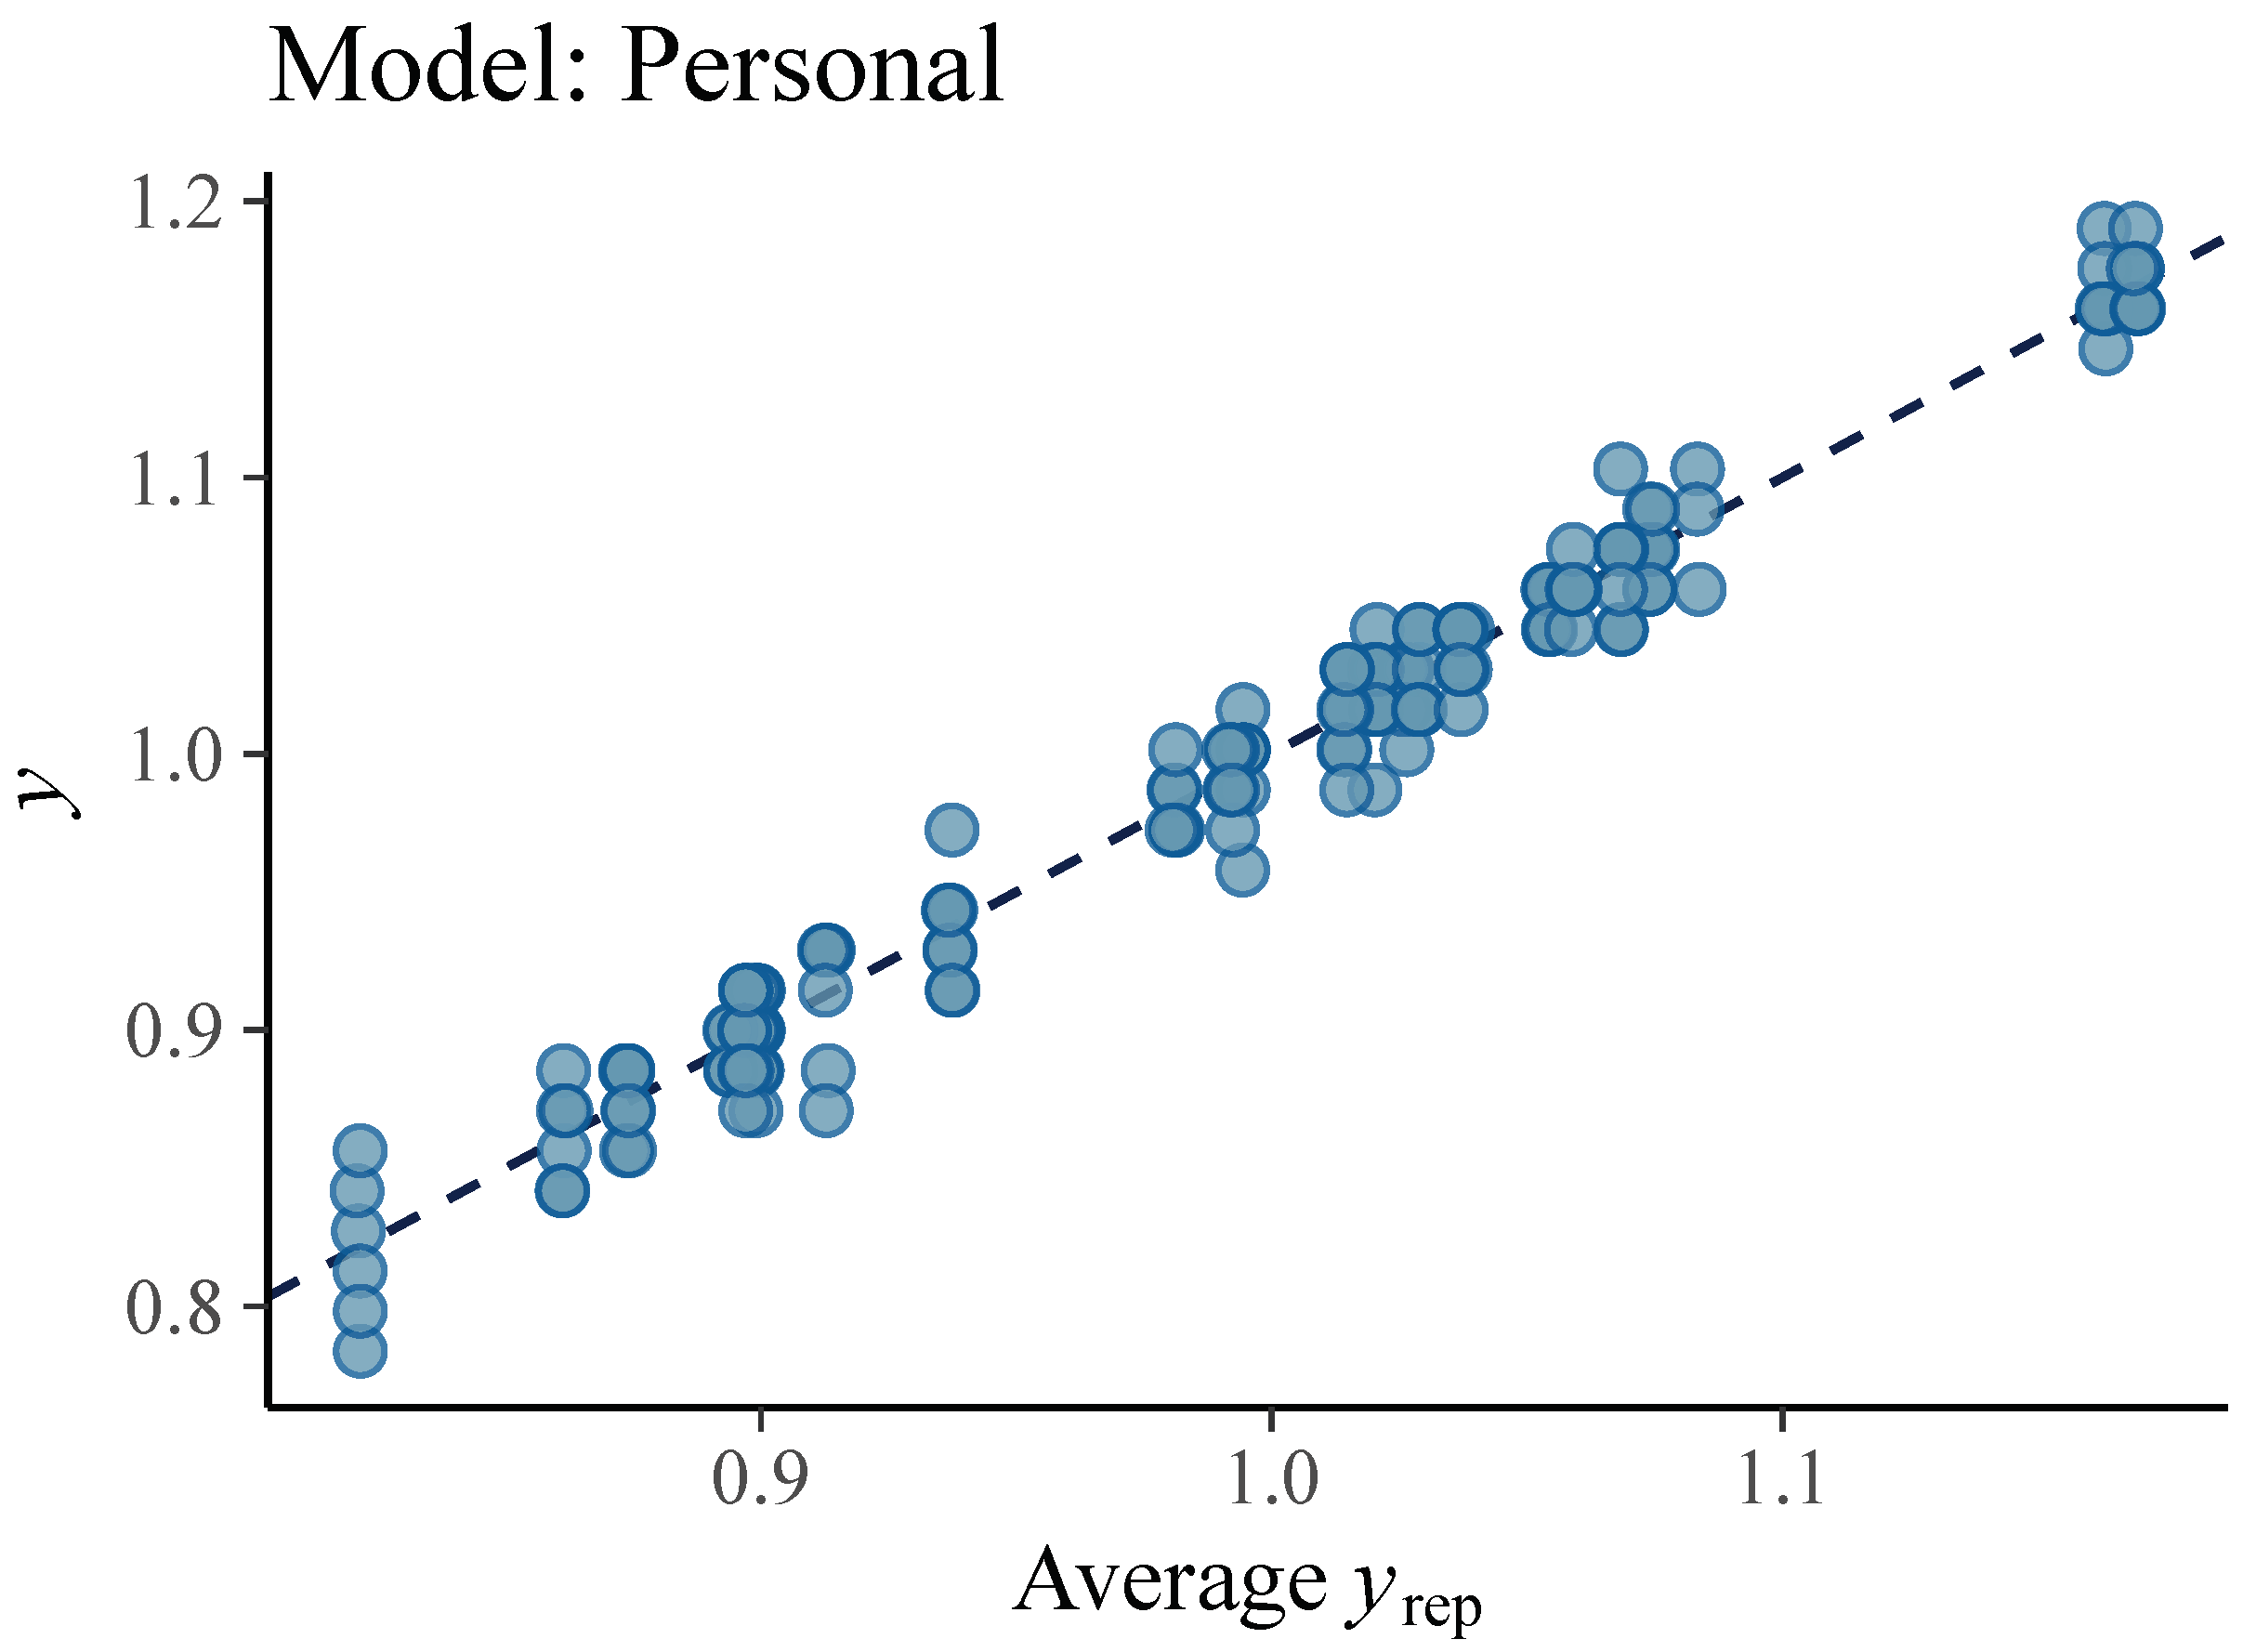
2.3. Statistical Analysis
- 1.
- Complete-pooling model (Observations)The complete-pooling model is a single classical regression model completely ignoring group information. In other words, the model treats all ball throws as different observations of the same participant. The model is given bywhere are individual-level predictors, namely peak angular velocity of pelvis and trunk, respectively. The complete-pooling model does not make a distinction between different pitchers and in that way neglects their personal characteristics.
- 2.
- Two-level varying-intercept model (Personal)The two-level varying-intercept model is a regression that opposed to complete-pooling includes indicators for groups. In this model an intercept is calculated for every group and one joint slope is assumed for the entire sample. The model is given bywhere is a centered group-level predictor, namely pitcher’s height. The group membership denotes pitcher j throwing a ball i. In this model pitching technique is neglected and the outcome depends only on height of an individual pitcher.
- 3.
- Two-level varying-intercept, varying-slope model (Full)The varying-intercept, varying-slope model represents the model in which both the intercept and the slope vary by group. The model is given byand includes both individual- and group-level predictors. In both (3) and (5), the coefficient can be interpreted as the ball speed of a ball thrown without any pelvis and trunk rotation by the pitcher of an average height. The in (1), (2) and (4) and in (3) and (5) represent independent error terms at each of the two levels.
3. Results
4. Discussion
Author Contributions
Funding
Institutional Review Board Statement
Informed Consent Statement
Data Availability Statement
Conflicts of Interest
References
- Pappas, A.M.; Zawacki, R.M.; Sullivan, T.J. Biomechanics of baseball pitching. A preliminary report. Am. J. Sport. Med. 1985, 13, 216–222. [Google Scholar] [CrossRef] [PubMed]
- Seroyer, S.T.; Nho, S.J.; Bach, B.R.; Bush-Joseph, C.A.; Nicholson, G.P.; Romeo, A.A. The kinetic chain in overhand pitching: Its potential role for performance enhancement and injury prevention. Sports Health 2010, 2, 135–146. [Google Scholar] [CrossRef] [PubMed] [Green Version]
- Anz, A.W.; Bushnell, B.D.; Griffin, L.P.; Noonan, T.J.; Torry, M.R.; Hawkins, R.J. Correlation of Torque and Elbow Injury in Professional Baseball Pitchers. Am. J. Sport. Med. 2010, 38, 1368–1374. [Google Scholar] [CrossRef] [PubMed]
- Hay, J.G. The Biomechanics of Sports Techniques, 4th ed.; Prentice-Hall: Englewood Cliffs, NJ, USA, 1993. [Google Scholar]
- Lehman, G.; Drinkwater, E.J.; Behm, D.G. Correlation of throwing velocity to the results of lower-body field tests in male college baseball players. J. Strength Cond. Res. 2013, 27, 902–908. [Google Scholar] [CrossRef] [PubMed] [Green Version]
- Fortenbaugh, D.; Fleisig, G.S.; Andrews, J.R. Baseball Pitching Biomechanics in Relation to Injury Risk and Performance. Sports Health 2009, 1, 314–320. [Google Scholar] [CrossRef] [PubMed] [Green Version]
- Werner, S.L.; Suri, M.; Guido, J.A., Jr.; Meister, K.; Jones, D.G. Relationships between ball velocity and throwing mechanics in collegiate baseball pitchers. J. Shoulder Elbow Surg. 2008, 17, 905–908. [Google Scholar] [CrossRef] [PubMed]
- Dowling, B.; Pearl, C.; Laughlin, W.; Fleisig, G. Relationship of pelvis and trunk kinematics to ball velocity in professional baseball pitchers. In Proceedings of the 40th American Society of Biomechanics (ASB) Annual Meeting (ASB 2016), Raleigh, NC, USA, 2–5 August 2016. [Google Scholar]
- Camomilla, V.; Bergamini, E.; Fantozzi, S.; Vannozzi, G. Trends Supporting the In-Field Use of Wearable Inertial Sensors for Sport Performance Evaluation: A Systematic Review. Sensors 2018, 18, 873. [Google Scholar] [CrossRef] [PubMed] [Green Version]
- Van der Graaff, E.; Hoozemans, M.J.M.; Nijhoff, M.; Davidson, M.; Hoezen, M.; Veeger, H.E.J. Timing of peak pelvis and thorax rotation velocity in baseball pitching. J. Phys. Fit. Sport. Med. 2018, 7, 269–277. [Google Scholar] [CrossRef]
- Skejø, S.D.; Bencke, J.; Møller, M.; Sørensen, H. Estimating Throwing Speed in Handball Using a Wearable Device. Sensors 2020, 20, 4925. [Google Scholar] [CrossRef]
- McGrath, J.; Neville, J.; Stewart, T.; Clinning, H.; Cronin, J. Can an inertial measurement unit (IMU) in combination with machine learning measure fast bowling speed and perceived intensity in cricket? J. Sport. Sci. 2021, 39, 1402–1409. [Google Scholar] [CrossRef] [PubMed]
- Gençoğlu, C.; Gümüş, H. Standing handball throwing velocity estimation with a single wrist-mounted inertial sensor. Ann. Appl. Sport Sci. 2020, 8. [Google Scholar] [CrossRef]
- Matsuo, T.; Escamilla, R.F.; Fleisig, G.S.; Barrentine, S.W.; Andrews, J.R. Comparison of Kinematic and Temporal Parameters between Different Pitch Velocity Groups. J. Appl. Biomech. 2001, 17, 1–13. Available online: http://journals.humankinetics.com/view/journals/jab/17/1/article-243243p1.xml (accessed on 4 June 2021). [CrossRef]
- Kuhn, M.; Johnson, K. Applied Predictive Modeling; Springer: Berlin/Heidelberg, Germany, 2013. [Google Scholar]
- Kuhn, M. Caret: Classification and Regression Training. R Package Version 6.0-86. 2020. Available online: https://CRAN.R-project.org/package=caret (accessed on 30 August 2021).
- R Core Team. R: A Language and Environment for Statistical Computing; R Foundation for Statistical Computing: Vienna, Austria, 2020; Available online: https://www.R-project.org/ (accessed on 30 August 2021).
- Goodrich, B.; Gabry, J.; Ali, I.; Brilleman, S. Rstanarm: Bayesian Applied Regression Modeling via Stan. R Package Version 2.21.1. 2020. Available online: https://mc-stan.org/rstanarm (accessed on 30 August 2021).
- Muth, C.; Oravecz, Z.; Gabry, J. User-friendly Bayesian regression modeling: A tutorial with rstanarm and shinystan. Quant. Methods Psychol. 2018, 14, 99–119. [Google Scholar] [CrossRef]
- Vehtari, A.; Gelman, A.; Gabry, J. Practical Bayesian model evaluation using leave-one-out cross-validation and WAIC. Stat. Comput. 2017, 27, 1413–1432. [Google Scholar] [CrossRef] [Green Version]
- Dun, S.; Loftice, J.; Fleisig, G.S.; Kingsley, D.; Andrews, J.R. A biomechanical comparison of youth baseball pitches: Is the curveball potentially harmful? Am. J. Sport. Med. 2008, 36, 686–692. [Google Scholar] [CrossRef] [PubMed]
- Van der Graaff, E.; Hoozemans, M.; Nijhoff, M.; Davidson, M.; Hoezen, M.; Veeger, D. The role of pelvis and thorax rotation velocity in baseball pitching. In Proceedings of the 34th International Conference on Biomechanics in Sports, Tsukuba, Japan, 18–22 July 2016. [Google Scholar]


| Mean ± Standard Deviation | |
|---|---|
| Peak pelvis angular velocity (deg/s) | 690.2 ± 90.9 |
| Peak trunk angular velocity (deg/s) | 1172.4 ± 239.5 |
| Ball velocity (mph) | 68.3 ± 6.5 |
| () | |
|---|---|
| () |
| Full | 0.975 | 0.014 |
| Personal | 0.973 | 0.014 |
| Observations | 0.137 | 0.089 |
Publisher’s Note: MDPI stays neutral with regard to jurisdictional claims in published maps and institutional affiliations. |
© 2021 by the authors. Licensee MDPI, Basel, Switzerland. This article is an open access article distributed under the terms and conditions of the Creative Commons Attribution (CC BY) license (https://creativecommons.org/licenses/by/4.0/).
Share and Cite
Gomaz, L.; Veeger, D.; van der Graaff, E.; van Trigt, B.; van der Meulen, F. Individualised Ball Speed Prediction in Baseball Pitching Based on IMU Data. Sensors 2021, 21, 7442. https://doi.org/10.3390/s21227442
Gomaz L, Veeger D, van der Graaff E, van Trigt B, van der Meulen F. Individualised Ball Speed Prediction in Baseball Pitching Based on IMU Data. Sensors. 2021; 21(22):7442. https://doi.org/10.3390/s21227442
Chicago/Turabian StyleGomaz, Larisa, DirkJan Veeger, Erik van der Graaff, Bart van Trigt, and Frank van der Meulen. 2021. "Individualised Ball Speed Prediction in Baseball Pitching Based on IMU Data" Sensors 21, no. 22: 7442. https://doi.org/10.3390/s21227442
APA StyleGomaz, L., Veeger, D., van der Graaff, E., van Trigt, B., & van der Meulen, F. (2021). Individualised Ball Speed Prediction in Baseball Pitching Based on IMU Data. Sensors, 21(22), 7442. https://doi.org/10.3390/s21227442