
Multi-Focus Image Fusion Using Focal Area Extraction in a Large Quantity of Microscopic Images

 , , ,
, , , 

Abstract
:1. Introduction
2. Materials and Methods
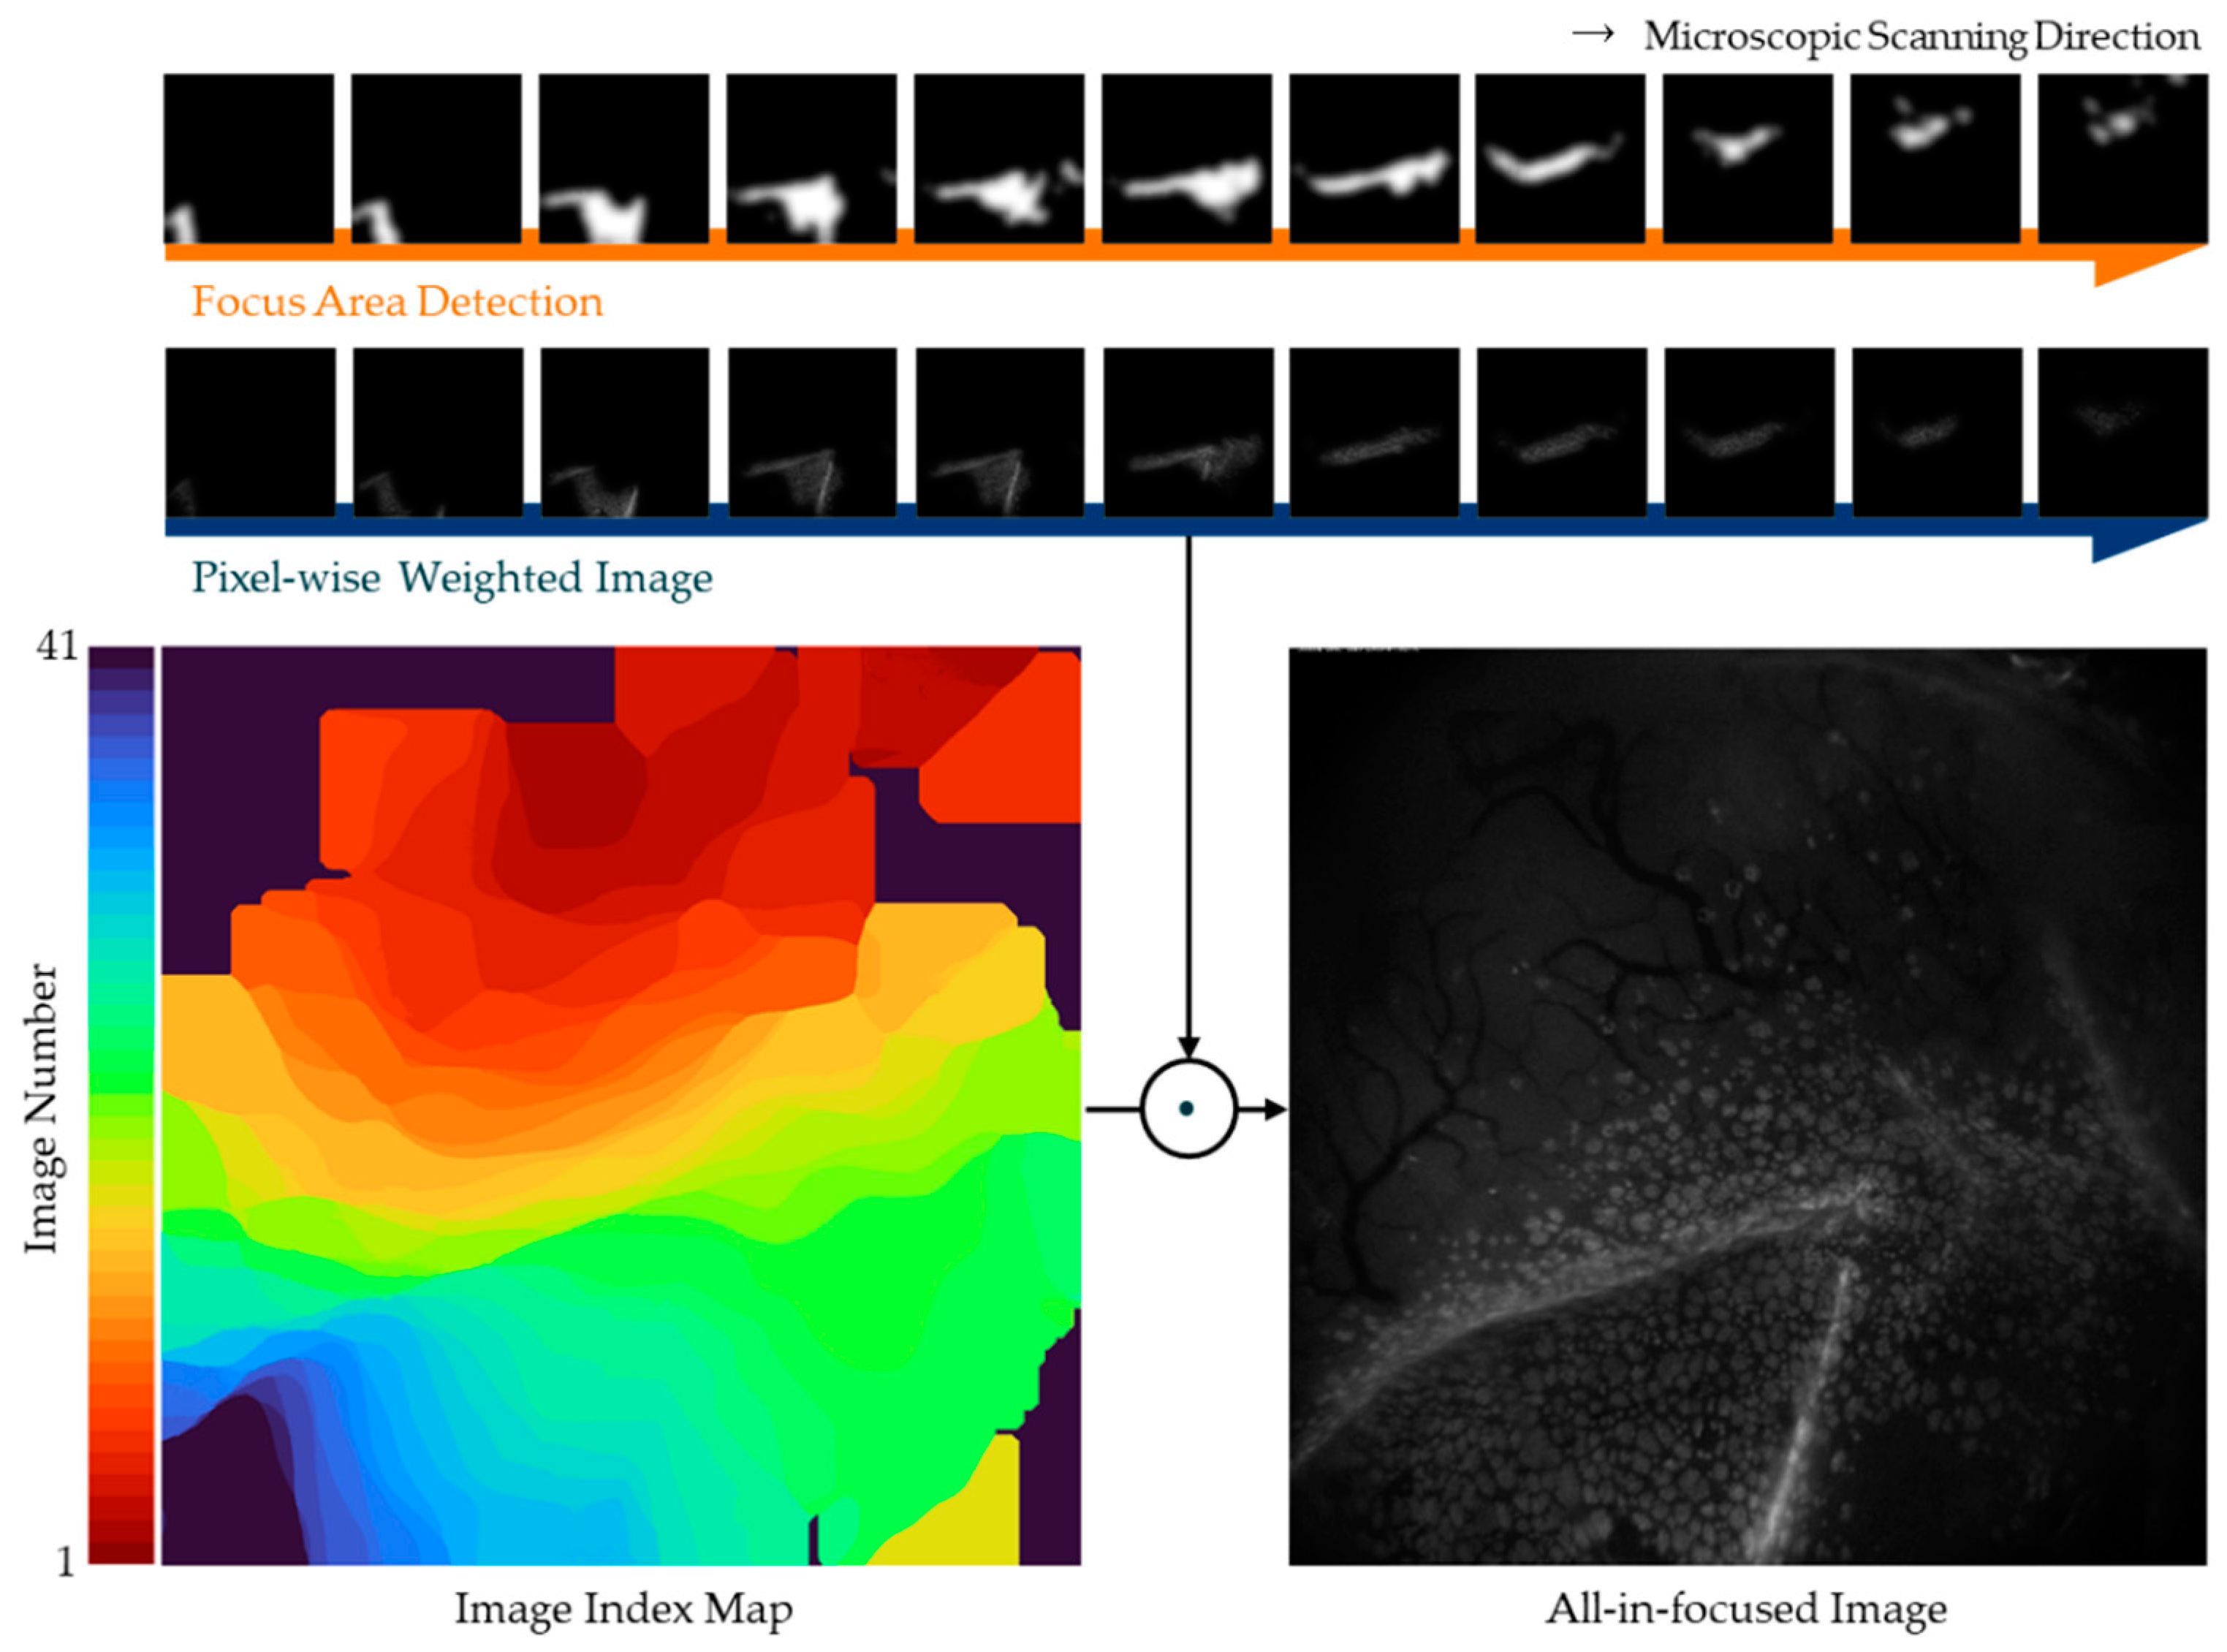
2.1. Proposed Method
2.2. Subjects
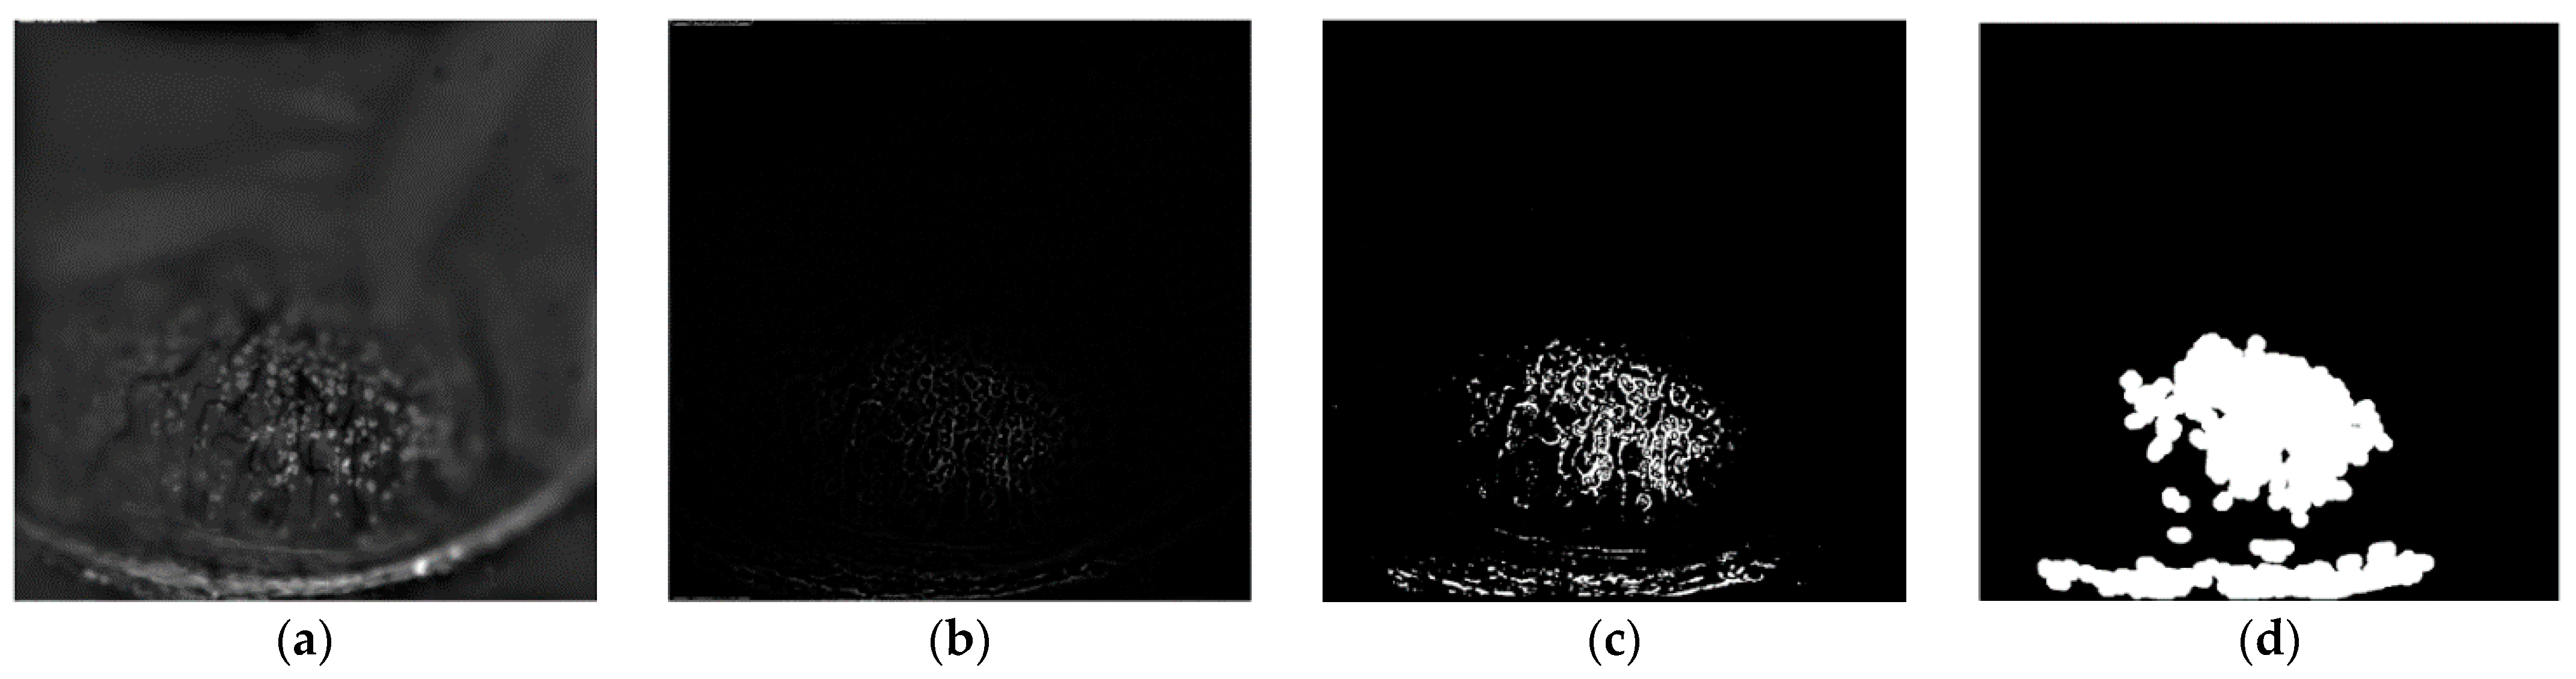
2.3. Focus Area Enhancement Based on the Transform Domain
2.4. Focus Area Detection
2.5. Self-Adjusting Guided Filtered Image Fusion
| Algorithm 1 Multi-focus image fusion algorithm. |
| 1: Input : Source images from fluorescence microscopies. |
| 2: Output , All-in-focus image. |
| 3://Obtain guided filtered focus map of source images |
| 4://Obtain output by selecting the pixels from the set of source images, which depends on the calculated weight of the guidance image for the respective pixels. |
| 5: for |
| 6: for |
| 7: |
| 8: //Arrange the calculated weights of the guidance image with respect to the source images. |
| 9: for /where is the number of source images to be fused |
| 10: |
| 11: //Obtain output by sequentially multiplying the source with the maximum weight. |
| 12: end for |
| 13: end for |
| 14: end for |
2.6. Objective Evaluation Metrics
3. Results and Discussion
4. Conclusions
Author Contributions
Funding
Institutional Review Board Statement
Informed Consent Statement
Conflicts of Interest
References
- Li, S.T.; Kang, X.D.; Fang, L.Y.; Hu, J.W.; Yin, H.T. Pixel-level image fusion: A survey of the state of the art. Inf. Fusion 2017, 33, 100–112. [Google Scholar]
- Ralph, R.A. Conjunctival goblet cell density in normal subjects and in dry eye syndromes. Investig. Ophthalmol. 1975, 14, 299–302. [Google Scholar]
- Colorado, L.H.; Alzahrani, Y.; Pritchard, N.; Efron, N. Assessment of conjunctival goblet cell density using laser scanning confocal microscopy versus impression cytology. Contact Lens Anterior Eye 2016, 39, 221–226. [Google Scholar] [PubMed] [Green Version]
- Cinotti, E.; Singer, A.; Labeille, B.; Grivet, D.; Rubegni, P.; Douchet, C.; Cambazard, F.; Thuret, G.; Gain, P.; Perrot, J.L. Handheld in vivo reflectance confocal microscopy for the diagnosis of eyelid margin and conjunctival tumors. JAMA Ophthalmol. 2017, 135, 845–851. [Google Scholar] [CrossRef] [PubMed]
- Lee, J.; Kim, S.; Yoon, C.H.; Kim, M.J.; Kim, K.H. Moxifloxacin based axially swept wide-field fluorescence microscopy for high-speed imaging of conjunctival goblet cells. Biomed. Opt. Express 2020, 11, 4890–4900. [Google Scholar] [CrossRef]
- Bhat, S.; Koundal, D. Multi-focus image fusion techniques: A survey. Artif. Intell. Rev. 2021, 54, 5735–5787. [Google Scholar] [CrossRef]
- Kaur, H.; Koundal, D.; Kadyan, V. Image fusion techniques: A survey. Arch. Comput. Methods Eng. 2021, 1–23. [Google Scholar] [CrossRef]
- Li, H.; Manjunath, B.S.; Mitra, S.K. Multisensor Image Fusion Using the Wavelet Transform. Graph. Models Image Process. 1995, 57, 235–245. [Google Scholar] [CrossRef]
- Rockinger, O. Image sequence fusion using a shift-invariant wavelet transform. In Proceedings of the International Conference on Image Processing, Santa Barbara, CA, USA, 26–29 October 1997; IEEE: Manhattan, NY, USA, 1997; pp. 288–291. [Google Scholar]
- Mitianoudis, N.; Stathaki, T. Pixel-based and region-based image fusion schemes using ICA bases. Inf. Fusion 2007, 8, 131–142. [Google Scholar] [CrossRef] [Green Version]
- Tang, J.S. A contrast based image fusion technique in the DCT domain. Digit. Signal Process. 2004, 14, 218–226. [Google Scholar] [CrossRef]
- Zhang, Q.; Liu, Y.; Blum, R.S.; Han, J.G.; Tao, D.C. Sparse representation based multi-sensor image fusion for multi-focus and multi-modality images: A review. Inf. Fusion 2018, 40, 57–75. [Google Scholar] [CrossRef]
- Li, S.; Kwok, J.T.; Wang, Y. Combination of images with diverse focuses using the spatial frequency. Inf. Fusion 2001, 2, 169–176. [Google Scholar] [CrossRef]
- Bai, X.Z.; Zhang, Y.; Zhou, F.G.; Xue, B.D. Quadtree-based multi-focus image fusion using a weighted focus-measure. Inf. Fusion 2015, 22, 105–118. [Google Scholar] [CrossRef]
- Li, M.; Cai, W.; Tan, Z. A region-based multi-sensor image fusion scheme using pulse-coupled neural network. Pattern Recognit. Lett. 2006, 27, 1948–1956. [Google Scholar] [CrossRef]
- Huang, Y.; Li, W.S.; Gao, M.L.; Liu, Z. Algebraic Multi-Grid Based Multi-Focus Image Fusion Using Watershed Algorithm. IEEE Access 2018, 6, 47082–47091. [Google Scholar] [CrossRef]
- Bhat, S.; Koundal, D. Multi-focus Image Fusion using Neutrosophic based Wavelet Transform. Appl. Soft Comput. 2021, 106, 107307. [Google Scholar] [CrossRef]
- Yang, Y.; Zhang, Y.M.; Wu, J.H.; Li, L.Y.; Huang, S.Y. Multi-Focus Image Fusion Based on a Non-Fixed-Base Dictionary and Multi-Measure Optimization. IEEE Access 2019, 7, 46376–46388. [Google Scholar] [CrossRef]
- Xu, K.P.; Qin, Z.; Wang, G.L.; Zhang, H.D.; Huang, K.; Ye, S.X. Multi-focus Image Fusion using Fully Convolutional Two-stream Network for Visual Sensors. KSII Trans. Internet Inf. Syst. 2018, 12, 2253–2272. [Google Scholar]
- Bracewell, R.N.; Bracewell, R.N. The Fourier Transform and Its Applications; McGraw-Hill: New York, NY, USA, 1986; Volume 31999. [Google Scholar]
- Li, S.; Kang, X.; Hu, J.; Yang, B. Image matting for fusion of multi-focus images in dynamic scenes. Inf. Fusion 2013, 14, 147–162. [Google Scholar] [CrossRef]
- Nayar, S.K.; Nakagawa, Y. Shape from focus. IEEE Trans. Pattern Anal. Mach. Intell. 1994, 16, 824–831. [Google Scholar] [CrossRef] [Green Version]
- Burt, P.J.; Adelson, E.H. The Laplacian Pyramid as a Compact Image Code. IEEE Trans. Commun. 1983, 31, 532–540. [Google Scholar]
- Sezgin, M.; Sankur, B. Survey over image thresholding techniques and quantitative performance evaluation. J. Electron. Imaging 2004, 13, 146–168. [Google Scholar]
- Haralick, R.M.; Sternberg, S.R.; Zhuang, X.H. Image-Analysis Using Mathematical Morphology. IEEE Trans. Pattern Anal. Mach. Intell. 1987, 9, 532–550. [Google Scholar] [CrossRef] [PubMed]
- De, I.; Chanda, B. Multi-focus image fusion using a morphology-based focus measure in a quad-tree structure. Inf. Fusion 2013, 14, 136–146. [Google Scholar]
- He, K.; Sun, J.; Tang, X. Guided image filtering. IEEE Trans. Pattern Anal. Mach. Intell. 2012, 35, 1397–1409. [Google Scholar]
- Li, H.; Qiu, H.; Yu, Z.; Li, B. Multifocus image fusion via fixed window technique of multiscale images and non-local means filtering. Signal Process. 2017, 138, 71–85. [Google Scholar] [CrossRef]
- Liu, Z.; Blasch, E.; Xue, Z.Y.; Zhao, J.Y.; Laganiere, R.; Wu, W. Objective Assessment of Multiresolution Image Fusion Algorithms for Context Enhancement in Night Vision: A Comparative Study. IEEE Trans. Pattern Anal. Mach. Intell. 2012, 34, 94–109. [Google Scholar] [CrossRef]
- Hossny, M.; Nahavandi, S.; Creighton, D. Comments on ‘Information measure for performance of image fusion’. Electron. Lett. 2008, 44, 1066–1067. [Google Scholar] [CrossRef] [Green Version]
- Wang, Q.; Shen, Y.; Zhang, J.Q. A nonlinear correlation measure for multivariable data set. Phys. D Nonlinear Phenom. 2005, 200, 287–295. [Google Scholar] [CrossRef]
- Xydeas, C.A.; Petrovic, V. Objective image fusion performance measure. Electron. Lett. 2000, 36, 308–309. [Google Scholar]
- Zhao, J.Y.; Laganiere, R.; Liu, Z. Performance assessment of combinative pixel-level image fusion based on an absolute feature measurement. Int. J. Innov. Comput. Inf. Control 2007, 3, 1433–1447. [Google Scholar]
- Chen, Y.; Blum, R.S. A new automated quality assessment algorithm for image fusion. Image Vis. Comput. 2009, 27, 1421–1432. [Google Scholar] [CrossRef]
- Huynh-Thu, Q.; Ghanbari, M. Scope of validity of PSNR in image/video quality assessment. Electron. Lett. 2008, 44, 800–801. [Google Scholar] [CrossRef]
- Wang, Z.; Bovik, A.C.; Sheikh, H.R.; Simoncelli, E.P. Image quality assessment: From error visibility to structural similarity. IEEE Trans. Image Process. 2004, 13, 600–612. [Google Scholar] [CrossRef] [Green Version]
- Mittal, A.; Moorthy, A.K.; Bovik, A.C. No-Reference Image Quality Assessment in the Spatial Domain. IEEE Trans. Image Process. 2012, 21, 4695–4708. [Google Scholar] [CrossRef] [PubMed]
- Mittal, A.; Soundararajan, R.; Bovik, A.C. Making a “completely blind” image quality analyzer. IEEE Signal Process. Lett. 2012, 20, 209–212. [Google Scholar]
- Qiu, X.H.; Li, M.; Zhang, L.Q.; Yuan, X.J. Guided filter-based multi-focus image fusion through focus region detection. Signal Process.-Image Commun. 2019, 72, 35–46. [Google Scholar] [CrossRef]


| QMI | QNCIE | QG | QP | QCB | PSNR | SSIM | |
|---|---|---|---|---|---|---|---|
| DWT | 1.8534 | 0.8322 | 0.9513 | 0.9363 | 0.9558 | 47.3966 | 0.9851 |
| Quad-tree | 1.7286 | 0.8298 | 0.9346 | 0.9064 | 0.9318 | 45.5006 | 0.9811 |
| GFDF | 1.4601 | 0.8242 | 0.8040 | 0.8489 | 0.8436 | 47.7980 | 0.9868 |
| Ours | 1.8796 | 0.8327 | 0.9519 | 0.9354 | 0.9726 | 47.4428 | 0.9854 |
| QMI | QNCIE | QG | QP | QCB | PSNR | SSIM | |
|---|---|---|---|---|---|---|---|
| DWT | 1.8902 | 0.9074 | 0.9630 | 0.9547 | 0.9629 | 43.7463 | 0.9860 |
| Quad-tree | 1.8083 | 0.9007 | 0.9593 | 0.9372 | 0.9467 | 42.8896 | 0.9856 |
| GFDF | 1.5250 | 0.8818 | 0.8919 | 0.8816 | 0.5276 | 43.3569 | 0.9874 |
| Ours | 1.9182 | 0.9098 | 0.9652 | 0.9578 | 0.9815 | 44.3206 | 0.9870 |
| DWT | Quad-Tree | GFDF | Ours | |
|---|---|---|---|---|
| BRISQUE | 42.590 | 43.459 | 35.619 | 35.890 |
| NIQE | 12.969 | 12.515 | 3.442 | 2.955 |
| DWT | Quad-Tree | GFDF | Ours | |
|---|---|---|---|---|
| BRISQUE | 42.239 | 43.443 | 36.941 | 31.006 |
| NIQE | 11.768 | 12.063 | 3.883 | 2.855 |
| DWT | Quad-Tree | GFDF | Ours | |
|---|---|---|---|---|
| BRISQUE | 42.668 | 43.499 | 19.908 | 31.676 |
| NIQE | 15.775 | 19.467 | 4.221 | 3.28 |
Publisher’s Note: MDPI stays neutral with regard to jurisdictional claims in published maps and institutional affiliations. |
© 2021 by the authors. Licensee MDPI, Basel, Switzerland. This article is an open access article distributed under the terms and conditions of the Creative Commons Attribution (CC BY) license (https://creativecommons.org/licenses/by/4.0/).
Share and Cite
Lee, J.; Jang, S.; Lee, J.; Kim, T.; Kim, S.; Seo, J.; Kim, K.H.; Yang, S. Multi-Focus Image Fusion Using Focal Area Extraction in a Large Quantity of Microscopic Images. Sensors 2021, 21, 7371. https://doi.org/10.3390/s21217371
Lee J, Jang S, Lee J, Kim T, Kim S, Seo J, Kim KH, Yang S. Multi-Focus Image Fusion Using Focal Area Extraction in a Large Quantity of Microscopic Images. Sensors. 2021; 21(21):7371. https://doi.org/10.3390/s21217371
Chicago/Turabian StyleLee, Jiyoung, Seunghyun Jang, Jungbin Lee, Taehan Kim, Seonghan Kim, Jongbum Seo, Ki Hean Kim, and Sejung Yang. 2021. "Multi-Focus Image Fusion Using Focal Area Extraction in a Large Quantity of Microscopic Images" Sensors 21, no. 21: 7371. https://doi.org/10.3390/s21217371
APA StyleLee, J., Jang, S., Lee, J., Kim, T., Kim, S., Seo, J., Kim, K. H., & Yang, S. (2021). Multi-Focus Image Fusion Using Focal Area Extraction in a Large Quantity of Microscopic Images. Sensors, 21(21), 7371. https://doi.org/10.3390/s21217371